course17:process improvement - exinfm.com · supervision, automation, training, teams, waste, and...
TRANSCRIPT
Course 17: ProcessImprovement
Prepared by: Matt H. Evans, CPA, CMA, CFM
Thiscourseprovidesanoverall understandingofhowtoimproveprocesses.Thiscourse is recommended for2hoursofContinuingProfessionalEducation.If youareseekingcredit for taking thiscourse, thenyouneed todownloadanduse the“exe” fileversionof thiscourse.Allcourse filesandsupplementalmaterialsarepostedon theinternetatwww.exinfm.com/training
Excellence in Financial Management

2
Some Good Starting PointsEverything everyone does within an organization is part of a process. So invariably if youwant to improve what the organization does, then you have to focus on improving theprocess. By putting your emphasis on the process, you avoid the typical trap that somany business leaders seem to fall prey to – looking to cut costs, they focus on trimmingpayrolls or pushing people to do more with less. This short-sided approach may get abrief bump in performance. However, in the long-run you end up increasing costs,reducing value to the customer, and making it harder for the company to compete.
Process improvement is a long-term approach to improving organizational performancewith substantially less risks of destroying value when compared to short-termapproaches. This short course will outline many of the concepts and tools people use toimprove processes. The word “quality” will be used a lot since we will learn thatvariations are the opposite of quality and by reducing variation (improving quality), wecan embark on the road to continuously improving a process.
Process efficiency, especially in the name of quality, has been around for a long time.For example, back in 1950 W. Edwards Deming spoke before Japanese businessleaders, outlining a roadmap for total quality management. Deming’s roadmap consistedof fourteen key points:
1. Create a constancy of purpose so that you are continuously improving yourprocesses. This requires defining both short term and long term problems,allocating resources appropriately, and working to improve product and servicedesign.
2. Adopt a new philosophy of quality management, constant learning, embracingchange and focus on the customer.
3. Cease dependence on inspection as a means for ensuring quality. Instead, placemuch more reliance on statistical tools for assessing quality.
4. Don’t award simply on lowest price. Change your focus from lowest initial coststo lowest overall costs in the long run, incorporating quality, sole source,relationships, and other factors.
5. Search continuously to improve processes. Become innovative and look at theoverall process flow or system in terms of design, inputs, materials, maintenance,supervision, automation, training, teams, waste, and other areas that generateinnovation.
6. Invest in great training to keep your people productive and innovative. New skillsbring about improvements. Therefore, you must fuel this process by empoweringyour people to do their best.
7. Institute leadership that goes beyond the numbers and instead, puts anemphasis on supporting and making sure people can execute. Leadership mustbe able to discern what’s important and what’s not to optimize how resources areapplied.
Chapter
1
Two Important Pioneers

3
8. Drive out fear and encourage people to participate and openly pursue neededimprovements and change.
9. Break down the barriers with workers, suppliers, and everyone involved in theprocess. Promote communication across all players.
10. Eliminate slogans, exhortations, and targets that tend to be divisive and counter-productive to one group of players within the process.
11. Avoid numerical quotas since they impede quality, increase waste, anddiscourage productivity.
12. Allow pride of workmanship and do away with the traditional approaches ofannual performance appraisals and management by objectives. Evaluate andreward performance in relation to quality.
13. Institute educational programs and self-improvement for life long learning andteam building.
14. Make sure Senior Management is committed to improving quality andproductivity. This may require changing the organizational structure and puttingan Action Plan in place for the 13 other points.
Needless to say the Japanese took Deming very seriously, producing high qualityproducts and capturing global markets for their products. So it is very clear that Demingwas well ahead of his time and many of his principles are now widely practicedthroughout the world.
A second pioneer behind the quality management movement is Joseph M. Juran. Juran,like Deming, advocated strong participation by everyone touched by the process.However, Juran took this concept one step further by including the customer. Juranargued that quality must be linked to the customer. Juran documented his principles in alandmark book, Quality Control Handbook, in which he put heavy emphasis onunderstanding and measuring the customer. Here is a list of Juran’s ten step process:
1. Identify your customers2. Seek out and define their needs3. Translate customer needs into your business language and requirements4. Establish units of measure5. Define appropriate performance measurements6. Develop products and services7. Optimize product and service design8. Develop production processes9. Optimize processes / fully capable10. Transfer into operations
For those wanting to learn how to improve a process, W. Edwards Deming and JosephM. Duran are two of the best sources.
“Production technique is pretty much a level playing field. Anyone can purchaseidentical equipment and facilities, hire and train qualified people, and purchaseraw materials required to make a product. There are certain steps required tomake a particular product and everyone does them the same way. The differenceappears to be in the manufacturing technique – how we manage and balancepeople, materials, and machines.”
– Lean Manufacturing that Works by Bill Carreira
4
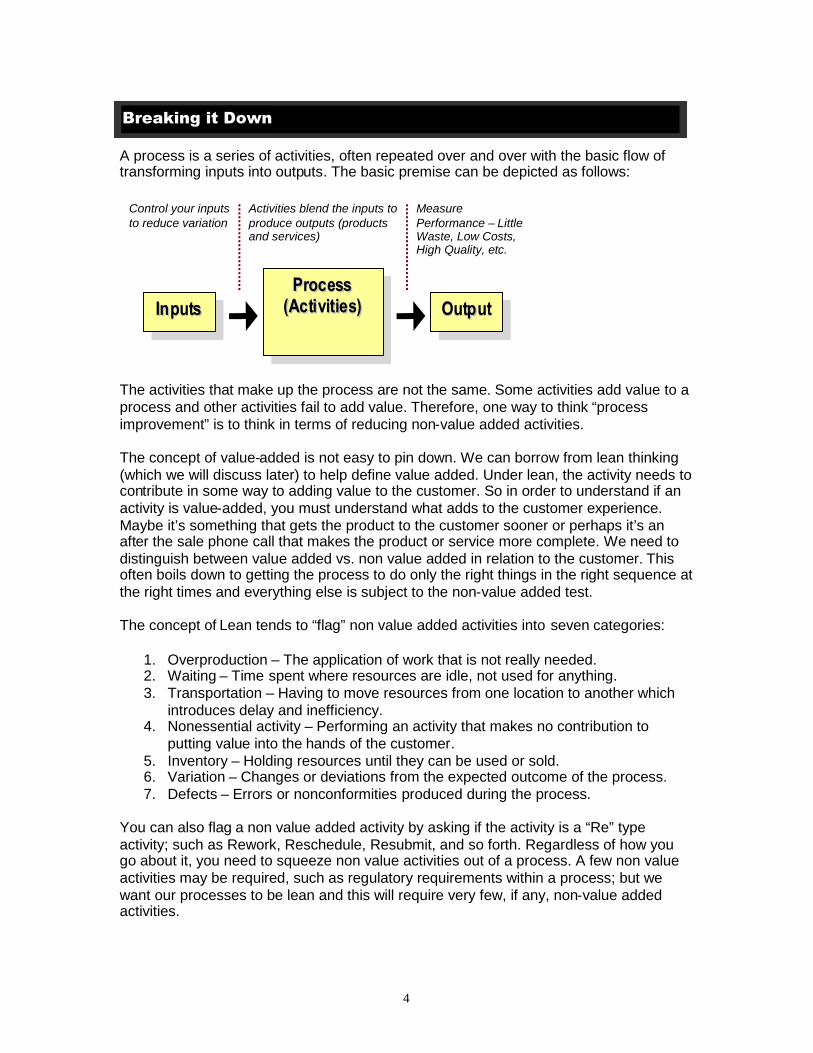
A process is a series of activities, often repeated over and over with the basic flow oftransforming inputs into outputs. The basic premise can be depicted as follows:
The activities that make up the process are not the same. Some activities add value to aprocess and other activities fail to add value. Therefore, one way to think “processimprovement” is to think in terms of reducing non-value added activities.
The concept of value-added is not easy to pin down. We can borrow from lean thinking(which we will discuss later) to help define value added. Under lean, the activity needs tocontribute in some way to adding value to the customer. So in order to understand if anactivity is value-added, you must understand what adds to the customer experience.Maybe it’s something that gets the product to the customer sooner or perhaps it’s anafter the sale phone call that makes the product or service more complete. We need todistinguish between value added vs. non value added in relation to the customer. Thisoften boils down to getting the process to do only the right things in the right sequence atthe right times and everything else is subject to the non-value added test.
The concept of Lean tends to “flag” non value added activities into seven categories:
1. Overproduction – The application of work that is not really needed.2. Waiting – Time spent where resources are idle, not used for anything.3. Transportation – Having to move resources from one location to another which
introduces delay and inefficiency.4. Nonessential activity – Performing an activity that makes no contribution to
putting value into the hands of the customer.5. Inventory – Holding resources until they can be used or sold.6. Variation – Changes or deviations from the expected outcome of the process.7. Defects – Errors or nonconformities produced during the process.
You can also flag a non value added activity by asking if the activity is a “Re” typeactivity; such as Rework, Reschedule, Resubmit, and so forth. Regardless of how yougo about it, you need to squeeze non value activities out of a process. A few non valueactivities may be required, such as regulatory requirements within a process; but wewant our processes to be lean and this will require very few, if any, non-value addedactivities.
IInnppuuttssPPrroocceessss
((AAccttiivviitt iieess)) OOuuttppuuttss
Control your inputsto reduce variation
Activities blend the inputs toproduce outputs (productsand services)
MeasurePerformance – LittleWaste, Low Costs,High Quality, etc.
Breaking it Down

One of the more common practices for improving a process is to reduce the handoffs ortransfers that take place. This is usually accomplished by first understanding andmapping out the process using a flowchart. Once the process is mapped out, the trick isto compress the handoffs out of the flowchart, streamlining and making the processmore efficient.
For example, large bureaucratic organizations transfer information, products, and otheroutputs between functions, departments, divisions, and other hierarchies that injecthandoffs along the way. With each handoff, there is delay involved, not to mention theintroduction of errors. Consolidating these activities around the process flow can helpreduce cycle times and lower the resources consumed (costs).
The following example highlights the difference between organizing around functions vs.organizing around the processes:
Compress the Handoffs
5
Many organizations recognize certain practices as part of improving a process. Here aresome examples:
Technology – The use of technology is often an enabler for improving aprocess. This is particularly important when it comes to innovation or rapidtransformation of a process, commonly referred to as Business ProcessRedesign (BPR). For example, the use of Radio Frequency Identification orRFID’s to track inventory items is transforming how company’s manage highvalue items moving through the supply chain. Technology can often helpimprove the efficiency or effectiveness of a process by introducing innovativeapproaches for doing things differently.
Outsourcing – Non core processes where control by the organization is notcritical are sometimes outsourced. Outsourcing relies on outside expertise totake control over some non-core function, especially functions that areredundant and generic in nature. Outsourcing can quickly eliminateunnecessary activities, lower overall costs, and introduce better ways of how
Fundamental Principles

6
things should get done. There are some downsides to outsourcing, such as lossof control, initial costs of changeover, and possible loss of jobs to those whosepositions have been outsourced.
Benchmarking and Best Practices – One of the fastest ways to gain insightsinto how to improve a process is to benchmark your performance in relation tobest in class practices. You instantly see real world examples that highlight yourstrengths and weaknesses in relation to your peers. Many best practices cutacross companies and industries, such as web enabled processes to servicecustomers or procurement cards for consolidating payable processing.Additionally, best practices are often not overly complicated, such as formingteams for project based work or using an intranet web site for knowledgesharing.
Supply Chains – For many organizations, the supply chain is at the core ofmajor processes and since supply chains involve lots of movement andcomplexity, they invariably are ripe for process improvement. For example,most supply chains move things from one point to another and anytime youmove something, it ends up sitting around waiting for the next activity to kick-in.Another problem is a fixation with lowest costs suppliers. There is much more tothe value equation than simply price. Consequently, many supply chains arevery poorly managed.
One of the universal principles for a sustained approach to improving a process is tomeasure the process. And once you measure the process, you now have an opportunityto get control over the process. Measurement and control is particularly important whereorganizations want to continuously pursue process improvement in a very rigorous way.
Process measurement typically takes three forms:
1. Quality – Measuring a process in relation to qualitative characteristics (reliability,appearance, color, weight, length, etc). Examples include: # of Breakdowns, #Service Requests by Product, # of Power Failures, % of Orders Rejected, # ofInvoices Disputed, Write Offs as a % of Sales, etc.
2. Time – Measuring a process in relation to speed, response, turnaround, cycles,etc. Examples include Wait Time in Minutes, Round Trip Hours, Cycle Time, etc.
3. Productivity – Measuring a process in relation to actual outputs vs. what youdesire in terms of outputs. Examples include % of orders shipped within 3 days,% of invoices entered within 24 hours, # of customers serviced, # of claimsprocessed, % requests sent the same day, etc.
Measurement and Control
“Supply chains are as old as commerce, but the opportunities they now presentare without precedent. Modern manufacturing has driven so much time and costout of the production process that there is only one place left to turn forcompetitive advantage. As business engineering guru Michael Hammer recentlyput it in his new book, The Agenda, the supply chain is the last untapped vein ofbusiness gold.”
– Supply Chains: A Manager’s Guide by David A. Taylor, Ph.D.

7
You can also think in terms of efficiency and effectiveness when it comes tounderstanding what should get measured. Listed below is a rating scale regardingprocess efficiency and effectiveness:
Scale Process Efficiency Process EffectivenessWorld Class Error Free, very short cycle
times, no wasteOutputs exceed all customerrequirements
Excellent Very little waste, good cycletimes, costs are low
Outputs meet all customerrequirements
Good Fairly efficient process, stillhas room for improvement
Outputs meet mostcustomer requirements
Poor Process is inefficient, needsto improve
Outputs meet somecustomer requirements
Broken Major problems, long cycletimes, high costs
Outputs not meeting basiccustomer needs
Once you know what to measure, the next step is control. Control often takes the form ofa control chart. If you took statistics, you should remember something called the NormalDistribution curve:
Now flip the curve sideways and extend it out over measurable intervals. The upper andlower control limits define variation from the mean (average). This is the basic structureof a control chart for monitoring variation, sometimes described as Statistical ProcessControl (SPC).

8
We can take this one step further by experimenting with our inputs whereby we carefullyalter or change the input variables to see how it changes the process and final outputs.This is one of the most common techniques for continuously improving a process –Design of Experiments (DOE). We will dig deeper into these statistical concepts (SPCand DOE) when we explore Six Sigma.
Some organizations use formal programs for making process improvement happen. Twonotable examples are the Malcolm Baldrige National Quality Award and ISO(International Organization for Standardization) 9000 Registration.
The Malcolm Baldrige Program was established to promote quality management andperformance excellence for businesses in the United States. Malcolm Baldrige requiresa business to focus on the following areas, totaling up to 1,000 points:
1 Leadership (125 points)1.1 Organizational Leadership (85)1.2 Public Responsibility & Citizenship (40)
2 Strategic Planning (85)2.1 Strategy Development (40)2.2 Strategy Deployment (45)
3 Customer and Market Focus (85)3.1 Customer & Market Knowledge (40)3.2 Customer Satisfaction & Relationships (45)
4 Information and Analysis (85)4.1 Measurement of Organizational Performance (40)4.2 Analysis of Organizational Performance (45)
5 Human Resource Focus (85)5.1 Work Systems (35)5.2 Employee Education, Training, and Development (25)5.3 Employee well-being and Satisfaction (25)
6 Process Management (85)6.1 Product and Service Processes (55)6.2 Support Processes (15)6.3 Supplier and Partnering Processes (15)
7 Results (450)7.1 Customer Focused Results (115)7.2 Financial and Market Results (115)7.3 Human Resource Results (80)7.4 Supplier and Partner Results (25)7.5 Organizational Effectiveness Results (115)
Formal Programs

9
From an international perspective, quality control standards have been established bythe International Organization for Standardization (ISO) in Geneva, Switzerland. Thesestandards cover eight management principles:
1. Customer Focus - Organizations depend on their customers and therefore shouldunderstand current and future customer needs, striving to exceed customerexpectations.
2. Leadership - Leaders establish unity of purpose and direction of the organization.They should create and maintain the internal environment in which people canbecome fully involved in achieving the organization's objectives.
3. Involvement of People - People at all levels are the essence of an organizationand their full involvement enables their abilities to be used for the organization'sbenefit.
4. Process Approach – A desired result is achieved more efficiently when activitiesand related resources are managed as a process.
5. System Approach in Management - Identifying, understanding and managinginterrelated processes as a system contributes to the organization's effectivenessand efficiency in achieving its objectives.
6. Continual Improvement – Continual improvement of the organization's overallperformance should be a permanent objective of the organization.
7. Factual Approach to Decision Making – Effective decisions are based on theanalysis of data and information.
8. Mutually Beneficial Supplier Relationships - An organization and its suppliers areinterdependent and a mutually beneficial relationship enhances the ability of bothto create value.
Most ISO standards are very specific to products and services, such as Shipbuilding,Packaging, Mining, and Metallurgy. ISO also has a generic set of standards, grouped bycertain categories: ISO 9000:2000 (vocabulary and definitions), ISO 9001:2000(registration requirements), ISO 9004:2000 (guidelines for improving the qualitymanagement system) and ISO 14000 (environmental management system).
ISO Registration is often considered a pre-requisite for getting certain internationalbusiness. Registration requires documentation of processes followed by a formal reviewconducted by auditors.
Although Baldrige and ISO 9000 are solid frameworks for rapidly putting a qualityprogram together, they sometimes can be more show than substance. For example,some companies spend most of their efforts filling up notebooks with paper,documenting everything and using the right buzz words to satisfy auditors. In reality, itcan be more important to apply the concepts associated with these programs asopposed to jumping through the hoops to win the award. Also, many organizations seemto get more bang for their buck by pursuing process improvement methodologies suchas Six Sigma. Therefore, you should not view programs such as Malcolm Baldrige orISO 9000 as panaceas for process improvement, but instead look to them for conceptsand principles that fit and work within your organization.

10
Fundamental Tools of the Trade
Regardless of how you go about improving a process, you will most likely use one ormore of the following tools:
Analytical Techniques Getting to Solutions Additional ToolsSWOT Analysis Brainstorming Value AnalysisRoot Cause Analysis Storyboarding Solution Rating MatrixPareto Charts Force Field Analysis Trend AnalysisProcess Mapping Issues Analysis Project Management
Therefore, a solid understanding of each of these tools can help almost any processimprovement project. This chapter will highlight each of these tools. And some of thesetools may get applied above or below the process level to get a better understanding ofwhat takes place outside the process layer within the enterprise architecture:
Chapter
2
Functions
Departments
Business Processes
Activities
Tasks
“The problems that afflict modern organizations are not task problems. They areprocess problems. The reason we are slow to deliver results is not that our peopleare performing their individual tasks slowly and inefficiently – We are slowbecause some of our people are performing tasks that need not be done at all toachieve the desired result and because we encounter agonizing delays in gettingthe work from the person who does one task to the person who does the next one.In short, our problems lie not in performance of individual tasks and activities,the units of work, but in the processes, how the units fit together in the whole.”
– Beyond Reengineering by Michael Hammer

11
Where processes are impacted by both internal and external factors, it can be useful toapply SWOT – Strengths, Weaknesses, Opportunities, and Threats. SWOT Analysis is astandard tool used by all types of analyst for identifying major strategic issues. SWOTcan be used at any organizational level – function, department, group, etc. SWOT isdefined as:
- Strength: Any existing or potential resource or capability within the organizationthat provides a competitive advantage in the market.
- Weakness: Any existing or potential internal force that could serve as a barrier tomaintaining or achieving a competitive advantage in the market.
- Opportunity: Any existing or potential force in the external environment that, ifproperly exploited, could provide a competitive advantage.
- Threat: Any existing or potential force in the external environment that couldinhibit the maintenance or attainment of a competitive advantage.
You can also fast track the assessment process by simply doing a simple T list of thepluses and minuses.
Do we install new control devices?Plus (+) Minus (-)
Reduces downtime Initial cost is not budgetedBetter response rates Somewhat difficult to programPart of Risk Plan Requires upkeep and upgrades
Root Cause Analysis is used to clearly understand what’s driving or causing a problem.The key is to identify the factors influencing the effect you are starting with. One way tojump start the analysis is to look at:
4 M’s: Methods, Manpower, Materials, Machinery 4 P’s: Policies, Procedures, People, Plant
Root Cause Analysis is often expressed in the form of a fishbone diagram. The steps fordoing the diagram are:
1. Specify the effect to be analyzed. The effect can be positive (objectives) ornegative (problems). Place it in a box on the right side of the diagram.
SWOT Analysis
Root Cause Analysis
TheProblem,
Objective,Goal, etc.

12
2. List the major categories of the factors that influence the effect being studied.Use the “4 Ms” (methods, manpower, materials, machinery) or the “4 Ps”(policies, procedures, people, plant) as a starting point.
3. Identify factors and sub factors. Use an idea-generating technique to identifythe factors and sub factors within each major category. An easy way to beginis to use the major categories as a catalyst. For example, “What policies arecausing…?”
4. Identify significant factors. Look for factors that appear repeatedly and listthem. Also, list those factors that have a significant effect, based on the dataavailable.
5. Prioritize your list of causes. Keep in mind that the location of a cause in yourdiagram is not an indicator of its importance. A sub factor may be the rootcause to all of your problems. You may also decide to collect more data on afactor that had not been previously identified.
A less formal approach to root cause analysis is to simply use the Five Whys technique.With each reiteration of why (say five times), you pull out additional information thatpossibly helps you identify the root cause of a problem.
What procedures are causing…? How does our equipment affect…?
What regulations affect…?How do our people influence…?
Manpower, Personnel,Staffing, etc.
Materials, Policies,Regulations, etc.
Methods, Procedures,Specifications, etc.
Machines, Plant,Equipment, etc.
TheProblem,
Objective,Goal, etc.
Personnel, Staffing, etc.
Methods, Procedures, Specifications, etc. Machines, Plant, Equipment, etc.
Materials, Policies, Regulations, etc.
TheProblem,
Objective,Goal, etc.

13
In order to focus on significant problems, you can rank the importance in descendingorder of occurrence. This is typically done using the Pareto Chart. In order to chartproblems, you must:
1. Identify the problems that need to be ranked.2. Use a standard measurement for ranking, such as frequency, costs, etc.3. Determine the time frame for evaluating the problems.4. Collect the data from existing reports or use new data.5. Label the units of measure on the left vertical axis and label the problem areas
on the horizontal axis.6. Plot the data, showing the descending order from left to right.
45
25
15
10
5
0
5
10
15
20
25
30
35
40
45
50
Issue 1 Issue 2 Issue 3 Issue 4 Issue5
Process Mapping is regularly used to depict the flow of major activities within a process.Process maps range from simple block diagrams to more elaborate swim type diagramsshowing the “swimming” flows to and from major functional or organizational units thatplay a role within the process.
In order to flowchart or map a process, you will need to understand the activities, whattriggers the activity (inputs), who is involved, the sequential steps, and the outputsassociated with the steps. This will require interviewing people assigned to doing theactivities. You will also need to examine documents, such as desk procedures, work flowdiagrams, and other documents that help describe how the process works.
Process maps allow you to see the big picture, clarifying sub-processes, sequences, andactivities. Process maps should be prepared showing critical information flows anddifferent players involved. Where possible, it is useful to document cycle times indifferent steps; especially wait times. Once completed, you can use the process map toanswer certain critical questions:
Process Mapping
Pareto Chart

14
1. Can we eliminate or reduce certain activities?2. Can we complete the process in less time by changing the process?3. Can we improve how we meet customer requirements by changing the process?
Finally, if you are unsure what processes to map, start with those processes that havehigh impact in terms of costs, time, resources consumed or waste. Core processes aresometimes easier to map due to existing documentation and easy access to the internalplayers as opposed to external players.
Brainstorming is used to generate ideas without any real regard for the merit of theideas. You can evaluate the ideas after the brainstorming session is over. Here aresome basic guidelines to follow:
1. Start with a clear definition of what it is you are trying to solve.2. Make sure everyone understands the problem or issue.3. Write down all ideas and don’t judge anything submitted.4. Give everyone a chance to participate and express opinions.5. Try not to be too formal, but impose some structure to ensure the brainstorming
session is productive.6. Don’t get discouraged if the brainstorming session starts off slow – the best ideas
usually get generated at the end of the session.7. Try to write down all ideas exactly as they are submitted by participants.8. Make sure you have a broad mix of people in the brainstorming session –
process owners, customers, vendors, subject matter experts, etc.
Brainstorming

15
One of the biggest misconceptions about brainstorming has to do with groupbrainstorming. Some of the best ideas come out of individual brainstorming where eachindividual has time to think about the problem and submit comments separately. It’s alsouseful to have a “culture” that nourishes ideas. This provides a natural environment forhighly productive brainstorming.
Storyboarding is a visual approach to brainstorming. Like brainstorming, it attempts toorganize multiple ideas and concepts. Unlike brainstorming, it tends to be lessstructured, allowing for more open participation by anyone who can help get the group toa common idea. Storyboarding will also require that you group and categorize ideassince you want to visually show how things work. For example, you might show initialevents or activities off to the upper left on a large white board and then work your waydown, visually showing how things flow downward.
To make sure you can storyboard, you’ll need large white boards or butcher paper aswell as markers, cards, and other supplies to help illustrate your concept. Use differentcolors to group and organize common elements. You can take a digital photo of theoutput and refer back to it for later development.
Force field analysis is used to visually show relationships that help or hinder a solution toa problem. Force field analysis provides a quick list of factors that influence yourobjective. Here are the basic steps:
1. Define the problem or objective that you are analyzing.2. List the forces that impact or influence your problem. Use an idea generating
technique like brainstorming.3. Assign weights or priorities to each force on your list. Place heavier weights on
those forces that have the highest impact.4. Manage based on the list – try to reduce the negative forces and maximize the
positive forces to solve the problem.
Focus your efforts on those forces that are easy to implement and yet at the same time,they produce high results. Listed below is an example of how force field analysis is usedto help someone stop smoking:
Storyboarding
Force Field Analysis
“A process cannot be changed unless all the supporting elements are changed aswell. Therefore an essential early step of a reengineering effort is to clearlyidentify and quantify all of the resources in a corporation that are dedicated toeach specific process.”
– The Reengineering Handbook by Raymond L. Manganelli and Mark M. Klein

16
Promoting Forces Inhibiting Forces
Better health Habitual behavior
Save money Need for nicotine
Won’t have to leave Need to have fingersbuilding every half hour occupied
Family won’t breathe Need to have somethingsmoke in mouth
Food will taste better Gain weight every timeI try to quit
One of the most important techniques for improving a process is to make a distinctionbetween value added and non value added activities. Value analysis summarizes allactivities between value added and non value added. This distinction is made as follows:
Value Added Activities Non Value Added ActivitiesNecessary to meet customer requirements If eliminated, would not impact the product or
service to the customerHelps or assists in the production of theproduct or service
Creates waste, extra time, rework
Represents an output that the customer iswilling to pay for
Performed because the output failed to meetcustomer requirements
Critical to making sure the process works Is preformed because of inefficiency elsewherewithin the process
Improves quality or resolves problems thatimpacts customer satisfaction
Represents a duplicative effort or addsunnecessary steps to the process
In order to organize your analysis, construct a table with three columns – listingyour activities in column 1, denoting the activity as Value Added or Non-ValueAdded in column 2 and a description or comment on why the activity wasclassified as Value Added or Non-Value Added in column 3. If possible, try toestimate the costs of each activity so you can prioritize your analysis for furtheraction. The goal is to optimize the value-added activities so they are lean andreduce or eliminate the non-value added activities. Listed below is an examplefor a Receiving Department:
Activity V or NV Value $ Non-Value $ TotalAccept Material V $293,578 $293,578Distribute Material NV $302,845 $302.845Manage Material NV $183,342 $183,342Perform Personnel Duties V $139,578 $139,578Perform Admin Duties V $ 54,733 $ 54,733TOTAL $487,889 $486,187 $974,076
50% 50% 100%
Value Analysis

17
It is often useful to break a problem down into components. Issue analysis is used todefine the elements of a problem and show these elements in some logical way. This isoften accomplished by using an issue tree:
Obtaining cooperatebenefits thoughshared service
center by...
Increasing economies of scalein the accounting function
Increasingefficiency in theaccounting dept.
by...
Increasing theeffectiveness in the
accounting dept.by...
Improving the use oftechnology
Increasing standardizationand coordination of activities
Improving the work process
Improving the control
Improving the work process
Increasing the possibilities forspecialization and better
utilization of competencies
Creating more time formanagement to focus on
analyses and strategicactivities
Sharing information and IT-resources between dept.s
•Reduced need fortraining
•Increased qualityof the financialinformation
You can use the issue tree to show sub-processes at different levels with the process oractivity above flowing into the lower one. Some key points to consider:
Use the Issue Tree to guide you into underlying root causes. Look for duplication between the activities within the Issue Tree. Validate relationships between problem components by involving process
owners and other stakeholders.
The solution rating matrix is a process for weighing all the possible solutions against apredetermined set of criteria or rules. Examples of criteria or rules for weighting include:
Ease of implementation Effectiveness of solution Probability of success Resistance to solution Cost
Issues Analysis
Solutions Rating Matrix

18
Make sure your weights total up to 100%. Now organize your solutions into a matrix andrate each solution on a scale from 1 to 10. Finally, you can multiply the rating scores bythe weighting percentages to arrive at the total score. Listed below is a simple exampleof a solutions matrix for deciding which automobile you should purchase. Based on fivecriteria, Car “B” is the selected choice:
Solution Rating Matrix(10 = High, 1 = Low)
SolutionsFive Criteria Weight Car “A” Car “B” Car “C”
Functionality 40% 3 1.2 7 2.8 9 3.6Initial Cost 30% 9 2.7 8 2.4 5 1.5Maintenance Cost 20% 8 1.6 7 1.4 5 1.0Quality 5% 10 .5 7 .35 3 .15Size 5% 5 .25 7 .35 1 .05TOTAL POINTS 100% 6.25 7.3 6.3
One of the basic tools in evaluating a process is to look at trends. Most trends arereported in a time series graph. This allows a comparison, prompting action onunfavorable trends and recognizing the need to adjust targets on constant favorabletrends. The basic steps for trend analysis are:
1. Select a specific process, sub-process or activity with outputs.2. Collect the measurement data on the outputs over consistent time intervals.3. Monitor performance and see if you need to adjust the process, sub-process, or
activity to change performance.
A few tips to consider when doing trend analysis:
The best outputs or measurements are usually linked to customer needs. Collect your measurements at good time intervals that facilitate the right degree
of management control. Measurements that are too late are useless tomanagers. Constantly measuring the same things over and over with nocorresponding action is also useless.
Simple Example of Trend Line Analysis
Trend Analysis
Last Year
Actual
Budget

19
Much of the work that goes behind improving a process has to do with good projectmanagement practices. Larger type initiatives take the form of a formal project,especially Six Sigma type projects. Therefore, sound project management practices areextremely important for major process improvement projects. Here are some importantconcepts to consider:
Define your scope for improving a project by breaking the scope down intoworkable elements that you can manage. This is usually accomplished in theform of a Work Breakdown Structure, allowing you to delegate activities andtasks to other team members. You need this structure for managing all of thecomponents that make up the project.
Develop a work schedule for major milestones throughout the expected life cycleof the project. This work schedule should include your expected costs as well asanticipated start and completion dates.
Where the stakes and costs are high, consider including a risk management planas part of how you manage the project. The Risk Plan should address the “whatif” situations that may arise during the course of the project.
Another useful plan to include is a quality assurance plan. You need to havecontrol checks in place to make sure things are getting done right.
Although it can be somewhat subjective, many executives will probably wantsome form of cost benefit analysis, showing the Return on Investment for theproject. It’s also useful to include a Net Present Value in your business case forthe project.
After you complete the project, you need to conduct a post implementation audit,determining if the project met its original objective and goals. You also want toflush out lessons learned for executing future projects.
NOTE: Short Course 19 provides much more in-depth coverage on projectmanagement, including information on how to build a detail project plan and measureproject performance.
Project Management

Capability Maturity Model (CMM)
For larger organizations, it might be useful to view all processes from a singleorganizational context. One of the best frameworks for doing this is called the CapabilityMaturity Model or CMM. The concept of CMM was developed through the SoftwareEngineering Institute or SEI. SEI was created by the Department of Defense to reducefailures with software application projects. Therefore, CMM is rooted in softwaredevelopment processes. However, the concepts associated with CMM can be useful forall types of process improvement projects since CMM provides a framework regardingprocess maturity.
One of the great advantages of using the CMM approach is that it “positions” theorganization for process improvement on an enterprise-wide basis. This can beimportant since you ultimately want all parts of the organization working together or atleast progressing to the same level of maturity. For example, an organization may not beready for major change or transformation of its processes. By applying CMM, yousuperimpose an overall discipline across the entire organization – similar to physicalworkouts for a sports team where everyone runs through the same drills. This gets theentire team in shape so that everyone can execute on the field.
Chapter
3
20
CMM looks at the maturity of your business processes in terms of five levels:
Level 1 – Initial: For organizations just starting out, processes are not well establishedand defined. There is deep fragmentation across the organization – one area does it oneway and another unit is following a different process for getting the same thing done.There is poor integration and alignment across functional areas by process. Things getdone through individual effort as opposed to a standard process.
Level 2 – Repeatable: A basic level of process management where you can apply aprocess to various units within the organization. You start to plan as opposed to react byusing certain management controls.
Level 3 – Define: Now that you have processes that you can repeat across theorganization, you can define them and apply them across the organization usingstandards of performance.
Level 4 – Manage: Given standard performance baselines, you can now measure,benchmark and evaluate your performance.
Level 5 – Optimize: This is the final phase where you get your processes lean andoperating at peak performance. The organization is now ready for applying Six Sigmasince the workload data required to use Six Sigma has been established in Level 4.
Five Levels of Maturity

21
As organizations move from a lower level to an upper level within CMM, processcapabilities increase and this in turn improves process performance. The initialobservation by pioneers of CMM, such as Watts Humphrey of IBM, was that the qualityof software products was very much related to the quality of processes. Additionally, theability to predict results goes up with increased maturity and when you increase yourpredictability, you lower your risks.
Under CMM, all organizations default to Level 1 where there is inconsistentmanagement of processes. For larger type organization, the management approachtends to change with each successive level:
Level 2 – Managing projects to get things doneLevel 3 – Managing processes to get things doneLevel 4 – Managing capabilities to grow the organizationLevel 5 – Managing change to continuously improve
In order to move past Level 1 under CMM, you will need to define Key Process Areas.Key Process Areas (KPA) represent a cluster of activities that when grouped togethershare a common final outcome critical to organizational success. Once you define eachKPA, you need to establish performance goals or objectives for each KPA. CMMtypically assigns two to four goals per KPA. Understanding the intent of a KPA is usuallya good basis for defining a performance goal; i.e. is the organization effective (such ascustomer satisfaction) and efficient (such as cycle times) at meeting the goal of theKPA?
Since each CMM Level has its own KPA’s, the challenge is to meet the two to fourperformance goals of each KPA in your current level. Therefore, you need to have wellestablished KPA’s in one level before you get to the next level. One the best ways tobuild this KPA maturity structure is to think in terms of managing for defined outcomesalong the way. For example, suppose you just opened a pizza restaurant. To producepizza’s, you need key process areas (KPA’s) that make pizza dough, add freshingredients, and bake the pizza. These are the basic “repeatable” key process areas orissues you must have for level 2 of your pizza restaurant. Now let’s move up to level 3 –Clearly defined processes may involve more mature processes, such as getting the rightkind of ingredients and mix to make good consistent dough. At level 3, we might have aKPA related to making sure our cooks follow a standard recipe each time they preparethe pizza dough. Our processes are now better defined after meeting certain KPA’s forLevel 3. We can now “manage” the processes at Level 4 – things like faster delivery ofpizza’s or giving our customers more choices of how they want their pizzas. We nowstart to do a lot more measuring of final desired outcomes – customers like our pizza’sand our processes are now mature enough that we can expand opening another pizzarestaurant. At level 4, our processes are highly predictable using best practices and weknow exactly how to make great pizza’s every time. At level 5, we work to tweak andoptimize how we make our pizzas. Perhaps each time a pizza is baked in the oven, thecrust comes out slightly different. Level 5 looks for defects using very analytical tools andattempts to remove these defects from our processes. For example, maybe we can usea special texture probe to test our pizzas for inconsistent crust. Next we look at thevariables that create inconsistent crust. This might include baking times, oven
Key Process Areas – Improvement Domains for CMM

conditions, and the mix of ingredients. We need to analyze what’s causing theinconsistent pizza crust. Once we identify the cause, we will change this input variableand see how it impacts our pizza crust. Level 5 is continuous – analyzing defects,identifying sources and using this knowledge to prevent defects in all of our processesacross the entire organization.
Since key process areas at Level 1 are not defined, getting to level 2 is often the bighurdle in moving through CMM. To get to Level 2, an organization needs to haveprocesses that begin to experience repeatable success and likewise, you begin toremove your failures. Processes are not expected to be highly efficient and effective atLevel 2, but you do want to have a series of processes to produce outputs (such aspizzas in our pizza restaurant). Level 2 represents the baseline of core processes andfrom this baseline we can begin to improve how we do things. It is at level 2 where theorganization becomes aware of the need to improve and thus, level 2 is sometimescalled the “learning level” of CMM. This is where process improvement begins to kick-inand this is why getting to level 2 is so important.
According to Motorola, an organization that moves from CMM Level 2 to 5 willexperience an eightfold reduction in defects, an eightfold improvement in cycletimes, and a threefold increase in productivity.
The Baseline for Improvement Begins at Level 2
22
One of the fastest growing maturity models is Capability Maturity Model Integration orCMMI. The issue of integration is a major hurdle in getting processes to work. Typically,processes are defined around functions or departments. The big issue is gettingprocesses to work across all functions and departments. CMMI takes a “systems” viewof things; i.e. organize and build around a system to integrate your processes and thiswill produce the best possible service or products for your customers.
The five levels of CMMI are very similar to the original CMM:
1: Performed – Process is unpredictable, poorly controlled, and reactive. 2: Managed – Process characterized for projects, and is often reactive 3: Defined – Process is characterized for the organization, and is proactive 4: Quantitatively Managed – Process is measured and controlled 5: Optimizing – Focus is on continuous process improvement
In order to take a systems approach, CMMI tends to focus on process infrastructure andmost KPA’s are focused on five areas: Goals, Commitment, Ability, Measurement, andVerification. Finally, CMMI follows a life cycle approach to process improvement, knownas IDEAL:
CMMI

23
I – Initiate: Establish the groundwork for enabling process improvement. This includesmaking the business case for process improvement and securing key sponsorship tomake process improvement happen.
D – Diagnose: Determine where you are relative to where you want to be. Thissometimes takes the form of a concept paper, outlining the current organizational state,the desired future organizational state and recommendations for moving forward.
E – Establish: Quantify the specifics of how you will reach your destination, including awork plan for process improvement that includes which areas should get the highestpriority.
A – Act: Doing the work per your process improvement plans, such as development ofsolutions, testing your solutions, and putting final solutions into production.
L – Learn: Improve your ability to manage the future based on what is taking place nowand what was originally planned. This requires that you look back at your processimprovement efforts and make adjustments going forward.
Organizations often seek formal certification of CMM Levels, somewhat similar to howMalcolm Baldrige and ISO 9000 work. As a result, CMM may encounter the same fallacyof Baldrige and ISO 9000 – organizations are too busy trying to satisfy the “certification”requirements, but in reality the organization has not improved its processes.
Like Baldrige and ISO 9000, CMM should be more about producing real measurableresults and not satisfying pre-conceived requirements that may or may not fit theorganization. Consequently, all organizations should look to CMM as a broad frameworkto assist with process improvement and not lose sight of what you are really trying toaccomplish – things like higher customer satisfaction, increased productivity from endusers, less time and costs to perform activities that comprise a process, and expandedorganizational capabilities.
CMM Reality Check

Six SigmaProbably the most popular approach to process improvement is Six Sigma. Since thisshort course is very limited in scope, we cannot address all of the Six Sigma tools andtechniques, but will highlight the basic concepts behind Six Sigma. As we discussedearlier, we want to reduce variation (improve quality) to continuously improve ourprocesses. Six Sigma provides a methodology for getting to the root cause of variationand reducing it. Despite what some might say, Six Sigma is not about forcing you toobtain perfection at any costs. It’s more about giving you a wide range of tools, appliedin a discipline way for improving a process on a project by project basis. When applied tothe right kinds of projects, Six Sigma can yield significant results.
Chapter
4
Six Sigma is executed through projects and since Six Sigma is very precise, it’s oftenbetter to start with smaller projects that have limited scope as opposed to large,organizational wide projects that are too difficult to manage. Additionally, projects needto have some justification behind being selected. So in the world of Six Sigma, it is verycommon to see a series of toll-gates or a formal business case to justify the project. Forexample, projects will consume resources and time. There needs to be a clear payoff orreturn for doing the project. Additionally, it is useful to clearly define the expected impactof projects and match these impacts against critical issues confronting the organization.For example, a high level of customer complaints or product returns is a critical issuethat might be ripe for a Six Sigma type project.
Project Selection
24
The life cycle of six sigma work consists of five phases:
1. Define Opportunities: What must we do to meet VOC – Voice of the Customer. Inthis phase, you must clearly identify your customers and analyze customerrelated information, translating this into Critical to Quality (CTQ). CTQ’s arerequirements that your processes must perform up to if you expect to meetcustomer expectations. Once you understand this, then you can initiate six sigmaprojects to address the specific performance issues.
2. Measure Performance: How much variation is taking place in our processes? Inthis phase, you will measure your variation in relation to an acceptable level ofperformance or specification limit. This is driven by the characteristics of yourCTQ. Certain statistical tools are used, such as sampling, frequency distribution,and control charts.
3. Analyze Opportunities: What are the root causes behind this variation? In thisphase, you identify the sources of variation. A good place to start is with a non-statistical tool: Root Cause Analysis, including the Five Whys. Then you canbegin to use certain statistical tools, such as Analysis of Variance, to betterunderstand the sources of process variation.
Five Phases - DMAIC

25
4. Improve Performance: What can we do to reduce this variation? The vital few orroot sources of variation are now identified. One of the more popular tools usedfor improvement is called Design of Experiments (DOE).
5. Control Performance: How can we design the process so that we never cross theUpper or Lower Control Limits? This is where you sustain your desiredperformance levels and where practical, seek to improve it by removing morevariation from the process.
Common Tools Used by Project Phase on Six Sigma ProjectsDefine Measure Analyze Improve Control
Voice of Customer Measurement ofInputs, Process,and Outputs
Root CauseAnalysis
Risk Analysis -FMEA
Statistical ProcessControl (SPC)
Process Mapping(as is process)
MeasureFrequencyDistribution
Analysis ofVariance (ANOVA)
Proto-type testing Design for SixSigma (DFSS)
ProjectManagement
Check Sheets Affinity Diagrams Solutions Matrix ChangeManagementProcess
Brainstorming Control Charts RegressionAnalysis
Design ofExperiments(DOE)
StandardOperatingProcedures (SOP)
Sigma is a statistical measure of process capability in relation to how much deviationtakes place in the population of data. It measures the variability of the data. For everyopportunity, there is a chance we might have a defect. This is typically expressed asDefects per Million Opportunities or DPMO. Defects represent the failure to meetcustomer requirements. The higher the sigma, the more process outputs are able tomeet customer requirements given fewer defects. The following DPMO scale is used toexpress the different sigma levels:
SigmaValue
DPMO % Defects Cost of Poor Quality *
1 691,462 69% > 40% of Sales2 308,537 31% 30-40% of Sales3 66,807 6.7% 20-30% of Sales4 6,210 .62% 15-20% of Sales5 233 .023% 10-15% of Sales6 3.4 .00034% < 10% of Sales
* per Allied Signal
For various processes, we set targets which we will call “critical to” such as Critical toQuality (CTQ). This might be making pizzas in our pizza restaurant that are produced in8 minutes. Each time we bake a pizza, there is some variation from this target of 8minutes. If we plot each of these bake times, we can show the distribution on a graph.Additionally, our customers are willing to accept pizzas baked in 10 minutes, but likewiseit takes us at least 6 minutes to put all the ingredients together for baking the pizza.These limits represent the Upper Specification Limit (USL) and Lower Specification Limit(LSL) within our distribution. The goal is to “control” what happens within this range and
The Basics

when we bake the pizza at exactly 8 minutes, we have Six Sigma quality – zerodeviation from standard. As we get better and better at our baking process, we start tonarrow the range, USL and LSL, so that the normal distribution curve becomes tighter.This is how we express continuous improvement in the world of Six Sigma.
LSL USL
Poor ProcessCapabilityVery HighProbabilityof Defects
LSL USL
ExcellentProcess
CapabilityVery LowProbabilityof Defects
Very HighProbabilityof Defects
Very LowProbabilityof Defects
26
Critical to Quality is customer driven and so we have to tap into the customer tounderstand our requirements (CTQ). Six Sigma (as well as lean) requires that you arelistening to the Voice of the Customer or VOC. In the world of Six Sigma, you are “in-sync” with VOC when you:
1. Provide a 100% solution to the customer’s problem.2. Minimal effort involved – not wasting the customer’s time and efforts.3. Giving the customer exactly what they need – no compromises.4. Provide the value where the customer wants it.5. Provide the value when the customer wants it.6. Compress the decision making process for the customer – make it easy for the
customer to reach the decision.
This is perhaps one of the biggest reasons why Six Sigma and Lean have become sopopular – the bar has been raised in terms of customer satisfaction. Additionally, anyvariation from the target increases costs. So Six Sigma is not just about improvingquality and lowering costs, but also about customer satisfaction. Finally, there are twodimensions to CTQ – Customer driven CTQ’s coming from our external customers andprocess driven CTQ’s coming from our internal customers.
CTQ and VOC
“There is a parable of the three blind men and the elephant. Each is asked to identify whatthey are touching. The first touches the tusk of the elephant and identifies he is touching aspear. The second touches the torso and claims what he is touching is a wall. The thirdtouches the tail and think it’s a snake. This parable parallels Six Sigma. As its popularityhas grown, different experts have marketed Six Sigma to fit their needs, not necessarilythat of their customers. Of course, Six Sigma includes significant amounts of statisticaltools. But many see Six Sigma as only statistics. They are wrong. Touch part of the workthat constitutes Six Sigma and it will look eerily similar to other quality approaches.Touch another part of Six Sigma and it only vaguely resembles a quality approach at all.”
– Six Sigma Execution by George Eckes

Some Common Sources of Critical to Quality (CTQ):
Six Sigma begins with a simple equation that says – All outcomes are the result of inputsand the process that acts on these inputs may introduce errors. Errors create variationand in the world of Six Sigma, variation is everything. This equation is expressed as:
Y = f (X) + E
Y: Desired outcomef: Activities and Functions that convert inputs to outcomesX: Inputs that are needed to produce the desired outcomeE: Errors
If we go back to our pizza example, we bake pizzas with different outcomes or Y’s.Several different inputs are required before we can bake the pizza – preparing the piecrust (input material), having cooks put all of the ingredients together (input labor) andusing an oven (input equipment) to bake the pizza. All of these inputs are the X’s in ourequation and we must measure these inputs (X’s) to get a profile of how our processperforms in relation to our targeted performance.
The Six Sigma Equation
27
One of the attractions behind Six Sigma has to do with statistics. Statistics removesmuch of the subjectivity that often plagues other forms of analysis. Opinions andspeculation are replaced by applying statistical concepts to data. Some of thesestatistical concepts include:
Statistical Concepts

28
1. Mean and Standard Deviation: Expressing process performance begins with theMean and Standard Deviation. Mean represents the average of your samplevalues; sum of all values divided by the number of observations in your sample.
Standard Deviation is the spread of data around the mean.
Standard Deviation is calculated by going through the following steps:a. Calculate the difference from the mean for each observation.b. Take the square of each difference.c. Sum all of your square values and divide by the number of observations
less 1. NOTE: When calculating the standard deviation for a sample (asopposed to the entire population), the number of observations is reducedby 1. This tends to improve the calculation so that the standard deviationof the sample is as close to the entire population as possible. It is rarethat we will be measuring the entire population.
d. Take the square root of your value from step c (variance). This gives youthe standard deviation.
Let’s go back to our pizza example. Suppose we made 6 observations of howlong it takes to bake pizza. Our upper control limit is 8 minutes; i.e. we don’t wantto take more than 8 minutes to bake pizzas. The results of our six observationsare:
Baking Avg Baking Variance Square theObservation Time Time (Mean) from Mean Variance
1 7.50 7.96 -0.46 0.212 7.75 7.96 -0.21 0.043 8.50 7.96 0.54 0.294 8.25 7.96 0.29 0.095 8.50 7.96 0.54 0.296 7.25 7.96 -0.71 0.50
Total 47.75 1.43
Sum of all baking times / number of observations or 47.75 / 6 = 7.96Variance = 1.43 / 5 or .286Square root of Variance = Standard Deviation of .5342
2. Sigma Value: After calculating the Mean and Standard Deviation, you need toexpress this performance related to CTQ – customer requirements. This is doneby calculating the Sigma Value (sometimes called the Z-Score) which representsthe number of standard deviations from the mean. However, in order for this towork we need a normal distribution of data. So it’s useful to do a histogram andplot your data, observing the curve or frequency distribution of your observations.
3. t test: Since we use samples to represent populations, we will most likely notknow the standard deviation of the population. And when our sample size issmall (less than 30 observations), we can use the t test to help us with ahypothesis test about the characteristics associated with the population.

4. F test: We may want to take samples from different segments of the population,such as sampling only cheese pizzas, then sampling deluxe pizzas to see if thisyields different results. You can use the F test to help understand differences instandard deviations between samples taken from different populations.
5. ANOVA: Used to conduct hypothesis testing when you have two or more groupsof data. Like the t-test, the purpose of ANOVA is to test the equality of the meansbetween the data groups. When you test and analyze only one variable (such asoven temperature in baking our pizzas), this is a One-Way ANOVA. If we testedtwo factors (such as oven temperature and dough texture of pizzas), this wouldbe Two-Way ANOVA. The testing of a combination of factors simultaneously inone test is referred to as a factorial experiment.
29
The number of inputs can be numerous (people, materials, equipment, technology,practices, methods, applications, etc.), making our six sigma equation look like:
Y = f (X1, X2, X3, X4, X5, X6, X7, X8, X9, X10, X11, X12, X13, X14, X15, X16, X17, X18, X19, X20)
What we really need to do is find out which of these inputs (X) is having the mostinfluence on our outcome (Y). By focusing on the “vital few” input variables, we gaincontrol over the process. A series of different controlled experiments will get us to thevital few. Experiments are managed based on:
1. Factors: The possible X’s in our equation2. Levels: The range of values for each factor3. Main Effects: The change in Y from our experiment as we change our factor (X)
from the lowest level to the highest level.
Factors are the independent variable and we want to quantify the impact on Y (responsevariable). In our pizza example, we might include these factors to help us understandvariation in baking pizzas:
Oven Temperature (X1) Dough Texture (X2) Pizza Type (X3) Baking Time (Y)350 Degrees Medium Cheese 7.4 minutes400 Degrees Coarse Pepperoni 11.8 minutes375 Degrees Smooth Cheese 6.2 minutes400 Degrees Medium Cheese 6.8 minutes350 Degrees Coarse Pepperoni 13.1 minutes
Each combination is an equation, contained within a matrix for all factors in ourexperiment. In order to get the most information, a full matrix is needed which containsall possible combinations of factors and levels. If this creates too many experimentalruns, fractions of the matrix can be taken.
Design of Experiments (DOE)
“Probably few people know exactly what is meant by quality. Quality actuallyhas different dimensions, which are all considered by consumers purchasingproducts. Although we as consumers may not know precisely what we mean byquality, we all recognize quality when we see it.”
– The Myths of Japanese Quality by Ray and Cindelyn Eberts

30
The “DMAIC” approach to Six Sigma seeks to improve existing processes. However, thisis only half of the six sigma management process. The other half is to design anddevelop new processes to improve how we meet customer expectations. This is calledDesign for Six Sigma (DFSS). DFSS is used under two circumstances: Existingprocesses cannot be improved or a process to meet CTQ does not exist.
Some of the tools used in DFSS type projects include:
1. Quality Function Deployment (QFD): A methodology for identifying andcategorizing customer requirements into a matrix. The matrix prioritizes customerexpectations on a scale from 1 (least important) to 5 (most important). Cause-effect requirements are also ranked; i.e. what is the correlation between acustomer requirement and customer satisfaction. This is the “roof” matrix that sitson top of the main house matrix. Depending upon your approach, QFD mayinclude several matrixes for capturing important relationships:
2. Failure Mode Effects Analysis (FMEA): Analytical approach directed towardproblem prevention through which every possible failure mode is identified andrisk rated. The basic steps for FMEA are:
a. Identify various failure modes (spoiled materials, labor input mistakes,flawed method, equipment failure, etc.)
b. Identify the effectsc. Determine the impactd. Identify the causese. Determine the probability of occurrencef. Assess current control processes in placeg. Evaluate the ability to detect the failure modeh. Assign a risk rating (A x B x C) relative to:
A: Severity of Impact – On a scale of 1 to 10, rate the seriousness of theeffect from the failure mode with 10 as catastrophic and 1 no impact.
Design for Six Sigma

31
B: Probability of Occurrence – The likelihood that a cause and failuremode will occur with 10 as failure is certain and 1 is highly unlikely.C: Ability to Detect – Rating your ability to detect the failure mode beforeputting the product into production or delivering it to the customer. Arating of 10 indicates that you cannot detect the failure and 1 is where youhave good controls in place to pickup the failure.
i. Take corrective actions on those failure modes with high risk ratings.
The results of your FMEA can be summarized on a worksheet. The followingexample is taken from www.betterproductdesign.net:
3. Poka Yoke: Mistake proofing a product or service. Errors lead to defects and ifyou can catch the errors earlier, then you reduce the defects. Certain workconditions tend to introduce errors: Adjustments, Infrequent Activities, RapidRepetition Involved, and High Volume Loads with Compressed Time Frames.Once you’ve identified the error prone conditions, drill down to the root causesand see if you can design an error proof way of doing the work.
“A very few American companies are counted among the world-class leaders in qualitymanagement. But thousands upon thousands of other companies have yet to take thatall important first step to ensure their products and services deliver to each customer adependable high level of quality. The American economy will either fully integrateitself into new and evolving global markets, or large parts of it are likely to be leftbehind as foreign competitors absorb greater and greater shares of the only market thatreally matters anymore: the global market.”
– Quality in America: How to Implement a Competitive Quality Program by V. Daniel Hunt

32
Lean ThinkingSix Sigma is to variation what Lean is to waste. By removing waste, we make ourprocesses lean – very value added in terms of the customer. Unlike Six Sigma which isdriven by highly focused projects, Lean takes a broader view, looking at the entire valuestream – all the steps required to produce goods and services that the end user wants,when and where the end user wants it. In the past, we simply thought of the process asstopping once we shipped the product to the customer. Under lean, you have to managethe entire value stream. This value stream is the baseline from which we will apply ourlean tools. And some of the tools used in lean are the same as Six Sigma. Thus, Leanand Six Sigma tend to be complimentary of one another.
A good place to start is to map out the value stream. In order to prepare a value map,you must first identify all entities that are directly involved in the value stream. If youhave several entities or domains within your value map, you might want to assignweights to each in relation to their influence or impact across the entire value stream.
The Value Map should define overall flows or exchanges between the various entities ordomain owners that comprise the value stream. This involves the movement of materialsand information across the value stream – from the resource inputs that go into makingproducts and services to the final consumption of the product or service. Once youunderstand these relationships, you begin to identify problems and challenges that takeplace in the exchanges throughout the value map.
Most value maps are constructed by following some simple rules:
1. Use ovals for each entity. Try to keep the number of entities to ten or less. Youcan vary the size of the oval to indicate influence or impact in the value chain.
2. Connector lines between entities should be labeled as to the input or outputsinvolved. Here are some simple examples:
Chapter
5
Map the Value Stream
“Value is a moving finish line and any satisfaction felt at delivering the very bestvalue should be tempered by the knowledge that the race is unending and thosewho do not improve are losing ground. Getting managers and employees to buyinto the concept of high value, long haul management is critical to establish awell-spring of value-driven ideas and actions. Value is a cause that unites andstrengthens any organization, supplier or customer, small venture or large, highgrowth or no growth industry.”
– Value Directed Management by Bernard Arogyaswamy and Ron P. Simmons

33
Lean is often characterized by the 5 S Principles:
1. Sort – Put things in the proper order and remove those things not required for theprocess to work.
2. Straighten – Arrange things in such a way that minimal effort is needed betweeneach part of the process.
3. Shine – Keep all parts of the process clean and in good working order to preventany break downs.
4. Standardize – Maintain all lean principles with any design changes related to theprocess.
5. Sustain – Make a commitment to following the lean principles in how we manageour processes.
Depending upon the nature of the process, there are the “usual” suspects when it comesto waste:
Manufacturing Operation Administrative ProcessExcessive production Excessive Hand OffsHolding inventory Multiple Systems InvolvedTransporting or Moving Items Process is Very ManualWaiting Numerous Approvals and ReviewsUnnecessary Activity or Process Research and Wait TimesCorrect and Rework Batch processingFlaws and Defects Queues
SSuupppplliieerr
CCuussttoommeerr
MMaannuuffaaccttuurreerr
DDiissttrr iibbuuttoorr
CCoommppaannyy
Blanket Order
Product Returns
Products
Technical SupportProductsSales Forecast
Five Lean Principles

34
Many of the tools in lean are the same as Design for Six Sigma – things like mistakeproofing (poka yoke) and Quality Function Deployment. Lean also uses many of the“fundamental” type tools, such as root cause analysis and brainstorming – not tomention the main-stay tool of value mapping. One of the more serious tools used in leanis process modeling. Process models provide a simulation of how a process works,allowing the user to trigger events and identify possible bottlenecks and inefficiencieswithin the process. Process models are not easy to build; requiring a computer model ofinterdependencies between entities, resources, drivers, and other components.
Process models should start with a high level map or diagram of your core process. TheSIPOC Method can be used to create a high level diagram of your core process:
Suppliers – All entities involved in providing resources consumed by the process.Inputs – The actual resources (labor, materials, information, equipment, etc.).Process – The activities that convert inputs into outputs.Outputs – Products or services produced and distributed to customersCustomers – All entities, groups, and individuals who are recipients of the outputs.
Process Modeling
“The concept of quality management, developed since World War II, does notinvolve technology, it involves thought. You have to stop thinking about quantityand start thinking about quality. What makes that more difficult is that qualityisn’t a convenient list you can consult or even anything you can look at. If peopleoperated on a factual basis, everyone would have adopted a quality method bynow. The fact is that quality methods provide better results. Another fact is thatpeople who work in quality companies are happier, better trained, and morededicated employees. An even bigger fact is that quality is the standard ofcompetition in the global market.”
– Thinking About Quality by Lloyd Dobyns and Clare Crawford-Mason

35
Depending upon the organization, there are different life cycle approaches for doinglean. For example, Japanese organizations typically use the Kaizen approach:
1. Identify and clarify the objective2. Grasp the current situation3. Visualize the ideal situation4. Develop targets5. Create a strategy for kaizen implementation6. Make a plan - who, what, when7. Implement8. Check Effectiveness9. Document your activity10. Confirm results
Another approach is 8D (eight disciplines):
1. Use Team Approach2. Describe the Problem3. Implement and Verify Interim Actions4. Identify Potential Causes5. Choose / Verify Corrective Actions6. Implement Permanent Corrective Actions7. Prevent Recurrence8. Congratulate Your Team
Another basic way of looking at lean is to view it as a continuous program cutting acrossthe entire value stream, following a repetitive method of: Plan (Analyze the process) →Do (Test your improvement ideas) → Check (Evaluate test results) → Act (Adjust and goback to Plan). When coupled with various tools, such as Root Cause Analysis, PokaYoke, and Quality Function Deployment, lean becomes integrated into all of the workthat goes into the value stream. The ultimate goal of managing the value stream is tohave a single piece flow where products move from one operational point to another onlywhen needed with the lowest increment in resources consumed.
Lean Life Cycle Methods
“The key point to remember is that customers care about and react to the endproduct that is the sum of all functional products. For example, customers visitingDisney World care little about what goes on behind the scenes to create themagic. A hotel guest should not be concerned with the process that gets the rightroom clean and ready for a stay. A frequent flyer remembers on-time arrivals, notthe fuel load or pilot schedules. Consumers instinctively focus on the ultimateoutcome they desire.”
– Focused Quality: Managing for Results by Harvey K. Brelin, Kimberly S.Davenport, Lyell P. Jennings and Paul F. Murphy

36
Course SummaryImproving performance is not about cutting people. It’s about cutting waste andinefficiency from the process so people can do their jobs better. The tools for processimprovement have exploded in recent years thanks to Six Sigma. But even if you don’thave a team of Six Sigma Black Belts, you can still apply many fundamental conceptsfor improving a process. This can include things like reducing handoffs within a process,eliminating “Re” type activities, and organizing around process flows as opposed tofunctional silos. Additionally, many of the fundamental tools for improving a process arenot overly complicated – things like root cause analysis, affinity diagrams, andbrainstorming.
You can also embark on broad approaches to process improvement by using CapabilityMaturity Models and Lean. Several programs are available for making quality a part ofthe company’s culture. Examples include the Malcolm Baldridge National Quality Awardand ISO 9000. Given the wealth of resources now available, there’s no excuse for anycompany not to improve its processes.
Quality is now a given for the customer. When people buy products and services, theyexpect high quality. Voice of the Customer recognizes that customers have silentexpectations that you can no longer ignore. Therefore, understanding the voice of thecustomer is paramount for addressing quality and improving your processes. The road toprocess improvement must pass through the customer. And as customer expectationsrise, the need to improve organizational processes will grow. Process improvement isnow a fundamental part of managing any organization and if you fail to improve yourprocesses, then sooner or later you will be forced to do so in order to survive.
“Astute managers at all levels – in all industries – realize that the success of theirorganizations in today’s world depends upon flexibility and responsiveness inmeeting customer needs, achieving ever higher quality levels, a high degree ofinternal efficiency, and cost effectiveness. The key to success is to maximizevalue to the customer and successfully implement the changes that makemaximum customer value a reality for any organization in any industry.”
– Breakthrough Process Redesign: New Pathways to Customer Value byCharlene B. Adair and Bruce A. Murray

37
Final ExamIn order to receive credit for this short course, you must correctly answer at least 7 of thefollowing 10 questions correctly. You can take this exam on-line by clicking on the “takeexam” hyperlink located over the internet at www.exinfm.com/training. If you want aCertificate of Completion for taking this course, then you must download and use the“exe” file version of this short course.
1. A process is essentially a series of activities that:
a. Converts time and materials into finished productsb. Converts resources into some form of outputc. Decomposes products into their source inputsd. Assembles products using automation
2. An effective process is a process that:
a. Measures and monitors waste in the value streamb. Functions with no intervention of manual laborc. Meets or exceeds customer requirementsd. Never requires improvement
3. Which of the following tools is useful for visually depicting the flow of a process?
a. Process Mapb. Affinity Diagramc. Pareto Chartd. Solutions Matrix
4. Which of the following tools is useful for prioritizing and ranking problems thathave the highest impact on costs?
a. Process Mapb. Affinity Diagramc. Pareto Chartd. Solutions Matrix
5. A process improvement team needs to select the best solution from threealternatives (Alt). Three criteria have been applied to each of the threealternatives using a 5 point scale with 5 as the highest rating:
Selection Criteria . . Weight . . Alt A . . Alt B . . Alt C1. Life Span . . . . . . 30% . . . . 4 . . . . .3 . . . . .52. Quality Rating . . .50% . . . . 3 . . . . 3 . . . . . 23. Scalability . . . . . .20% . . . . 2 . . . . 3 . . . . . 2
Using a solutions matrix, which alternative should the team select?

38
a. Alternative Ab. Alternative Bc. Alternative Cd. Alternative B or C
6. At what level within Capability Maturity Models can someone begin to manage aprocess using measurement and control?
a. Level 1b. Level 2c. Level 3d. Level 4
7. Most of the CMM levels will need to have a set performance goals for each:
a. Cross-Over Functionb. Responsibility Centerc. Key Process Aread. Risk Layer
8. As a process converts inputs into outputs, errors are introduced into the process,creating:
a. Normalityb. Variationc. Value Skewnessd. Leveling
9. Using Six Sigma, we need to make sure that a process is meeting its:
a. DPMOb. CMMIc. DMAICd. CTQ
10. A process team would like to identify all possible problems that could arise withits new image processing equipment. The team would like to determine anycorrective actions needed based on a risk rating system. Which of the followingtechniques would be the most helpful for completing this task?
a. Poka Yokeb. FMEAc. QFDd. SPC

39
Process Improvement Cartoon