course review 2014-2015 - cry rop course review...course review 2017-2018 carlos padilla director of...
TRANSCRIPT

Course Review 2017-2018
Carlos PadillaDirector of Educational Services
Presented by:

Education Code Requirements
Every two years the Colton-Redlands-Yucaipa Regional Occupational Program issues a formal report as required by California education code 52302.3 which states:
A.) Every career technical course or program offered by a school district or districts or county superintendent or superintendents sponsoring a regional occupational center or program shall be reviewed every two years by the appropriate governing body to assure that each course or program does all of the following.
• Meets a documented labor market demand.
• Does not represent unnecessary duplication of other job skills training programs in the area.
• Is of demonstrated effectiveness as measured by the employment and completion success of its pupils.
B.) Any course or program that does not meet the requirements of subdivision (A.) and the standards promulgated by the governing body shall be terminated within one year.

Enrollment Completers Placement
Course Review 2017-2018

9.9%
549
7.3%
40115 and
under
16
17
18
19+
401
715
1677
2187
549
students
7.3%
students
12.9%
students
30.3%
students
30.3%
students
9.9%
Student DemographicsAGE – High School

9.9%
549
20
26+
7
45
students
10.1%
21-25 11 students
15.9%
students
65.2%
Student DemographicsAGE – Adult
19 6 students
8.7%

Caucasian22.4%
African American4.9%
Hispanic66.4%
Asian5.6%
American Indian0.7%
Unknown\Other0.1%
Student DemographicsStudent Ethnicity

ENROLLMENT:
A student who has completed 20 hours of training.
COMPLETER:
Per CRY-ROP Governing Board Policies, an enrolled student shall beconsidered “completed” if he or she has a passing grade at time of exitand has achieved a level of competency in one or more skills that wouldenable him or her to be placed in entry-level or higher employment inthe trained-for occupation, apply transferable skills in a non-relatedoccupation, or continue in advanced education.
PerkinsEnrollments and Completers
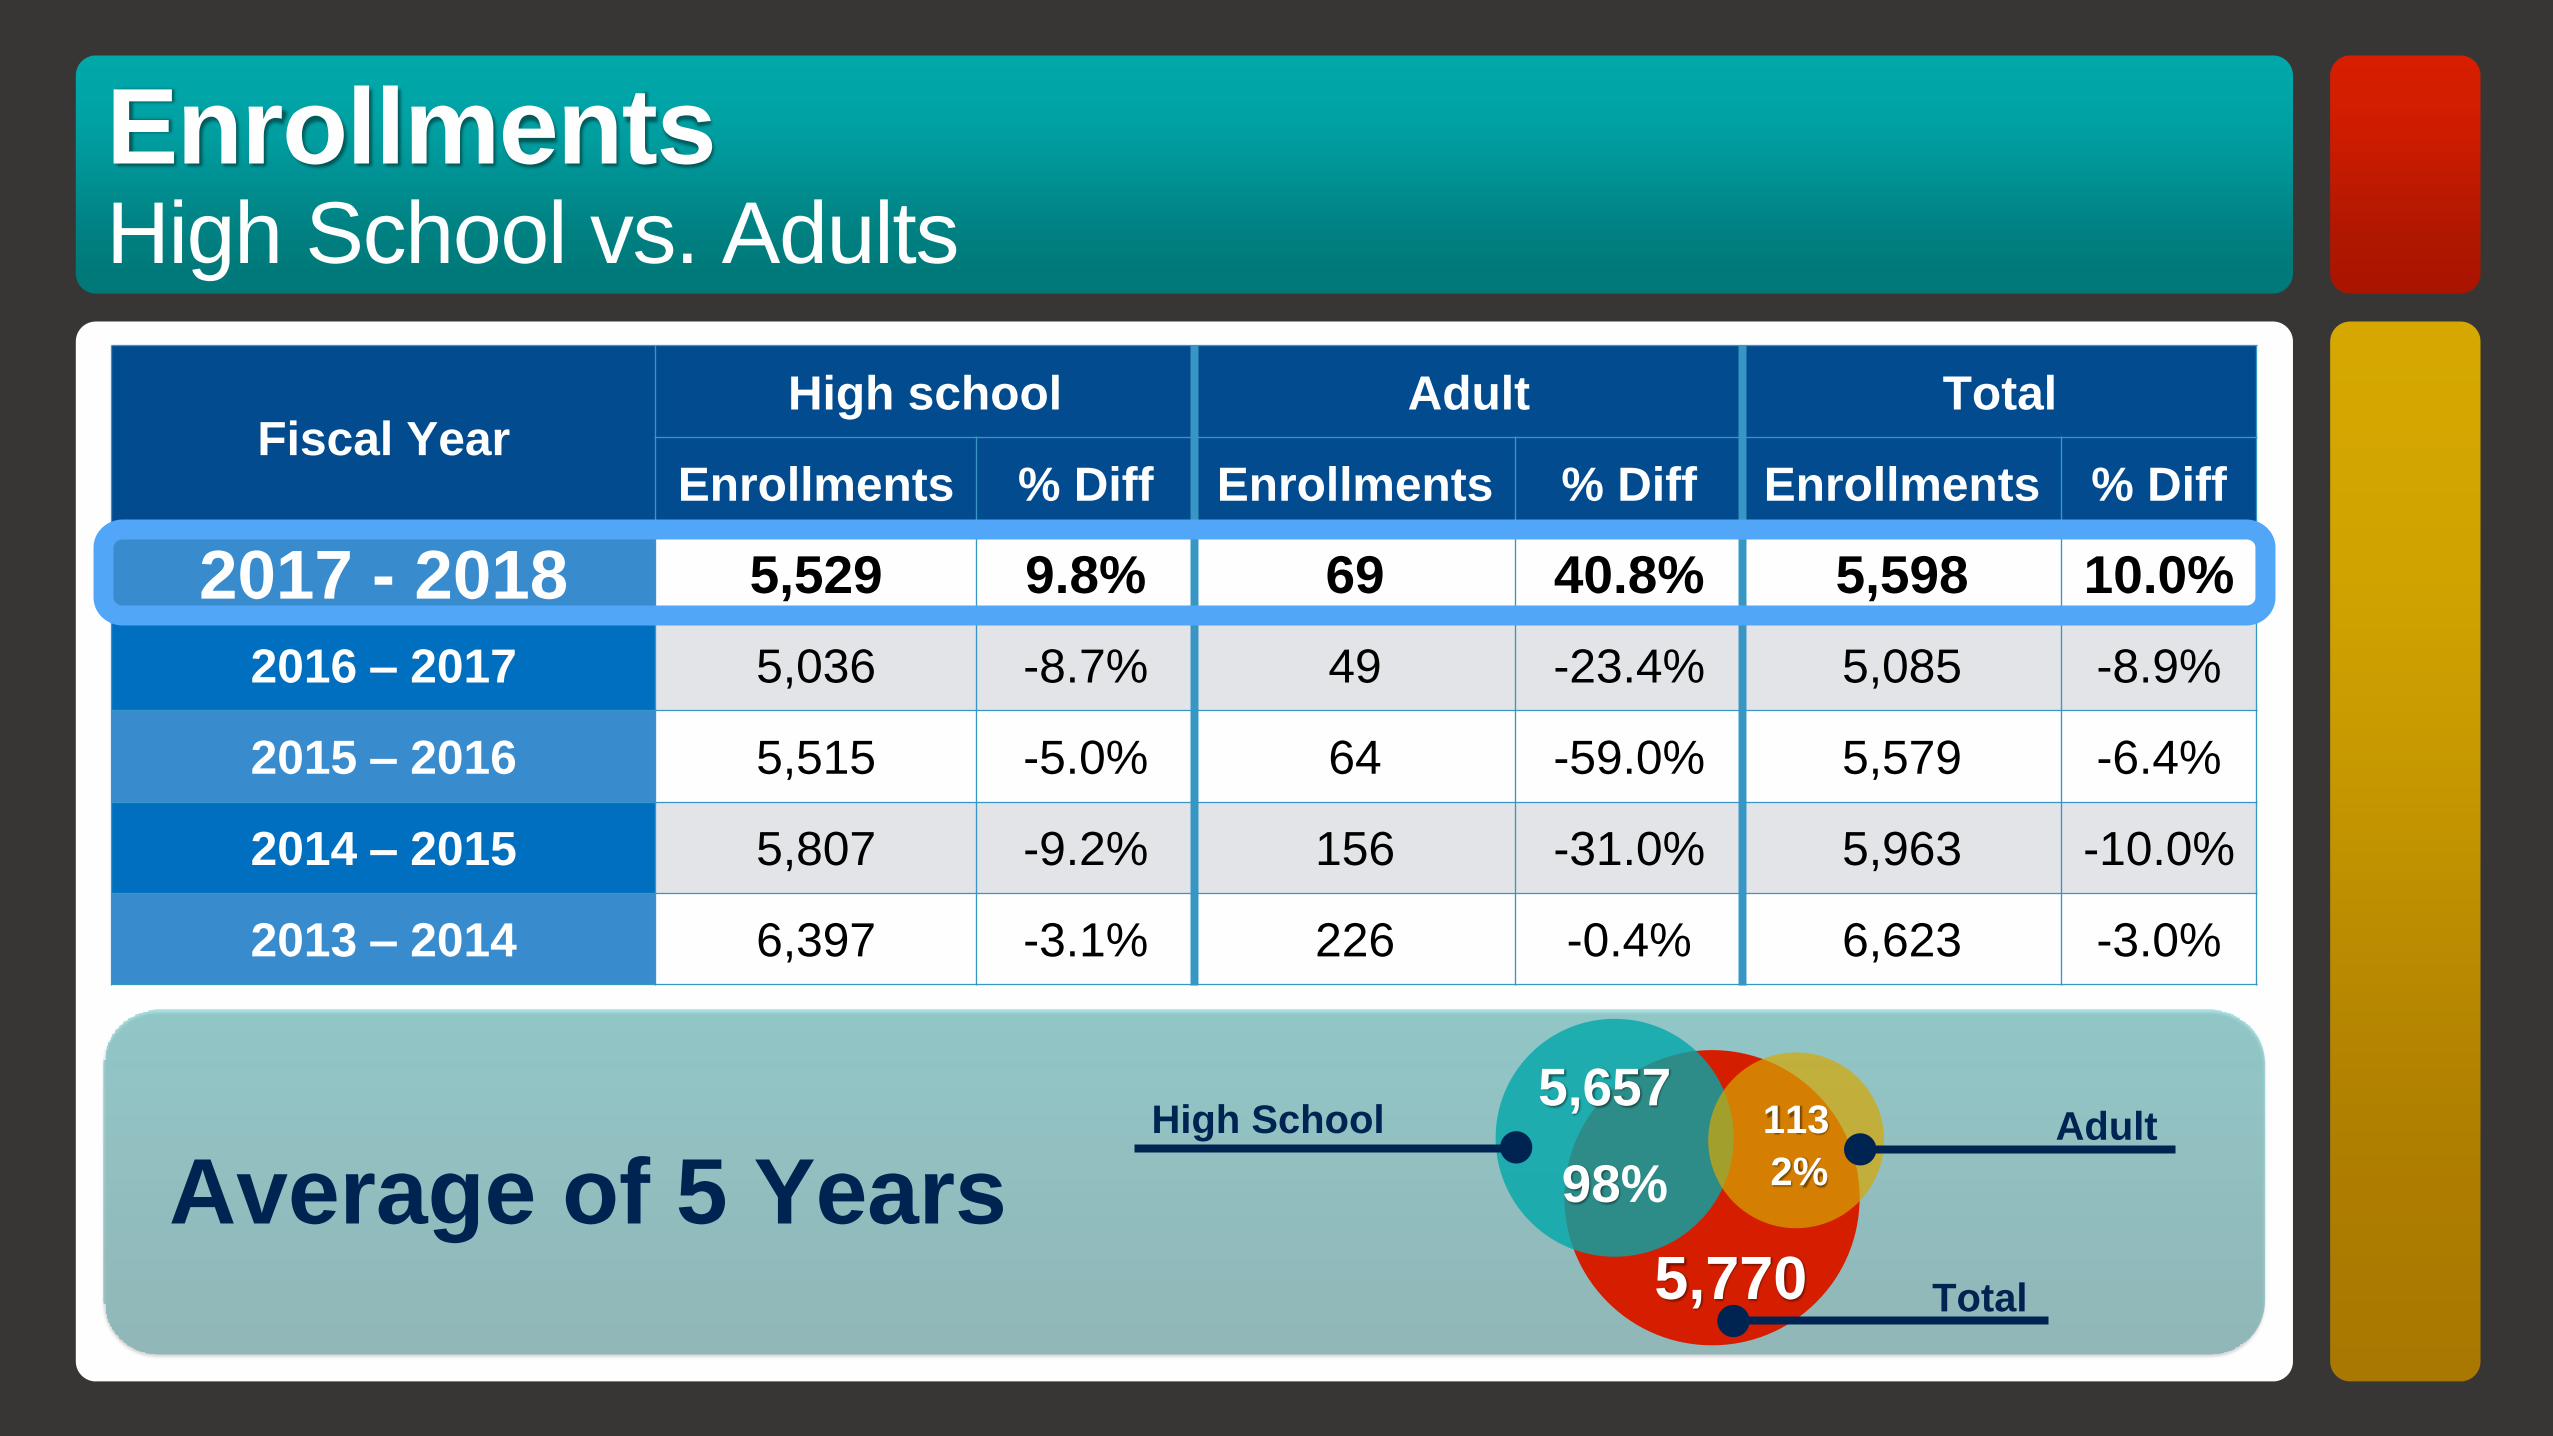
Fiscal YearHigh school Adult Total
Enrollments % Diff Enrollments % Diff Enrollments % Diff
2017 - 2018 5,529 9.8% 69 40.8% 5,598 10.0%
2016 – 2017 5,036 -8.7% 49 -23.4% 5,085 -8.9%
2015 – 2016 5,515 -5.0% 64 -59.0% 5,579 -6.4%
2014 – 2015 5,807 -9.2% 156 -31.0% 5,963 -10.0%
2013 – 2014 6,397 -3.1% 226 -0.4% 6,623 -3.0%
5,657113
5,770
High School Adult
Total
Average of 5 Years 98% 2%
EnrollmentsHigh School vs. Adults

Fiscal Year Enrollments% Increase -
Decrease
Total
Completers% Completers
2017 – 2018 5,598 10.0% 5,173 92.4%
2016 – 2017 5,085 -8.9% 4,634 91.1%
2015 – 2016 5,579 -6.4% 5,167 92.6%
2014 – 2015 5,963 -10.0% 5,345 89.6%
2013 – 2014 6,623 -3.0% 5,676 85.7%
PerkinsEnrollments and Completers

CRY-ROP Administrative Regulation 6190.1(a) states:
A minimum requirement of 50% completion as the acceptable level.
No Concerns
Refer to data sheet
CompletionConcerns and Watch

2017 - 2018Attempted
To Contact
Able To Contact Positively Placed
Students % Students %
12th Grade 2,153 1,482 68.8% 1,408 95.0%
Adult 69 66 95.7% 63 95.5%
Total 2,222 1,548 69.7% 1,471 95.0%
PlacementMilitary, Education, Employment

0.0% 10.0% 20.0% 30.0% 40.0% 50.0% 60.0% 70.0% 80.0% 90.0%
EducationRelated
EducationUnrelated
EmploymentRelated
EmploymentUnrelated
Military
Not placed
12.5%
5.0%
75.0%
7.5%
0.0%
0.0%
1.4%
1.4%
81.2%
7.2%
0.0%
8.7%2017-2018 2016-2017
66 students 45 students
Placement by TypeAdult 2 Years

0.0% 10.0% 20.0% 30.0% 40.0% 50.0% 60.0%
Education Related
Education Unrelated
Employment Related
Employment Unrelated
Military
Not placed
17.6%
23.2%
5.1%
45.4%
3.3%
5.5%
11.3%
26.1%
2.0%
52.0%
3.6%
5.0%2017-2018 2016-2017
Placement by TypeHigh School 12th Graders, 2 Years
5,107 students 4,589 students

CRY-ROP Administrative Regulation 6190.1(b) states:
The acceptable placement rate for all ROP career preparation training programs shall be 50%, with the following exceptions:
• Emerging or Technologically-advanced programs shall place 25% of the completer rate.
• Programs in which significant changes have occurred in the labor market, the equipment or training facility, curriculum, teacher or training techniques shall place 25% of the completer rate.
No Concerns
Refer to data sheet
PlacementConcerns and Watch

CaliforniaSan Bernardino-Riverside
Estimated Population 4.6 Million 33.8 Million
Average Unemployment Rate 4.6% 4.1%
Nonfarm Payroll Employment Increase 1.8%(26,200 Jobs)
Increase 1.6%(284,300 Jobs)
Greatest Year-Over GainEducation and Health
Services 5.0%(11,700 Jobs)
Construction 8.6% (59,300 Jobs)
Largest Year-Over GainTrade, Transportation
and Utilities(5,700 Jobs each)
Professional & Business
Services(124,700 Jobs)
Labor MarketAs of December, 2018
San Bernardino County: 2,157,404
Riverside County: 2,423,266

Industry San Bernardino-Riverside California
Total Nonfarm 26,600 284,300
Construction 1,100 21,700
Trade, Transportation & Utilities 5,700 11,300
Government 4,900 30,300
Leisure & Hospitality 1,400 56,300
Professional & Business Services 2,800 82,500
Manufacturing 1,000 5,800
Financial Activities -600 4,400
Other Services -1,400 -3,900
Educational & Health Services 11,700 67,900
Mining and Logging 0 200
Information 0 7,800
Labor Market2018 Year-Over Change

California
1. Home Health Aides
2. Software Developers, Applications
3. Personal Care Aides
4. Nurse Practitioners
5. Taxi Drivers and Chauffeurs
6. Physician Assistants
7. Physical Therapist Aides
8. Physical Therapist Assistants
9. Health Specialties Teachers, Postsecondary
10. Operations Research Analysts
Inland Empire
1. Reinforcing Iron and Rebar Workers
2. Helpers—Brickmasons, Stonemasons, Tile/Marble Setters
3. Roofers
4. Cement Masons and Concrete Finishers
5. Door-to-Door Sales Workers, News/Street Vendors
6. Glaziers
7. Physical Therapist Aides
8. Physician Assistants
9. Helpers--Electricians
10. Nurse Practitioners
Labor MarketTop 10 Fastest Growing Occupations (2014-2024)

California
1. Personal Care Aides
2. Food Preparation and Serving Workers
3. Cashiers
4. Retail Salespersons
5. Waiters and Waitresses
6. Laborers and Freight, Stock, and Material Movers
7. Farmworkers and Laborers, Crop, Nursery, and Greenhouse
8. Office Clerks, General
9. Janitors and Cleaners, Except Maids and Housekeeping
10. Store Clerks and Order Fillers
Inland Empire
1. Laborers and Freight, Stock, and Material Movers
2. Food Preparation and Serving Workers
3. Personal Care Aides
4. Cashiers
5. Retail Salespersons
6. Waiters and Waitresses
7. Store Clerks and Order Fillers
8. Heavy and Tractor-Trailer Truck Drivers
9. Registered Nurses
10. Carpenters
Labor MarketTop 10 Occupations with Most Job Openings (2014-2024)

Recommendations
CRY-ROP Administrative Regulation 6190.1
states a minimum requirement of 50%
completion as the acceptable level.
Approve the operation of all CRY-ROP courses
as they all met or exceeded the minimum board
requirements for completers and placement.

#Proud2bROP
Course Review 2017-2018