course 415: control of gaseous emissions
TRANSCRIPT

Table of Contents
AIR POLLUTION TRAINING INSTITUTE
COURSE 415: CONTROL OF
GASEOUS EMISSIONS
STUDENT GUIDE
United States Environmental Protection Agency Office of Air and Radiation
Office of Air Quality Planning and Standards Research Triangle Park, NC 27711
April 2012

APTI 415: Control of Gaseous Emissions — Student Guide
Acknowledgements Page ii
ACKNOWLEDGEMENTS
The content of this course was originally developed with the contributions of Dr. James A. Jahnke and
Dave Beachler, who authored the first edition of Control of Particulate Emissions in 1981 under contract to Northrop Services Inc. (EPA 450/2-80-068). In 1995, the second edition of this text was published,
authored by Dr. John R. Richards, P.E., under contract to North Carolina State University (funded by
EPA grant). This content was updated in 2012 to include EPA-approved content, resources, and diagrams. Notations and source information are provided for these materials.
APTI 415: Control of Gaseous Emissions — Student Guide
Acknowledgements Page iii
NOTICE This is not an official policy and standards document. The opinions are those of the author and not
necessarily those of the U.S. Environmental Protection Agency (EPA). Every attempt has been made to
represent the present state of the art, as well as subject areas still under evaluation. Any mention of
products or organizations does not constitute endorsement by the EPA.
AVAILABILITY This document is issued by the Innovative Programs and Outreach Group, Outreach and Information Division, Office of Air Quality Planning and Standards (OAQPS). It was developed for use in training
courses presented by the U.S. EPA’s Air Pollution Training Institute (APTI) and others receiving
contractual or grant support from the Institute. Other organizations are welcome to use this document.
This document is available, free of charge, to schools or governmental air pollution control agencies
intending to conduct training courses. To obtain a copy of this document, submit a written request to
APTI, EPA, Mail Code C304-05, Research Triangle Park, NC 27711. Others may obtain copies, for a fee, from the National Technical Information Service (NTIS), 5825 Port Royal Road, Springfield, VA 22161.

APTI 415: Control of Gaseous Emissions — Student Guide
Table of Contents Page iv
TABLE OF CONTENTS Course Introduction ........................................................................................................................... 1-1
Chapter 1 ............................................................................................................................................ 1-2
1.0 Introduction to Gaseous Emissions ............................................................................................ 1-2
1.1 Introduction ........................................................................................................................ 1-2
1.2 Introduction to Gaseous Pollutants ...................................................................................... 1-2
1.3 Emission Rates and Sources of Gaseous Pollutants ............................................................ 1-12
1.4 Pollution Control ............................................................................................................... 1-16
1.5 Summary........................................................................................................................... 1-21
1.6 Review Exercises .............................................................................................................. 1-22
1.7 Review Exercises: Solutions .............................................................................................. 1-24
1.8 References ........................................................................................................................ 1-25
Chapter 2 ............................................................................................................................................ 2-1
2.0 Control Techniques For Gaseous Contaminants ....................................................................... 2-1
2.1 Overview ............................................................................................................................ 2-1
2.2 Gas Stream Characteristics .................................................................................................. 2-1
2.3 Gaseous Contaminant Control Techniques........................................................................... 2-8
2.4 Summary........................................................................................................................... 2-18
2.5 Review Exercises .............................................................................................................. 2-19
2.6 Review Exercises: Solutions .............................................................................................. 2-21
2.7 References ........................................................................................................................ 2-23
Chapter 3 ............................................................................................................................................ 3-1
3.0 Air Pollution Control Systems .................................................................................................... 3-1
3.1 Overview ............................................................................................................................ 3-1
3.2 Flowcharts .......................................................................................................................... 3-1
3.3 Hoods ............................................................................................................................... 3-16
3.4 Fans .................................................................................................................................. 3-29
3.5 Summary........................................................................................................................... 3-47
3.6 Review Exercises .............................................................................................................. 3-48
3.7 Review Exercises: Solutions .............................................................................................. 3-52
3.8 References ........................................................................................................................ 3-60
Chapter 4 ............................................................................................................................................ 4-1
4.0 Adsorption .................................................................................................................................. 4-1

APTI 415: Control of Gaseous Emissions — Student Guide
Table of Contents Page xiii
4.1 Overview ............................................................................................................................ 4-1
4.2 Types and Components of Adsorption Systems ................................................................... 4-2
4.3 Operating Principles .......................................................................................................... 4-15
4.4 Adsorption System Performance........................................................................................ 4-22
4.5 Performance Monitoring.................................................................................................... 4-35
4.6 Summary........................................................................................................................... 4-41
4.7 Review Exercises .............................................................................................................. 4-42
4.8 Review Exercises: Solutions .............................................................................................. 4-47
4.9 References ........................................................................................................................ 4-53
Chapter 5 ............................................................................................................................................ 5-1
5.0 Absorption .................................................................................................................................. 5-1
5.1 Overview ............................................................................................................................ 5-1
5.2 Types and Components of Absorbers................................................................................... 5-2
5.3 Operating Principles .......................................................................................................... 5-19
5.4 Capability and Sizing ........................................................................................................ 5-23
5.5 Instrumentation ................................................................................................................. 5-52
5.6 Summary........................................................................................................................... 5-58
5.7 Review Exercises .............................................................................................................. 5-59
5.8 Review Exercises: Solutions .............................................................................................. 5-63
5.9 References ........................................................................................................................ 5-68
Chapter 6 ............................................................................................................................................ 6-2
6.0 Oxidation..................................................................................................................................... 6-2
6.1 Overview ............................................................................................................................ 6-2
6.2 Types and Components of Oxidizer Systems ....................................................................... 6-3
6.3 Operating Principles .......................................................................................................... 6-17
6.4 Capability and Sizing ........................................................................................................ 6-26
6.5 Operating Parameters and Instrumentation......................................................................... 6-36
6.6 Summary........................................................................................................................... 6-38
6.7 Review Exercises .............................................................................................................. 6-39
6.8 Review Exercises: Solutions .............................................................................................. 6-42
6.9 References ........................................................................................................................ 6-46
Chapter 7 ............................................................................................................................................ 7-1
7.0 Condensation .............................................................................................................................. 7-1
7.1 Overview ............................................................................................................................ 7-1
7.2 Types of Systems ................................................................................................................ 7-2

APTI 415: Control of Gaseous Emissions — Student Guide
Table of Contents Page xiii
7.3 Operating Principles ............................................................................................................ 7-9
7.4 Capability and Sizing ........................................................................................................ 7-11
7.5 Summary........................................................................................................................... 7-22
7.6 Review Exercises .............................................................................................................. 7-23
7.7 Review Exercises: Solutions .............................................................................................. 7-26
7.8 References ........................................................................................................................ 7-28
Chapter 8 ............................................................................................................................................ 8-2
8.0 Control Techniques for Nitrogen Oxides ................................................................................... 8-2
8.1 Overview ............................................................................................................................ 8-2
8.2 Nitrogen Oxides Formation ................................................................................................. 8-3
8.3 Sources of Nitrogen Oxides ................................................................................................. 8-5
8.4 Types and Components of NOx Control Techniques .......................................................... 8-12
8.5 Capability and Sizing ........................................................................................................ 8-31
8.6 Evaluating Performance .................................................................................................... 8-33
8.7 Summary........................................................................................................................... 8-38
8.8 Review Exercises .............................................................................................................. 8-39
8.9 Review Exercises: Solutions .............................................................................................. 8-43
8.10 References....................................................................................................................... 8-47
Chapter 9 ............................................................................................................................................ 9-2
9.0 Sulfur Oxides Control ................................................................................................................. 9-2
9.1 Overview ............................................................................................................................ 9-2
9.2 Types and Components of Sulfur Oxides Control Systems ................................................... 9-3
9.3 Operating Principles .......................................................................................................... 9-17
9.4 Sulfur Oxides Control Systems Capability and Sizing ........................................................ 9-23
9.5 SO2 Continuous Emission Monitoring ............................................................................... 9-26
9.6 Summary........................................................................................................................... 9-31
9.7 Review Exercises .............................................................................................................. 9-32
9.8 Review Exercise: Solutions ............................................................................................... 9-34
9.9 References ........................................................................................................................ 9-37
Chapter 10 ........................................................................................................................................ 10-1
10.0 Control Techniques for Greenhouse Gas Emissions ................................................................ 10-1
10.1 Overview ......................................................................................................................... 10-1
10.2 Greenhouse Gas Emission Sources ................................................................................... 10-2
10.3 GHG Emissions from Industrial Sources .......................................................................... 10-5
10.3.1 GHG Emissions from Coal-Fired EGUs .............................................................. 10-6

APTI 415: Control of Gaseous Emissions — Student Guide
Table of Contents Page xiii
10.3.2 GHG Emissions from Large Industrial/Commercial/ Institutional Boilers ............ 10-8
10.3.3 GHG Emissions from Pulp and Paper Manufacturing ........................................ 10-11
10.3.4 GHG Emissions from Cement Manufacturing ................................................... 10-15
10.3.5 GHG Emissions from Iron and Steel Industry .................................................... 10-17
10.3.6 GHG Emissions from Petroleum Refining ......................................................... 10-20
10.3.7 GHG Emissions From Nitric Acid Plants .......................................................... 10-23
10.4 Efficiency Improvements Across Industrial Sectors ........................................................ 10-25
10.5 GHG Emission Controls for Industrial Sectors ................................................................ 10-28
10.5.1 Emission Controls for Coal-Fired EGUs ............................................................ 10-28
10.5.2 Emission Controls for Industrial, Commercial, and Institutional Boilers ............ 10-31
10.5.3 Emission Controls for Pulp and Paper Manufacturing......................................... 10-40
10.5.4 Emission Controls for Cement Manufacturing .................................................... 10-43
10.5.5 Emission controls for Petroleum Refining .......................................................... 10-56
10.5.6 Emission Controls for Nitric Acid Plants ............................................................ 10-66
10.4 Additional Resources for GHG Emission Control ........................................................... 10-75
10.5 Summary......................................................................................................................... 10-76
10.6 Review Exercises ............................................................................................................ 10-77
10.7 Review Exercise Solutions .............................................................................................. 10-78
10.8 References ...................................................................................................................... 10-80
Basic Concepts ................................................................................................................................... A-1
A.1 Units and Systems of Units..................................................................................................A-1
A.2 Force and Mass ...................................................................................................................A-2
A.3 Mixtures, Mass, and Mole Fractions ....................................................................................A-4
A.4 Molecular Weight (Molar Mass) ..........................................................................................A-5
A.5 Pressure ..............................................................................................................................A-6
A.6 Temperature ........................................................................................................................A-8
A.7 Equation of State ............................................................................................................... A-10
A.8 Standard Conditions .......................................................................................................... A-11
A.9 Flow Rate.......................................................................................................................... A-12
A.10 Summary........................................................................................................................... A-14
A.11 Review Exercises .............................................................................................................. A-15
A.12 Review Exercise Solutions ................................................................................................ A-16
APTI 415: Control of Gaseous Emissions — Student Guide
List of Figures Page iv
LIST OF FIGURES Figure 1-1. Pollutant concentration profiles due to photochemical reactions. ......................................... 1-9
Figure 1-2. SO2, NOx, and VOC emissions history. ............................................................................. 1-12
Figure 1-3. Estimated greenhouse gas emissions in terms of CO2- equivalent. ..................................... 1-13
Figure 1-4. Number of people living in counties with air quality concentrations ................................. 1-21
Figure 3-1. Material stream symbols. .................................................................................................... 3-2
Figure 3-2. Major equipment symbols................................................................................................... 3-3
Figure 3-3. Identification of emission points. ........................................................................................ 3-4
Figure 3-4. Minor component symbols.................................................................................................. 3-5
Figure 3-5. Instrument symbols. ........................................................................................................... 3-5
Figure 3-6. Example flowchart of a waste solvent system...................................................................... 3-7
Figure 3-7. Example flowchart of an asphalt plant. ............................................................................... 3-8
Figure 3-8. Example flowchart of a hazardous waste incinerator and pulse jet baghouse system. ........... 3-9
Figure 3-9. Static pressure and temperature profile for present data. .................................................... 3-10
Figure 3-10. Example flowchart of a hazardous waste incinerator and venturi scrubber system. .......... 3-14
Figure 3-11. Static pressure profiles. ................................................................................................... 3-15
Figure 3-12. Stationary hood in an industrial process. ......................................................................... 3-16
Figure 3-13. Role of hoods in an industrial process. ............................................................................ 3-17
Figure 3-14. Hood capture velocities. ................................................................................................. 3-19
Figure 3-15. Beneficial effect of side baffles on hood capture velocities. ............................................. 3-21
Figure 3-16. Push-pull hood................................................................................................................ 3-22
Figure 3-17. Hood design for protection of plant personnel. ................................................................ 3-23
Figure 3-18a-c. Plain duct end with a hood entry loss coefficient of 0.93............................................. 3-24
Figure 3-19. Relationship between hood static pressure and gas velocity. ............................................ 3-25
Figure 3-20. Axial fan. ....................................................................................................................... 3-30
Figure 3-21. Centrifugal fan................................................................................................................ 3-30
Figure 3-22. Centrifugal fan and motor sheaves. ................................................................................. 3-31
Figure 3-23. Types of centrifugal fan wheels. ..................................................................................... 3-33
Figure 3-24. Centrifugal fan with radial blade. .................................................................................... 3-33
Figure 3-25. Fan static pressure rise. ................................................................................................... 3-34
Figure 3-26. Total system static pressure drop. ................................................................................... 3-35
Figure 3-27. System characteristic curve. ............................................................................................ 3-36

APTI 415: Control of Gaseous Emissions — Student Guide
List of Figures Page v
Figure 3-28. Fan static pressure rise profile. ........................................................................................ 3-36
Figure 3-29. Portion of a typical multi-rating table. ............................................................................. 3-37
Figure 3-30. Operating point. .............................................................................................................. 3-37
Figure 3-31. Fan characteristic curve. ................................................................................................. 3-38
Figure 3-32. Changes in the system resistance curve. .......................................................................... 3-39
Figure 3-33. Changes in the fan speed................................................................................................. 3-40
Figure 3-34. Changes in the inlet damper position. .............................................................................. 3-41
Figure 3-35. Portion of a ventilation system. ....................................................................................... 3-42
Figure 3-36. Example of a brake horsepower curve. ............................................................................ 3-43
Figure 3-37. Example flowchart. ......................................................................................................... 3-48
Figure 3-38. Example flowchart. ......................................................................................................... 3-52
Figure 4-1. Vapor adsorbed into pores of adsorbent. ............................................................................. 4-2
Figure 4-2. Sketches of zeolites.3 .......................................................................................................... 4-3
Figure 4-3. Example of a synthetic polymer. ......................................................................................... 4-4
Figure 4-4. Thin-bed adsorber — nine-cell system. ............................................................................... 4-6
Figure 4-5. Nonregenerative adsorbers. ................................................................................................. 4-7
Figure 4-6. Thick-bed nonregenerative adsorber. .................................................................................. 4-7
Figure 4-7. Flowchart of a simple nonregenerative adsorber. ................................................................. 4-8
Figure 4-8. Two-bed adsorption system. ............................................................................................... 4-9
Figure 4-9. Multi-bed, fixed-bed-type adsorption system. ................................................................... 4-10
Figure 4-10. Cutaway sketch of horizontal adsorber vessel.................................................................. 4-10
Figure 4-11. Carbon fiber system. ....................................................................................................... 4-11
Figure 4-12. Rotary wheel zeolite adsorber. ........................................................................................ 4-12
Figure 4-13.a. Rotor for carbon-fiber system. ...................................................................................... 4-13
Figure 4-14. Fluidized bed adsorber/regenerator. ................................................................................ 4-14
Figure 4-15. Fluidized bed adsorber. ................................................................................................... 4-15
Figure 4-16. Adsorption steps. ............................................................................................................ 4-16
Figure 4-17. Physical forces causing adsorption. ................................................................................. 4-17
Figure 4-18. Adsorption isotherm for carbon tetrachloride (CCl4) on one specific commercial activated
carbon adsorbent product. ............................................................................................. 4-19
Figure 4-19. Adsorption isosteres of H2S on 13X molecular sieve (loading in % H2S by weight). ........ 4-20
Figure 4-20. Adsorption isobar for benzene on an activated carbon (Pbenzene = 10.0 mm Hg)............ 4-21
Figure 4-21. Carbon capacity versus gas stream temperature. .............................................................. 4-26
Figure 4-22. Mass transfer zone. ......................................................................................................... 4-29

APTI 415: Control of Gaseous Emissions — Student Guide
List of Figures Page vi
Figure 4-23. Pressure drop versus gas velocity through a deep bed granular carbon. ............................ 4-30
Figure 4-24. Toluene isotherm. ........................................................................................................... 4-34
Figure 4-25. Flowchart of a three-bed (deep bed) absorber. ................................................................. 4-36
Figure 4-26. Calibration gas injection locations to check for sample line tubing problems. .................. 4-38
Figure 5-1. Countercurrent spray-tower scrubber. ................................................................................. 4-3
Figure 5-2. Full-cone spray nozzle. ....................................................................................................... 5-4
Figure 5-3. Countercurrent packed-tower. ............................................................................................. 5-5
Figure 5-4. Flowchart of cross-flow scrubber. ....................................................................................... 5-6
Figure 5-5. Types of packing. ............................................................................................................... 5-7
Figure 5-6. Types of liquid distributors for packed-bed absorbers. ........................................................ 5-8
Figure 5-7. Bubble-cap tray. ................................................................................................................. 5-9
Figure 5-8. Gas-liquid contact in a disk-and-donut sieve tray. ............................................................. 5-10
Figure 5-9. Venturi absorber. .............................................................................................................. 5-12
Figure 5-10. Ejector absorber. ............................................................................................................. 5-13
Figure 5-11. Biological oxidation system.5 .......................................................................................... 5-14
Figure 5-12. Chevron mist eliminator. ................................................................................................ 5-15
Figure 5-13. Radial-vane mist eliminator. ........................................................................................... 5-16
Figure 5-14. Mesh-pad mist eliminator. .............................................................................................. 5-16
Figure 5-15. Two-film theory of absorption. ....................................................................................... 5-19
Figure 5-16. Ammonia-water (NH3-H2O) system. ............................................................................... 5-21
Figure 5-17. Definition of the liquid-to-gas ratio. ................................................................................ 5-25
Figure 5-18. Material balance for countercurrent-flow absorber. ......................................................... 5-26
Figure 5-19. Y-X diagram showing the equilibrium and operating lines. ............................................. 5-28
Figure 5-20. Liquid-to-gas ratio. ......................................................................................................... 5-29
Figure 5-21. Absorber operating conditions in Problem 5-2. ............................................................... 5-30
Figure 5-22. Graphical representation of NH3 absorber problem (Problem 5-2). .................................. 5-32
Figure 5-23. Generalized Sherwood flooding and pressure drop correlation. ....................................... 5-34
Figure 5-24. Height of a transfer unit, ammonia and water system. ..................................................... 5-40
Figure 5-25. Colburn diagram. ............................................................................................................ 5-42
Figure 5-26. Schematic diagram of a tray-tower absorber. ................................................................... 5-44
Figure 5-27. Tray spacing correction factor. ........................................................................................ 5-46
Figure 5-28. Graphical determination of the number of theoretical plates. ........................................... 5-48
Figure 5-29. Performance monitoring instruments on an example absorber system. ................................ 53

APTI 415: Control of Gaseous Emissions — Student Guide
List of Figures Page vii
Figure 5-30. Psychrometric chart. ....................................................................................................... 5-55
Figure 5-31. Flowchart of a typical biofiltration oxidation system. ...................................................... 5-57
Figure 6-1. The effects of time and temperature on pollutant destruction efficiency. .............................. 6-4
Figure 6-2. Thermal oxidizer using multi-jet burners and baffles to promote mixing. ............................ 6-4
Figure 6-3. Oxidizer equipped with a double-pass recuperative heat exchanger. .................................... 6-5
Figure 6-4. Flowchart of a recuperative heat exchanger. ........................................................................ 6-6
Figure 6-5. Regenerative thermal oxidizer. ........................................................................................... 6-7
Figure 6-6. Flameless thermal oxidizer. ................................................................................................ 6-8
Figure 6-7. Oil-fired boiler. .................................................................................................................. 6-9
Figure 6-8. Steam-assisted Elevated Flare System. .............................................................................. 6-11
Figure 6-9. Smokeless flare tip of an elevated flare. ............................................................................ 6-11
Figure 6-10. Enclosed ground flare. .................................................................................................... 6-12
Figure 6-11. Cutaway of a catalytic oxidizer. ...................................................................................... 6-14
Figure 6-12. Catalyst bed honeycombs................................................................................................ 6-14
Figure 6-13. Close-up cross-section of a catalyst on a honeycomb....................................................... 6-15
Figure 6-14. Importance of temperature in catalytic systems. .............................................................. 6-25
Figure 6-15. Destruction efficiency curves for selected organic compounds. ....................................... 6-25
Figure 6-16. Heat balance around an oxidizer. .................................................................................... 6-27
Figure 6-17. Flowchart of a thermal oxidizer system. .......................................................................... 6-36
Figure 6-18. Flowchart of a catalytic oxidizer system.......................................................................... 6-37
Figure 7-1. Direct contact condenser. .................................................................................................... 7-2
Figure 7- 2. Ejector condenser. ............................................................................................................. 7-3
Figure 7-3. Single-pass condenser. ........................................................................................................ 7-4
Figure 7-4. 1-2 pass shell-and-tube condenser. ...................................................................................... 7-4
Figure 7-5. Extended surface tubes. ...................................................................................................... 7-5
Figure 7-6. Basic refrigeration cycle. .................................................................................................... 7-6
Figure 7-7. Simplified flowchart of a two-stage refrigeration system for organic vapor recovery. .......... 7-6
Figure 7-8. Single heat exchanger, indirect contact cryogenic system for organic vapor recovery. ......... 7-7
Figure 7-9. Dual heat exchange cryogenic system for organic vapor recovery. ...................................... 7-8
Figure 7-10. Direct contact cryogenic system for organic vapor recovery. ............................................. 7-9
Figure 7-11. Vapor pressures of organic compounds.4 ......................................................................... 7-10
Figure 7-12. Heat transfer resistances. ................................................................................................ 7-16
Figure 7-13. Temperature profiles in a heat exchanger for co-current flow, countercurrent flow, and
isothermal condensation with countercurrent flow......................................................... 7-17

APTI 415: Control of Gaseous Emissions — Student Guide
List of Figures Page viii
Figure 7-14. Graphical representation of Problem 7-3. ........................................................................ 7-22
Figure 8-1. Distribution of Nitrogen Oxides Emissions. ........................................................................ 8-4
Figure 8-2. Pulverized coal-fired boiler. ................................................................................................ 8-6
Figure 8-3. Simple cycle gas turbine. .................................................................................................... 8-8
Figure 8-4. Combined cycle gas turbine ................................................................................................ 8-9
Figure 8-5. Typical combustor. ........................................................................................................... 8-10
Figure 8-6. Municipal waste incinerator. ............................................................................................. 8-11
Figure 8-7. Coal or wood-fired spreader stoker boiler. ........................................................................ 8-12
Figure 8-8. Staged combustion using overfire air ports. ....................................................................... 8-19
Figure 8-9. Biased firing. .................................................................................................................... 8-19
Figure 8-10. Burners out-of-service. ................................................................................................... 8-20
Figure 8-11. Flue gas recirculation (FGR). .......................................................................................... 8-21
Figure 8-12. Example of a controlled flow split flame low NOx burner............................................... 8-22
Figure 8-13. Example of a dual register low NOx burner. .................................................................... 8-23
Figure 8-14. Gas reburning. ................................................................................................................ 8-24
Figure 8-15. Temperature sensitivity of SNCR reactions. .................................................................... 8-26
Figure 8-16. Ammonia slip emissions. ................................................................................................ 8-27
Figure 8-17. Boiler with SNCR injection nozzles. ............................................................................... 8-28
Figure 8-18. SCR configuration. ......................................................................................................... 8-29
Figure 8-19. Static pressure drop versus process operating rate. .......................................................... 8-37
Figure 9-1. Conversion of fuel sulfur. ................................................................................................... 9-5
Figure 9-2. Simplified flowchart of a lime scrubbing system. ................................................................ 9-8
Figure 9-3. Dual alkali scrubber system. ............................................................................................... 9-9
Figure 9-4. Simplified flowchart of the magnesium oxide process. ...................................................... 9-11
Figure 9-5. Simplified flowchart of a spray dryer type dry scrubber. ................................................... 9-13
Figure 9-6. Dry injection dry scrubber flowchart. ................................................................................ 9-14
Figure 9-7. Flowchart of dry scrubber using a spray absorber vessel and dry injection recycle stream. 9-15
Figure 9-8. Absorption of SO2 into water. ........................................................................................... 9-17
Figure 9-9. Absorption of SO2 in alkaline slurry. ................................................................................ 9-18
Figure 10-1. Contribution of GHG to total U.S. emissions. ................................................................. 10-3
Figure 10-2. Annual percent change in U.S. greenhouse gas emissions. .............................................. 10-3
Figure 10-3. Emissions allocated to economic sectors ......................................................................... 10-4
Figure 10-4. Emissions with electricity distributed to economic sectors. ............................................. 10-4

APTI 415: Control of Gaseous Emissions — Student Guide
List of Figures Page ix
Figure 10-5. U.S. greenhouse gas emissions and sinks by Chapter/IPCC Sector. ................................. 10-5
Figure 10-6. Schematic of an industrial boiler system. ........................................................................ 10-9
Figure 10-7. Flow diagram of the pulp and paper manufacturing process. ......................................... 10-12
Figure 10-8. Diagram for cement manufacturing preheater process. .................................................. 10-16
Figure 10-9. General flow diagram of the iron and steel industry. Source: GHG Control Measures White
Papers (EPA 2010). .................................................................................................... 10-19
Figure 10-10. Contribution of different emission sources to the nationwide CO2 equivalent GHG
emissions from petroleum refineries. Source: GHG Control Measures White Papers ( EPA
2010). ......................................................................................................................... 10-21
Figure 10-11. GHG emissions from petroleum refineries. ................................................................. 10-22
Figure 10-12. Direct CO2 emissions from fuel consumption and indirect CO2 emissions from electricity
and steam purchases at U.S. petroleum refineries from 2003 to 2008........................... 10-23
Figure 10-13. Yara secondary N2O control from nitric acid production .................................................. 68
Figure 10-14. N2O emissions from secondary controls – CDM projects. ............................................ 10-70
Figure 10-15. Uhde combination N2O and NOX control for nitric acid production plants. .................. 10-71
Figure 10-16. Uhde EnviNOX® reactor in Linz, Austria. ................................................................... 10-72
Figure 10-17. N2O emissions from tertiary controls. ......................................................................... 10-73
Figure A-18. Positive and negative gauge pressures. .............................................................................A-7
Figure A-19. The fahrenheit and celsius temperature scales. .................................................................A-9
APTI 415: Control of Gaseous Emissions — Student Guide
List of Tables Page ix
LIST OF TABLES Table 1-1. Organic compounds NOT classified as VOCs. ..................................................................... 1-5
Table 1-2. Organic HAP compounds. ................................................................................................... 1-7
Table 1-3. Global warming potentials (GWP) and atmospheric lifetimes (years). ............................... 1-12
Table 1-4. SO2 emissions by source category, 1970 and 2008. ............................................................ 1-14
Table 1-5. NOx emissions by source category, 1970 and 2008. ........................................................... 1-15
Table 1-6. VOC emissions by source category, 1970 and 2008. .......................................................... 1-15
Table 1-7. New source performance standards for fossil fuel-fired electric power generating facilities. 1-19
Table 1-8. National ambient air quality standards. ............................................................................... 1-20
Table 2-1. LEL and UEL at room temperature and ambient oxygen concentration................................. 2-3
Table 2-2. Summary of the general applicability of gaseous contaminant techniques. .......................... 2-17
Table 3-1. Codes for utility streams. ..................................................................................................... 3-3
Table 3-2. Minor components. .............................................................................................................. 3-4
Table 3-3. Instrument codes. ................................................................................................................. 3-5
Table 3-4. Codes for construction materials. ......................................................................................... 3-6
Table 3-5. Baseline data for the hazardous waste incinerator. ................................................................ 3-9
Table 3-6. Gas temperature profile for the hazardous waste incinerator (oC). ....................................... 3-11
Table 3-7. Gas static pressure profile for the hazardous waste incinerator (in W.C.). ........................... 3-11
Table 3-8. Static pressures and static pressure drops (in. W.C.). .......................................................... 3-14
Table 3-9. Gas temperatures (°F). ....................................................................................................... 3-14
Table 3-10. Commonly recommended transport velocities. ................................................................. 3-28
Table 4-1. Physical properties of major types of adsorbents. ................................................................. 4-5
Table 4-2. Summary of the characteristics of chemisorption................................................................ 4-18
Table 4-3. Examples of organic compounds suitable for carbon adsorption. ........................................ 4-22
Table 4-4.Organic compounds not usually suitable for carbon adsorption............................................ 4-23
Table 5-1. Equilibrium Partial pressure of ammonia over aqueous solutions, mm Hg. ......................... 5-20
Table 5-2. Packing data*. ................................................................................................................... 5-36
Table 5-3. Tray spacing parameters. ................................................................................................... 5-45
Table 5-4. Gas velocities through mist eliminators. ............................................................................. 5-50
Table 6-1. Auto-ignition temperatures. ............................................................................................... 6-18
Table 6-2a. Enthalpies of combustion gases, Btu/SCF. ........................................................................ 6-29
Table 7-1. Antoine constants. ............................................................................................................. 7-12

APTI 415: Control of Gaseous Emissions — Student Guide
List of Tables Page x
Table 7-2. Typical overall heat transfer coefficients ............................................................................ 7-16
Table 8-1. General range of NOx suppression efficiencies. .................................................................. 8-31
Table 9-1. Common types of FGD processes for boilers.5 ..................................................................... 9-7
Table 10-1. CO2 Emission factors for coal by coal rank. ..................................................................... 10-7
Table 10-2. Nationwide GHG emissions from pulp and paper manufacturing. ................................... 10-13
Table 10-3. Direct GHG emission sources at pulp, paper, and paperboard facilities. .......................... 10-14
Table 10-4. CO2 emission intensity (lb/MMBtu). .............................................................................. 10-17
Table 10-5. Estimates of GHG emissions from iron and steel manufacturing. .................................... 10-20
Table 10-6. Default N2O emission factors. ........................................................................................ 10-24
Table 10-7. Uncontrolled N2O emissions – CDM projects. ................................................................ 10-25
Table 10-8. Existing coal-fired EGU efficiency improvements reported for actual efficiency improvement
projects. ......................................................................................................................... 10-29
Table 10-16. N2O emission test results – secondary controls. ............................................................ 10-69

APTI 415: Control of Gaseous Emissions — Student Guide
List of Acronyms Page ii
LIST OF ACRONYMS
ACRONYM DEFINITION
ACFM Actual cubic square feet per minute BACT Best available control technology
CAAA Clean Air Act Amendments
CEM Continuous emission monitors CFC Chlorofluorocarbon
Cgs Centimeter gram second
DAS Data acquisition
DP Differential pressure FGD Flue gas desulfurization
FGR Flue gas recirculation
FID Flame ionization detector FRP Fiberglass reinforced plastic
GFC Gas filter correlation
HAP Hazardous air pollutants HFL Hydrofluoric fluoride
HTU Height of transfer unit
LEL Lower explosive level
L/G Liquid-to-gas MACT Maximum achievable control technology
MSDS Material data safety sheets
MTZ Mass transfer zone MW Molecular weight
NAAQS National Ambient Air Quality Standards
NDIR Nondispensive infrared
NDUV Nondispersive ultraviolet NESHAP National Emission Standards for Hazardous Air
Pollutants
NSPS New Source Performance Standards NTU Number of transfer units
OFA Overfire air parts
ORD Office of Research and Development P&I Piping and instrumentation
PID Photoionization detector
Psi Pounds per square inch
SCFM Standard cubic feet per minute SCR Selective catalytic reduction
SIP State implementation plan
SLA Solvent laden air SNCR Selective noncalytic reduction system
TRS Total reduced sulfur
UEL Lower explosive limit VOC Volatile organic compound
W.C Water column

APTI 415: Control of Gaseous Emissions — Student Guide
List of Acronyms Page iii
APPENDIX A 1.0 Introduction to Gaseous Emissions ............................................................................................ 1-2
1.1 Introduction ........................................................................................................................ 1-2
1.2 Introduction to Gaseous Pollutants ...................................................................................... 1-2
1.3 Emission Rates and Sources of Gaseous Pollutants ............................................................ 1-12
1.4 Pollution Control ............................................................................................................... 1-16
1.5 Summary........................................................................................................................... 1-21
1.6 Review Exercises .............................................................................................................. 1-22
1.7 Review Exercises: Solutions .............................................................................................. 1-24
1.8 References ........................................................................................................................ 1-25
2.0 Control Techniques For Gaseous Contaminants ....................................................................... 2-1
2.1 Overview ............................................................................................................................ 2-1
2.2 Gas Stream Characteristics .................................................................................................. 2-1
2.3 Gaseous Contaminant Control Techniques........................................................................... 2-8
2.4 Summary........................................................................................................................... 2-18
2.5 Review Exercises .............................................................................................................. 2-19
2.6 Review Exercises: Solutions .............................................................................................. 2-21
2.7 References ........................................................................................................................ 2-23
3.0 Air Pollution Control Systems .................................................................................................... 3-1
3.1 Overview ............................................................................................................................ 3-1
3.2 Flowcharts .......................................................................................................................... 3-1
3.3 Hoods ............................................................................................................................... 3-16
3.4 Fans .................................................................................................................................. 3-29
3.5 Summary........................................................................................................................... 3-47
3.6 Review Exercises .............................................................................................................. 3-48
3.7 Review Exercises: Solutions .............................................................................................. 3-52
3.8 References ........................................................................................................................ 3-60
4.0 Adsorption ................................................................................................................................ 4-31
4.1 Overview ............................................................................................................................ 4-1
4.2 Types and Components of Adsorption Systems ................................................................... 4-2
4.3 Operating Principles .......................................................................................................... 4-15
4.4 Adsorption System Performance........................................................................................ 4-22
4.5 Performance Monitoring.................................................................................................... 4-35
APTI 415: Control of Gaseous Emissions — Student Guide
List of Acronyms Page iv
4.6 Summary........................................................................................................................... 4-41
4.7 Review Exercises .............................................................................................................. 4-42
4.8 Review Exercises: Solutions .............................................................................................. 4-47
4.9 References ........................................................................................................................ 4-53
5.0 Absorption .................................................................................................................................. 5-1
5.1 Overview ............................................................................................................................ 5-1
5.2 Types and Components of Absorbers................................................................................... 5-2
5.3 Operating Principles .......................................................................................................... 5-19
5.4 Capability and Sizing ........................................................................................................ 5-23
5.5 Instrumentation ................................................................................................................. 5-52
5.6 Summary........................................................................................................................... 5-58
5.7 Review Exercises .............................................................................................................. 5-59
5.8 Review Exercises: Solutions .............................................................................................. 5-63
5.9 References ........................................................................................................................ 5-68
6.0 Oxidation..................................................................................................................................... 6-2
6.1 Overview ............................................................................................................................ 6-2
6.2 Types and Components of Oxidizer Systems ....................................................................... 6-3
6.3 Operating Principles .......................................................................................................... 6-17
6.4 Capability and Sizing ........................................................................................................ 6-26
6.5 Operating Parameters and Instrumentation......................................................................... 6-36
6.6 Summary........................................................................................................................... 6-38
6.7 Review Exercises .............................................................................................................. 6-39
6.8 Review Exercises: utions ................................................................................................... 6-42
6.9 References ........................................................................................................................ 6-46
7.0 Condensation .............................................................................................................................. 7-1
7.1 Overview ............................................................................................................................ 7-1
7.2 Types of Systems ................................................................................................................ 7-2
7.3 Operating Principles ............................................................................................................ 7-9
7.4 Capability and Sizing ........................................................................................................ 7-11
7.5 Summary........................................................................................................................... 7-22
7.6 Review Exercises .............................................................................................................. 7-23
7.7 Review Exercises: Solutions .............................................................................................. 7-26
7.8 References ........................................................................................................................ 7-28
8.0 Control Techniques for Nitrogen Oxides ................................................................................... 8-2
8.1 Overview ............................................................................................................................ 8-2

APTI 415: Control of Gaseous Emissions — Student Guide
List of Acronyms Page v
8.2 Nitrogen Oxides Formation ................................................................................................. 8-3
8.3 Sources of Nitrogen Oxides ................................................................................................. 8-5
8.4 Types and Components of NOx Control Techniques .......................................................... 8-12
8.5 Capability and Sizing ........................................................................................................ 8-31
8.6 Evaluating Performance .................................................................................................... 8-33
8.7 Summary........................................................................................................................... 8-38
8.8 Review Exercises .............................................................................................................. 8-39
8.9 Review Exercises: Solutions .............................................................................................. 8-43
8.10 References....................................................................................................................... 8-47
9.0 Sulfur Oxides Control ................................................................................................................. 9-2
9.1 Overview ............................................................................................................................ 9-2
9.2 Types and Components of Sulfur Oxides Control Systems ................................................... 9-3
9.3 Operating Principles .......................................................................................................... 9-17
9.4 Sulfur Oxides Control Systems Capability and Sizing ........................................................ 9-23
9.5 SO2 Continuous Emission Monitoring ............................................................................... 9-26
9.6 Summary........................................................................................................................... 9-31
9.7 Review Exercises .............................................................................................................. 9-32
9.8 Review Exercise: Solutions ............................................................................................... 9-34
9.9 References ........................................................................................................................ 9-37
10.0 Control Techniques for Greenhouse Gas Emissions ................................................................ 10-1
10.1 Overview ......................................................................................................................... 10-1
10.2 Greenhouse Gas Emission Sources ................................................................................... 10-2
10.3 GHG Emissions from Industrial Sources .......................................................................... 10-5
10.3.1 GHG Emissions from Coal-Fired EGUs .................................................................. 10-6
10.3.2 GHG Emissions from Large Industrial/Commercial/ Institutional Boilers .............. 10-8
10.3.3 GHG Emissions from Pulp and Paper Manufacturing ......................................... 10-11
10.3.4 GHG Emissions from Cement Manufacturing..................................................... 10-15
10.3.5 GHG Emissions from Iron and Steel Industry ..................................................... 10-17
10.3.6 GHG Emissions from Petroleum Refining ........................................................... 10-20
10.3.7 GHG Emissions From Nitric Acid Plants .............................................................. 10-23
10.4 Efficiency Improvements Across Industrial Sectors ......................................................... 10-25
10.5 GHG Emission Controls for Industrial Sectors .................................................................. 10-28
10.5.1 Emission Controls for Coal-Fired EGUs ............................................................... 10-28
10.5.2 Emission Controls for Industrial, Commercial, and Institutional Boilers ............ 10-31
10.5.3 Emission Controls for Pulp and Paper Manufacturing......................................... 10-40
APTI 415: Control of Gaseous Emissions — Student Guide
List of Acronyms Page vi
10.5.4 Emission Controls for Cement Manufacturing .................................................... 10-43
10.5.5 Emission controls for Petroleum Refining .......................................................... 10-56
10.5.6 Emission Controls for Nitric Acid Plants ............................................................ 10-66
10.4 Additional Resources for GHG Emission Control ........................................................... 10-75
10.5 Summary......................................................................................................................... 10-76
10.6 Review Exercises ............................................................................................................ 10-77
10.7 Review Exercise Solutions ............................................................................................. 10-78
10.8 References ..................................................................................................................... 10-80
A.1 Units and Systems of Units..................................................................................................A-1
A.2 Force and Mass ...................................................................................................................A-2
A.3 Mixtures, Mass, and Mole Fractions ....................................................................................... 4
A.4 Molecular Weight (Molar Mass) ............................................................................................. 5
A.5 Pressure ................................................................................................................................. 6
A.6 Temperature ........................................................................................................................... 8
A.7 Equation of State .................................................................................................................. 10
A.8 Standard Conditions ............................................................................................................. 11
A.9 Flow Rate............................................................................................................................. 12
A.10 Summary............................................................................................................................. 14
A.11 Review Exercises ................................................................................................................. 15
A.12 Review Exercise Solutions ................................................................................................... 16
LIST OF FIGURES
Figure A-1. Positive and negative gauge pressures. .................................................................................. 7
Figure A-2. The Fahrenheit and Celsius temperature scales. ..................................................................... 9
LIST OF TABLES Table A-1. Basic Quantities of Measure and Standard Units .................................................................... 1
Table A-2. Conversion Factors for the Standard Units ............................................................................. 2
APTI 415: Control of Gaseous Emissions — Student Guide
Chapter 2: Control Techniques for Gaseous Contaminants Page 2-1
COURSE INTRODUCTION
Course Topics Covered
This course includes ten chapters which cover the following topics:
Introduction to Control of Gaseous Emissions
Control Techniques for Gaseous Pollutants
Air Pollution Control Systems
Adsorption
Absorption
Oxidation
Condensation
Control Techniques for Nitrogen Oxides
Control Techniques for Sulfur Oxides
Control of Greenhouse Gas Emissions
COURSE COMPLETION REQUIREMENTS
Upon conclusion of this each chapter, participants will complete a two-part assessment that includes several review questions.
WELCOME
Welcome to Environmental Protection Agency Training Course 415: Control of Gaseous
Emissions.
Purpose
The purpose of this course is to provide general instruction about the control of gaseous emissions, as outlined by the Environmental Protection Agency (EPA).

APTI 415: Control of Gaseous Emissions — Student Guide
Chapter 1: Introduction to Gaseous Emissions Page 12
CHAPTER 1
1.0 INTRODUCTION TO GASEOUS EMISSIONS
1.1 INTRODUCTION
To comply with environmental laws, you must first understand why the laws exist and what they
are to accomplish. This lesson introduces primary and secondary gaseous pollutants, and
prepares you to recognize the sources of gaseous pollutants, as well as the regulations that pertain to them.
LEARNING OBJECTIVES
At the conclusion of this training students will be able to:
Differentiate between primary and secondary gaseous pollutants.
Identify the sources of gaseous pollutants.
Recognize the regulations that pertain to gaseous pollutants.
1.2 INTRODUCTION TO GASEOUS POLLUTANTS
A BRIEF HISTORY
The control of gaseous pollutants from industrial sources in the United States began with
efforts to recover useful raw materials and products entrained in gas streams. Some of the high-efficiency pollutant control techniques in use today had their origins in the 1940s and
1950s as low-to-moderate efficiency collectors used strictly for process purposes. Starting in
the 1950s and 1960s, control equipment for gaseous pollutants was used primarily for
environmental purposes. The environmental control programs were stimulated by concerns about (1) possible health effects, (2) apparent crop and vegetation damage, and (3) the impact
on buildings and other structures.
PRIMARY AND SECONDARY GASEOUS POLLUTANTS
Primary pollutants and secondary pollutants comprise the two main category divisions of
gaseous pollutants. Primary pollutants are compounds that are emitted by the source directly
from the stack and/or process equipment. Examples of primary pollutants include sulfur
dioxide (SO2) emissions from combustion sources and organic compound emissions from surface coating facilities. Secondary pollutants are gaseous and vapor phase compounds that
form due to reactions between primary pollutants in the atmosphere or between a primary

APTI 415: Control of Gaseous Emissions — Student Guide
Chapter 1: Introduction to Gaseous Emissions Page 13
pollutant and naturally occurring compounds in the atmosphere. Important categories of
secondary pollutants include ozone (O3) and other photochemical oxidants formed through sunlight-initiated reactions of nitrogen oxides (NOX), organic compounds, and carbon
monoxide (CO). A summary of the main categories of gaseous pollutants follows.
Examples of Primary Gaseous Pollutants
Sulfur dioxide (SO2) and sulfuric acid vapor (H2SO4)
Nitrogen oxide (NO) and nitrogen dioxide (NO2)
Carbon monoxide (CO) and partially oxidized organic compounds
Volatile organic compounds (VOCs) and other organic compounds
Hydrogen chloride (HCl) and hydrogen fluoride (HF)
Hydrogen sulfide (H2S) and other reduced sulfur compounds
Ammonia (NH3)
Examples of Secondary Gaseous Pollutants
Nitrogen dioxide (NO2)
Ozone (O3) and other photochemical oxidants
Sulfuric acid (H2SO4)
Nitrogen oxide (NO2) and sulfuric acid (H2SO4) can either be emitted directly from a stack
(primary pollutants), or be formed in the atmosphere from reactions of primary pollutants (secondary pollutants).
SULFUR DIOXIDE
Sulfur dioxide (SO2) is a colorless gas formed primarily during the combustion of a sulfur-
containing fuel, such as coal, No. 6 oil, or sulfur-containing industrial waste gases. Once
released into the atmosphere, SO2 reacts slowly because of photochemically initiated reactions and reactions with cloud and fog droplets. The rates range between approximately 0.1% and
3% per hour. These atmospheric reactions yield sulfuric acid (H2SO4), inorganic sulfate
compounds, and organic sulfate compounds. A major fraction of SO2 is ultimately captured on vegetation and soil surfaces because of adsorption and absorption. These processes are
collectively termed deposition. Rates of deposition are not accurately quantified and vary both
regionally and seasonally. SO2 is moderately soluble in water and is a strong irritant, due in
part to its solubility and tendency to form sulfurous acid (H2SO3) following absorption in water. SO2 is one of the seven criteria pollutants subject to National Ambient Air Quality
Standards (NAAQS).
SULFURIC ACID VAPOR During the combustion of sulfur-containing fuels, approximately 95% of the sulfur is converted to SO2, while 0.5% to 2% of the fuel’s sulfur is converted to sulfur trioxide (SO3).
Sulfur trioxide (SO3) remains in the vapor state until temperatures decrease below
approximately 600 °F (315 °C), this is referred to as the sulfuric acid dew point. At or below this temperature, sulfur trioxide (SO3) reacts with water to form sulfuric acid (H2SO4) as
indicated in Reaction 1-1.

APTI 415: Control of Gaseous Emissions — Student Guide
Chapter 1: Introduction to Gaseous Emissions Page 14
Reaction 1-1 SO3 + H2O H2SO4
Because of the corrosiveness of sulfuric acid, it is important to keep gas streams at
temperatures above the sulfuric acid dew point. Damage to air pollution control equipment,
ductwork, and fans can occur if the gas temperature falls below the sulfuric acid dew point in
localized areas.
NITRIC OXIDE AND NITROGEN DIOXIDE
These two compounds, collectively referred to as NOX, are formed during the combustion of all
fuels. They are also released from nitric acid plants and other industrial processes involving the
generation and/or use of nitric acid (HNO3). The term “NOX” does not include nitrous oxide (N2O), which is emitted in small quantities from some processes.
Three complex chemical mechanisms are responsible for NOX formation: (1) thermal fixation of atmospheric nitrogen (N2), (2) oxidation of organic nitrogen compounds in the fuel, and (3)
reaction with partially oxidized compounds within the flame. These mechanisms are referred to
as thermal, fuel, and prompt NOX, respectively.
Nitric oxide (NO) is an odorless gas that is insoluble in water. Nitrogen dioxide (NO2) is
moderately soluble in water and has a distinct reddish-brown color. This compound contributes
to the brown haze that is often associated with photochemical smog conditions in urban areas. At low temperatures, such as those often present in ambient air, nitrogen dioxide can form a dimer
compound (N2O4). Both compounds, but particularly NO2, are associated with adverse effects on
the respiratory tract. NO2 has been regulated since 1971 as one of the seven criteria pollutants subject to National Ambient Air Quality Standards (NAAQS).
The ambient concentrations of NO and NO2 are usually well below the NO2 NAAQS. This is due
to the rapid photochemically initiated reactions and liquid phase reactions (clouds and fog droplets) that result in the conversion of NOx in the atmosphere to secondary reaction products. In
fact, NO2 is the main chemical compound responsible for the absorption of the ultraviolet light
that drives photochemical reactions. Until the January 2010 revisions to the NO2 NAAQS standard, all regions of the country were compliant with the standard.
CARBON MONOXIDE AND OTHER PARTIALLY OXIDIZED ORGANIC COMPOUNDS
Carbon monoxide (CO) is a partially oxidized compound that results from incomplete
combustion of fuel and other organic compounds. It forms when either the gas temperature is too low to, or the oxygen concentration is insufficient to allow complete oxidation to carbon dioxide
(CO2).
Carbon monoxide is colorless, odorless, and only very slightly soluble in water. It is a chemical
asphyxiant with significant adverse health effects at high concentrations. Carbon monoxide
readily participates in photochemically initiated reactions that result in smog formation. It is
emitted from automobiles, trucks, boilers, and industrial furnaces; generally due to incomplete combustion as a result of insufficient oxygen (O2).
Partially oxidized organic compounds (POCs) refer to a broad range of species formed during the combustion process, including polyaromatic compounds, unsaturated hydrocarbon

APTI 415: Control of Gaseous Emissions — Student Guide
Chapter 1: Introduction to Gaseous Emissions Page 15
compounds, aldehydes, and organic acids. Some POCs readily condense on the surface of
particulate matter (PM) while others remain in the gas phase. Combustion conditions used to minimize the formation of NOX, such as reducing the excess O2 concentration, actually promote
the formation of CO and POCs.
VOLATILE ORGANIC COMPOUNDS OR OTHER ORGANIC COMPOUNDS
Volatile organic compounds (VOCs) are organic compounds that can volatilize and participate in photochemical reactions once released to the ambient air. Almost all of the several thousand
organic compounds used as solvents and as chemical feedstock in industrial processes are
classified as VOCs. The few organic compounds that are not considered VOCs because of their
lack of photochemical reactivity are listed in Table 1-1.
Table 1-1. Organic compounds NOT classified as VOCs.
Methane;
Ethane;
Methylene chloride (dichloromethane);
1,1,1-trichloroethane (methyl chloroform);
1,1,2-trichloro-1,2,2-trifluoroethane (CFC–113);
Trichlorofluoromethane (CFC–11);
Dichlorodifluoromethane (CFC–12);
Chlorodifluoromethane (HCFC–22);
Trifluoromethane (HFC–23);
1,2-dichloro 1,1,2,2-tetrafluoroethane (CFC–114);
Chloropentafluoroethane (CFC–115);
1,1,1-trifluoro 2,2-dichloroethane (HCFC–123);
1,1,1,2-tetrafluoroethane (HFC–134a);
1,1-dichloro 1-fluoroethane (HCFC–141b);
1-chloro 1,1-difluoroethane (HCFC–142b);
2-chloro-1,1,1,2-tetrafluoroethane (HCFC–124);
Pentafluoroethane (HFC–125);
1,1,2,2-tetrafluoroethane (HFC–134);
1,1,1-trifluoroethane (HFC–143a);
1,1-difluoroethane (HFC–152a);
Parachlorobenzotrifluoride (PCBTF);
cyclic, branched, or linear completely methylated siloxanes;
Acetone;
Perchloroethylene (tetrachloroethylene);
3,3-dichloro-1,1,1,2,2-pentafluoropropane (HCFC–225ca);
1,3-dichloro-1,1,2,2,3-pentafluoropropane (HCFC–225cb);
1,1,1,2,3,4,4,5,5,5-decafluoropentane (HFC 43–10mee);
Difluoromethane (HFC–32);
Ethylfluoride (HFC–161);
1,1,1,3,3,3-hexafluoropropane (HFC–236fa);
1,1,2,2,3-pentafluoropropane (HFC–245ca);
APTI 415: Control of Gaseous Emissions — Student Guide
Chapter 1: Introduction to Gaseous Emissions Page 16
1,1,2,3,3-pentafluoropropane (HFC–245ea);
1,1,1,2,3-pentafluoropropane (HFC–245eb);
1,1,1,3,3-pentafluoropropane (HFC–245fa);
1,1,1,2,3,3-hexafluoropropane (HFC–236ea);
1,1,1,3,3-pentafluorobutane (HFC–365mfc);
Chlorofluoromethane (HCFC–31);
1 chloro-1-fluoroethane (HCFC–151a);
1,2-dichloro-1,1,2-trifluoroethane (HCFC–123a);
1,1,1,2,2,3,3,4,4-nonafluoro-4-methoxy-butane (C4F9OCH3 or HFE–7100);
2-(difluoromethoxymethyl)-1,1,1,2,3,3,3-heptafluoropropane ((CF3)2CFCF2OCH3);
1-ethoxy-1,1,2,2,3,3,4,4,4-nonafluorobutane (C4F9OC2H5or HFE–7200);
2-(ethoxydifluoromethyl)-1,1,1,2,3,3,3-heptafluoropropane ((CF3)2CFCF2OC2H5);
1,1,1,2,2,3,3-heptafluoro-3-methoxypropane (n-C3F7OCH3, HFE–7000);
3-ethoxy-1,1,1,2,3,4,4,5,5,6,6,6-dodecafluoro-2-(trifluoromethyl) hexane (HFE–7500);
1,1,1,2,3,3,3-heptafluoropropane (HFC 227ea);
Methyl formate (HCOOCH3);
1,1,1,2,2,3,4,5,5,5-decafluoro-3-methoxy-4-trifluoromethyl-pentane (HFE–7300);
Propylene carbonate;
Dimethyl carbonate;
Methyl acetate and perfluorocarbon compounds which fall into these classes:
(i) Cyclic, branched, or linear completely fluorinated alkanes (ii) Cyclic, branched, or linear completely fluorinated ethers with no unsaturations
(iii) Cyclic, branched, or linear completely fluorinated tertiary amines with no unsaturations
(iv) Sulfur containing perfluorocarbons with no unsaturations and with sulfur bonds only to
carbon and fluorine
Refer to 40 CFR 51.100(s) for future listings.
Hazardous Air Pollutants (HAPs)
The dominant source of VOC emissions is the vaporization of organic compounds used as
solvents in industrial processes; however, VOCs are also released during surface coating operations, painting, gasoline distribution, and synthetic organic chemical manufacturing.
VOC emissions may be categorized as either contained or fugitive. Contained VOC emissions
are those that are captured in hoods, penetrate through the air pollution control equipment, and are released from the stack. Fugitive emissions consist of those that escape from process hoods
as well the numerous small leaks from pumps, valves, pipe joints or connectors and other
process equipment, especially in the pressurized components of a process.
Approximately 200 specific organic compounds and classes of compounds that have known
adverse health effects are regulated and classified as hazardous air pollutants (HAP list, Section
112(b) of the Clean Air Act). These compounds are subject to Maximum Achievable Control Technology (MACT) standards promulgated by EPA. A partial list of the more common
hazardous air pollutants is presented in Table 1-2.
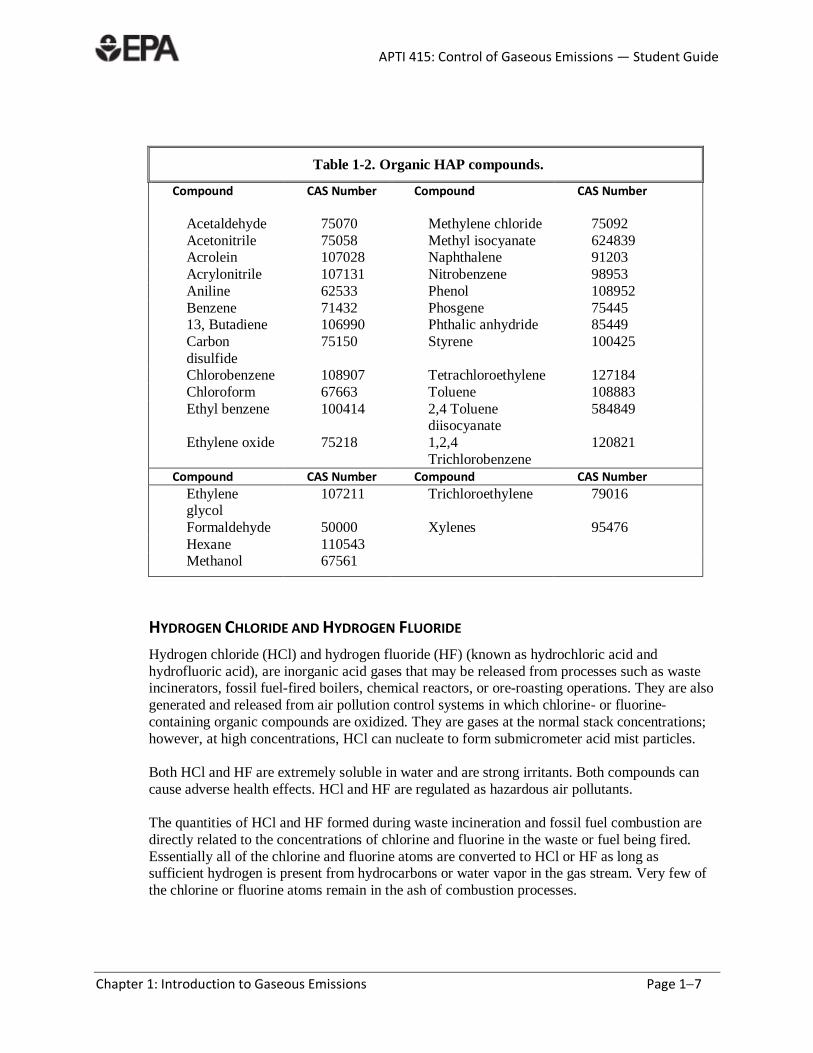
APTI 415: Control of Gaseous Emissions — Student Guide
Chapter 1: Introduction to Gaseous Emissions Page 17
Table 1-2. Organic HAP compounds.
Compound CAS Number Compound CAS Number
Acetaldehyde 75070 Methylene chloride 75092
Acetonitrile 75058 Methyl isocyanate 624839 Acrolein 107028 Naphthalene 91203
Acrylonitrile 107131 Nitrobenzene 98953
Aniline 62533 Phenol 108952
Benzene 71432 Phosgene 75445 13, Butadiene 106990 Phthalic anhydride 85449
Carbon
disulfide
75150 Styrene 100425
Chlorobenzene 108907 Tetrachloroethylene 127184
Chloroform 67663 Toluene 108883
Ethyl benzene 100414 2,4 Toluene diisocyanate
584849
Ethylene oxide 75218 1,2,4
Trichlorobenzene
120821
Compound CAS Number Compound CAS Number
Ethylene glycol
107211 Trichloroethylene 79016
Formaldehyde 50000 Xylenes 95476
Hexane 110543 Methanol 67561
HYDROGEN CHLORIDE AND HYDROGEN FLUORIDE
Hydrogen chloride (HCl) and hydrogen fluoride (HF) (known as hydrochloric acid and
hydrofluoric acid), are inorganic acid gases that may be released from processes such as waste incinerators, fossil fuel-fired boilers, chemical reactors, or ore-roasting operations. They are also
generated and released from air pollution control systems in which chlorine- or fluorine-
containing organic compounds are oxidized. They are gases at the normal stack concentrations;
however, at high concentrations, HCl can nucleate to form submicrometer acid mist particles.
Both HCl and HF are extremely soluble in water and are strong irritants. Both compounds can
cause adverse health effects. HCl and HF are regulated as hazardous air pollutants.
The quantities of HCl and HF formed during waste incineration and fossil fuel combustion are
directly related to the concentrations of chlorine and fluorine in the waste or fuel being fired.
Essentially all of the chlorine and fluorine atoms are converted to HCl or HF as long as sufficient hydrogen is present from hydrocarbons or water vapor in the gas stream. Very few of
the chlorine or fluorine atoms remain in the ash of combustion processes.

APTI 415: Control of Gaseous Emissions — Student Guide
Chapter 1: Introduction to Gaseous Emissions Page 18
Chlorine-, fluorine-, bromine-, or other halogen-containing organic compounds are part of the
larger group of “halogenated hydrocarbons,” some of which can contribute to the degradation of stratospheric ozone and, in the opinion of many experts, to global warming/climate change. This
includes hydrochlorocarbons (HCCs), hydrofluorocarbons (HFCs), hydrochlorofluorocarbons
(HCFCs), chlorofluorocarbons (CFCs), perfluorocarbons (PFCs), etc.
HYDROGEN SULFIDE AND OTHER TOTAL REDUCED SULFUR COMPOUNDS
Hydrogen sulfide (H2S) is emitted from a number of metallurgical, petroleum, and
petrochemical processes. Fugitive emissions of H2S occur from sour natural gas wells and certain petrochemical processes. H2S is a highly toxic chemical asphyxiant. Despite its strong
rotten-egg odor, it is often difficult to detect at high concentrations due to rapid olfactory fatigue.
H2S is highly soluble in water and can be easily oxidized to form sulfur dioxide. Total reduced sulfur compounds (TRSs) are emitted primarily from kraft pulp mills and consist primarily of
the following four chemicals.
Hydrogen sulfide, H2S
Methyl mercaptan, CH3SH
Dimethyl sulfide, (CH3)2S
Dimethyl disulfide, (CH3) 2S2
All have extremely strong and unpleasant odors. Facilities generating TRS compounds have
been subject to source-specific control regulations since the early 1970s due to the associated
odor problems. All of these compounds are water-soluble. They all participate readily in
atmospheric reactions that eventually yield sulfur dioxide as the main reaction product. TRS compounds are usually controlled by oxidation.
AMMONIA
Ammonia (NH3) is a common chemical used in a large number of synthetic organic chemical
manufacturing processes. Emissions of ammonia from such sources are usually quite small and
are well below the natural emissions from microbial activity. Ammonia is not considered to be toxic at the levels generated by anthropogenic or natural emissions and is not regulated as a
hazardous air pollutant.
Ammonia is of interest in Course 415 primarily because it is a reactant in two main types of NOx
control systems. A small fraction of the ammonia fed to these NOX control systems can be
emitted to the atmosphere, and these emissions are regulated in some states.
OZONE AND OTHER PHOTOCHEMICAL OXIDANTS
Ozone (O3) is an oxidant that forms in the troposphere (at ground level) as a result of evolving photochemically initiated reactions between nitrogen oxides, volatile organic compounds, and
carbon monoxide. Course 415 does not explicitly cover the control of ozone because it is a
secondary pollutant. Control of ozone is achieved by the control of precursor compounds such
as NOx, VOCs, and CO.
The general cycle of pollutant concentrations associated with photochemical reactions is
illustrated in Figure 1-1. The reactions typically begin quickly in the mid-to-late morning

APTI 415: Control of Gaseous Emissions — Student Guide
Chapter 1: Introduction to Gaseous Emissions Page 19
following the increase in concentrations of NOx, organic compounds, and CO from motor
vehicles and other sources. Photochemically initiated reactions rapidly convert NO to NO2. The formation of NO2 further stimulates the photochemical smog-forming reactions because nitrogen
dioxide is very efficient in absorbing ultraviolet light.
Figure 1-1. Pollutant concentration profiles due to photochemical reactions.
Explanation of Figure 1-1
As the NO2 concentration peaks and then decreases as it is consumed to form particulate matter (PM) and vapor phase nitrates. As the NO2 concentration drops, the levels of ozone rise rapidly.
Along with the increase in ozone, the levels of various partial oxidation products also increase.
Some of the photochemical reaction products are in the form of particulate matter (PM) that scatters light.
The formation of ozone is greatest during the “ozone season,” usually defined as May through
September. The intensity of sunlight for the photochemically initiated reactions is highest during this time period, and the high temperatures promote thermal reactions associated with the
photochemical reactions.
Ozone can also form, to a limited extent, in clean rural environments. The “pollutants” involved in
these reactions are low levels of organic compounds emitted from vegetation and low levels of
NOx emitted from natural biological activity. While the photochemical reactions are similar to those found in polluted urban areas, the concentrations of rural ozone are limited by the low
concentrations of NOx usually present.
In the stratosphere, ozone forms naturally from the irradiation of molecular oxygen by sunlight. The presence of ozone in the stratosphere is beneficial because it absorbs ultraviolet radiation
from the sun. The stratospheric ozone concentrations are decreasing over North America because
of the presence of ozone-depleting chlorinated and fluorinated organic compounds and nitrous oxide (N2O) compounds that are not especially reactive near the Earth's surface. Once these
compounds are transferred convectively to the stratosphere, they can initiate free radical chain
reactions that reduce the equilibrium concentrations of ozone. The depletion of ozone in the stratosphere is not within the scope of this course.

APTI 415: Control of Gaseous Emissions — Student Guide
Chapter 1: Introduction to Gaseous Emissions Page 110
The control of precursor gases, such as NOx, to minimize ground level (or tropospheric) ozone
concentrations, will not have an adverse effect on the beneficial ozone levels in the stratosphere. The formation mechanisms for ozone in the stratosphere are different from those in the
troposphere.
LEAD
Lead is a metal found naturally in the environment as well as in manufactured products. It occurs
both in its elemental form, Pb, as well as in compounds. Airborne lead compounds are designated as HAPs and may cause a range of health effects, from behavioral problems and learning
disabilities, to seizures and death. Lead is persistent in the environment and accumulates in soils
and sediments through deposition from air sources, direct discharge of waste streams to water
bodies, mining, and erosion. Depending on the level of exposure, lead can adversely affect the nervous system, kidney function, immune system, reproductive and developmental systems and
the cardiovascular system.
The major anthropogenic sources of lead emissions have historically been motor vehicles (such as
cars and trucks) and industrial sources. As a result of the EPA’s regulatory efforts to reduce lead
in gasoline, air emissions of lead from the transportation sector, and particularly the automotive sector, have greatly declined over the past three decades. Today industrial processes, primarily
metals processing, are the major source of lead emissions to the air. The highest air
concentrations of lead are usually found near lead smelters. Other stationary sources are waste
incinerators, utilities, and lead-acid battery manufacturers.
MERCURY
Mercury enters the environment as a result of both natural and human activities. While elemental mercury (Hg) is toxic to humans, the methylmercury ion (CH3Hg
+) is the compound of most
concern. Methylmercury is formed from other forms of mercury by microbial action in sediments
and soils, and is taken up by aquatic organisms and bioaccumulates in the aquatic food chain.
Other Sources of Mercury Emissions
Anthropogenic mercury enters the atmosphere primarily due to the combustion of coal and other
fossil fuels that contain trace quantities of mercury. Other significant sources of mercury emissions include certain chlor-alkali chlorine manufacturing processes, mining operations, metal
refining, and products that contain elemental mercury, such as batteries, lamps, and thermometers.
Mercury Reduction Efforts
The EPA has focused most of its mercury reduction efforts on large point source emissions from
chlor-alkali facilities and combustion sources ranging from power plants and industrial boilers to
hazardous waste and medical incinerators. Significant reductions in mercury emissions have already been made, and total air emissions in 1999 were estimated to be only about one-half of the
1990 emissions. The greatest emission reductions during that period occurred from municipal
waste and medical waste incinerators. In 2010, the EPA proposed regulations to control mercury emissions from industrial boilers. These regulations were finalized in January 2011. These
regulations will reduce mercury emissions from these sources by approximately 7 tons per year. In
March 2011, the EPA also proposed regulations to significantly limit air toxics emissions from
coal- and oil-fired power plants.
APTI 415: Control of Gaseous Emissions — Student Guide
Chapter 1: Introduction to Gaseous Emissions Page 111
GREENHOUSE GASES AND EMISSION SOURCES
Greenhouse gases trap heat in the atmosphere. In the absence of greenhouse gases, the earth would
be too cold to sustain human life. However, in the opinion of many experts, the increasing
concentrations of greenhouse gases (principally CO2) since the beginning of the industrial revolution have led to global warming. The most important greenhouse gases that enter the
atmosphere as a result of human activity are carbon dioxide, methane, nitrous oxide, and
fluorinated gases. Information about each of these greenhouse gases follow.
Carbon Dioxide
Carbon Dioxide (CO2) is a primary product from the combustion of fossil fuels (coal, oil, and natural gas), solid waste, and trees and other wood products. Significant amounts are also liberated
during the manufacture of cement and other products. CO2 is removed from the atmosphere by
plants as part of the natural biological carbon cycle and by dissolution into the oceans. In the
opinion of many experts, in recent times, the rate of emissions is exceeding the rate of removal, and the average CO2 concentration has been increasing at a rate of one to three ppm/yr.
Methane
Methane (CH4 ) discharges to the atmosphere during the production and transportation of coal, oil,
and natural gas. CH4 emissions also result from livestock and other agricultural activities and from the decay of organic waste.
Nitrous Oxide
Nitrous Oxide (N2O) is emitted from the combustion of fossil fuels. Quantities are much smaller
than the emissions of NO and NO2. Historically, the majority of N2O emissions are a result of
agricultural activities.
Fluorinated Gases
Fluorinated Gases such as hydrofluorocarbons, perfluorocarbons, and sulfur hexafluoride are greenhouse gases that are emitted from various industrial processes. A large fraction of the
fluorinated gases were introduced as substitutes for stratospheric ozone-depleting chlorinated
gases (CFCs and HCFCs). The absolute quantities are small, although their greenhouse warming potential is high.
GLOBAL WARMING POTENTIAL
Different greenhouse gases have widely different potential impacts, which are measured by the
Global Warming Potential (GWP). Among other factors, the GWP depends on the average atmospheric lifetime of individual greenhouse gases. CO2 was chosen as the reference point and
assigned a GWP of 1.0. Estimated atmospheric lifetimes and GWPs of the major greenhouse gases
are summarized in Table 1-3.

APTI 415: Control of Gaseous Emissions — Student Guide
Chapter 1: Introduction to Gaseous Emissions Page 112
Table 1-3. Global warming potentials (GWP) and atmospheric lifetimes (years).
Gas Atmospheric Lifetime 100-Year GWP
Carbon dioxide, CO2 50-200 1
Methane, CH4 12±3 21
Nitrous oxide, N2O 120 310 Fluorinated gases as a group 1.5–209 140–23,900
1.3 EMISSION RATES AND SOURCES OF GASEOUS POLLUTANTS
ANNUAL EMISSION RATES
The gaseous pollutants emphasized in this course include sulfur dioxide, nitrogen oxides, and
organic compounds (including VOCs). Emissions data from the EPA emissions inventory for
SO2, NOx, and VOC, for the period 1970–2008, are shown in Figure 1-2. Significant emissions reductions in each pollutant have been achieved. On a percentage basis, the reductions range
from 63% for SO2 to 54% for VOC to 40% for NOX. These reductions were achieved in spite of
population increases and economic growth during the time period.
SO2 emission reductions have been reasonably steady throughout the period. NOX emissions
were relatively constant from 1970 to 1995, while reductions have accelerated since that time. VOC emissions decreased steadily from 1970 to 2000, but there was a significant increase
between 2000 and 2005. However, the increase was reversed between 2005 and 2008.
Controls on the release of mercury to the atmosphere are just now being implemented and emissions data are relatively scarce. EPA estimates that the annual emission rate of 220 short
tons per year in 1990 was reduced to 115 short tons per year by 1999.
Figure 1-2. SO2, NOx, and VOC emissions history.

APTI 415: Control of Gaseous Emissions — Student Guide
Chapter 1: Introduction to Gaseous Emissions Page 113
Estimated annual emissions of greenhouse gases between 1990 and 2006 are shown in Figure
1-3. The units on the ordinate are teragrams of CO2 equivalent (1 teragram = 1012
g). That is,
emissions of CH4 and other greenhouse gases are multiplied by their global warming potential
so that the total emissions are on a CO2-equivalent basis. We see that CO2, with the smallest GWP of one, is easily the most significant greenhouse gas, followed by CH4, N2O, and the
fluorinated compounds. To put the numbers into somewhat better perspective, the 1990
emissions rate of 6.14 Tg is the equivalent of 6.14 x 10⁶ short tons. The overall data show an
approximate 15% increase in GHG emissions during the 1990–2006 period.
Figure 1-3. Estimated greenhouse gas emissions in terms of CO2- equivalent.
EMISSION SOURCE CATEGORIES
The total emissions described in the previous section are subdivided into source categories, and
2008 results compared to the 1970 values for SO2 (Table 1-4), NOX (Table 1-5), and VOCs
(Table 1-6). Table 1-4 shows that 1970 SO2 emissions were dominated by fuel combustion in
electric utilities, followed by metal processing and fuel combustion in industrial boilers.
The three fuel combustion categories – electric utilities, industrial, and other – accounted for
about 75% of the total. Highway and off-highway vehicles, in contrast, accounted for only about 2% of the total. All source categories (except “other”) experienced large decreases between 1970
and 2008, with the largest percentage decrease (95%) associated with metals processing. Electric
utility emissions decreased by 57% during that time, but remained the largest source category. The reductions were accomplished by installing flue gas desulfurization processes and by
switching to lower sulfur content fuels. Reductions occurred in spite of a large increase in
demand for electricity during that time period.
Greenhouse Emissions by Gas
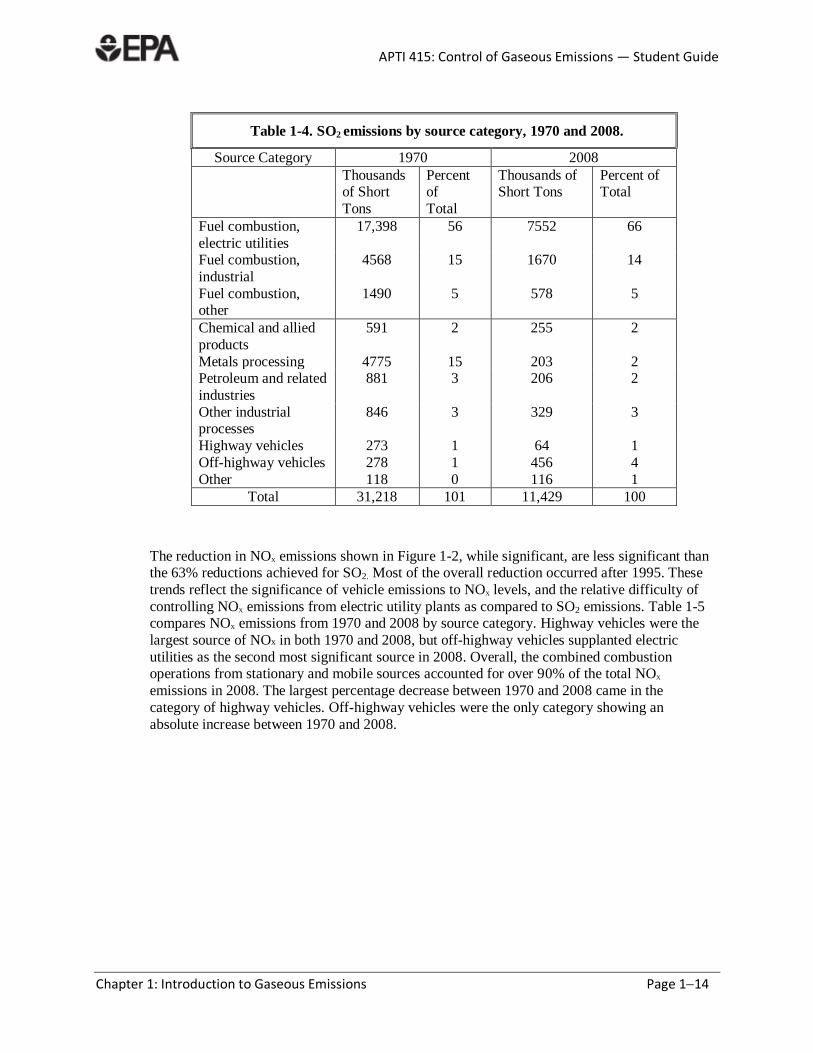
APTI 415: Control of Gaseous Emissions — Student Guide
Chapter 1: Introduction to Gaseous Emissions Page 114
Table 1-4. SO2 emissions by source category, 1970 and 2008.
Source Category 1970 2008
Thousands of Short
Tons
Percent of
Total
Thousands of Short Tons
Percent of Total
Fuel combustion,
electric utilities
17,398 56 7552 66
Fuel combustion,
industrial
4568 15 1670 14
Fuel combustion, other
1490 5 578 5
Chemical and allied
products
591 2 255 2
Metals processing 4775 15 203 2 Petroleum and related
industries
881 3 206 2
Other industrial processes
846 3 329 3
Highway vehicles 273 1 64 1
Off-highway vehicles 278 1 456 4
Other 118 0 116 1
Total 31,218 101 11,429 100
The reduction in NOX emissions shown in Figure 1-2, while significant, are less significant than the 63% reductions achieved for SO2. Most of the overall reduction occurred after 1995. These
trends reflect the significance of vehicle emissions to NOX levels, and the relative difficulty of
controlling NOX emissions from electric utility plants as compared to SO2 emissions. Table 1-5 compares NOX emissions from 1970 and 2008 by source category. Highway vehicles were the
largest source of NOx in both 1970 and 2008, but off-highway vehicles supplanted electric
utilities as the second most significant source in 2008. Overall, the combined combustion operations from stationary and mobile sources accounted for over 90% of the total NOX
emissions in 2008. The largest percentage decrease between 1970 and 2008 came in the
category of highway vehicles. Off-highway vehicles were the only category showing an
absolute increase between 1970 and 2008.

APTI 415: Control of Gaseous Emissions — Student Guide
Chapter 1: Introduction to Gaseous Emissions Page 115
Table 1-5. NOx emissions by source category, 1970 and 2008.
Source Category 1970 2008
Thousands of Short Tons
Percent of Total
Thousands of Short Tons
Percent of Total
Fuel combustion, electric utilities
4900 18 3006 18
Fuel combustion, industrial
4325 16 1838 11
Fuel combustion, other
836 3 727 4
Highway vehicles 12,624 47 5206 32 Off-highway vehicles 2652 10 4255 26 Other 1545 6 1307 8
Total 26,882 100 16,339 99
VOC emissions, shown in Figure 1-2, decreased significantly from 1970 to 2000, but then increased by about 5% between 2000 and 2005 before dropping off again between 2005 and
2008. Overall, between 1970 and 2008, the VOC emissions decreased by 54%. Table 1-6
compares VOC emissions during 1970 and 2008 by source category. Highway vehicles, followed by solvent utilization were the largest emitting source categories in 1970. Emissions
from highway vehicles were due primarily to evaporative emissions from gasoline tanks. By
2008, however, reductions in vehicle evaporative losses had decreased to the point that solvent
utilization had become the largest source, and highway vehicle losses being second place. Unlike SO2 and NOX emissions, combustion processes contribute only a small amount of the
VOC emissions.
Table 1-6. VOC emissions by source category, 1970 and 2008.
Source Category 1970 2008
Thousands of
Short Tons
Percent of
Total
Thousands of
Short Tons
Percent of
Total
Fuel combustion, electric
utilities
30 0 50 0
Fuel combustion, industrial 150 0 130 1
Fuel combustion, other 541 2 1269 8
Chemicals manufacture 1341 4 228 1
Petroleum industry 1194 3 561 4
Solvent utilization 7174 21 4226 27
Storage and transport 1954 6 1303 8 Waste disposal & recycling 1984 6 374 2
Highway vehicles 16,910 47 3418 21
Off-highway vehicles 1616 5 2586 16
Other 1765 5 1782 11
Total 34,659 99 15,927 99
APTI 415: Control of Gaseous Emissions — Student Guide
Chapter 1: Introduction to Gaseous Emissions Page 116
MERCURY EMISSIONS
According to available data, the most significant sources of mercury emissions in 1990 were
municipal solid waste incinerators, coal-fired electric utility boilers, and medical waste
incinerators. Each of these categories contributed about 25% of the total. Relatively small additional mercury emissions were contributed by institutional boilers, chlorine production,
hazardous waste incineration, gold mining, and “other.” According to the data, by 1999,
mercury had been largely eliminated from municipal waste and medical waste incinerators, and coal-fired utility boilers contributed about 40% of the total estimated emissions of 115 short
tons. CO2, the dominant greenhouse gas, was associated almost entirely with fuel combustion,
both in stationary and mobile sources. CH4 is emitted during the production and transport of
coal, oil, and natural gas, by livestock and other agricultural practices, and by the decay of organic materials in municipal solid waste landfills. Nitrous oxide (N2O) is emitted from
agricultural and industrial activities, and small amounts are emitted during combustion of fossil
fuels. The fluorinated gases, many of which were introduced as substitutes for ozone-depleting chlorinated compounds, are emitted in small quantities from a number of industrial sources.
1.4 POLLUTION CONTROL
GASEOUS POLLUTION CONTROL REGULATIONS
Pollution Control
From 1950 through 1970, gaseous pollutant control regulations were enacted by state and local
agencies for pollutants such as SO2, VOCs, and HF. These regulations were aimed at alleviating
localized health and welfare effects relating to these emissions.
The Clean Air Act
Public environmental awareness that began to increase during the 1950s and 1960s culminated in
the enactment of the Clean Air Act of 1970 (CAA). This act strengthened the federal program and was associated with the formation of the U.S. EPA from a variety of agencies sharing
environmental responsibility before this time. The CAA substantially increased the pace of
gaseous pollutant control. Since 1970, a myriad of new regulations have been established, many of these apply, in one way or another, to gaseous emissions. The following paragraphs provide
only a brief overview of the most important laws and regulations that have been developed.
National Ambient Air Quality Standards
In 1971, the EPA circulated primary and secondary National Ambient Air Quality Standards
(NAAQS) for sulfur dioxide, nitrogen oxides, photochemical oxidants, and carbon monoxide. These standards were based on available ambient air monitoring and health/welfare effects
research data. The country was divided into a number of Air Quality Control Regions, each of
which was intended to reflect common air pollution problems. Areas whose measured ambient concentrations exceeded the NAAQS levels were labeled as nonattainment areas for the specific
gaseous pollutant. Nonattainment areas were required to devise a set of emission regulations and
other procedures that would reduce the particular pollutant concentration in the ambient air to

APTI 415: Control of Gaseous Emissions — Student Guide
Chapter 1: Introduction to Gaseous Emissions Page 117
levels below the NAAQS specified limit. Both primary and secondary standards have been
specified for certain compounds. Primary standards are more restrictive and are designed to protect human health. Secondary standards are intended to reduce adverse material effects, such
as crop damage and building soiling.
New Source Performance Standards (NSPS)
Individual states are responsible for developing control strategies for the achievement of the
NAAQS as part of the State Implementation Plan (SIP) required by the Clean Air Act. Emission regulations were adopted by many state and local agencies to ensure that the NAAQS would be
met.
These emission regulations take different forms in different areas. For example, in some areas, regulations limit SO2 emissions by specifying a maximum sulfur content (e.g., ≤ 1% sulfur by
weight) on the fuel being burned. In other instances, emission limitations for SO2 and NOX are
based on an allowable mass per unit of heat input (e.g., 0.1 lb NOX /MM Btu) or strictly on a concentration basis (e.g., 500 ppm). Likewise, emissions of VOCs are restricted based on the
allowable mass per unit time (e.g., pounds per hour) or a VOC content per unit of coating.
Regulations were adopted to control process-related fugitive emissions. Because of the diversity
of these sources and the difficulty of measuring these emissions, these regulations have taken
many forms, including (1) required work practices, (2) leak detection and repair programs, and
(3) hood capture efficiency requirements.
Regulations adopted under SIPs apply to existing sources within the state. There are substantial
differences in the stringency of the regulations from state to state, depending on the pollutant control strategy believed necessary and advantageous to achieve the NAAQS.
The CAA also stipulated that New Source Performance Standards (NSPS) were to be developed on a nationwide basis to apply to all new (and substantially modified) sources. The purpose of
the NSPS was to ensure continued improvements in air quality as new sources replaced existing
sources. The EPA adopted these NSPSs on a source category-specific basis. Sources subject to
these regulations are required to install air pollution control systems that represent the “best demonstrated technology” for that particular source category. The first set of NSPS standards
(often termed Group I) included emission limitations for SO2 and NOX from large combustion
sources. The EPA has included continuous monitoring requirements in many of the new and revised NSPS standards applicable to SO2 and NOX emissions.
National Emission Standards for Hazardous Air Pollutants (NEHAPs)
The CAA also authorized the promulgation of especially stringent regulations for pollutants
considered to be highly toxic or hazardous. EPA was charged with identifying these pollutants and developing appropriate regulations to protect human health. The set of regulations that apply
to toxic or hazardous chemicals is titled the National Emission Standards for Hazardous Air
Pollutants (NESHAPs). Because of regulatory complexities occurring from 1971 to 1990, only a
few of these were promulgated, and none of these involved gaseous pollutants.
APTI 415: Control of Gaseous Emissions — Student Guide
Chapter 1: Introduction to Gaseous Emissions Page 118
Clean Air Act Amendments Expansion of NESHAPs
The Clean Air Act Amendments of 1990 required a major revision and expansion of NESHAPs.
Regulations have been developed for 187 specific compounds and classes of compounds,
including many that are normally in gaseous form. Sources subject to NESHAPs are required to
limit emissions to levels consistent with Maximum Achievable Control Technology (MACT). The MACT requirements are based on technology currently used by the best performing sources
within that category.
NEW SOURCE REVIEW
Before construction begins, new sources (or major modifications to existing sources) are required to undergo a New Source Review (NSR) and receive a pre-construction permit. In areas where
NAAQS are currently satisfied, the permit is based on Prevention of Significant Deterioration
(PSD) requirements. PSD requires the use of Best Available Control Technology (BACT). BACT is determined on a case-by-case evaluation that considers energy, environmental, and
economic impact. In areas where the NAAQS are not satisfied, the NSR permit requires that new
emissions must be offset with emission reductions from other sources and to install Lowest
Achievable Emissions Rate (LAER) technology. Under LAER the applicant must achieve (1) the most stringent emission limitation in the SIP for a similar source or (2) the most stringent
emission achieved in practice.
In 1997, EPA added a new NAAQS applicable to particulate matter (PM) having a diameter
equal to or less than 2.5 μm (termed PM2.5). EPA concluded that the PM2.5 NAAQS were needed
because health effects research indicated that particulate matter in this size category is most closely associated with adverse health effects. Control of PM2.5 is directly relevant to APTI 413,
Control of Particulate Emissions, but it is also important to gaseous emission control because
atmospheric chemistry research indicates that the atmospheric reactions of SO2, NOX, VOCs and
CO have a significant role in the formation of PM2.5 particles. The PM2.5 regulations will continue to drive gaseous pollutant control in the future.
Mercury is one of the 187 compounds defined as a hazardous or toxic material and is, therefore, subject to NESHAP regulations. In addition, there are mercury-specific laws and regulations. For
example, the Mercury Containing and Rechargeable Battery Management Act of 1996 required
phasing out the use of mercury in batteries. The Resource Conservation and Recovery Act
(RCRA) set emission limits for the incineration of mercury-containing hazardous waste.
The Clean Air Mercury Rule (CAMR), issued in 2005, and subsequently overturned by federal
court action in 2008, was meant to establish the first-ever limitations on mercury emissions from coal-fired power plants. The EPA proposed air toxics standards for coal- and oil-fired electric
generating units in 2011, but these are not yet final. No specific limitations on mercury from
coal-fired power plants currently exist as a result of the court action.
Currently, there are no U.S. limitations on greenhouse gas emissions. However, the anticipation
of future regulations has spurred research in the use of non-carbon energy sources and in the
capture and sequestration of carbon from fossil fuels. In October of 2009 the EPA released the Mandatory GHG Emission Reporting Rule requiring large sources and suppliers to report their
GHG emissions. This information will be used by the EPA to inform future GHG rulemaking
decisions. In addition, in May of 2010 the EPA released the GHG Tailoring Rule, which sets

APTI 415: Control of Gaseous Emissions — Student Guide
Chapter 1: Introduction to Gaseous Emissions Page 119
GHG emissions thresholds to define when permits under the NSR, PSD, and Title V Operating
Permit programs are required for new and existing industrial facilities. Future regulations of GHG under the CAA are anticipated to be promulgated and phased-in over the coming years.
NEW SOURCE PERFORMANCE STANDARDS (NSPS)
New source performance standards have been promulgated for about 70 industrial categories.
Because of their legal standing, the standards are quite complex and require a lawyer for full interpretation. An abbreviated and simplified version of the NSPS for fossil fuel–fired electric
power generation facilities is presented in Table 1-7. This is meant only to provide a rough guide
for this course and should not be used in actual work. Complete New Source Performance Standards may be found in the Code of Federal Regulations, 40 CFR Part 60, Subpart Da.
The performance standard for SO2 from any fuel type is 1.2 lbm/106 Btu heat input, along with
90% reduction from the amount that would be emitted in the absence of controls. If, however, the
emission rate is less than 0.6 lbm/106 Btu heat input, only 70% reduction from the uncontrolled rate
is required. Separate NOx emission standards and reduction requirements have been promulgated
for different fuel types. The different emission standards generally reflect differences in the nitrogen content of the fuel.
Table 1-7. New source performance standards for fossil fuel-fired
electric power generating facilities.
Category Fuel Type Emission Limit Reduction
Requirement
Particulate
Matter
Solid 0.015 lbm/106 BtuA 99.9%
SO2 Liquid 1.4 lbm/MWh 95%
SO2 Coal Refuse 1.4 lbm/MWh 94%
<0.6 lbm/106 Btu 70%
NOx Solid 0.5 lbm/106 Btu 65%
NOx Liquid 0.3 lbm/106 Btu 30%
NOx Gas 0.2 lbm/106 Btu 20%
NOx 1.0 lbm/MWh
NOx Liquid Backup
FuelB
1.5 lbm/MWh
A: The owner/operator of a facility with a PM Continuous Emission Monitoring System (CEMS)
may elect to comply with an alternate 0.14 lbm/MWh standard.
B: For the owner/operator of an IGCC facility
NATIONAL AMBIENT AIR QUALITY STANDARDS
National Ambient Air Quality Standards (NAAQS), shown in Table 1-8, have been circulated for seven criteria pollutants. Separate standards exist for particulate matter depending on particle
size. PM2.5 refers to particles with diameters less than 2.5 microns (μm), while PM10 refers to
particles with diameters less than 10 microns (μm). SO2 has its own primary and secondary standards, while the primary and secondary standards for the other pollutants are the same.
Primary standards are designed to protect public health, including the health of sensitive

APTI 415: Control of Gaseous Emissions — Student Guide
Chapter 1: Introduction to Gaseous Emissions Page 120
populations such as asthmatics, children, and the elderly. Secondary standards are designed to
protect public welfare, including protection against decreased visibility and damage to animals, crops, vegetation, and buildings. These standards also have legal meaning, and their
interpretation can be quite complex as indicated by the extensive list of explanatory material
below the table. Notice that some of the standards have changed with time as continued research
expands the knowledge base concerning the pollutant effects.
Table 1-8. National ambient air quality standards.
(1) Not to be exceeded more than once per year. (2) Final rule signed October 15, 2008. (3) The official level of the annual NO2 standard is 0.053 ppm, equal to 53 ppb, which is shown here for the
purpose of clearer comparison to the 1-hour standard (4) To attain this standard, the 3-year average of the 98th percentile of the daily maximum 1-hour average at each
monitor within an area must not exceed 100 ppb (effective January 22, 2010). (5) Not to be exceeded more than once per year on average over 3 years. (6) To attain this standard, the 3-year average of the weighted annual mean PM2.5 concentrations from single or
multiple community-oriented monitors must not exceed 15.0 µg/m3. (7) To attain this standard, the 3-year average of the 98th percentile of 24-hour concentrations at each population-
oriented monitor within an area must not exceed 35 µg/m3 (effective December 17, 2006). (8) To attain this standard, the 3-year average of the fourth-highest daily maximum 8-hour average ozone
concentrations measured at each monitor within an area over each year must not exceed 0.075 ppm. (effective May 27, 2008)
(9) (a) To attain this standard, the 3-year average of the fourth-highest daily maximum 8-hour average ozone concentrations measured at each monitor within an area over each year must not exceed 0.08 ppm. (b) The 1997 standard—and the implementation rules for that standard—will remain in place for implementation purposes as EPA undertakes rulemaking to address the transition from the 1997 ozone standard to the 2008 ozone standard. (c) EPA is in the process of reconsidering these standards (set in March 2008).

APTI 415: Control of Gaseous Emissions — Student Guide
Chapter 1: Introduction to Gaseous Emissions Page 121
(10) (a) EPA revoked the 1-hour ozone standard in all areas, although some areas have continuing obligations under that standard ("anti-backsliding"). (b) The standard is attained when the expected number of days per calendar year with maximum hourly average concentrations above 0.12 ppm is < 1.
(11) (a) Final rule signed June 2, 2010. To attain this standard, the 3-year average of the 99th percentile of the
daily maximum 1-hour average at each monitor within an area must not exceed 75 ppb.
Explanation of Figure 1-4
EPA data showing the number of people living in counties with pollutant concentrations above
NAAQS levels during 2007 are shown in Figure 1-4. All counties were in compliance with the
NAAQS for CO, NOX, and SO2. Significant fractions of the population were exposed to ozone (O3) and PM2.5 concentrations that exceeded the standard, while smaller numbers were exposed
to Lead (Pb) and PM10 concentrations in excess of their respective standards. Much of the
difficulty in reaching the ozone standard stems from the fact that ozone is a secondary
pollutant. Direct emissions of ozone are negligible and control strategies must address ozone precursors, many of which are naturally occurring.
Figure 1-4. Number of people living in counties with air quality concentrations
above the level of the NAAQS in 2007.
1.5 SUMMARY
CONTROL OF GASEOUS EMISSIONS
This lesson provided an overview of the following:
Differences between primary and secondary gaseous pollutants.
Emission rates and sources of gaseous pollutants.
Air quality regulations pertaining to gaseous emissions.

APTI 415: Control of Gaseous Emissions — Student Guide
Chapter 1: Introduction to Gaseous Emissions Page 122
1.6 REVIEW EXERCISES
INSTRUCTIONS
Select the best response(s) for each of the following multiple-choice questions.
MULTIPLE CHOICE QUESTIONS
1. What fraction of the sulfur present in a fossil fuel (i.e., coal, oil) is converted to sulfur dioxide in a utility or industrial boiler?
a. 25% to 30% b. 50% to 75%
c. 75% to 90%
d. 94% to 95%
2. What factors influence the formation of NOx in a boiler?
a. Temperature b. Oxygen concentration
c. Fuel nitrogen content
d. All of the above
3. Which categories of air pollutants are responsible for the formation of photochemical smog?
Select all that apply.
a. Volatile organic compounds (VOC)
b. Nitrogen oxides (NOx) c. Sulfur dioxide (SO2)
d. Carbon monoxide (CO)
4. Ozone is a ______________ air pollutant.
a. primary
b. secondary
5. Which category of sources is most responsible for VOC emissions?
a. Transportation (automobiles, trucks, aircraft)
b. Fuel handling and distribution
c. Solvent utilization d. Fuel combustion
6. Which category of sources is most likely to be responsible for sulfur dioxide emissions?

APTI 415: Control of Gaseous Emissions — Student Guide
Chapter 1: Introduction to Gaseous Emissions Page 123
a. Utility and industrial boilers
b. Industrial processes c. Transportation
d. None of the above
7. Which category of sources has the highest NOx emissions?
a. Transportation (automobiles, trucks, aircraft) b. Fuel handling and distribution
c. Solvent utilization
d. Fuel combustion (electric utilities)
8. When were National Ambient Air Quality Standards (NAQS) initiated for sulfur dioxide?
a. 1961 b. 1970
c. 1977
d. 1990
9. What type of regulation limits the emission of toxic pollutants?
a. New Source Performance Standards (NSPS)
b. National Ambient Air Quality Standards (NAAQS)
c. Maximum Achievable Control Technology Standards (MACTs) d. Best Available Control Technology (BACT)
10. Why are VOC emissions controlled?
a. To achieve the ozone NAAQS
b. To achieve the hydrocarbon NAAQS c. To achieve the NOx NAAQS
d. To achieve the MACTs

APTI 415: Control of Gaseous Emissions — Student Guide
Chapter 1: Introduction to Gaseous Emissions Page 124
1.7 REVIEW EXERCISES: SOLUTIONS
This Student Guide includes separate exercises and solutions, which allow students to check their work.
MULTIPLE CHOICE ANSWERS
1. What fraction of the sulfur present in a fossil fuel (i.e., coal, oil) is converted to sulfur
dioxide in a utility or industrial boiler?
a. 25% to 30%
b. 50% to 75% c. 75% to 90%
d. 94% to 95%
2. What factors influence the formation of NOx in a boiler?
a. Temperature
b. Oxygen concentration
c. Fuel nitrogen content
d. All of the above
3. Which categories of air pollutants are responsible for the formation of photochemical smog? Select all that apply.
a. Volatile organic compounds (VOC)
b. Nitrogen oxides (NOx) c. Sulfur dioxide (SO2)
d. Carbon monoxide (CO)
4. Ozone is a ______________ air pollutant.
a. primary
b. secondary
5. Which category of sources is most responsible for VOC emissions?
a. Transportation (automobiles, trucks, aircraft) b. Fuel handling and distribution
c. Solvent utilization
d. Fuel combustion

APTI 415: Control of Gaseous Emissions — Student Guide
Chapter 1: Introduction to Gaseous Emissions Page 125
6. Which category of sources is most likely to be responsible for sulfur dioxide emissions?
a. Utility and industrial boilers
b. Industrial processes
c. Transportation d. None of the above
7. Which category of sources has the highest NOx emissions?
a. Transportation (automobiles, trucks, aircraft) b. Fuel handling and distribution
c. Solvent utilization
d. Fuel combustion (electric utilities)
8. When were National Ambient Air Quality Standards (NAQS) initiated for sulfur
dioxide?
a. 1961
b. 1970 c. 1977
d. 1990
9. What type of regulation limits the emission of toxic pollutants?
a. New Source Performance Standards (NSPS) b. National Ambient Air Quality Standards (NAAQS)
c. Maximum Achievable Control Technology Standards (MACTs)
d. Best Available Control Technology (BACT)
10. Why are VOC emissions controlled?
a. To achieve the ozone NAAQS
b. To achieve the hydrocarbon NAAQS
c. To achieve the NOx NAAQS d. To achieve the MACTs
1.8 REFERENCES
1. National Air Quality and Emissions Trend Report, 1997; EPA 454/R-98-016; U.S.
Environmental Protection Agency, Office of Air Quality Planning and Standards: Research
Triangle Park, NC, 1998.