coupling bubble and material dynamics to model …€¦ · coupling bubble and material dynamics...
TRANSCRIPT
Paper No.xx-xxxx [DOI: 10.1299/xxx.2014xxx000x] © 2016 The Japan Society of Mechanical Engineers
1
Bulletin of the JSME
(DRAFT)
Coupling bubble and material dynamics to
model cavitation peening and pitting
Georges L. Chahine1, Anil Kapahi1, Chao-Tsung Hsiao1, and Jin-Keun Choi1 1DYNAFLOW, INC.
10621-J Iron Bridge Rd, Jessup, MD, 20794, USA
E-mail: [email protected]
Received 25 February 2016
Abstract
The effects of cavitation bubble dynamics on material peening and pitting is investigated numerically using a
coupled fluid and material dynamics approach. The model is applied here to the study of peening and pitting of
metallic materials resulting from non-spherical cavitation bubble collapse near the material. Bubble reentrant jet
impact and shock wave emission from the jet impact and from the collapse of the remaining bubble ring can
induce permanent micro-deformation, pitting, and residual stresses, which modify the roughness of the material
and harden it through pre-stressing. These effects are investigated through a parametric study for different bubble
material standoff distances. Quantities such as bubble collapse peak pressure, pit depth, and residual stresses
depend strongly on bubble standoff distance, which is an important factor in whether hardening or erosion of the
material occurs.
Key words : peening, pitting, erosion, fluid-structure interaction
1. Introduction
Cavitation is known for its deleterious effects such as loss of performance, noise, and material erosion (Kim et al.).
It initiates when the local pressure in the liquid drops below a critical pressure (e.g. the liquid vapor pressure) due to local
high velocities or accelerations of the liquid and this drives nuclei (microbubbles always present in liquids) to grow
explosively. When the pressure along the path of these bubbles returns to a high value, volume implosions occur resulting
in high pressure pulses and shock waves. Many pioneering studies (Plesset and Chapman)(Naude and Ellis) have shown,
experimentally as well as analytically, that the collapse of these bubbles near boundaries result in high-speed reentrant
liquid jets, which penetrate the highly deformed bubbles and strike the nearby rigid boundary generating water hammer
like impact pressures followed by remaining bubble volume collapse and emission of shock waves. Both shock waves
and high-speed reentrant liquid jets produce high local stresses in the adjacent material and are responsible for material
deformation and damage.
Useful applications of cavitation are expanding and include disinfection (Loraine et al.), organic components
oxidation (Kalumuck et al.), material cleaning (Georges L. Chahine et al.), and material strengthening through peening
(Nalla et al.). When the intensity of the stresses generated by bubble collapse exceeds the yield strength of the material,
permanent deformation and residual stresses remain in the material, which can increase its yield strength and harden it.
This loading mechanism can be done in a controlled manner to increase the life of the material against fatigue through
cavitation peening (Odhiambo). This phase of accumulation of residual stress is also related to the incubation period of
material erosion and pitting. Therefore, cavitation can result in desired residual stresses improving the fatigue life of
material or to damaging erosion and mass loss depending upon its intensity and duration of exposure.
Some of the critical material problems involve local fracture and initiation of corrosion at the surface. Therefore, the
life of equipment and its resistance to corrosion depends on its surface properties. Various methods, both chemical and
mechanical, have been used to improve the surface properties of metallic materials (Bhushan and Gupta). One of the
mechanical surface treatments is peening (Kanou et al.), which involves purposely creating local plastic deformations
Chahine, Kapahi, Hsiao and Choi, Mechanical Engineering Journal, Vol.00, No.00 (2016)
[DOI: 10.1299/xxx.2016xxx000x] © 2016 The Japan Society of Mechanical Engineers
leading to work hardening of the metal and imparting of residual compressive stresses (Wang et al.). This results in
improved fatigue life as the imparted compressive stresses prohibit the propagation of micro-cracks from the surface to
the bulk of the material.
Several methods have been developed for peening each using a different mechanism to impact the worked material
surface and induce plastic micro-deformation. These include solid collision, liquid collision, and laser treatment. One of
the first methods based on solid collisions involves usage of metallic shots in the form of impacting solid particles and is
named “shot peening” (e.g. Kobayashi et al. 1998). It is a cold working process with the projectiles being accelerated by
compressed air jets. This has been used for treating turbine discs (Taricco), engine parts (Zhuang and Wicks), landing
gears (Jayaraman et al.), airframe components (Sharp et al.), nuclear reactor vessel (Hur et al.), .. etc. Other methods
involve wet shot peening (“Microstructure and Fatigue Properties of Ti-6Al-4V Titanium Alloy Treated by Wet Shot
Peening of Ceramic Beads--《The Chinese Journal of Nonferrous Metals》2013 年 01 期”) ultrasonic shot peening
(Abramov et al.) and laser peening (Peyre et al.; Mannava et al.). In the ultrasonic and laser peening, cavitating bubbles
are formed from the deposited energy, which then collapse sending shock waves inside the material to be peened. Also,
liquid collision peening methods are applied (Grinspan and Gnanamoorthy), which use droplet impact from a high speed
liquid jet and are used in boiling and pressurized water reactors (Morinaka et al.). For submerged liquid jet peening, or
cavitating jets peening (Chahine, Choi, and Frederick), the load on the material is also due to bubble collapse (Odhiambo).
Cavitating jets are used for cleaning, cutting, drilling, and for controlled evaluation of materials’ resistance to cavitation
erosion (Chahine, Franc, and Karimi). The cavitation intensity can be varied in a wide range through adjustment of the
jet velocity, diameter, angle, standoff distance relative to the worked surface, and the ambient pressure in which they are
discharged.
The work presented here considers the fundamental mechanisms of the interaction between a collapsing bubble and
a nearby material. It describes detailed simulations of single bubble collapse near a material and models both the bubble
dynamics and the material response in order to demonstrate both peening leading to beneficial residual stresses and pitting
which is a precursor to erosion and damage.
2. Methodology
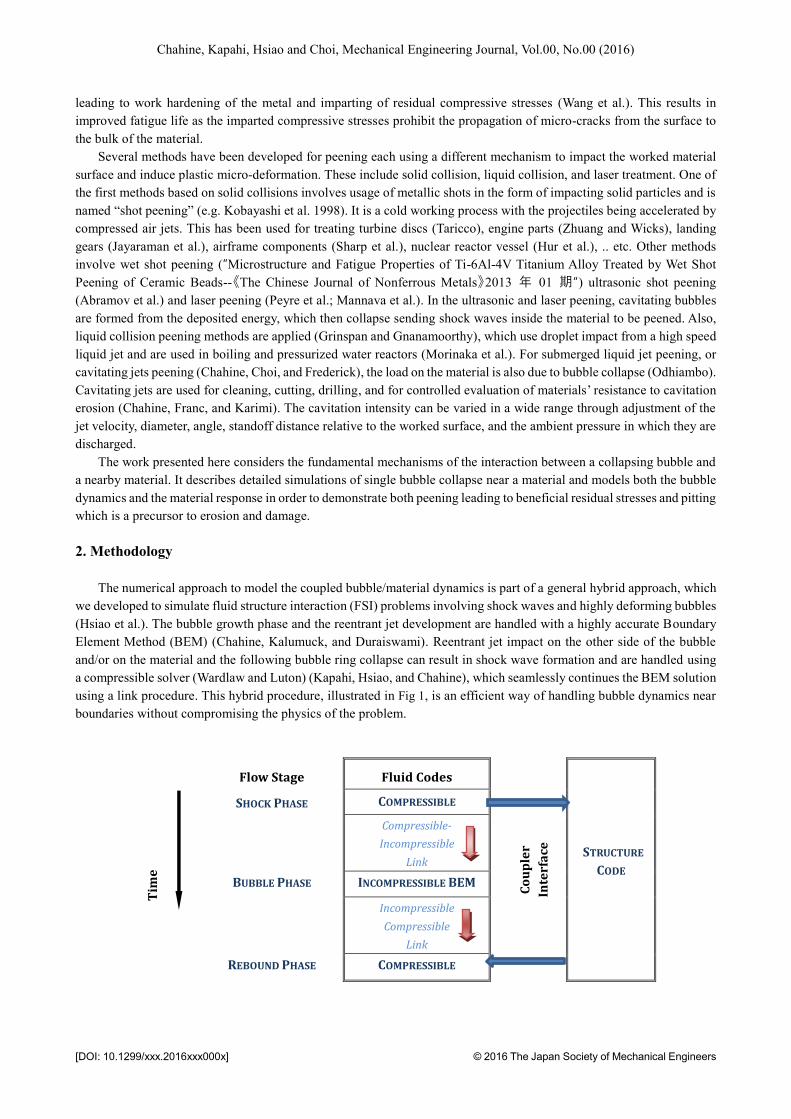
The numerical approach to model the coupled bubble/material dynamics is part of a general hybrid approach, which
we developed to simulate fluid structure interaction (FSI) problems involving shock waves and highly deforming bubbles
(Hsiao et al.). The bubble growth phase and the reentrant jet development are handled with a highly accurate Boundary
Element Method (BEM) (Chahine, Kalumuck, and Duraiswami). Reentrant jet impact on the other side of the bubble
and/or on the material and the following bubble ring collapse can result in shock wave formation and are handled using
a compressible solver (Wardlaw and Luton) (Kapahi, Hsiao, and Chahine), which seamlessly continues the BEM solution
using a link procedure. This hybrid procedure, illustrated in Fig 1, is an efficient way of handling bubble dynamics near
boundaries without compromising the physics of the problem.
Flow Stage Fluid Codes
Co
up
ler
Inte
rfa
ce
STRUCTURE
CODE
Tim
e
SHOCK PHASE COMPRESSIBLE
Compressible-
Incompressible
Link
BUBBLE PHASE INCOMPRESSIBLE BEM
Incompressible
Compressible
Link
REBOUND PHASE COMPRESSIBLE

Chahine, Kapahi, Hsiao and Choi, Mechanical Engineering Journal, Vol.00, No.00 (2016)
[DOI: 10.1299/xxx.2016xxx000x] © 2016 The Japan Society of Mechanical Engineers
Fig 1. Schematic diagram of the numerical approach used to simulate the interaction between a highly inertial bubble or a
cavitation bubble and a structure.
The dynamics of the material is modeled using the finite element model DYNA3D (McKeown et al.). In the results
shown in this work, metallic alloys Aluminum 7075 and Stainless Steel A2205 are used to illustrate cavitation peening
and pitting. These were selected because this study was part of an extensive series of simulations and tests reported in
(Kim et al.). These metallic alloys are modeled using an elastic-plastic model with linear slopes, one for the initial elastic
regime and the second, a tangent modulus, for the plastic regime (Dill). The details of various numerical algorithms used
for this work are given below.
2.1 Boundary Element Model
The Boundary Element Method (BEM) is used to model the incompressible liquid phase of the bubble dynamics
(Chahine and Kalumuck). The Laplace equation, 2 0, is solved for the velocity potential, , defined through
u , where u is the velocity vector. Green’s theorem is used to solve the Laplace equation
2 2G G d G G d
nS
S. (1)
In this expression is the domain of integration having elementary volume d andS includes all boundary surfaces of
such as the surface of the modeled bubble and the nearby surface to be cleaned. n is the local normal unit vector and
1/G x y is Green's function, where x corresponds to a fixed point in and y is a field point on the boundary surface
S. Eq. (1) reduces to Green’s formula
( ) ( ) ( , ) ( , ) ( ) ,S
Ga G dS
n n
x y x y x y y (2)
where a is the solid angle under which x sees the domain, . Eq. (2) provides a relationship between and /n at
the boundary surfaceS.Thus, if either of these two variables (e.g. ) is known everywhere on the surface, the other
variable (e.g. /n) can be obtained.
To solve Eq. (2) numerically, the surfaces of all objects in the computational domain are discretized into triangular
panels. To advance the solution in time, the coordinates of all surface nodes, y, are advanced according to /d dt y .
The velocity potential on the bubble surface nodes is obtained through the time integration of the material derivative of
, i.e. d/dt, which can be written as
. ,d
dt t
(3)
where /t can be determined from the Bernoulli equation:
1.
2lgz p p
t
. (4)
p is the hydrostatic pressure at infinity at z=0 where z is the vertical coordinate. lp is the liquid pressure at the bubble
surface, which balances the internal pressure and the surface tension,
l v gp p p C , (5)
where is the surface tension, and C is the local bubble wall curvature. The bubble internal pressure is composed of vp
the vapor pressure and gp the gas pressure. gp is assumed to follow a polytropic law, which relates the gas pressure to
the gas volume, ,V and reference value, 0gp , and 0V .
0 ,
k
g gp p
0
V
V (6)
where k is a gas compression constant; 1k corresponds to isothermal compression, while /p vk c c corresponds to
adiabatic compression. In this model, as in the conventional Rayleigh-Plesset bubble dynamics model (Plesset and
Prosperetti), phase change (evaporation and condensation) at the bubble wall is implicitly taken into account. Evaporation
and condensation are very fast compared to the bubble dynamics time scale and as a result vapor comes in and out of the
bubble quasi-instantaneously such that the vapor pressure remains constant. However, the gas inside of the bubble does

Chahine, Kapahi, Hsiao and Choi, Mechanical Engineering Journal, Vol.00, No.00 (2016)
[DOI: 10.1299/xxx.2016xxx000x] © 2016 The Japan Society of Mechanical Engineers
not have time to enter or exit and is subjected to compression and expansion determined by Eq. (6).
2.2 Compressible flow model
The compressible liquid phase of the bubble dynamics is addressed in this study using a multi-material compressible
Euler equation solver based on a finite difference method (Kapahi, Hsiao, and Chahine). Continuity and momentum
equations for the compressible liquid can be written as follows in Cartesian coordinates:
Q E F G
St x y z
, (7)
where
2
2
2
0
0
, , , , 0 .
t t t t
u v w
vuu u p wu
Q v E uv F v p G wv S
w uw vw gw p
e gwe p u e p v e p w
(8)
In Eq. (8) p is the pressure, u, v, and w are the velocity components in the x, y, z directions respectively, e is the
specific internal energy, and et = e+0.5(u2+v2+w2) is the specific total energy. The system is closed by using an equation
of state for each material, which provides the pressure as a function of the material specific internal energy and the
density. Here, a -law (with =1.4) is used for the gas-vapor mixture.
=( -1)p e, (9)
and the Tillotson equation is used for water (Anderson):
2 30 0
0
( ) , 1p p e e A B C
. (10)
, A, B, C are constants and 0 ,p 0 ,e and 0 are the reference pressure, specific internal energy, and density respectively. 92.20 10 Pa,A 99.54 10 Pa,B 101.48 10 Pa, C 5
0 1.0 10 Pa ,p 30 1000 kg/m , 5 2 2
0 3.54 10 m / s ,e
and 0.28.
The compressible flow solver 3DYNAFS-COMP uses a high order Godunov scheme (Colella). It can solve the
Riemann problem and construct a local flow solution that abruptly changes between adjacent cells. The numerical method
is based on a higher order MUSCL scheme and tracks each material. To improve efficiency, an approximate Riemann
problem solution replaces the full problem. The MUSCL scheme is augmented with a mixed cell approach to handle
shock wave interactions with fluid or material interfaces. This approach uses a Lagrangian treatment for the cells
including an interface and an Eulerian treatment for cells away from interfaces. A re-map procedure is employed to map
the Lagrangian solution back to the Eulerian grid (Wardlaw and Luton)(Kapahi, Hsiao, and Chahine). The CFL number
for fluid solver is calculated here as follows:
( )CFL maxu c t
x
, (11)
where maxu is the maximum value of all absolute local material speeds, c is the sound speed, t and x are the
time step and the grid spacing respectively. The selected value of the CFL is used to compute the adaptive time step
during the computation. The sound speed, c, in Eq. (11) is obtained as follows:
/ .c p (12)
2.3 Compressible-incompressible link procedure
Both incompressible and compressible flow solvers are able to model the full bubble dynamics on their own.
However, each method has its shortcomings when it comes to specific parts of the bubble history. The BEM based

Chahine, Kapahi, Hsiao and Choi, Mechanical Engineering Journal, Vol.00, No.00 (2016)
[DOI: 10.1299/xxx.2016xxx000x] © 2016 The Japan Society of Mechanical Engineers
incompressible flow solver is efficient, reduces the dimension of the problem by one (line integrals for an axisymmetric
problem, and surface integrals for a 3D problem) and thus allows very fine gridding and increased accuracy with
reasonable computation times. It has been shown to provide reentrant jet parameters and speed accurately. However, it
has difficulty pursuing the computations beyond surface impacts (liquid-liquid and liquid solid).
On the other hand, the compressible flow solver is most adequate to model shock wave emission and propagation,
liquid-liquid, and liquid-solid impacts. The method requires, however, very fine grids and very small time steps to resolve
shock wave fronts. This makes it appropriate to model time portions of the bubble dynamics. Concerning the bubble-
liquid interface and the reentrant jet dynamics, the procedure is diffusive since the interface is not directly modeled and
the computed reentrant jet characteristics are usually less accurate than obtained with the BEM approach.
Hence our novel approach combines the advantages of both methods and consists in executing the following steps:
1. Setup the initial flow field using the Eulerian compressible flow solver, 3DYNAFS-COMP, and run the simulation
until the initial shock fronts exit the domain and the remnant flow field can be assumed to be incompressible.
2. Transfer at that instant to the Lagrangian BEM potential flow solver, 3DYNAFS-BEM, all the flow field variables
needed by the solver: geometry, bubble pressure, boundary velocities to specify the moving boundary’s normal
velocities, / n .
3. Solve for bubble growth and collapse using fine BEM grids to obtain a good description of the reentrant jet until
the point where the jet is very close to the opposite side of the bubble.
4. Transfer the solution back to the compressible flow solver with the required flow variables. To do so, compute
using the Green’s equation all flow field quantities on the Eulerian grid.
5. Continue solution progress with the compressible code to obtain pressures due to jet impact and remnant bubble
ring collapse.
The transfer mechanism between the two methods (compressible and incompressible) is fully conservative and we
observed no instabilities following the link procedure.
2.4 Finite Element Model:
The materials’ dynamics response to loadings, which are characteristic of cavitation, is studied using the finite
element model, DYNA3D, developed by the Lawrence Livermore National Laboratory. DYNA3D (McKeown et al.) is a
non-linear explicit solid and structural dynamics solver. It is based on a lumped mass formulation and solves the structure
momentum equation:
MU+CU+KU = F , (13)
where M is the mass matrix, U is the displacement vector, C is the damping matrix, K is the stiffness matrix, and F is
the matrix of the applied loads on the structure. DYNA3D is appropriate for problems where high strain rate dynamics or
stress wave propagation effects are important. Many material models are available to represent a wide range of material
behavior, including elasticity, plasticity, thermal effects, rate dependence, damage, and failure of elements.
Material Models Used
In this study, two metal alloys (Aluminum 7075 and Stainless Steel A2205), were examined. These were part of an
extensive experimental and numerical study reported in (Kim et al.). The alloys were modeled as elastic-plastic with two
linear slopes, one for the initial elastic regime and the other for the plastic regime. The parameters of the model used in
this study are shown in Table 1. The stress-strain curves corresponding to the two materials are shown in Fig 2.
Metallic
Alloys
Yield
Stress
(MPa)
Young’s
Modulus
(GPa)
Tangent Modulus
(MPa)
Elongation at
Break
Density
(g/cm3)
Al 7075 503 71.7 670 0.11 2.81
A2205 515 190 705 0.35 7.88
Table 1. Material properties of the metal alloys simulated in this study.

Chahine, Kapahi, Hsiao and Choi, Mechanical Engineering Journal, Vol.00, No.00 (2016)
[DOI: 10.1299/xxx.2016xxx000x] © 2016 The Japan Society of Mechanical Engineers
Fig 2. Stress-strain curves for aluminum Al 7075 and stainless steel A 2205.
3. Problem Setup
To illustrate the bubble / material dynamics, we consider a 50 µm bubble in equilibrium at 105 Pa with the surrounding
liquid and subject it to a pressure drop to 103 Pa for 2.415 ms followed by a pressure rise to 107 Pa. The time dependence
of this pressure can also be written as follows:
5
3
7
10 Pa; 0,
( ) 10 Pa; 0 2.415ms,
10 Pa; 2.415ms.
t
p t t
t
(14)
The bubble dynamics near the wall up to the point of reentrant jet impact can be simulated using the 3D BEM solver
(Chahine and Kalumuck). Fig 3 compares the bubble radius versus time between the Rayleigh-Plesset solution and the
3D solution. The three-dimensional dynamics results in a reduction of the bubble maximum volume relative to the free
field Rayleigh-Plesset solution due to the material wall confinement effects.
Fig 3. Comparison of the equivalent radius versus time of the deforming bubble with the Rayleigh-Plesset solution. Initially
the bubble is spherical of radius 50 μm and is located at a distance of X = 1.5 mm above a flat material surface. It is then
subjected to the pressure field described by Equation (14).

Chahine, Kapahi, Hsiao and Choi, Mechanical Engineering Journal, Vol.00, No.00 (2016)
[DOI: 10.1299/xxx.2016xxx000x] © 2016 The Japan Society of Mechanical Engineers
As illustrated in Fig 4 from the BEM solution, the applied pressure field results in the bubble expansion to an
equivalent radius of 2 mm followed by a strong collapse with reentrant jet formation and pressure loading of the nearby
metallic plate located at a standoff of 1.5 mm. It is more appropriate to present the results in terms of the non-dimensional
standoff X , which is defined as the ratio of the distance of the bubble center to the wall, X, to the bubble maximum
radius, Rmax.
max/ .X X R (15)
Fig 4. Bubble shape during (a) growth phase and (b) collapse phase. 3DYNAFS-BEM results: R0=50 μm, 0.75.X
The BEM solution at the moment of touchdown is then mapped to provide initial conditions for 3DYNAFS-COMP,
which then computes the dynamics of the reentrant jet impact and the ensuing multi-connected bubble and couples this
dynamics with the materials dynamics to provide stress distributions as shown in Fig 5. A high pressure wave is emitted
when the jet impacts the other side of the bubble (Fig 5a) and then when it impacts the wall (Fig 5c). Another high pressure
or shock wave is emitted with the remaining bubble ring collapses (Fig 5d). These instantaneous high loads induce high
stresses to substantial depths in the material as illustrated in Fig 5e-h.
The deformation of the central node of the plate along with the pressures recorded at that location is shown in Fig 6.
Note that there is a sharp rise in the pressure due to the reentrant jet impact. The subsequent bubble ring collapse results
in an even higher pressure, 1.5 µs later, as seen in the figure.
The contours of the residual stresses in the peened material are shown in Fig 7a. The figure also indicates the increase
in roughness due to the formation of a microscopic pit under the bubble. The resulting depth of the deformation of the
surface is negligible compared to that generated by solid body collisions as done in shot peening (Bagherifard et al.).
Finally, the temporal variation of the residual stress developed in the material along the depth is shown in Fig 7b. Note
that the residual compressive stress saturates with time and increases the yield strength of the material.
Fig 5. (a)-(d) Bubble contours and liquid pressures versus time, (e)-(h) corresponding material stress contours during
bubble collapse after reentrant jet impact. R0 = 50 µm, Rmax = 2 mm, Pd = 10 MPa and 0.75.X
1.5 mm
Time Time
(a) (b)
(a) (b) (c) (d)
(e) (f) (g) (h)

Chahine, Kapahi, Hsiao and Choi, Mechanical Engineering Journal, Vol.00, No.00 (2016)
[DOI: 10.1299/xxx.2016xxx000x] © 2016 The Japan Society of Mechanical Engineers
Fig 6. Central node displacement and pressure versus time for R0 = 50 µm, Rmax = 2 mm, Pd = 10 MPa and 0.75.X
Fig 7. (a) Residual equivalent stress in the material and pit shape. (b) Residual stress with depth at different times.
This loading mechanism for a single bubble collapse shows that cavitation generated impacts done in a controlled
manner can increase the resistance of the material against fatigue. The tiny pit formed during the bubble collapse process
also increases the roughness of the material making it more conducive to bonding. Therefore, by controlling the intensity
of the cavitation and the duration of exposure, the residual stresses are increased and the fatigue life of the material
improved.
4. Effect of standoff
This section describes the effects of bubble standoff on the formation of pits and the resultant peening effects in the
material. Besides standoff, the same conditions used above are used in this section. Fig 8 shows the time history of the
bubble equivalent radius for different initial non-dimensional standoff distances: X 0.5, 0.75, 1.0, and 1.5, while
Fig 9 shows the shape of the bubble in each case at a time close to the reentrant jet touching the other side of the bubble.
Compressible flow computations were conducted after these points in time. In all cases shown, the bubble starts at
0 50 ,R m grows to a bubble maximum Rmax = 2 mm, and is then subjected to a pressure driving the collapse
10 MPa.dP The duration of the pressure drop, t, was adjusted such that the sudden pressure rise, Pd, was imposed at
the time when the bubble radius reached 2 mm.
(a) (b)

Chahine, Kapahi, Hsiao and Choi, Mechanical Engineering Journal, Vol.00, No.00 (2016)
[DOI: 10.1299/xxx.2016xxx000x] © 2016 The Japan Society of Mechanical Engineers
Fig 8. Evolution of the equivalent bubble radius for different normalized standoff values at bubble maximum volume.
R0 = 50 µm, Rmax = 2 mm, Pd = 10 MPa.
In Fig. 8, the bubble shapes close to the time of reentrant jet impact show that the collapse occurs earlier (larger
bubble volume at time of impact) and the reentrant jet becomes more pronounced when the bubble is closer to the wall.
At the larger standoffs, the bubble volume shrinks significantly before the jet develops, while closer to the wall the
reentrant jet develops much earlier while the bubble still has a large volume when the jet reaches the opposite side of the
bubble. From these contours one can expect very different pressure loadings on the material surface for different values
of X .
Fig 10a compares the momentum average jet velocity,momV , at the touchdown moment (time the jet reaches the other
side of the bubble) for different standoff distances. momV is defined as:
1
,mom J d V V VV
(16)
where JV is the velocity of the liquid at a field point inside the jet, and V is the jet volume. It is seen that the jet velocity
increases as the standoff distance is increased. This is because the largest bubble wall speed is achieved when the bubble
is spherical (G L Chahine et al.) since the bubble wall has then enough time to accelerate. A better illustration of the
energy in the jet could be the total momentum of the jet,momV V , at the moment it touches the opposite side of the bubble.
This is shown in Fig 10b.
Fig 9. Bubble contours at the time of compressible-incompressible link for different normalized standoff distances between
the bubble and the wall for R0 = 50 m, Rmax = 2 mm, and Pd = 10 MPa.
X =0.5
X =0.75
X =1.0
X =1.5
X =0.5
X =0.75
X =1.0
X =1.5

Chahine, Kapahi, Hsiao and Choi, Mechanical Engineering Journal, Vol.00, No.00 (2016)
[DOI: 10.1299/xxx.2016xxx000x] © 2016 The Japan Society of Mechanical Engineers
Fig 10. Variations with the bubble wall normalized standoff distance of a) the momentum averaged jet velocity, Vmom, and
b) the jet momentum at touchdown for R0 = 50 m, Rmax = 2 mm, and Pd = 10 MPa.
Here we can see that there is an optimum distance ( ~ 0.75)X at which the energy in the jet is maximal. Similar
observations have been reported by both numerical studies (Chahine) (Jayaprakash, Chahine, and Hsiao) and
experimental studies (Brujan et al.) (Harris et al.). Actually, a higher jet velocity does not necessarily result in a higher
impact pressure on the wall because the distance between the jet front and the wall at the touchdown moment is also very
important. This is illustrated in the material deformation results below.
Fig 11. Pressure versus time at the center of the Al 7075 plate for different bubble plate normalized standoff distances
for R0 = 50 m, Rmax = 2 mm, and Pd = 10 MPa.
Fig 11 shows the pressure versus time monitored at the plate center for different standoff distances. All standoff
distances induce pressure waves containing both a jet impact, which results in a shock wave, and a shock wave emitted
by the remaining bubble ring collapse. However, the relative intensity of the two types of shock depends on the standoff.
It is seen that the pressure loading due to the jet impact is much higher for smaller standoff, especially for 0.5X , since
in this case the reentrant jet directly impacts on the material surface when it penetrates the other side of the bubble. As
the standoff increases, the magnitude of the pressure due to the jet impact is reduced because the high speed liquid has
to travel a longer distance while submerged before reaching the material surface. For 1.5X , only one significant
pressure peak with a typical exponential decay is observed because the jet touchdown occurs almost at the same time as
when the bubble reaches the minimum size and no significant jet pressure reaches the wall. Instead, a shock wave type
pressure profile is observed. Fig 11 also illustrates the time period during which the impact pressures exceed the yield
stress of the material. One has to be careful however to not confuse impact pressures at the surface and actual stresses
X =0.5
X =0.75
X =1.0
X =1.5
Yield stress
(a) (b)
Standoff, X Standoff, X

Chahine, Kapahi, Hsiao and Choi, Mechanical Engineering Journal, Vol.00, No.00 (2016)
[DOI: 10.1299/xxx.2016xxx000x] © 2016 The Japan Society of Mechanical Engineers
imparted inside the material.
Fig 12. Variations of (a) pit depth, (b) pit radius, and (c) pit volume with the normalized standoff distance for Al 7075 and
A 2205 for R0 = 50 m, Rmax = 2 mm and Pd = 10 MPa.
The influence of the normalized standoff distance on pit characteristics is very important and relevant for damage
assessment. Fig 12 shows three pit characteristics for the two metallic alloys studied: depth, radius, and volume
respectively as functions of the normalized standoff distance. Fig 12 shows that pit depth and volume continually decrease
when the standoff distance increases. However, as for the jet momentum, pit radius goes through a maximum when the
standoff distance is close to 0.75X . This is expected since the jet momentum correctly reflects the impact energy
contained in the jet and should correlate better the jet speed with the pit formed. The volume, not provided directly by
the software, was approximated by the volume of a cone with the same base diameter and height. Actually, the shape of
the pit varies with standoff as shown in Fig 13. At the smallest standoffs, the pit radius is smaller with 0.5X than with
0.75X , while the pit depth is larger with 0.5X than with 0.75X . These shapes reflect the impact of the jet, which
produces a thin and deep deformation and the bubble ring collapse, which generates a wider and shallower deformation.
Fig 13. Comparison of pit shape between normalized distances 0.5X and 0.75,X for aluminum Al7075 for R0 = 50 m,
Rmax = 2 mm, and Pd = 10 MPa.
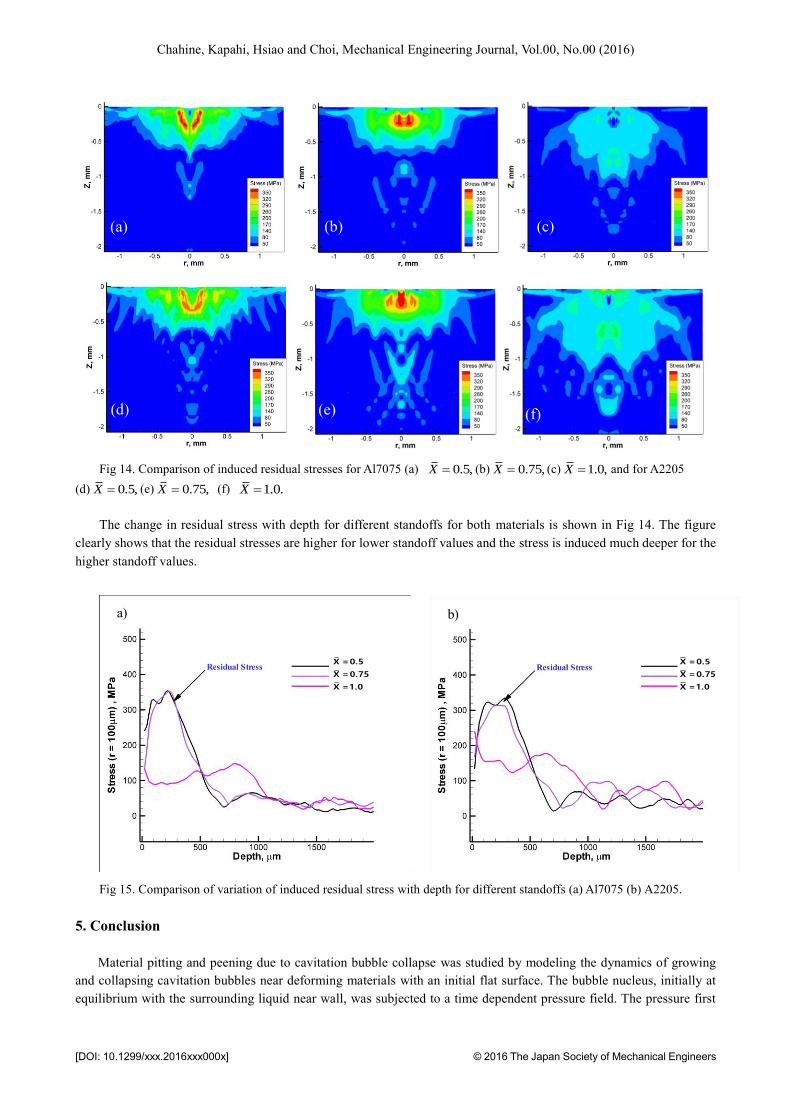
The effect of standoff on the residual stresses left in the material can be seen in Fig 14. The stress magnitude is higher
for smaller standoffs. This is due to the proximity of the bubble to the metallic surface leading to higher impact pressures.
On the other hand, the propagation of the residual stress to deeper areas is higher for larger standoff value. This can be
due to the duration of the pressure peaks, which gets longer as the standoff increases as shown in Fig 10.
Standoff X
Pit
Vo
lum
e,
m3
0.4 0.6 0.8 1 1.2 1.4 1.60
1000
2000
3000
4000
5000
6000
A2205
AL7075
(b) (a) (c)
X =0.5
X =0.75
Standoff, X Standoff, X Standoff, X
Chahine, Kapahi, Hsiao and Choi, Mechanical Engineering Journal, Vol.00, No.00 (2016)
[DOI: 10.1299/xxx.2016xxx000x] © 2016 The Japan Society of Mechanical Engineers
Fig 14. Comparison of induced residual stresses for Al7075 (a) 0.5,X (b) 0.75,X (c) 1.0,X and for A2205
(d) 0.5,X (e) 0.75,X (f) 1.0.X
The change in residual stress with depth for different standoffs for both materials is shown in Fig 14. The figure
clearly shows that the residual stresses are higher for lower standoff values and the stress is induced much deeper for the
higher standoff values.
Fig 15. Comparison of variation of induced residual stress with depth for different standoffs (a) Al7075 (b) A2205.
5. Conclusion
Material pitting and peening due to cavitation bubble collapse was studied by modeling the dynamics of growing
and collapsing cavitation bubbles near deforming materials with an initial flat surface. The bubble nucleus, initially at
equilibrium with the surrounding liquid near wall, was subjected to a time dependent pressure field. The pressure first
(a) (b)
X =0.5
X =0.75
X =1.0
X =0.5
X =0.75
X =1.0
(a) (b) (c)
(d) (e) (f)

Chahine, Kapahi, Hsiao and Choi, Mechanical Engineering Journal, Vol.00, No.00 (2016)
[DOI: 10.1299/xxx.2016xxx000x] © 2016 The Japan Society of Mechanical Engineers
dropped to a value below the bubble critical pressure, stayed at this pressure for a prescribed time, and then rose to a high
pressure value. As a result the nucleus first grew explosively then collapsed violently near the wall forming a fast reentrant
jet, which hit the wall and deformed it permanently when the collapse intensity was high enough to result in stresses
exceeding the material elastic limit. The pressure loading on the material surface during the bubble collapse is found to
be due to both the reentrant jet impact and to the collapse of the remaining bubble ring. The high pressure loading results
in high stress waves, which propagate radially from the loading location into the material and cause the deformation. A
pit (permanent deformation) is formed when the local equivalent stresses exceed the material yield stress. These
compressive stresses stay in the material as residual stresses and have benefits related to improved fatigue life of the
material. The tiny pits then formed can help in improving the bonding strength of the material.
A parametric study involving the initial normalized standoff distance between the bubble and the material showed
that the normalized standoff distance affects the jet characteristics in a non-monotonic fashion. Higher jet velocities occur
at the larger normalized standoff distances. However, the energy in the jet is maximum at a normalized standoff distance
close to 0.75.X A higher jet velocity does not necessarily result in a higher impact pressure, since the impact pressure
also depends on the distance between the wall and the jet front at the touchdown moment. A more concentrated pressure
loading on the material surface is obtained for smaller standoffs where the jet touches down and the bubble ring collapses
very close to the wall. Such concentrated pressure loadings result in deeper but narrower pits. As a result, the shape of
the pit, i.e. the ratio of pit radius to depth, does not vary monotonically with standoff. This also affects the induced
residual stresses which are higher and shallower for small standoffs and smaller and deeper for larger standoffs.
Acknowledgements
This work was conducted under partial support from DYNAFLOW, INC. internal IR&D and from the Office of Naval
Research under Contract N00014-15-C-0052, monitored by Dr. Ki-Han Kim. We appreciate this support.
6. References
Abramov, V.O. , Abramov O.V., Sommer F., Gradov O.M. and Smirnov O.M., Surface Hardening of Metals by
Ultrasonically Accelerated Small Metal Balls. Ultrasonics, Vol. 36, No.10 (1998), pp. 1013–1019.
Anderson, J. D., Modern Compressible Flow: With Historical Perspective (1990), McGraw-Hill Education.
Bagherifard S., Fernández Pariente I., Ghelichi R. and Guagliano M., Fatigue Properties of Nanocrystallized Surfaces
Obtained by High Energy Shot Peening, Procedia Engineering, Vol. 2, No.1 (2010), pp. 1683–1690.
Bhushan, B., and Gupta, B.K. “Handbook of Tribology: Materials, Coatings, and Surface Treatments.” (1991).
Brujan, E.A., Keen, G.S., Vogel, A., Blake, J.R., The Final Stage of the Collapse of a Cavitation Bubble close to a Rigid
Boundary, Physics of Fluids, Vol. 14, No.1 (2002), pp. 85–92.
Chahine, G L. Boundary Element Method for Calculating 2-D and 3-D Underwater Explosion Bubble Loading on Nearby
Structures, Including Fluid Structure Interaction Effects. Technical Report NSWCDD/TR-93/46 (1995).
Chahine G.L., Annasami, R., Hsiao, C.-T., Harris, G.S., Scaling Rules for the Prediction on UNDEX Bubble Re-Entering
Jet Paramaters (Limited Distribution). SAVIAC Critical Technologies in Shock and Vibration, Ed. Vol. 4., No.1
(2006), pp. 1–12.
Chahine, G.L., Choi, J.-K., and Frederick, G.S., Cavitating Jet Peening Test for Areva-Framatome. DYNAFLOW, INC.
Technical Report 2M5002-1Areva-Framatome (2005).
Chahine, G.L,. Franc, J.-P., and Karimi, A., Laboratory Testing Methods of Cavitation Erosion., Advanced Experimental
and Numerical Techniques. Ed. K-H. Kim et al. Vol. 160. (2014), pp.21–36. Springer, Berlin.
Chahine, G.L, and Kalumuck, K., BEM Software for Free Surface Flow Simulation Including Fluid Structure Interaction
Effects, International Journal of Computer Applications for Technology 11.3-5 (1998), pp. 177–198.
Chahine, G.L, Kalumuck, K.M. and Duraiswami, R., Fluid-Structure Interaction Simulation of Bubble Dynamics by
Coupling Fluid BEM and Structural FEM Codes, 4th ASME International Symposium on Bubble Noise and
Cavitation Erosion in Fluid Systems. New Orleans, LA, (1993).
Chahine, G. L., Kapahi, A., Choi, J.-K. and Hsiao, C.-T., Modeling of Surface Cleaning by Cavitation Bubble Dynamics
and Collapse, Ultrasonics Sonochemistry, Vol. 29 (2016), pp. 528-549.
Colella, P., A Direct Eulerian MUSCL Scheme for Gas Dynamics, SIAM Journal on Scientific and Statistical Computing,
Vol. 6, No.1 (1985), pp. 104–117.
Dill, Ellis H. Continuum Mechanics: Elasticity, Plasticity, Viscoelasticity, Vol. 10 (2006), CRC Press.
Chahine, Kapahi, Hsiao and Choi, Mechanical Engineering Journal, Vol.00, No.00 (2016)
[DOI: 10.1299/xxx.2016xxx000x] © 2016 The Japan Society of Mechanical Engineers
Grinspan, A.S. and Gnanamoorthy, R., A Novel Surface Modification Technique for the Introduction of Compressive
Residual Stress and Preliminary Studies on Al Alloy AA6063, Surface and Coatings Technology Vol. 201, No.3
(2006) pp. 1768–1775.
Harris, G., Illamni, R., Lewis, W., Rye K. and Chahine G.L. Underwater Explosion Bubble Phenomena Tests Near a
Simulated Dam Structure, Naval Surface Warfare Center - Indian Head Division IHTR 10-3055 (2009) IHTR–10–
3055.
Hsiao, C.-T., Jayaprakash, A, Kapahi, A., Choi, J.-K. and Chahine, G.L., Modelling of Material Pitting from Cavitation
Bubble Collapse, Journal of Fluid Mechanics, Vol. 755 (2014), pp. 142–175.
Hur, D.H., Choi, M.S., Lee, D.H., Song, M.H., Kim, S.J. and Han, J.H., Effect of Shot Peening on Primary Water Stress
Corrosion Cracking of Alloy 600 Steam Generator Tubes in an Operating PWR Plant, Nuclear Engineering and
Design, Vol. 227, No.2 (2004), pp. 155–160.
Jayaprakash, A., Chahine, G. L., and. Hsiao, C.-T., Numerical and Experimental Study of the Interaction of a Spark-
Generated Bubble and a Vertical Wall, ASME Journal of Fluids Engineering, Vol. 134, No.3 (2012), pp. 31301–
31312.
Jayaraman, N., Prevey, P., Ontko, N., Shepard, M., Ware, R. and Coate, J., Comparison of Mechanical Suppression by
Shot Peening and Low Plasticity Burnishing to Mitigate SCC and Corrosion Fatigue Failures in 300M Landing
Gear Steel, Lambda Research Cincinnati OH, (2005).
Kalumuck, K. M., Chahine, G.L., Choi, J.-K., Hsiao, C.-T., Aley, P. and Frederick, G., Development of Cavitating Liquid
Jets for Oxidation Remediation of Contaminated Aquifers. DYNAFLOW, INC. Technical Report 2M2022-NIEHS-1
(2003).
Kanou, S., Takakuwa, O., Mannava, S.R., Qian, D., Vasudevan, V.K. and Soyama, H., Effect of the Impact Energy of
Various Peening Techniques on the Induced Plastic Deformation Region, Journal of Materials Processing
Technology, Vol. 212, No. 10 (2012), pp. 1998–2006.
Kapahi, A., Hsiao, C.-T., and Chahine, G. L., A Multi-Material Flow Solver for High Speed Compressible Flow
Applications, Computers in Fluids, Vol.115 (2015), pp. 25-45.
Kim, K-H. , Chahine, G.L., Franc, J.P. and Karimi, A., Advanced Experimental and Numerical Techniques for Cavitation
Erosion Prediction. Ed. Ki-Han Kim et al. Fluid Mechanics and Its Applications, Vol.106 (2014) Springer
Netherlands.
Kobayashi, M, Matsui, T., and Murakami, Y., Mechanism of Creation of Compressive Residual Stress by Shot Peening,
International Journal of Fatigue, Vol. 20, No.5 (1998), pp. 351–357.
Loraine, G., Chahine, G.L., Hsiao, C.-T., Choi, J.-K. and Aley, P., Disinfection of Gram-Negative and Gram-Positive
Bacteria Using DYNAJETS® Hydrodynamic Cavitating Jets, Ultrasonics Sonochemistry, Vol.19, No.3 (2012) pp.
710–717.
Mannava, S.R. , Bhamare, S., Chaswal, V., Felon, L., Kirschman, D., Lahrman, D., Tenaglia, R., Qian, D. and Vasudevan,
V., Application of Laser Shock Peening for Spinal Implant Rods, Ed. Goran Ivetic. International Journal of
Structural Integrity, Vol. 2, No. 1 (2011), pp. 101–113.
McKeown, R., Dengel, O., Harris, G. and Diekhoff, H.J., Development and Evaluation of DYSMAS Hydrocode for
Predicting Underwater Explosion Effects, Executive Summary, Vol. 1, IHTR 2492 (2004).
Chen, G.-Q., Tian, T.-Y., Zhang, X.-H., Li, Z.-Q., Zhou, W.-L.. Microstructure and fatigue properties of Ti-6Al-4V
titanium alloy treated by wet shot peening of ceramic beads--The Chinese Journal of Nonferrous Metals, 2013-01.
http://en.cnki.com.cn/Article_en/CJFDTOTAL-ZYXZ201301018.htm
Morinaka, R., Hasegawa, K., Fukaya, M., Matsui, Y., Hatoh, H., Saito, N., Yoshikubo, F. and Kanno, A., Field Experience
of Water Jet Peening Application on BWR Reactor Internals With Cracked Surfaces, 20th International Conference
on Nuclear Engineering and the ASME 2012 Power Conference (2012), pp. 241–250.
Nalla, R.K, Altenberger I, Noster U, Liu G., Scholtes B and Ritchie R., On the Influence of Mechanical Surface
Treatments—deep Rolling and Laser Shock Peening—on the Fatigue Behavior of Ti–6Al–4V at Ambient and
Elevated Temperatures, Materials Science and Engineering: A, Vol. 355, No.1 (2003), pp. 216–230.
Naude, C.F., and Ellis A.T., On the Mechanism of Cavitation Damage by Nonhemispherical Cavities Collapsing in
Contact With a Solid Boundary, Journal of Basic Engineering, Vol. 83, No.4 (1961), pp. 648-656.
Odhiambo, D., Cavitation Shotless Peening for Improvement of Fatigue Strength of Carbonized Steel, International
Journal of Fatigue, Vol. 25, No. 9 (2003), pp. 1217–1222.
Chahine, Kapahi, Hsiao and Choi, Mechanical Engineering Journal, Vol.00, No.00 (2016)
[DOI: 10.1299/xxx.2016xxx000x] © 2016 The Japan Society of Mechanical Engineers
Peyre, P, Scherpereel, X., Berthe, L., Carboni, C., Fabbro, R., Beranger, G. and Lemaitre, C., Surface Modifications
Induced in 316L Steel by Laser Peening and Shot-Peening. Influence on Pitting Corrosion Resistance, Materials
Science and Engineering: A, Vol. 280, No.2 (2000), pp. 294–302.
Plesset, M.S., and Prosperetti, A., Bubble Dynamics and Cavitation, Annual Review of Fluid Mechanics, Vol.9, No.1
(1977), pp. 145–185.
Plesset, M.S., and Chapman, R.B., Collapse of an Initially Spherical Vapour Cavity in the Neighbourhood of a Solid
Boundary, Journal of Fluid Mechanics, Vol. 47, No. 2 (1971), pp. 283-290.
Sharp, P. K. , Liu, Q., Barter, S.A., Baburamani, P. and Clark, G., Fatigue Life Recovery in Aluminium Alloy Aircraft
Structure, Fatigue Fracture of Engineering Materials and Structures, Vol. 25, No. 2 (2002), pp. 99–110.
Taricco, F., Effect of Machining and Shot Peening on the Residual Stresses of Superalloy Turbine Discs, ASME 1995
International Gas Turbine and Aeroengine Congress and Exposition (1995), Paper No. 95-GT-366, pp.
V005T12A007.
Wang, S,, Li, Y., Yao, M. and Wang, R., Compressive Residual Stress Introduced by Shot Peening, Journal of Materials
Processing Technology, Vol. 73, No.1 (1998), pp. 64–73.
Wardlaw, A, and Luton, J. “The Gemini Euler Solver for the Coupled Simulation of Underwater Explosions.” NSWCIH
- IHTR 2500 (2003).
Zhuang, W., and Wicks, B., Mechanical Surface Treatment Technologies for Gas Turbine Engine Components, Journal
of Engineering for Gas Turbines and Power, Vol. 125, No. 4 (2003), pp. 1021-1025.