county: skagit county g1400105 northwest straits … skagit county grant no: g1400105 project title:...
TRANSCRIPT

County: Skagit County Grant No: G1400105
PROJECT TITLE: Northwest Straits Project: Skagit County Marine Resources Committee Operations and Projects DELIVERABLES FOR TASK NO: 4 – Shannon Point Riprap Removal Feasibility Study and 60% Project Design PROGRESS REPORT: [] PROJECT FINAL REPORT: [X] PERIOD COVERED: September 16 – January 31, 2014 DATE SUBMITTED: February 25, 2014
This project has been funded wholly or in part by the United States Environmental Protection Agency. The contents of this document do not necessarily reflect the views and policies of the Environmental Protection Agency, nor does mention of trade names or commercial products constitute endorsement or recommendation for use.

Shannon Point Revetment Removal Feasibility and Preliminary Design Report,
Anacortes, Skagit County, WA
Prepared for: The Northwest Straits Marine Conservation Foundation
Prepared by: Coastal Geologic Services, Inc.
Preparers: Jim Johannessen, Stephanie Williams,
Jonathan Waggoner, and Alexis Blue
Jan. 12, 2013

COASTAL GEOLOGIC SERVICES, INC.
1711 Ellis St. Suite 103, Bellingham, WA 98225 (360) 647-1845 [email protected]
Table of Contents Introduction and Purpose ......................................................................................................................... 1
Site Conditions .......................................................................................................................................... 1
Overview ................................................................................................................................................... 1
Geology of Bluffs ....................................................................................................................................... 2
Beach ......................................................................................................................................................... 2
Coastal Processes ...................................................................................................................................... 3
Rock Revetment ........................................................................................................................................ 4
Wetland ..................................................................................................................................................... 5
Marine Riparian Vegetation ...................................................................................................................... 5
Documented Forage Fish Spawning Areas ................................................................................................ 6
Site History ................................................................................................................................................ 7
Preliminary Design Alternatives ................................................................................................................ 7
Alternative 1: Full Restoration .............................................................................................................. 8
Alternative 2: Full Rock Revetment Removal ....................................................................................... 8
Alternative 3: Partial Rock Revetment Removal ................................................................................... 9
No Action: Existing Conditions .............................................................................................................. 9
Phasing .................................................................................................................................................. 9
Conclusions and Recommendations ....................................................................................................... 10
Preferred Alternative .............................................................................................................................. 10
Constraints .......................................................................................................................................... 11
Benefits ............................................................................................................................................... 11
Slope Stability Assessment for Preferred Alternative ............................................................................. 12
Integration of Previous Geology/Stability Work ................................................................................. 12
Geology and Stratigraphy ................................................................................................................... 14
Bluff Configuration .............................................................................................................................. 14
Location and Elevation of Bluff Toe .................................................................................................... 15
House Setback to Top of Bluff ............................................................................................................ 15
Implementation Considerations and Analysis ........................................................................................ 15
Removal by Truck Overland ................................................................................................................ 15
Removal by Barge ............................................................................................................................... 16
Rock Reuse .......................................................................................................................................... 17
Preferred Alternative .............................................................................................................................. 18
Cost Estimate .......................................................................................................................................... 19
Limitations of This Report ....................................................................................................................... 20
References .............................................................................................................................................. 21
ATTACHMENTS: ....................................................................................................................................... 22
APPENDIX A: ............................................................................................................................................ 23
Shannon Point Revetment Removal Feasibility and Preliminary Design Jan. 12, 2014 - Page 1 COASTAL GEOLOGIC SERVICES, INC.
Introduction and Purpose The purpose of this technical memorandum is to document the site conditions and major project
considerations of a potential rock revetment removal along a portion of shore on the southwest shore
of Shannon Point within the water body of Rosario Strait just south of Bellingham Channel, in Skagit
County, Washington (Figure 1). The site consists of an undeveloped wooded parcel owned by Western
Washington University (WWU) and beach, which is largely in City of Anacortes ownership. Coastal
Geologic Services (CGS) staff visited the site several times in 2013, including for a site assessment and
topographic survey on May 28th and 29th, when there was a low tide of ‐2.4 ft Mean Lower Low Water
(MLLW). We conducted an additional site on December 31, 2013 to assess slope stability of the
upland development southeast of the southern portion of the causeway.
The northwest Straits Foundation requested that CGS complete a topographic survey and feasibility
assessment, followed by development of an engineered design for the maximum amount of process
and habitat nearshore restoration possible without causing negative impacts to adjacent landowners.
This report describes site conditions, determine whether removal of the rock revetment and parts of
the railroad causeway fill is feasible, the benefits these actions would result in, and, how and to what
extent the removal could be accomplished. The report provides 3 habitat restoration alternatives, and
provides an overview of the feasible, preferred alternative. This design has been advanced to the 60%
design level with 2 drawing sets attached; one larger format set which will be developed into final
construction drawings in the next phase, and a smaller format set for permitting with the US Army
Corp of Engineers (USACE). An updated construction cost estimate is also provided.
Site Conditions
Overview
The old railroad causeway is comprised of a 6 to 19 ft high bank from north to south, some of which
appears to be native material and some of which is fill added to build up the railroad causeway. The
rock revetment spans 766 ft along shore from a bedrock headland at the south end of the site. The
causeway and fronting riprap revetment extends across the upper beach to +4.2 ft MLLW. The north
end of the causeway and revetment extends down to local Mean Higher High Water (MHHW) for the
Shannon Point vicinity, which is +8.0 ft MLLW (NOAA). A local trail runs north along the causeway
from a nearby residential street. The houses in the vicinity are built on the native bluff and bedrock.
The WWU Shannon Point Marine Center is north of the site. A small wetland exists landward of the
filled causeway and rock revetment. All of these elements contribute to the feasibility of the rock
revetment removal and will be further explored in the following text.
Shannon Point Revetment Removal Feasibility and Preliminary Design Jan. 12, 2014 - Page 2 COASTAL GEOLOGIC SERVICES, INC.
Geology of Bluffs
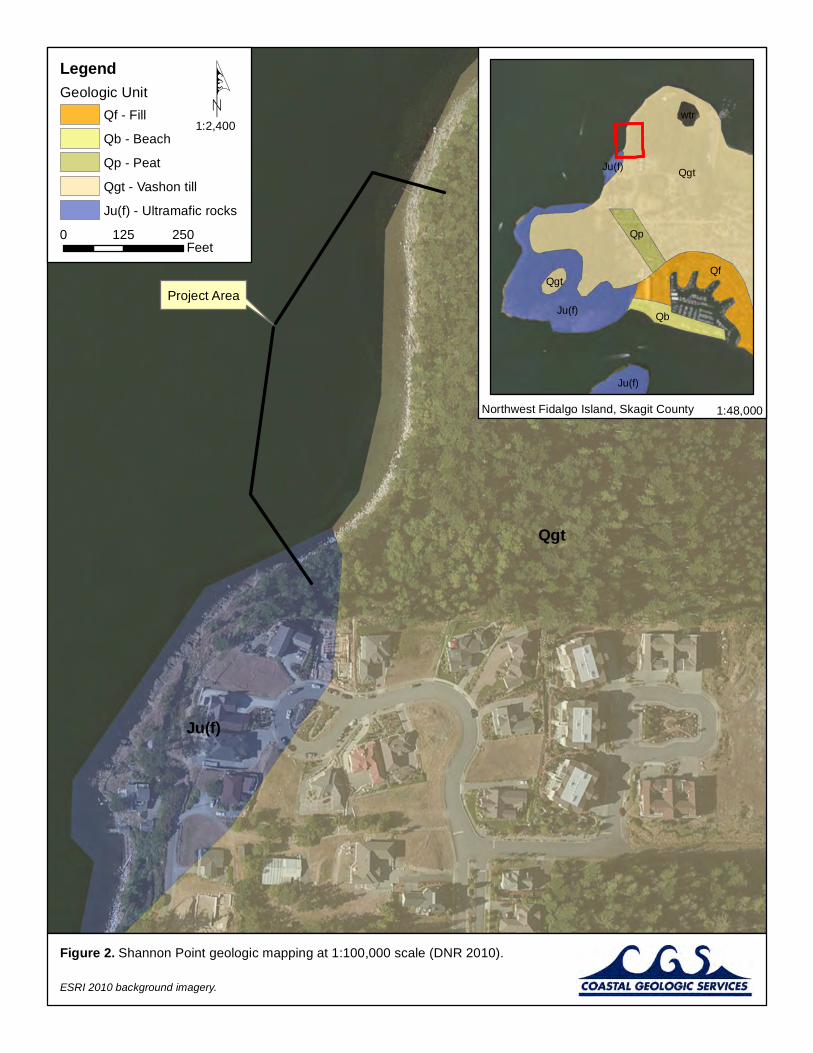
The site consists of bedrock and glacial and nonglacial deposits from the Pleistocene period. The
Pleistocene deposits were observed in the field as glacial till from the Vashon Stade (Qgt) underlain by
nonglacial Olympia beds (Qc(o)) or Whidbey Formation (Qc(w)). Vashon till (also referred to as glacial
till) is an unsorted mix of clay, silt, sand, and boulder‐sized clasts ranging from sub‐angular to
rounded. Till outcrops in thin veneers over bedrock (Lapen 2000) and become thicker going north.
This unit was the dominant material in the bluffs near the project area (Photo Pages 1 and 2), which is
consistent with Washington Department of Natural Resources (DNR 2010) 1:100,000 maps of the area
as compiled from geologic mapping of the Bellingham Quadrangle (Lapen 2000) (Figure 2). The likely
nonglacial unit underlying the till is a silty sand with localized cross‐bedding and sandy pebble lenses,
as well as peat observed on the beach face (Photo Page 2). This unit was observed from beach level
up to +8 ft MLLW at the north end of the site and extended higher up the bluff face farther north
towards Shannon Point. The contact between the glacial till and the nonglacial units was undulating.
The likely nonglacial unit or units are not included in the 1:100,000 digital GIS mapping, but are
mapped nearby in the higher resolution 1:24,000 geologic mapping of the Anacortes South and
LaConner (Dragovich et al. 2000) and Oak Harbor (Dragovich et al. 2005) quadrangles. In these maps
the Olympia beds are described as nonglacial deposits composed of sand, gravelly sand, organic‐rich
sand, silty sand, silt, silty clay, and peat with lesser cobble gravel and gravel; peat logs are common;
may locally include outwash sand of the Possession Glaciation and nonglacial sediments of the older
Whidbey Formation (Dragovich et al. 2000). The Whidbey formation is described as silt, clay, peat,
silty sand, sand, and rare pebbly sand displaying a variety of fluvial characteristics (Dragovich et al.
2005).
Exposed bedrock in the project area was confined to the south end where it outcrops as a rocky
headland and underlies much of the area to the south of this point. Geologic mapping indicates that
bedrock is present from the exposed outcrops at the site to the south and west of Fidalgo Island (DNR
2010, Lapen 2000) (Figure 2).The bedrock is mapped as ultramafic rocks of the Fidalgo ophiolite Ju(f)
and described as serpentinite, harzburgite, and lesser olivine chromitite layers, with cross‐cutting
veins of pyroxenite throughout an ultramafic body . Gravity studies indicate this unit is a nearly
horizontal slab‐like body 1 km thick (Carlson 1972). This is consistent with observations made during
the site visit, however, without subsurface exploration the depth to the bedrock is unknown.
Beach
The beach at the site is comprised of mainly cobble and small boulder along the beachface down to a
low tide terrace, with pebble and sand along the upper beach (Photo Page 2). The cobble and small
boulder is primarily composed of native ultramafic bedrock, especially on the south end near the
bedrock headland. Large boulders are scattered throughout the beachface and into the low tide
terrace.
A sandy beach with suitable forage fish spawning substrate exists just north of the bedrock headland
resembling a small pocket beach in plan view (Photo Page 2 and Figure 3). It is likely that the rock

Shannon Point Revetment Removal Feasibility and Preliminary Design Jan. 12, 2014 - Page 3 COASTAL GEOLOGIC SERVICES, INC.
revetment is covering native upper beach and significantly limited available suitable forage fish
spawning habitat. Beyond the low tide terrace is a sandy tide flat with eelgrass, the landward extent
of which was surveyed during the site visit.
Coastal Processes
Coastal processes at this site are influenced by the characteristics of the specific drift cell and
associated up‐drift factors, including geology and stratigraphy, shore orientation and subsequent
exposure to wind‐generated waves. The site is exposed to a fetch (distance over which wind‐
generated waves are formed) from the northwest, measuring 9.7 miles to Orcas Island directly across
Rosario Strait. This is a moderate to high fetch. From the south quadrant, the prevailing and
predominant wind direction, the site is largely sheltered by a series of bedrock headlands on north
Fidalgo Island, including the headland immediately south of the site. Therefore, fetch from the south
is negligible.
The beach at the site is part of a larger coastal system that is defined by net shore‐drift cells. Net
shore‐drift refers to the long‐term effect of coastal processes in the form of discrete coastal sediment
littoral transport systems as mapped by Schwartz et al. (1991) and Johannessen (1992). A net shore‐
drift cell extends from the beginning of a sediment source to a sediment sink or depositional area
(Johannessen and MacLennan 2007). Bluff sediment input, primarily loose to moderately compact
glacial and interglacial deposit units, are the primary source of beach sediment in Puget Sound region
(Keuler 1988). Drift cell SK‐D‐2 originates 2,000 ft south of the site at Washington Park and extends
northward around Shannon Point to the ferry landing (Figure 1). The site is located within the first
third of the drift cell.
Current and historic geomorphic shoretypes of north Fidalgo Island were identified and mapped for
Skagit County by MacLennan and Johannessen (2008) and recently compiled into the Puget Sound‐
wide data set of geomorphic shoretypes for the Department of Ecology (MacLennan et al. 2013). This
mapping takes into account the geomorphic shoretype in the context of the net shore‐drift system.
The rock revetment at the site was mapped as modified and as a likely historic feeder bluff prior to
development. To the north of the site and down‐drift of the armored shore, feeder bluffs are mapped
around Shannon Point to Cannery Lake extending nearly 2,300 ft.
The configuration of the bedrock headland at the southern end of the project area likely contributes
to the sandy beach at the site. The predominantly southwesterly waves tend to be refracted by the
headland to break parallel to shore resulting in a very low sediment transport potential and retention
of fine sediment. In contrast, waves tend to approach the northern portion of the project area at an
oblique angle, tending toward higher sediment transport potential. This likely results in the gradual
transport of sand out of the system, leaving coarser sediment behind. This is particularly true as the
causeway has blocked input of bluff sediment from the former feeder bluffs in the study area.
Other geomorphic shoreline mapping conducted for Puget Sound Nearshore Ecosystem Restoration
Project (PSNERP) takes into account coastal landforms independent of the net shore‐drift system. This

Shannon Point Revetment Removal Feasibility and Preliminary Design Jan. 12, 2014 - Page 4 COASTAL GEOLOGIC SERVICES, INC.
mapping identified the site as a rocky platform transitioning to a bluff‐backed beach that continues
north around Shannon Point to Cannery Lake (Simenstad et al. 2011).
Rock Revetment
The existing rock revetment was surveyed on May 28th and 29th. Existing conditions are presented in
the CADD sheet sets in Appendix A. The rock revetment appears to have been constructed of two
courses. The first, lower course consists of apparently local native bedrock boulders, averaging 1‐3 ft
in size. Angular granite rock averaging 3‐6 ft in size was placed atop the lower course, likely at a later
date. The revetment varied in condition from relatively undamaged at the southern end to completely
destroyed portions to the north.
The rock revetment was split into sections 1 through 7 for the purposes of describing the revetment
and quantifying the rock. The sections were split at natural breaks between reaches of the rock
revetment with similar character or dimensions. The character of the rock in the sections and section
breaks are shown in Photo Page 3 and Figure 3, respectively.
A field assessment of the thickness of rock was made at 23 points along the revetment on May 29,
2013. These points were chosen to be representative of specific revetment reaches. These thicknesses
were combined with the dimensions measured by the topographic survey to determine cross‐
sectional areas. The cross‐sectional area and alongshore length of each segment were multiplied to
estimate rock volumes. Table 1 summarizes the measurements for each of the 7 revetment sections.
Overall, the revetment was estimated to contain 2,512 cubic yards (CY) of rock. Of this, approximately
65% (1,625 CY) consisted of granite, and 35% (875 CY) consisted of native bedrock boulders. No
subsurface investigations were made as part of these estimates, so they should be considered
preliminary quantities subject to additional refinement through the removal and design process.
Table 1. Rock revetment volume estimates by section. See Figure 3 for section locations.
Section
Average Rock
Height (FT)
Alongshore
Length (LF)
Cross-sectional
Area (SF) Volume (CY)
1 6 57 41 87
2 9 140 65 335
3 2 55 25 51
4 9 76 65 184
5 15 219 96 775
6 14 64 107 255
7 19 155 144 825
Total -- -- -- 2512
Preliminary investigation at the toe of the rock by Slocum (2011) indicated that the rock was originally
placed on the existing ground surface and was not buried. Slocum also noted that drifting sand had

Shannon Point Revetment Removal Feasibility and Preliminary Design Jan. 12, 2014 - Page 5 COASTAL GEOLOGIC SERVICES, INC.
accumulated to a depth of about a foot at the toe of the revetment in some places, but that the toe
did not appear to be deliberately buried (Slocum 2011).
Causeway fill material likely consists of local glacial till, nonglacial deposits, native bedrock boulders,
and quarry spall. In some areas it appears that imported granitic rock quarry spall was placed near the
top of the causeway, possibly to repair or fill areas of the originally constructed causeway (Photo Page
4 and 5). Portions of the causeway were likely cut from the native bluff and that material was used to
fill other parts of the causeway. Based on the field observations, GPS points were collected to map
where the causeway likely cut into the bluff and where the causeway was likely filled. These are
shown on Figure 3 and labeled as native bluff. In the vicinity of the wetland the causeway contains
large 1‐3 ft native bedrock boulders as fill, as shown in Photo Page 5. The far southern end of the
causeway fill may contain more rock as it is adjacent to the cut through bedrock from the south.
Exploration into the subsurface materials in these locations was conducted through shallow test pit
excavations to determine the character of sediments. Shallow test pits were dug in specific locations
of the causeway suspected as having been filled and also two locations behind the causeway (Figure
3). The sediments were described to the best professional judgment of the geologist and are
considered the best available information in lieu of larger drilling or excavating equipment, such as a
backhoe, which could not be brought to the site due to access and budget limitations (Table 2; Photo
Pages 4 and 5).
Wetland
A wetland is located landward of the sandy beach area and rock revetment at the site. It has been
classified by Aqua‐Terr Systems, Inc. (ATSI 2012) as an approximately 1,400 square foot Category III
depressional closed permanently flooded (PEMH) forested wetland. ASTI judged that the wetland had
a habitat score of 15. Please refer to the ASTI report for more information.
It was recommended by ATSI that a critical areas report be conducted in late spring and the dry
season to verify hydrologic regimes and vegetation during alternate seasons. During the May 2013
site visits the wetland was holding water. The north and south ends of the oblong wetland paralleling
the backside of the causeway were marked with GPS (Figure 3). Since the potential restoration actions
would result in substantial overall habitat improvement, a critical areas report may not be needed.
Marine Riparian Vegetation
The vegetation adjacent to the shoreline was described by ATSI as forested canopy with understory
shrubs and herbaceous vegetation. Vegetation at the site includes Douglas fir (Pseudotsuga
menziesii), red alder (Alnus rubra), grand fir (Abies grandis), western red cedar (Thuga plicata), and
madrone trees (Arbutus menziesii); elderberry (Sambucus racemosa), snowberry (Symphoricarpos
albus), osoberry (also known as Indian plum) (Oemleria cerasiformis), Nootka rose (Rosa nutkana), red
huckleberry (Vaccinium parvifolium), thimbleberry (Rubus parviflorus), and salmonberry (Rubus
spectabilis) shrubs; and sword fern (Polustichum munitum), salal (Gaultheria shallon), herbaceous
native and non‐native grasses, vetch, and spring flowers groundcover plants. ATSI reported

Shannon Point Revetment Removal Feasibility and Preliminary Design Jan. 12, 2014 - Page 6 COASTAL GEOLOGIC SERVICES, INC.
approximately 50 trees 8‐20 inches diameter at breast height (DBH) were present along the crest of
the rock revetment.
Table 2. Test pits excavated for materials observation. Depths reported in below ground surface (BGS) inches.
Test Pit # Depth (BGS) Observation
TP 1 causeway
6 inches 5 inches below causeway crest, in scarp on waterward side. Angular native bedrock 4-12 inches diameter and smaller resembling quarry spall/fill, in silty matrix. Likely native fill.
TP 2 causeway
8 inches 1.5 ft below causeway crest on waterward side. Angular granitic rock 6-12 inches diameter and smaller, in silty matrix. Likely native and imported fill.
TP 3 causeway
8 inches 8 ft below causeway crest on landward side. Medium to coarse orange sand with few fines (silt) and sub-rounded pebbles. Likely native fill.
TP 4 causeway
8- 12 inches 10 ft below causeway crest on landward side (near depressional wetland-about 3 ft above wetland). Silty fine sand with few random sub-angular to sub-rounded pebbles. Medium plasticity indicating fines. Likely native fill.
TP 5
depression
12- 15 inches North end of depression landward of causeway. Fine to medium gray sand, sub-rounded pebbles, pebble lens apparent below 1 ft. Native beach material.
TP 6
depression
12- 15 inches North end of depression landward of causeway. Medium to coarse gray sand, few sub-rounded pebbles and cobbles. Native beach material.
TP 7 causeway
8 inches 5 ft from causeway crest on landward side. Silty with fine sand and few sub-rounded to sub-angular pebbles. Medium plasticity indicating fines. Likely native fill.
TP 8 causeway
6 inches At top of causeway. Sandy silt with few medium sub-rounded pebbles. Likely native fill.
TP 9 causeway
6- 8 inches 3 ft from causeway crest on landward side. Angular native bedrock 3- 8 inches and smaller, resembling quarry spall, in silty matrix. Likely native fill.
TP 10 causeway
6-8 inches 10 ft from causeway crest on landward side (3 ft above depressional wetland). Silt with few angular clasts, high plasticity. Likely native fill.
Documented Forage Fish Spawning Areas
Forage fish are important prey sources for Pacific salmon and other species that use the nearshore for
spawning in the Puget Sound (Penttila 2007). Surf smelt spawning occurs on the upper intertidal
beach and to up just above MHHW. Spawn from surf smelt and Pacific sand lance forage fish have
been documented in nearby intertidal areas. Surf smelt spawn have been documented up‐drift in
Washington Park and down‐drift in the vicinity of the San Juan Islands Ferry landing. Pacific sand lance
spawn have been documented down‐drift of the ferry landing on the beach of Ship Harbor and the
associated coastal wetland (WDFW 2004).

Shannon Point Revetment Removal Feasibility and Preliminary Design Jan. 12, 2014 - Page 7 COASTAL GEOLOGIC SERVICES, INC.
Site History Historic topographic mapping (T‐sheet) from 1885 is presented in Figure 4, which shows the earliest
reliable mapping of predevelopment conditions in the area. From south to north the T‐sheet shows a
rocky headland at the south end of the site, a historic beach and intertidal zone that has since been
buried by the railroad causeway, bluffs fronting the beach, and a general coarsening of beach
sediment. The railroad causeway was apparently not constructed at this time, as it is not identified on
the T‐sheet.
The development of the railroad, causeway, and granite rock revetment was researched and
documented by ATSI (2012). The railroad was not shown in an H‐sheet (#1814) dated 1887, but the
1891 supplemental sheet showed the railroad north of the study site. ATSI (2012) reported that the
railroad line was constructed in 1890 in attempt to become the west coast terminus for the
transcontinental railroad. The shoreline characteristics shown in the T‐sheet suggest that the beach
area near the current wetland is actually historic beach that has been buried by the railroad
causeway. Beach material excavated from test pits 5 and 6 (Table 2), which are located landward of
the causeway near the wetland, also suggests that the wetland is actually historic upper beach and
backshore that has been partially buried and truncated by the construction of the causeway (Figure
4).
Based on the shoreline configuration shown in the T‐sheet, the observed and mapped native bluff
points, and the likely beach sediment found at test pits 5 and 6 (Figure 4), one could surmise that
from south to north the original causeway was constructed as follows:
The bedrock headland was cut down to grade in the railway alignment, extending northward to
approximately towards the native bluff south point.
Parts of the southern end of the causeway were likely filled with the cut materials from native
bedrock and glacial and nonglacial sediments in the vicinity of the recessed beach (now a
depressional wetland).
The majority of causeway fill likely came from cutting into the high elevation native glacial and
nonglacial bluff within the northern reach of the causeway, at the native bluff north point.
Interviews with a local resident indicated that the granite for the rock revetment was placed
sometime after the construction of the causeway to protect it, perhaps around 1920, even though the
railroad was abandoned at approximately this time, (ATSI 2012). Historic vertical and ground
photographs are available; however, since the rock revetment predated the photos, these historic
photographs show little change in the shoreline.
Preliminary Design Alternatives
Restoration alternatives were explored for the project area in an effort to maximize habitat
restoration in balance with costs. Three alternatives were developed and are outlined below, along
with a brief discussion of the No Action alternative. The three alternatives are shown in Figure 8 and
summarized in Table 4.

Shannon Point Revetment Removal Feasibility and Preliminary Design Jan. 12, 2014 - Page 8 COASTAL GEOLOGIC SERVICES, INC.
Alternative 1: Full Restoration
This would entail removal of both the revetment and the entire causeway fill. Rock would first be
removed from the revetment and hauled off‐site by barge or overland. Trees and other vegetation
would be removed from the top of the causeway. Trees would be retained on‐site as large woody
debris (LWD) on the upper beach, while some smaller vegetation would be hauled offsite. All filled
portions of the causeway would then be removed for off‐site disposal. The causeway fill appeared to
consist of gravelly sand fill, however, a small amount of 1‐3 ft size native bedrock was visible in the
landward side of the causeway near the wetland, so it is possible that more of this rock is present in
the causeway fill.
Salt marsh habitat may become established landward of where the causeway fill is removed, in the
vicinity of the current wetland. Based on approximations of materials to be removed (Figure 8),
around 36,430 ft2 of beach habitat and up to 4,900 ft2 of potential salt marsh would be recovered with
Alternative 1. Site enhancement elements include revegetation, to be determined upon further
design development. Beach nourishment is not necessary at this site due to the quality of the existing
sand and gravel beach sediment along with input of sediment from adjacent feeder bluffs which will
become available upon removal of the revetment rock and causeway fill.
Alternative 2: Full Rock Revetment Removal
This alternative includes removal of all revetment rock from the project site, including both imported
granitic and native bedrock initially used to protect the causeway. Removal of this rock will expose the
causeway, which would likely be eroded rapidly in the first 2–3 years in what is termed deferred
erosion. After the initial relatively rapid adjustment to armor removal, the erosion rate is expected to
slow, but erosion would continue to re‐expose the upper beach to a similar bluff toe elevation as is
present just north of the revetment (approximately +10.5 ft MLLW). Leaving the causeway fill in place
would provide intermittent sediment input to the beach and drift cell. As the large majority of the fill
appears to be derived from local excavations into the nearby bluffs, this sediment will serve as beach
nourishment to augment the beach and its potential spawning habitat.
Trees at the waterward edge of the causeway and other vegetation will be addressed similar to that
described in Alternative 1. However, the majority of trees and vegetation would be left on top of the
causeway. Soil under many of these trees would erode over the coming years leading to toppling of
many trees, which would provide LWD to the nearshore.
Alternative 2 will be far more cost effective than full causeway removal due to the substantially
smaller volume of excavation and removal. However, additional fill removal may become necessary
where the surface of the causeway fill contains debris not suitable for beach sediment (fill not
associated with locally derived glacial and non‐glacial sediments such as angular rock). Any such
angular boulders in the exposed fill surface of the causeway should be excavated following removal of
the revetment rock and hauled off‐site for reuse or disposal. As this alternative would leave the
causeway fill to erode and nourish the beach, some amount of boulder would end up on the beach
from the fill, particularly in the south end of the site where more rock may be present. The condition
Shannon Point Revetment Removal Feasibility and Preliminary Design Jan. 12, 2014 - Page 9 COASTAL GEOLOGIC SERVICES, INC.
of the beach should be reviewed approximately 5 years after removal for the potential to remove
additional rock from the potential forage fish spawning band.
Based on estimated measurements of materials removed (Figure 8), approximately 15,250 ft2 of
beach habitat would be recovered with Alternative 2. Site enhancement elements include those listed
in Alternative 1.
Alternative 3: Partial Rock Revetment Removal
Partial rock revetment removal includes removal of all granitic rock, leaving the native bedrock
scattered along the beach or possibly moving native bedrock from the revetment in the south
sections onto the rocky headland area composed of the same material. Trees and other vegetation
will be dealt with similarly to that described in Alternative 2. The main filled causeway (Figure 3,
Sections 1‐3) likely contains sufficient native bedrock to continue to armor the toe of the causeway.
Erosion here is expected to remain very low. The northern revetment appears to contain primarily
granite, and native bedrock was not observed. This would lead to deferred erosion in the northern
reach similar to that described in Alternative 2.
Based on measurements and estimates of materials removed (Figure 8), approximately 7,330 ft2 of
beach habitat would be recovered with Alternative 3. Depending on the amount of native revetment
rock moved to near the rocky headland slightly more habitat area may be recovered under this
alternative. Site enhancement elements include those listed in Alternative 1. Benefits and constraints
are summarized in Table 3.
No Action: Existing Conditions
The no action scenario would consist of leaving all parts of the revetment in place and making no
changes to existing conditions. Under no action there will be no habitat benefits to the beaches in the
vicinity of the site and the beach area would continue to experience negative impacts such as
increased wave reflection and hydraulic turbulence, and continued greatly reduced productivity of the
intertidal beach (Johannessen and MacLennan 2007). Additionally, the historic feeder bluff
(MacLennan and Johannessen 2008) will continue to be disconnected from the net shore‐drift cell,
and no benefits to adjacent beaches would be realized.
With no action, the rock revetment will continue to pose a hazard to the public who wish to use the
trail for beach access. Also, there is a potential for further beach habitat burial from toppling boulders
from the rock revetment.
Phasing
Phasing of restoration actions is a possibility with Alternatives 1 and 2. For instance, Alternative 2
could act as a precursor to the full removable of the causeway fill (Alternative 1). While allowing for
limited funding to be utilized over the course of a multi‐phase approach, the phasing approach is
often more expensive because mobilization costs are doubled. Therefore, carrying out Alternative 2 is
Shannon Point Revetment Removal Feasibility and Preliminary Design Jan. 12, 2014 - Page 10 COASTAL GEOLOGIC SERVICES, INC.
recommended. Even if minor beach cleanup is required approximately 5 years after armor removal,
this would still be far less expensive in total than carrying out Alternative 1.
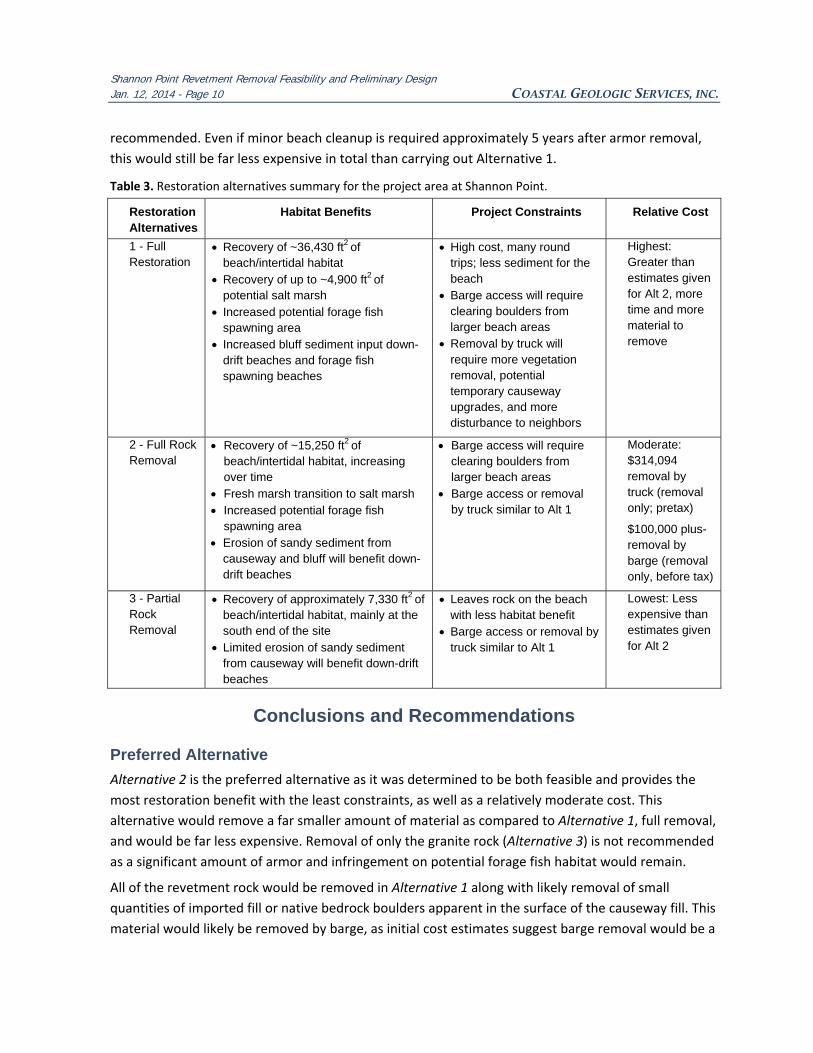
Table 3. Restoration alternatives summary for the project area at Shannon Point.
Restoration Alternatives
Habitat Benefits Project Constraints Relative Cost
1 - Full Restoration
Recovery of ~36,430 ft2 of beach/intertidal habitat
Recovery of up to ~4,900 ft2 of potential salt marsh
Increased potential forage fish spawning area
Increased bluff sediment input down-drift beaches and forage fish spawning beaches
High cost, many round trips; less sediment for the beach
Barge access will require clearing boulders from larger beach areas
Removal by truck will require more vegetation removal, potential temporary causeway upgrades, and more disturbance to neighbors
Highest: Greater than estimates given for Alt 2, more time and more material to remove
2 - Full Rock Removal
Recovery of ~15,250 ft2 of beach/intertidal habitat, increasing over time
Fresh marsh transition to salt marsh Increased potential forage fish
spawning area Erosion of sandy sediment from
causeway and bluff will benefit down-drift beaches
Barge access will require clearing boulders from larger beach areas
Barge access or removal by truck similar to Alt 1
Moderate: $314,094 removal by truck (removal only; pretax)
$100,000 plus- removal by barge (removal only, before tax)
3 - Partial Rock Removal
Recovery of approximately 7,330 ft2 of beach/intertidal habitat, mainly at the south end of the site
Limited erosion of sandy sediment from causeway will benefit down-drift beaches
Leaves rock on the beach with less habitat benefit
Barge access or removal by truck similar to Alt 1
Lowest: Less expensive than estimates given for Alt 2
Conclusions and Recommendations
Preferred Alternative
Alternative 2 is the preferred alternative as it was determined to be both feasible and provides the
most restoration benefit with the least constraints, as well as a relatively moderate cost. This
alternative would remove a far smaller amount of material as compared to Alternative 1, full removal,
and would be far less expensive. Removal of only the granite rock (Alternative 3) is not recommended
as a significant amount of armor and infringement on potential forage fish habitat would remain.
All of the revetment rock would be removed in Alternative 1 along with likely removal of small
quantities of imported fill or native bedrock boulders apparent in the surface of the causeway fill. This
material would likely be removed by barge, as initial cost estimates suggest barge removal would be a

Shannon Point Revetment Removal Feasibility and Preliminary Design Jan. 12, 2014 - Page 11 COASTAL GEOLOGIC SERVICES, INC.
significant cost savings and less upland disturbance over truck removal. Project planning should
include acquiring firm bids from reputable contractors prior to a final decision on removal method.
Alternative 2 would result in a large, immediate gain of upper beach habitat through direct removal of
all of the revetment rock on site. Additionally, causeway fill would nourish the beach and drift cell
over time, enlarging the beach area through erosion of high elevation fill and also the deposition of
this sediment. Causeway fill would provide a short‐ to medium‐term sediment source to the drift cell
as it is eroded by wave action. Over approximately 5 years or less, most of the fill is expected to be
eroded, restoring the upper intertidal and adjacent, narrow backshore areas. This will also likely result
in landward sediment transport in part of the current small, closed freshwater. This wetland is only
present now due to the causeway, as no feature was mapped in the T‐sheet and this is an unlikely
location for such a feature naturally.
Constraints and benefits of the preferred alternative are outlined first below, followed by a detailed
evaluation of these constraints, which are the key factor to determine if the benefits can be realized
on the ground.
Constraints
Stability of three parcels at the south end of the revetment (parcels P117670, parcel P117669,
parcel P117668) are further assessed from slope stability under the recommended revetment
rock removal and subsequent erosion of the causeway fill of the preferred alternative. Other
parcels in the vicinity are either built on bedrock, or do not appear to be impacted by the
proposed actions.
Access and method of removal, whether by truck overland or by barge is described more
thoroughly below. It appears that removal by barge may be lower cost and lower impact to
neighbors.
Cost of the project is a major consideration. For the length of shore restored, the balance
between cost and habitat benefit appears favorable.
Parcel owners within the proposed removal area, Western Washington University and the City
of Anacortes (Figure 6), are willing project partners at this stage and do not appear to be
constraints.
Benefits
The site presents a very good opportunity for nearshore habitat restoration. This restoration
opportunity was identified as a priority within drift cell SK‐D‐2 (MacLennan and Johannessen 2008)
based on the extent of beach burial (southern end of revetment was estimated to +4.2 ft MHHW),
potential forage fish spawning habitat, and length of shore/volume of sediment to re‐enter the drift
cell.
The bulkhead at the site appears unnecessary as it was originally constructed to protect a cut and
filled causeway in the late 1800’s with additional rock added in the 1920’s. The shore modifications
appear to have covered a moderate amount of upper beach habitat and created a barrier between

Shannon Point Revetment Removal Feasibility and Preliminary Design Jan. 12, 2014 - Page 12 COASTAL GEOLOGIC SERVICES, INC.
the historic bank and upper beach and coastal waters. Restoration recommendations provided in this
feasibility assessment are generally consistent with those found in the ”Management Measures”
report created to provide guidance for conceptualizing and designing nearshore restoration projects
in Puget Sound (Clancy at al. 2009). Management Measure 1: Armor Removal, is beneficial by
providing the following:
Improved connectivity between upland and littoral drift processes
Restoring sediment transport processes and shoreform diversity
Increasing shoreline resilience in the face of projected sea level rise
Restoring a ‘valued ecosystem component’ that would in turn directly benefit salmon, forage
fish, clams, and eelgrass
Social and political benefits including improved aesthetic and recreational values.
See discussion of Alternative 2 and Preferred Alternative above for specific project benefits.
Slope Stability Assessment for Preferred Alternative
Slope stability of the bluffs landward of the southern portion of the rock revetment and causeway are
more thoroughly discussed in this section to discern if proposed revetment removal actions could
further destabilize slopes and pose a threat to the houses. The slopes in this vicinity are documented
as stable by the Department of Ecology Coastal Zone Atlas (Ecology 1979; Figure 5), however evidence
of slope instability was present during the field visits.
Property ownership in the vicinity of the project area has been researched through the Skagit County
Assessor, shown in Figure 6, and includes nearby properties of the Sunset Cove development which
are the subject of this slope stability investigation.
Integration of Previous Geology/Stability Work
Geotechnical reports were obtained from the City of Anacortes to further explore previously
documented conditions relating to slope stability of the uplands at this location. The preliminary
geotechnical engineering report for Sunset Cove Project (subdivision development in Anacortes)
produced by Associated Earth Sciences, Inc. (AES 1992) had the most relevant information for the
area in question. AES found very low and low landslide hazards along the northern boundary of the
Sunset Cove development prior to development based on the geologic unit (lodgement till) and
slopes. Subsurface geology was explored by AES at 5 exploration pits, 2 of which are on the north end
of the development and within the area of further slope stability exploration. Exploration pits EP‐3
and EP‐5 were recorded by AES as topsoil overlying glacial outwash and till at relatively shallow
depths, both reaching interpreted lodgement till at approximately 7 ft below ground surface (Table 4
for data log; Figure 7 for location map). AES (1992) had recommended house setbacks of at least 25 ft
from top of slope where slopes were 40 percent or greater as part of landslide mitigation.
The sediment description from the subsurface exploration by AES shows till extending 50 ft farther
west than was mapped by DNR at 1:100,000 (coarse) scale mapping. Other than simply a scale of
mapping issue for the WDNR data, this discrepancy is likely due to the tendency of lodgement till to

Shannon Point Revetment Removal Feasibility and Preliminary Design Jan. 12, 2014 - Page 13 COASTAL GEOLOGIC SERVICES, INC.
Table 4. AES (1992) exploration pit logs at EP‐3 and EP‐5 and record of subsurface sediments.
be deposited directly over other geologic units, as the bedrock can be very clearly observed in lower
elevations in the vicinity of the house at parcel P117670 where EP‐5 was located. It is very possible
that lodgement till overlies some portions of bedrock at this location. Moving east from this location
Shannon Point Revetment Removal Feasibility and Preliminary Design Jan. 12, 2014 - Page 14 COASTAL GEOLOGIC SERVICES, INC.
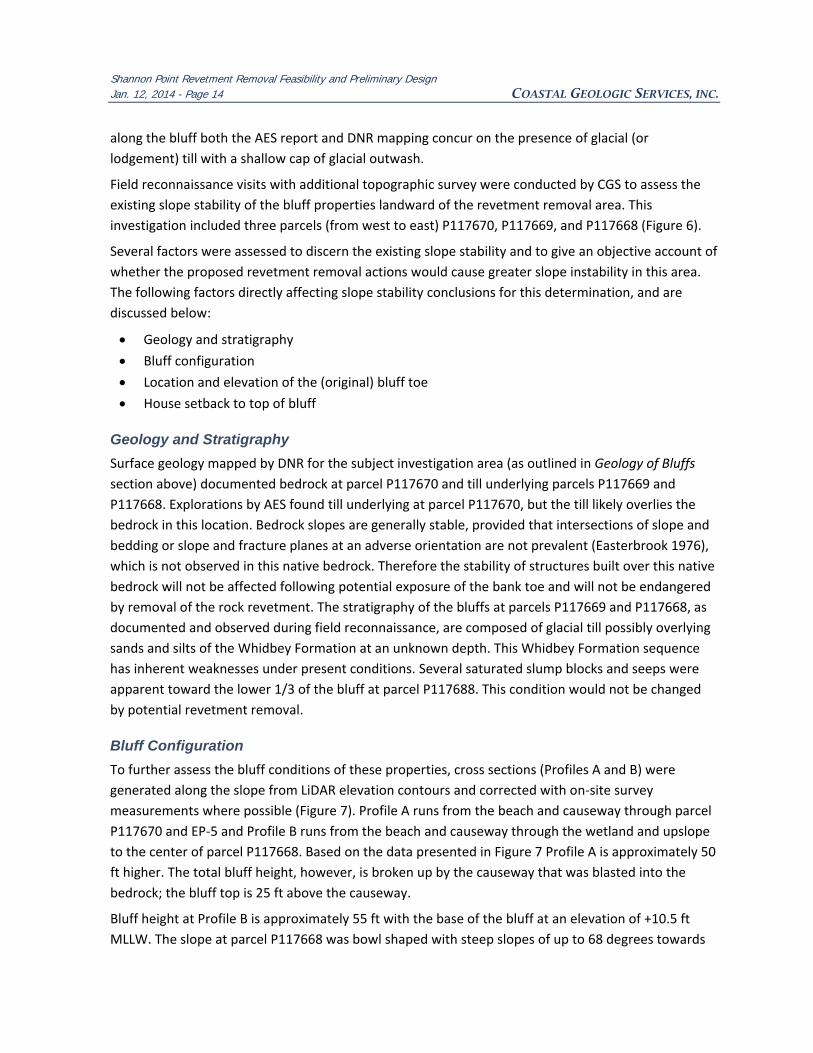
along the bluff both the AES report and DNR mapping concur on the presence of glacial (or
lodgement) till with a shallow cap of glacial outwash.
Field reconnaissance visits with additional topographic survey were conducted by CGS to assess the
existing slope stability of the bluff properties landward of the revetment removal area. This
investigation included three parcels (from west to east) P117670, P117669, and P117668 (Figure 6).
Several factors were assessed to discern the existing slope stability and to give an objective account of
whether the proposed revetment removal actions would cause greater slope instability in this area.
The following factors directly affecting slope stability conclusions for this determination, and are
discussed below:
Geology and stratigraphy
Bluff configuration
Location and elevation of the (original) bluff toe
House setback to top of bluff
Geology and Stratigraphy
Surface geology mapped by DNR for the subject investigation area (as outlined in Geology of Bluffs
section above) documented bedrock at parcel P117670 and till underlying parcels P117669 and
P117668. Explorations by AES found till underlying at parcel P117670, but the till likely overlies the
bedrock in this location. Bedrock slopes are generally stable, provided that intersections of slope and
bedding or slope and fracture planes at an adverse orientation are not prevalent (Easterbrook 1976),
which is not observed in this native bedrock. Therefore the stability of structures built over this native
bedrock will not be affected following potential exposure of the bank toe and will not be endangered
by removal of the rock revetment. The stratigraphy of the bluffs at parcels P117669 and P117668, as
documented and observed during field reconnaissance, are composed of glacial till possibly overlying
sands and silts of the Whidbey Formation at an unknown depth. This Whidbey Formation sequence
has inherent weaknesses under present conditions. Several saturated slump blocks and seeps were
apparent toward the lower 1/3 of the bluff at parcel P117688. This condition would not be changed
by potential revetment removal.
Bluff Configuration
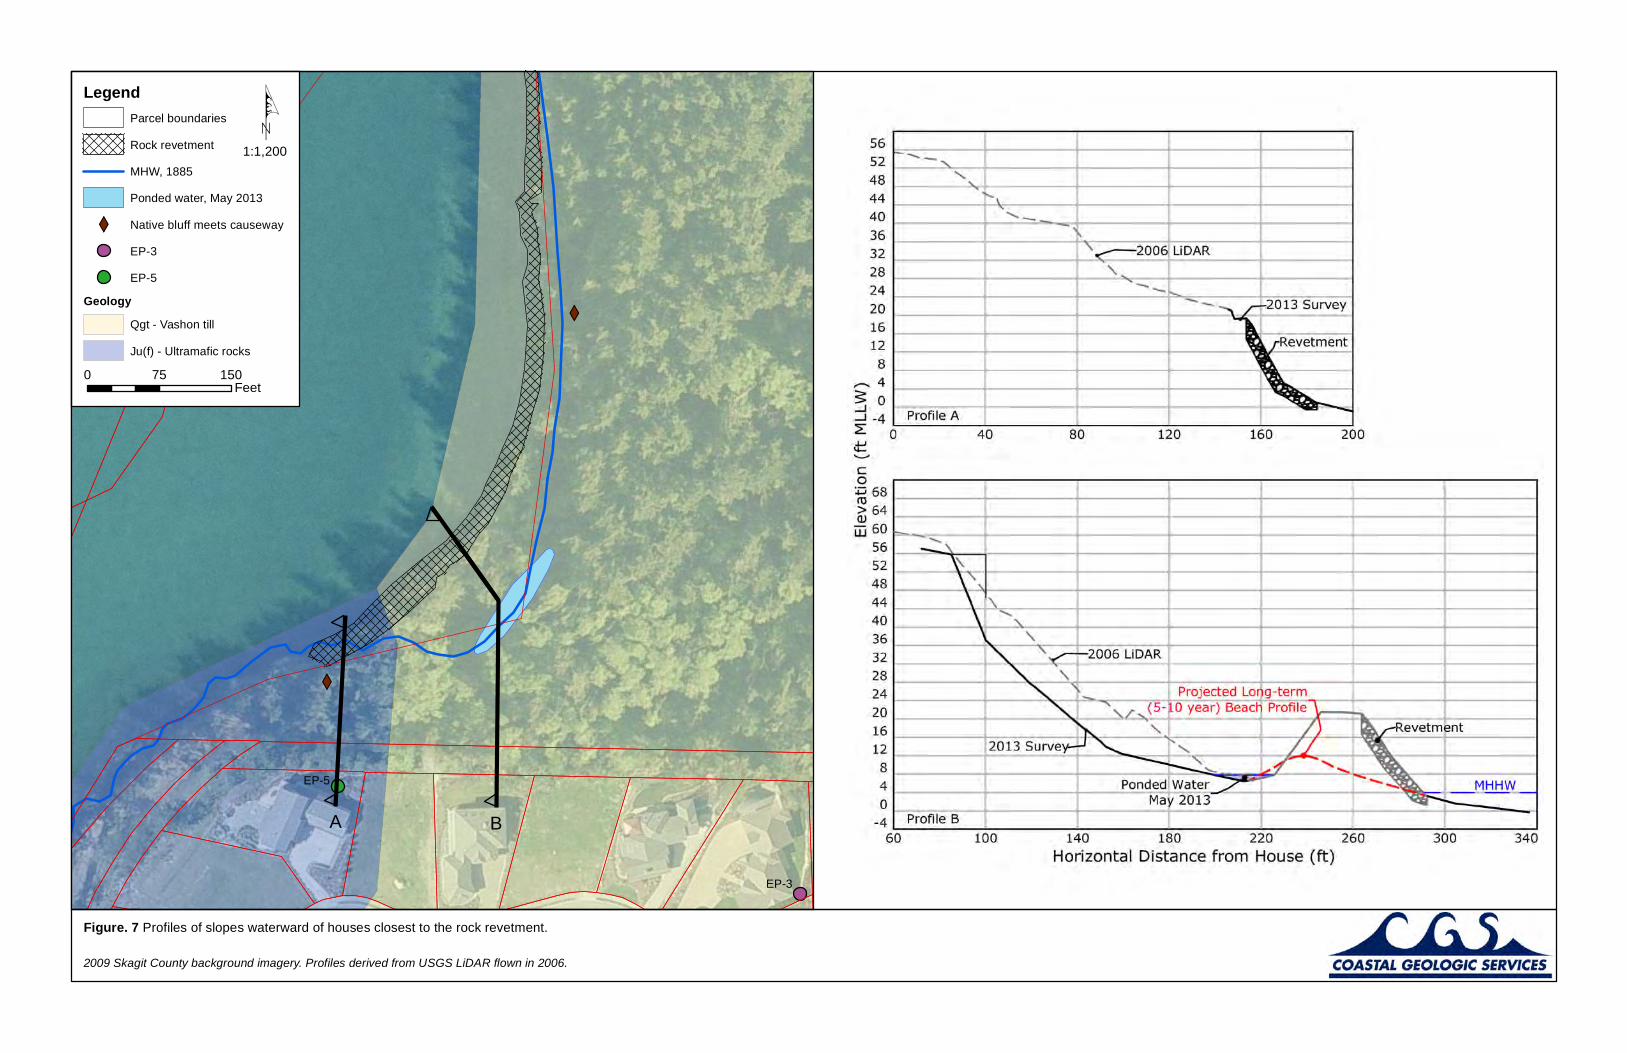
To further assess the bluff conditions of these properties, cross sections (Profiles A and B) were
generated along the slope from LiDAR elevation contours and corrected with on‐site survey
measurements where possible (Figure 7). Profile A runs from the beach and causeway through parcel
P117670 and EP‐5 and Profile B runs from the beach and causeway through the wetland and upslope
to the center of parcel P117668. Based on the data presented in Figure 7 Profile A is approximately 50
ft higher. The total bluff height, however, is broken up by the causeway that was blasted into the
bedrock; the bluff top is 25 ft above the causeway.
Bluff height at Profile B is approximately 55 ft with the base of the bluff at an elevation of +10.5 ft
MLLW. The slope at parcel P117668 was bowl shaped with steep slopes of up to 68 degrees towards

Shannon Point Revetment Removal Feasibility and Preliminary Design Jan. 12, 2014 - Page 15 COASTAL GEOLOGIC SERVICES, INC.
the upper 1/3 of the bluff face (Figure 7). While Parcel P117669 exhibited similar bluff height as that
of Profile B (and parcel P117668) it also exhibited a gentler grade and apparent longer recurrence
interval of past slope failures compared to parcel P117668. The aspect of this bluff is north and is
offered natural protection from wave attack provided by the bedrock headland at the southern end of
the project area. The bluff at parcel P117668 exhibits a north‐northwest aspect and represents the
highest and steepest of the three parcels assessed, however the toe of the bluff is also inset further
south than at the other parcels.
Location and Elevation of Bluff Toe
Parcel P117670 is likely located on bedrock so the lower slope or more of this parcel is inherently
stable. Parcel P117669 is set back approximately 100 ft from the waterward toe of the revetment and
at an elevation of +14 ft MLLW, as measured in GIS. Should the revetment rock be removed and the
causeway fill material left to naturally erode, the bluff toe at this parcel is well protected from wave
attack based on the distance from the causeway and beach, with the bank toe elevation 6 ft above
MHHW (MHHW = +8 ft MLLW). Parcel P117668 is set back approximately 140 ft from the waterward
toe of the revetment and also an elevation of +14 ft MLLW, as measured in GIS (Profile B in Figure 7).
The bluff toe at this location is well away from wave attack following potential removal of the
revetment.
House Setback to Top of Bluff
As measured in GIS and survey data, all 3 of the houses on the respective parcels assessed have an
adequate set back of 65 to 80 ft from the bluff crest. This is far greater than the minimum setback
recommended by AES (1992) of 25 ft.
Overall, it is the conclusion of these geologists that removing the revetment rock would not further
destabilize the banks near the houses in the study or pose threats to the homes associated with these
bluffs, and that the proposed revetment removal action is therefore feasible. Property management
including proper vegetation management and surface water drainage control are recommended for
the bluff properties assessed here that already exhibit a degree of slope instability.
Implementation Considerations and Analysis
Methods of rock removal include overland using trucks or by water with a barge. Both methods have
been explored through review of existing information (ATSI 2012) and new interviews with
contractors, along with our professional judgment based on over 20 years of implementing projects in
the Puget Sound region. Two removal methods are outlined here along with preliminary, planning
level cost estimates.
Removal by Truck Overland
Considerations for removal overland by truck include:

Shannon Point Revetment Removal Feasibility and Preliminary Design Jan. 12, 2014 - Page 16 COASTAL GEOLOGIC SERVICES, INC.
Opening up the right‐of‐way at the north end of Puget Road (the beginning of the foot trail near
2 driveways) would likely require moving and replacing existing small rock walls, fences,
mailboxes, trees
Avoid using the driveway at 2420 Puget Road (See Barrett property on Figure 6)
Steep grade from access point going down to the causeway to the north
Small trees growing in and adjacent to trail would need to be removed
South end of foot trail was recently graded and graveled, and adjacent areas seeded with grass;
these and other areas along the causeway in the project area may need to be temporarily
improved prior to commencing project work
Entire construction working and access area would need to be revegetated and repaired
All trees would need to be cleared from the top of the causeway to allow truck access
Strandberg Construction provided a preliminary cost estimate for overland rock removal (ATSI 2012).
This estimate totaled $213,584 without tax for the removal of 1,700 CY of rock, and not including
design, surveying, permitting, or oversight (Table 4 ATSI 2012). We project that this estimate from
Strandberg Construction would increase to approximately $314,094 without tax for removal of 2,500
CY of rock quantified for this feasibility assessment.
Removal by Barge
Considerations for removal by barge include:
Would likely need to avoid grounding on eelgrass
Only access is several points along the southern half of the beach where beach is sandy and
mostly devoid of large boulders (also where majority of the rock is located)
Would likely need to move a small number of large boulders from the intertidal sandy beach
Work would be tide dependent, with different work areas limited by tide height
Would require storage facility for rock
Larry Jay, the owner of JTC barge transport company, was consulted and performed a site visit along
with Johannessen on June 22, 2013. Jay was given the survey sheets (Appendix A) and the estimated
total volume of 2,500 CY. Jay gave a preliminary estimate of $100,000 (not including tax) to complete
removal of all the rock (Alternative 2). However, this was based on incomplete assessment of all
project logistics, and the use of a higher total cost will therefore be incorporated into the cost
estimate, below.
JTC was told to plan on bringing half of the removed rock to the north shore of Fidalgo Island and
stockpile it in several discrete locations along the eastern end of the proposed new Guemes Channel
trail corridor on the upper beach (pending plans from City of Anacortes; reuse is further discussed
below) for future use by the City of Anacortes. The estimate would likely be the same whether JTC
was taking all of the rock away or leaving half on the north shore, as the full volume of rock would be
much more than Jay would like to resell. Moving the rock from the beach to a storage yard is a
considerable amount of work including multiple handling efforts, and the value of the rock in place is
Shannon Point Revetment Removal Feasibility and Preliminary Design Jan. 12, 2014 - Page 17 COASTAL GEOLOGIC SERVICES, INC.
therefore quite small. Constraints include not being able to land the barge on the boulder and cobble
beach along the central and western end of the potential, future Guemes Channel Trail corridor.
This cost estimate is greatly reduced from the quote provided by Culbertson Marine Construction of
$700,000 to $800,000 (ATSI 2012). A more detailed cost estimate using CGS cost estimating and
project implementation experience along with the quote from JTC will be further developed in both
the 30% and 100% design stages, which will include additional project elements such as sales tax,
permitting, potential site enhancement, monitoring, and construction oversight.
Rock Reuse
CGS had several discussions with City of Anacortes Parks Director Gary Robinson during the
preparation of this report. The purpose of these discussions was to determine reasonable reuses of
the riprap removed from this site, if practical. The City will have final say as to the appropriate fate of
the armor rock. Other than letting a contractor take the rock away for resale in trade for offering a
lower removal charge, two potential uses of the rock were mentioned:
Repair of the failing former railroad revetment along the central and eastern reach of the
planned future Guemes Channel Trail
Construct a trail extension from the south edge of the riprap removal area northeastward to the
uplands near the south property line of the WWU Shannon Point Marine Center
Guemes Channel Trail ‐ The potential Guemes Channel Trail extension would run from the recently
completed western portion of the trail over to the Lovric’s Sea Craft marina area. This is an
approximately 3,500‐4,000 ft long reach. The already completed western portion is on the order of
2,000 ft long. The City of Anacortes Public Works Department is beginning design work for repair of
the old railroad grade for the Guemes Channel Trail extension. Portions of the 1890s railroad grade,
the foundation of the trail extension, have small and large washouts. It is understood that riprap will
need to be imported to repair some or all of these washout areas. City engineers are considering
bridging some of these gaps, or washouts, in preparation for future trail construction; however the
cost may be prohibitive. We also understand the City has hired a permit specialist which is currently in
discussion with the engineers about these trail issues.
Since the quantity of rock needed for the Guemes Channel Trail work is unknown, it is very difficult to
attempt to plan logistics for this potential action. However, unloading and staging rock in discrete
locations along the future Guemes Channel trail is a good option for rock storage if future
development of the trail is nearly certain.
Potential New Trail Extension/ Ramp ‐ As explained by Gary Robertson of the City of Anacortes Parks
Department, the City is considering developing a new trail starting from the short trail reach off of the
north end of Puget Way. This trail would run near the southern property line of the WWU owned
Shannon Point Marine Center (Figure 6). The proposed trail would gain elevation to the east as it
reached the uplands. The route could run on some combination of the southern edge of the WWU
Shannon Point Marine Center and/or through the community‐owned parcel between the houses and

Shannon Point Revetment Removal Feasibility and Preliminary Design Jan. 12, 2014 - Page 18 COASTAL GEOLOGIC SERVICES, INC.
the WWU property. The trail would continue eastward to reach the Washington State Ferry Terminal
area.
In order to gain trail access to the uplands, a means of reaching the trail from the south edge of the
riprap removal area (where the short trail section exists) is required. This would entail placement of
trail access across approximately 300‐400 horizontal ft with an approximate net elevation gain of
approximately 45‐60 ft. This trail route would need to avoid the upland residential properties. A 30 ft
community owned easement exists along the north edge of this strip of properties (Figure 6), which
the City is investigating whether or not the restrictions and uses attached to this parcel will allow for
trail development. Alternatively, the trail would run immediately north of this 30 ft east‐west oriented
parcel.
The area below the developed upland lots is on a slope that abuts the backshore wetland landward of
the railroad causeway within the study area. The wetland could be a substantial constrain on adjacent
filling and grading. The entire area is forested with immature alder, elderberry, young Douglas fir, and
scattered western redcedar and western hemlock trees. Groundcover species include sword fern,
nettles, and a variety of other native species along with very small amounts of Himalayan blackberry.
The geology was investigated briefly. The upper portion of the bank in this slope appeared to contain
gravelly sand which overlies sand with lesser amounts of gravel. Below that clay and perhaps glacial
till were encountered. Determining the exact nature of the soils here will require additional
investigation. It appears as some amount of fill soil was pushed over the crest of the bank from above
containing boulders and a variety of other grain sizes.
The slopes south and southeast of the wetland on this potential trail area varied. The upper bank
slope was as steep as 50 degrees from vertical (Figure 7). The majority of the bank face was sloped
from 30 to 40 degrees with lesser gradients on the lower portions of the slope. Slopes this steep in
unconsolidated glacial or nonglacial sediments present another substantial constraint to developing a
trail in this area.
If this trail ramp were to be built using salvaged riprap from the project site, it would require getting
heavy equipment to the site. The trail immediately south of the project area would need to be
improved as well; therefore, this may make removal of the remainder of the riprap by truck slightly
more attractive. In any event, heavy equipment would need to reach the site by land or by barge to
move riprap into this proposed trail ramp. Access for heavy equipment by land would require the
same amount of additional work as removal of riprap by land would require. See section Removal by
Truck Overland.
Preferred Alternative
Design drawings for the preferred alternative have been advanced to the 60% design level. A large
format (11x17”) design sheet set is attached which shows existing and proposed conditions, along
with details and cross sections (Appendix A). This design will be further developed into final
construction drawings in the next phase. A small format (8.5x11”) design sheet set is also attached for
permitting with the US Army Corp of Engineers (USACE; Appendix A).
Shannon Point Revetment Removal Feasibility and Preliminary Design Jan. 12, 2014 - Page 19 COASTAL GEOLOGIC SERVICES, INC.
Cost Estimate
A cost estimate was developed using a CGS cost estimating spreadsheet, some of which was first
incorporated into a spreadsheet developed by CGS and other project leads for the Puget Sound
Nearshore Estuary Restoration Project (PSNERP) and WDFW for conceptual design of 34 different
projects around the Puget Sound region (ESA et al. 2012). The cost estimating work for the project
relied on past project cost data, and general knowledge of remote access sites such as this.
Specific costs were estimated for barge use, revetment removal, and excavation and grading of the
outer face of the causeway fill, and presented in Table 5. Design and permit costs were not included in
the cost estimate.
Mobilization was assumed to be 10% of the total estimated costs for project elements for this site.
Estimates of the cost of minimal erosion control and construction management were included as
percentages of the total of project element, along with a contingency of 20%. The following cost
estimate was developed for the preferred alternative for planning purposes (Table 5). The total
estimated cost without contingency was estimate at just under $140,000. With 20% contingency
added, the total cost was just under $168,000.

Shannon Point Revetment Removal Feasibility and Preliminary Design Jan. 12, 2014 - Page 20 COASTAL GEOLOGIC SERVICES, INC.
Table 5. Cost estimate for Preferred Alternative based on 60% design.
Limitations of This Report This report was prepared for the specific conditions present at the subject property to meet the needs
of the specific client. No one other than the client should apply this report for any purposes other
than that originally contemplated without first conferring with the geologist who prepared this
report. The findings and recommendations presented in this report were reached based on field visits
and background information. The report is based on examination of surface features, bank exposures,
soil characteristics, beach features, and coastal processes. In addition, conditions may change at the
site due to human influences, floods, earthquakes, groundwater regime changes, or other factors.
Action Name:
Date:
By:
Note: PRELIMINARY, based on 60% Design only
REMEDY: Preferred Alternative: Revetment Removal
Construction Period TBD
ItemUnit of
MeasureUnit Cost Qty Total Cost Notes
MOBILIZATION AND ACCESS for construction activitiesMobilization/Demob(Equipment, Personnel, Planning, Financial) LS 10% 1 $12,417
General mobilization of people and equipment
Tug and barge-1,000 ton capacity Days $4,000 10 $40,000 Barge-specific costs
Site Demolition Activities No structures to remove 0 $0
Hazardous/Contaminated Waste RemovalNone anticipated 0 $0
EARTHWORKRevetment removal for haul offsite
CY $25 2500 $62,500Remove entire revetment, including rock toppled to upper beach
Excavation - LowlandCY $25 500 $12,500
Removal of fill above the revetment rock to match new bank slope
GradingCY $5.00 500 $2,500
Placement of cut sediment on exposed beach to match existing beach grade
Vegetation & Erosion ControlErosion / sediment BMPs - Temp.
% 2.5% 1 $3,104% of total construction cost; low cost for minimal actions
Final Design & Construction ManagementFinal design, engineering % 18% 1 $0
Permitting % 6% 1 $0
Construction oversightweeks $3,334 2 $6,668
Assume 1 person at total cost of $200k/ yr: this is full time observation and contract admin; would be spread over
Construction Cost TotalSubtotal without percentage-based costs $124,168
Subtotal of percentage-based costs $15,521
Total Cost $139,689
Contingency (20%) $27,938
Total Cost with Contingency $167,627
Construction Cost Estimate for Shannon Point Revetment Removal, Anacortes, WA
1/11/14
Jonathan Waggoner, Jim Johannessen, LEG; CGS

Shannon Point Revetment Removal Feasibility and Preliminary Design Jan. 12, 2014 - Page 21 COASTAL GEOLOGIC SERVICES, INC.
Thank you for engaging the professional services of Coastal Geologic Services, Inc. If we can be of any
additional assistance please contact our office at (360) 647‐1845.
References Aqua‐Terr Systems, Inc. 2012. Shannon Point rip rap removal project, feasibility and cost estimate study.
Anacortes, Washington. Pp. 22.
Carlson, R.L., 1972. A gravity study of the Cypress Island peridiotite, Washington: University of Washington Master of Science thesis, 39 p., 2 plates.
Clancy, M., I. Logan, J. Lowe, J. Johannessen, A. MacLennan, F.B. Van Cleve, J. Dillon, B. Lyons, R. Carman, P. Cereghino, B.
Barnard, C. Tanner, D. Myers, R. Clark, J. White, C. A. Simenstad, M. Gilmer, and N. Chin. 2009. Management
Measures for Protecting the Puget Sound Nearshore. Puget Sound Nearshore Ecosystem Restoration Project Report
No. 2009‐01. Published by Washington Department of Fish and Wildlife, Olympia, WA.
Dragovich, J. D., G. T. Petro, G.W. Thorsen, S.L. Larson, G.R. Foster, and D.K. Norman, 2005. Geologic Map of the Oak Harbor, Crescent Harbor, and Part of the Smith Island 7.5‐minute Quadrangles, Island County, Washington: Washington Division of Geology and Earth Resources Geologic Map GM‐59, 3 sheets, scale 1:24,000.
Dragovich, J. D., Troost, M. L., Norman, D. K., Anderson, G., Cass, J., Gilbertson, L. A., and McKay, D. T. Jr., 2000. Geologic Map and Interpreted Geologic History of the Anacortes South and La Conner 7.5‐minute Quadrangles, Skagit County, Washington: Washington Division of Geology and Earth Resources Geologic Map, Open File Report 2000‐6.
Easterbrook, D.J., 1976. Map showing engineering characteristics of geologic materials in western Whatcom County, Washington: U.S. Geological Survey Miscellaneous Investigation Series Map I‐854‐D, 1 sheet.
ESA, Anchor‐QEA, KPFF, and CGS, 2012. Strategic Restoration Conceptual Engineering – Design Report. Prepared
for Puget Sound Nearshore Ecosystem Restoration Project and WDFW, Seattle, WA.
Johannessen, J.W. and A.J. MacLennan, 2007. Beaches and Bluffs of Puget Sound. Puget Sound Nearshore Ecosystem Restoration Project Report No. 2007‐04. Published by Seattle District, U.S. Army Corps of Engineers, Seattle, Washington.
Keuler, R.F., 1988. Map showing coastal erosion, sediment supply, and longshore transport in the Port Townsend 30‐ by 60‐minute quadrangle, Puget Sound region, Washington: U.S. Geologic Survey Miscellaneous Investigations Map I‐1198‐E, scale 1:100,000.
Lapen, T.J., 2000. Geologic map of Bellingham 1:100,000 quadrangle, Washington, Washington Division of Geology and Earth Resources Open File Report 2000‐5.
MacLennan, A.J., and J.W. Johannessen. 2008. North Fidalgo Island geomorphic assessment & drift cell restoration prioritization. Prepared from Skagit County Marine Resources Committee. Prepared by Coastal Geologic Services, Inc. Pp. 35, 12 Maps.
MacLennan, A.J., J.W. Johannessen, S.A. Williams, W. Gerstel, J.F. Waggoner, and A. Bailey, 2013. Feeder Bluff Mapping of Puget Sound. Prepared for the Washington State Department of Ecology, 111p.
NOAA. Mean Higher High Water (MHHW) for the Shannon Point area as averaged from the Bowman Bay and Armatige Island benchmarks.
Penttila, D. E. 2007. Marine Forage Fishes in Puget Sound. Puget Sound Nearshore Partnership Report No. 2007‐03, Published by Seattle District, U.S. Army Corps of Engineers, Seattle, Washington
Simenstad, C., Ramirez, M., Burke, J., Logsdon, M., Shipman, H., Tanner, C., Davis, C., Fung, J., Block, P., Fresh, K., Campbell, S., Myers, D., Iverson, E., Bailey, A., Schlenger, P., Kiblinger, C., Myre, P., Gerstel, W., and MacLennan, A., 2011. Historic Change and Impairment of Puget Sound Shorelines: Puget Sound Nearshore

Shannon Point Revetment Removal Feasibility and Preliminary Design Jan. 12, 2014 - Page 22 COASTAL GEOLOGIC SERVICES, INC.
Ecosystem Project Change Analysis. Puget Sound nearshore Report No. 2011‐01. Published by Washington Department of Fish and Wildlife, Olympia, Washington, and U.S. Army Corps of Engineers, Seattle, WA.
Schwartz, M.L., Harp, B.D., Taggart, B.E., and Crzastowski, M., 1991. Net shore‐drift of Washington State, Washington Department of Ecology, Shorelands and Coastal Zone Management Program, Olympia, WA.
Slocum, Tom, 2011. Field Inventory of Armoring. Memorandum to Shannon Point Shoreline Armoring Project File.
Washington Department of Ecology (Ecology), 1979. Coastal Zone Atlas of Washington, Volume 2, Skagit County. Olympia, WA.
Washington Department of Fish and Wildlife, 2004. Priority Habitat Species Database Information.
Washington State Department of Natural Resources (DNR), 2010. Surface Geology, 1,100,000 scale [Geodatabase]. Division of Geology and Earth Resources, Olympia, WA. http://www.dnr.wa.gov/ResearchScience/Topics/GeosciencesData/Pages/gis_data.aspx
Coastal Geologic Services, Inc.
Jim Johannessen, Stephanie Williams
Licensed Engineering Geologist, MS Licensed Geologist
ATTACHMENTS:
Figure 1. Shannon Point revetment removal study area location and net shore‐drift map.
Figure 2. Shannon Point geologic mapping at 1:100,000 scale (DNR 2010).
Figure 3. Shannon Point site features map.
Figure 4. Shannon Point historic conditions map.
Figure 5. Shannon Point slope stability mapping in the project area (Ecology 1979).
Figure 6. Shannon Point and vicinity ownership information map.
Figure 7. Profiles of slopes waterward of houses closest to the rock revetment.
Figure 8. Restoration alternatives for the Shannon Point revetment and causeway.
Photo Page 1. Oblique aerial photograph of the rock revetment and railroad causeway (Ecology 2006).
Photo Page 2. Geologic units and beach characteristics.

Shannon Point Revetment Removal Feasibility and Preliminary Design Jan. 12, 2014 - Page 23 COASTAL GEOLOGIC SERVICES, INC.
Photo Page 3. Rock revetment sections 1‐7, south to north with 3 ft scaled grid.
Photo Page 4. Test pit excavations for causeway materials exploration.
Photo Page 5. Test pit excavations for causeway materials exploration and wetland observations.
APPENDIX A:
60% Design Sheet Set for Permitting‐large format (9sheets)
60% Design Sheet Set for Permitting‐small format (9sheets)

Be l l i ng h am
Ch a
nne l
USGS Topographic Quadrangles, LiDAR Hillshade, and ESRI 2010 background imagery.
Figure 1. Shannon Point revetment removal study area location and net shore-drift map.
Shannon Point revetment removal
project area
City of Anacortes
Bel
l in
gh
am
Ch
an
ne
l
1:500,000Fidalgo Island, Skagit County
LegendNet shore-drift (NSD)
Left to Right
Right to Left
No Appreciable Drift
1:24,000A
0 0.25 0.5Miles
NSD Direction
Drift Cell SK-D-2
_̂Project
Area
Ro
sari
o
Str
ait
FIDALGO ISLAND
GUEMESISLAND
CYPRESSISLAND
Qgt
Ju(f)
ESRI 2010 background imagery.
Figure 2. Shannon Point geologic mapping at 1:100,000 scale (DNR 2010).
1:2,400A
0 125 250Feet
Qgt
Qf
Ju(f)Qb
Qp
Ju(f)
wtr
Qgt
Ju(f)
Northwest Fidalgo Island, Skagit County 1:48,000
Project Area
LegendGeologic Unit
Qf - Fill
Qb - Beach
Qp - Peat
Qgt - Vashon till
Ju(f) - Ultramafic rocks

XW
XW
TP 9TP 8
TP 7
TP 6
TP 5
TP 4TP 3
TP 2
TP 1
TP 10
2009 Skagit County background imagery.
Figure 3. Shannon Point site features map.
1:1,200A
0 75 150Feet
Section 1
Section 2
Section 3
Section 4
Section 5
Section 6
Section 7
Survey rock
LegendXW Native bluff
Test pits
Section breaks
Railroad causeway
Approximate wetland
Native bluff south
Native bluff north

XW
XW
T-sheet #1667 (c. 1885) background imagery.
Figure 4. Shannon Point historic conditions map with current features for comparison.
LegendXW Native bluff
TP 5
TP 6
Survey rock
Waterward causeway
1:2,000A
0 125 250Feet
TP 5
TP 6
Rockyheadland
Lost beach/intertidal
Bluffs fronting the beach
Coarsening of beach sediment
Native bluff south
Native bluff north
Approx. historicMLLW line

Figure 5. Shannon Point slope stability mapping in the project area showing stable slopes (Ecology 1979; http://www.ecy.wa.gov/programs/sea/femaweb/Skagit/SK_5ith.jpg)

2009 Skagit County background imagery.
Figure 6. Shannon Point and vicinity parcel ownership information map.
1:2,400A
P31549Western Washington University
P31547Western Washington University
P31555DNR
P31556City of Anacortes
P116445City of
Anacortes
P117683 Sunset Cove
P118048, P117680
Sunset Cove
P116446City of
Anacortes
P117900Callahan
P117665Hanson
P117666Stringer
P117667Berg
P117668Cornelius
P117669Worra
P117670Nelson
P117671Blackwood
P117672Ballentine
P117673Chebier
P31553Olich-TwetenP31559, P31554
Barrett
LegendParcel boundaries
Rock revetment
Railroad causeway
0 150 300Feet
XW
XW
Figure. 7 Profiles of slopes waterward of houses closest to the rock revetment.
A B
LegendParcel boundaries
Rock revetment
MHW, 1885
Ponded water, May 2013
XW Native bluff meets causeway
EP-3
EP-5
GeologyQgt - Vashon till
Ju(f) - Ultramafic rocks
2009 Skagit County background imagery. Profiles derived from USGS LiDAR flown in 2006.
A1:1,200
0 75 150Feet
EP-5
EP-3

Figure 8. Restoration alternatives for the Shannon Point revetment and causeway.
2009 Skagit County background imagery.
Alternative 1 Alternative 2 Alternative 3
A1:1,200
LegendProposed BluffToe
Revetment Removal
Causeway Removal
Potential Saltmarsh Habitat
Rock to Remain
Potential Short-term Erosion
Existing Freshwater Wetland
0 75 150Feet
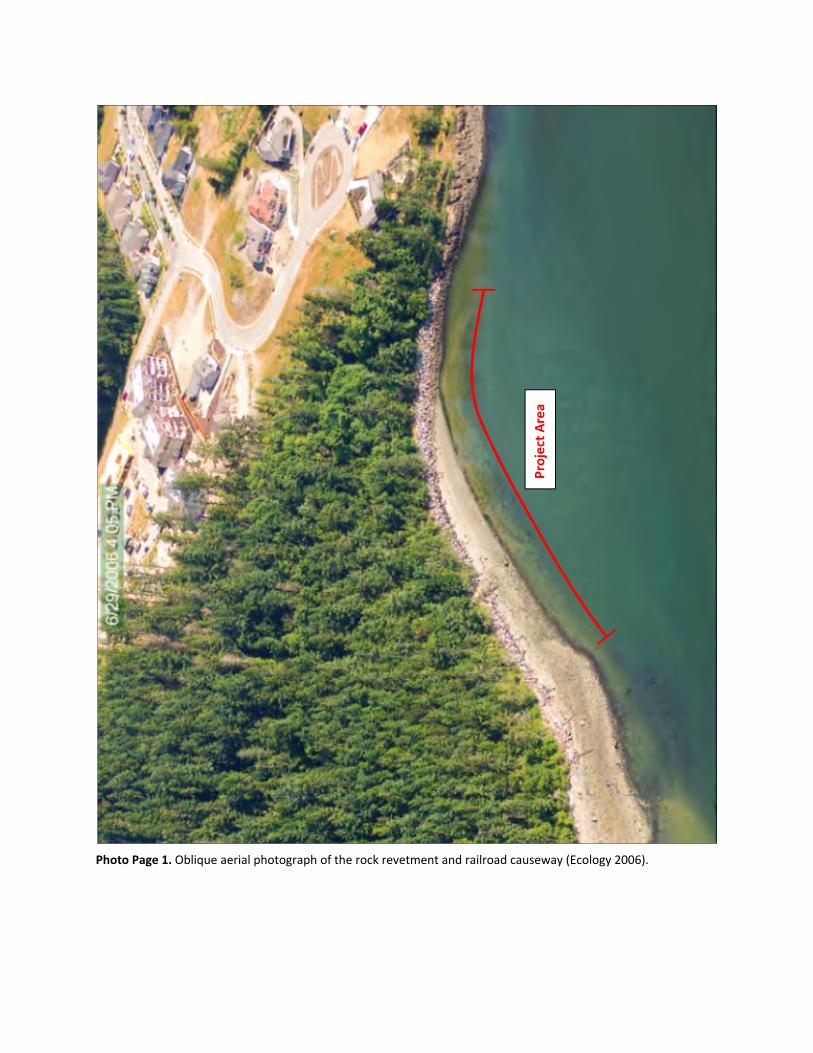
Photo Page 1. Oblique aerial photograph of the rock revetment and railroad causeway (Ecology 2006).
Project Area

Nonglacial deposits north of project area, Qc(o) or Qc(w) Glacial till, just north of the site, Qgt
Native bedrock exposed at rocky headland south Ju(f) Native bedrock “skirt’ of angular cobbles, south end
Sandy beach area, centrally located at site Cobble beach area, north end of site
Photo Page 2. Geologic units and beach characteristics.

Section 1 – south end, adjacent to bedrock headland Section 2 – scarps apparent near causeway crest
Section 3 – long section and lower bank Section 4 – lower bank and willow trees at crest
Section 5 – revetment blown out from likely debris flow Section 6 – bank/causeway height is reduced
Section 7 – Low rock and groin configuration. Scour behind or down-drift (left side) of this section.
Photo Page 3. Rock revetment sections 1‐7, south to north with 3 ft scaled grid. Figure 3 shows section breaks.

TP 1 – Angular native bedrock, likely fill material TP 2 – Angular granitic rock, likely fill material
TP 3 – Medium to coarse orange sand, pebble, likely fill TP 4 – Silty fine sand, sub angular pebble, likely fill
TP 5 – Fine to medium gray sand, beach material TP 6 – Medium to coarse sand, pebbles, beach material
Photo Page 4. Test pit excavations for causeway materials exploration.

TP 7 – Silty fine sand and sub-angular pebble, likely fill TP 8 – Sandy silt with sub-rounded pebbles, likely fill
TP 9 – Angular native bedrock in silty matrix, likely fill TP 10 – Silt with angular clasts, likely fill
Angular native bedrock boulder in causeway Depressional wetland looking northeast
Photo Page 5. Test pit excavations for causeway materials exploration and wetland observations. Table 1 has full test pit descriptions.

Existing Minor Contour (Survey)
Existing Major Contour (Survey)
Existing Minor Contour (2 ft int.; LiDAR)
Existing Major Contour (2 ft int.; LiDAR)
Proposed Minor Contour
Proposed Major Contour
OHWM (Ordinary High Water Mark)
MHHW (+8.0 ft MLLW)
Landward Extent of Eelgrass
Approximate Parcel Boundaries
Rock Revetment
Approximate Extent of Backshore Pond
Test Pit
Hub and Tack
Remove Revetment Rock
Cut Top of Bank to Match Lower Slope
Fill to Adjacent Beach Grade
C:\C
ivil3
DPro
ject
s\Sk
agitC
o\Sh
anno
nPt\
13-0
15-S
hann
onPt
Surv
ey_T
ablo
idSe
t.dw
g
1 OF 9
C1.1SHEET:
1/10/14DATE:
SCALE: AS NOTED
MLLW=0.0'
Shan
non
Poin
t Bul
khea
d Re
mov
alCo
ver S
heet
Loca
tion,
Inde
x, a
nd L
egen
dFo
r: N
orth
wes
t Str
aits
Fou
ndat
ion
REVI
SIO
NS
7 JA
N 2
014
9 JA
N 2
014
DRA
WN
BY:
JFW
DES
IGN
ED B
Y: C
HECK
ED B
Y: JW
J
DAT
E SU
RVEY
ED:
5/2
8-29
/13
12/
30/1
3
SURVEY NOTES:
Horizontal Datum: NAD83 HARN State Plane WA South Based
on DGPS observation on 5/28-29/13 using
a Trimble GeoHX 6000 post-processed to
WSRN base station COUP
Vertical Datum: Mean Lower Low Water (MLLW) Based on
water level observations at low tide on
5/28-29/13.
Topography shown within survey boundary obtained
5/28-29/13 and 12/30/13 using Lieca TCR-1105 total station
with direct rod measurements. Additional topography outside
boundary from USGS LiDAR data flown in 2006, shown at 2 FT
contour intervals for reference only. LiDAR obtained in
NAVD88 and datum shifted to MLLW using:
0.0 ft NAVD88 = 0.52 ft MLLW (VDatum v 3.1).
Aerial photograph shown on Sheet C2.1 from Skagit
County flown 2009 - image WASKAG021006, used as-is here.
Parcel boundaries shown on Sheet C2.1 are approximate
only. No boundary survey was completed as part of this work.
Boundaries obtained from Skagit County GIS in DWG format,
and used as-is here.
SHANNON POINT BULKHEAD REMOVAL
West Shore Anacortes, Skagit Co., WA
For: Northwest Straits Foundation
INDEX TO DRAWINGS:
C1.1 COVER SHEET
C2.1 EXISTING CONDITIONS - OVERVIEW
C2.2 EXISTING CONDITIONS - SOUTH DETAIL
C2.3 EXISTING CONDITIONS - NORTH DETAIL
C3.1 DEMOLITION PLAN
C4.1 PROPOSED CONDITIONS - SOUTH
C4.2 PROPOSED CONDITIONS - NORTH
C5.1 PROFILES 1 - 3
C5.2 PROFILES 4 - 6
VICINITY MAP:
MONUMENT LIST:
NAME EASTING NORTHING ELEV. TYPE
CGS1 1190751.10' 554589.26' 21.03' 2x2 HUB
CGS2 1190645.37' 554157.75' 21.46' 2x2 HUB
DRIVING DIRECTIONS:
From I-5 exit 230 proceed west-bound on State
Route 20. At 11.4 miles follow State Route 20
Extension forward toward Anacortes Ferry Terminal.
Bear left at turn-off to ferry terminal onto Sunset
Ave. Turn right onto Sunset Cove Rd. Follow Sunset
Cove to Washington Ct. Park at end of cul-de-sac
and follow marked foot trail to beach.
LEGEND
60% DESIGN FOR PERMITTING
Not For Construction

SHEET C2.2
P1
P2
P3
P4
P5
P6
SHEET C2.3
C:\C
ivil3
DPro
ject
s\Sk
agitC
o\Sh
anno
nPt\
13-0
15-S
hann
onPt
Surv
ey_T
ablo
idSe
t.dw
g
C2.1SHEET:
1/10/14DATE:
SCALE: AS NOTED
MLLW=0.0'
Shan
non
Poin
t Bul
khea
d Re
mov
alEx
istin
g Co
nditi
ons -
Ove
rvie
wTo
pogr
aphy
and
Site
Fea
ture
sFo
r: N
orth
wes
t Str
aits
Fou
ndat
ion
DRA
WN
BY:
JFW
DES
IGN
ED B
Y: C
HECK
ED B
Y: JW
J
DAT
E SU
RVEY
ED:
5/2
8-29
/13
0 80 160 240 320 400
FEET
Rosario Strait
SURVEY EXTENT
W
A
S
H
I
NGTO
N
C
T
REVI
SIO
NS
7 JA
N 2
014
9 JA
N 2
014
60% DESIGN FOR PERMITTING
Not For Construction
2 OF 9
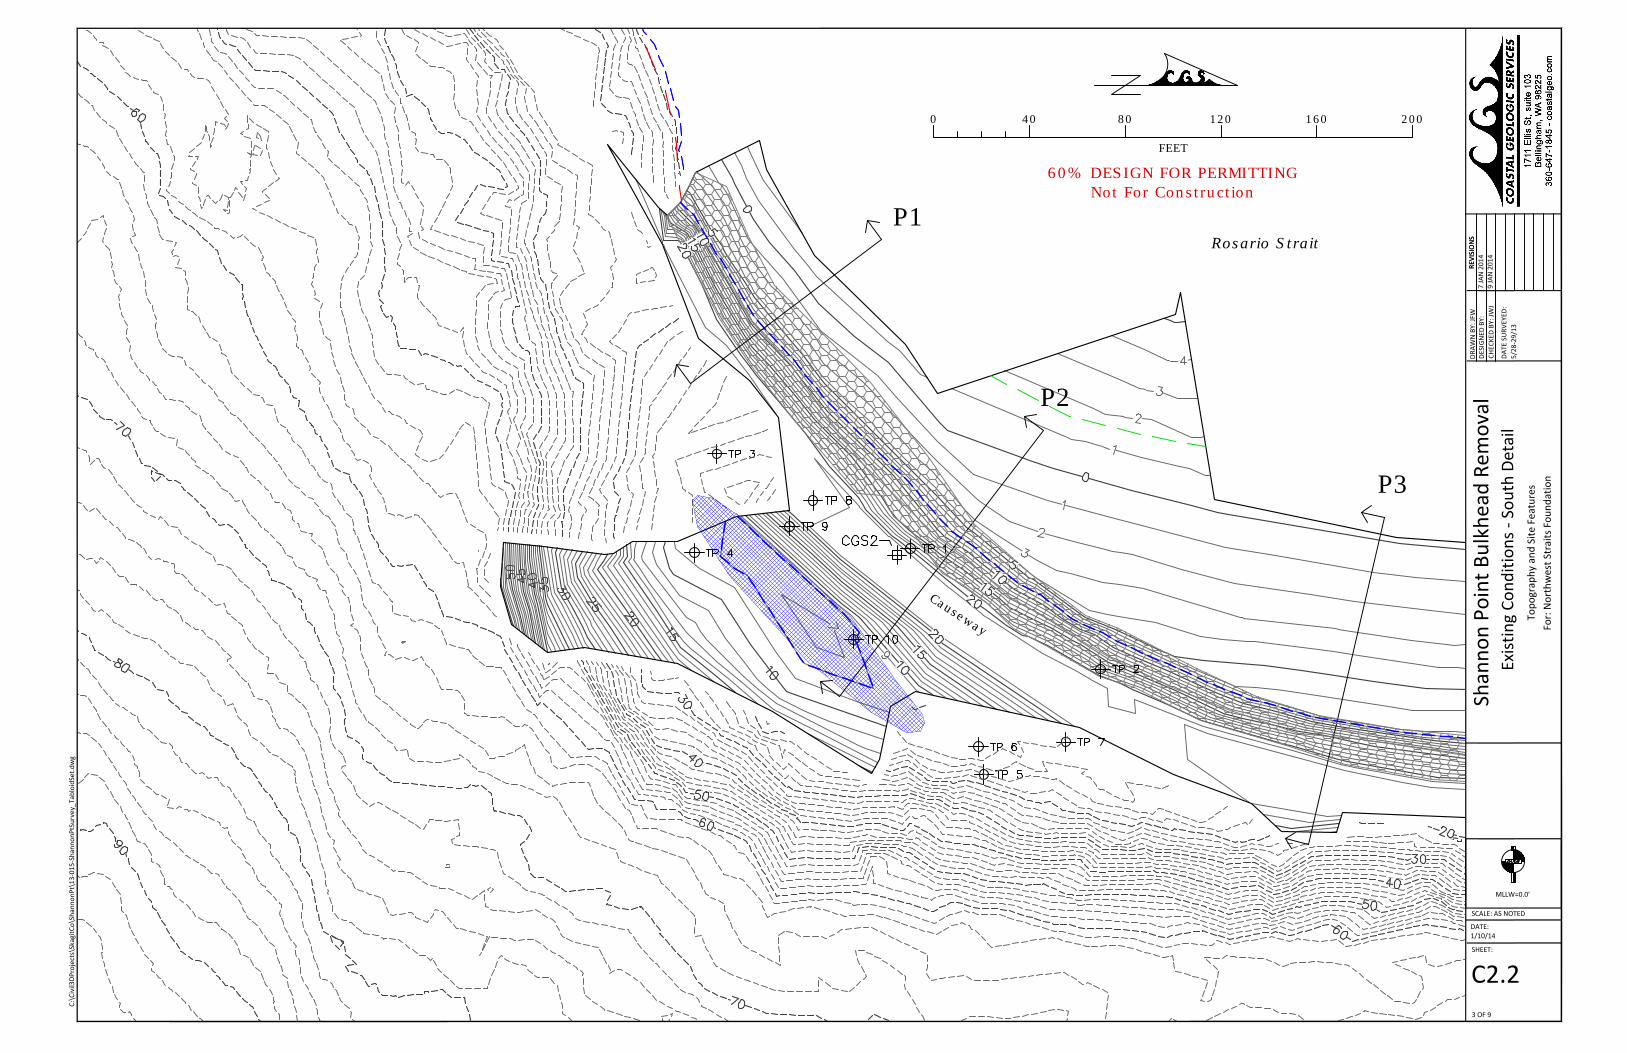
P1
P2
P3
C:\C
ivil3
DPro
ject
s\Sk
agitC
o\Sh
anno
nPt\
13-0
15-S
hann
onPt
Surv
ey_T
ablo
idSe
t.dw
g
C2.2SHEET:
1/10/14DATE:
SCALE: AS NOTED
MLLW=0.0'
Shan
non
Poin
t Bul
khea
d Re
mov
alEx
istin
g Co
nditi
ons -
Sou
th D
etai
lTo
pogr
aphy
and
Site
Fea
ture
sFo
r: N
orth
wes
t Str
aits
Fou
ndat
ion
REVI
SIO
NS
DRA
WN
BY:
JFW
DES
IGN
ED B
Y: C
HECK
ED B
Y: JW
J
DAT
E SU
RVEY
ED:
5/2
8-29
/13
Rosario Strait
C
a
u
s
e
w
a
y
0 40 80 120 160 200
FEET
60% DESIGN FOR PERMITTING
Not For Construction
REVI
SIO
NS
7 JA
N 2
014
9 JA
N 2
014
3 OF 9
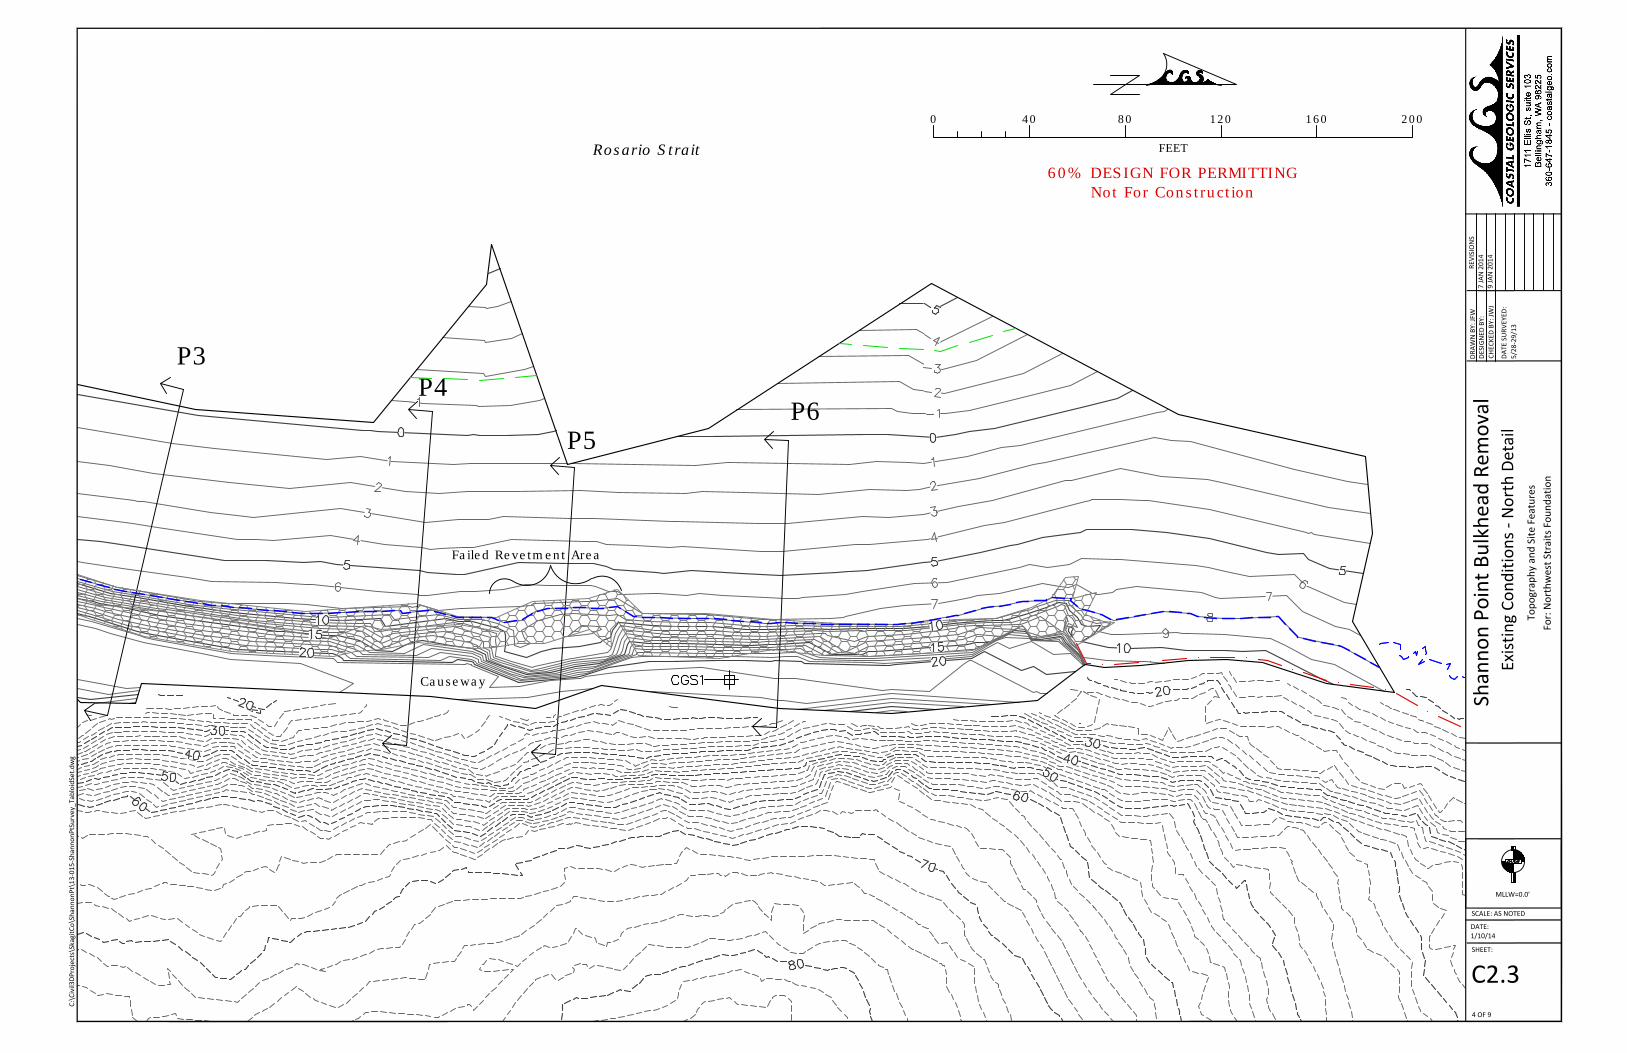
P3
P4
P5
P6
C:\C
ivil3
DPro
ject
s\Sk
agitC
o\Sh
anno
nPt\
13-0
15-S
hann
onPt
Surv
ey_T
ablo
idSe
t.dw
g
C2.3SHEET:
1/10/14DATE:
SCALE: AS NOTED
MLLW=0.0'
Shan
non
Poin
t Bul
khea
d Re
mov
alEx
istin
g Co
nditi
ons -
Nor
th D
etai
lTo
pogr
aphy
and
Site
Fea
ture
sFo
r: N
orth
wes
t Str
aits
Fou
ndat
ion
DRA
WN
BY:
JFW
DES
IGN
ED B
Y: C
HECK
ED B
Y: JW
J
DAT
E SU
RVEY
ED:
5/2
8-29
/13
Rosario Strait
0 40 80 120 160 200
FEET
Causeway
Failed Revetment Area
REVI
SIO
NS
7 JA
N 2
014
9 JA
N 2
014
60% DESIGN FOR PERMITTING
Not For Construction
4 OF 9

P1
P2
P3
P4
P5
P6
SHEET C4.1
SHEET C4.2
C:\C
ivil3
DPro
ject
s\Sk
agitC
o\Sh
anno
nPt\
13-0
15-S
hann
onPt
Surv
ey_T
ablo
idSe
t.dw
g
C3.1SHEET:
1/10/14DATE:
SCALE: AS NOTED
MLLW=0.0'
Shan
non
Poin
t Bul
khea
d Re
mov
alDe
mol
ition
Pla
n
For:
Nor
thw
est S
trai
ts F
ound
atio
n
DRA
WN
BY:
JFW
DES
IGN
ED B
Y: JW
J C
HECK
ED B
Y: JW
J
DAT
E SU
RVEY
ED:
5/2
8-29
/13
0 50 100 150 200 250
FEET
Rosario Strait
P
o
t
e
n
t
i
a
l
B
a
r
g
e
A
c
c
e
s
s
C
o
r
r
i
d
o
r
2
1
3
Notes
1. Remove rocks from revetment and beachface for offsite
disposal. Remove toppled rock from beachface
waterward of revetment toe.
2. Excavate (cut) top of bank above revetment to match
slope exposed by rock removal.
3. Use excavated sediment removed from top of bank
above revetment for filling voids left by revetment toe
rock removal.
REVI
SIO
NS
7 JA
N 2
014
9 JA
N 2
014
60% DESIGN FOR PERMITTING
Not For Construction
5 OF 9

P1
P2
P3
P4
C:\C
ivil3
DPro
ject
s\Sk
agitC
o\Sh
anno
nPt\
13-0
15-S
hann
onPt
Surv
ey_T
ablo
idSe
t.dw
g
C4.1SHEET:
1/10/14DATE:
SCALE: AS NOTED
MLLW=0.0'
Shan
non
Poin
t Bul
khea
d Re
mov
alPr
opos
ed C
ondi
tions
- So
uth
Deta
il
For:
Nor
thw
est S
trai
ts F
ound
atio
n
DRA
WN
BY:
JFW
DES
IGN
ED B
Y: JW
J C
HECK
ED B
Y: JW
J
DAT
E SU
RVEY
ED:
5/2
8-29
/13
Rosario Strait
C
a
u
s
e
w
a
y
0 30 60 90 120 150
FEET
Limit of Excavation
REVI
SIO
NS
7 JA
N 2
014
9 JA
N 2
014
60% DESIGN FOR PERMITTING
Not For Construction
6 OF 9

P4
P5
P6
C:\C
ivil3
DPro
ject
s\Sk
agitC
o\Sh
anno
nPt\
13-0
15-S
hann
onPt
Surv
ey_T
ablo
idSe
t.dw
g
C4.2SHEET:
1/10/14DATE:
SCALE: AS NOTED
MLLW=0.0'
Shan
non
Poin
t Bul
khea
d Re
mov
alPr
opos
ed C
ondi
tions
- N
orth
Det
ail
For:
Nor
thw
est S
trai
ts F
ound
atio
n
DRA
WN
BY:
JFW
DES
IGN
ED B
Y: JW
J C
HECK
ED B
Y: JW
J
DAT
E SU
RVEY
ED:
5/2
8-29
/13
Rosario Strait
0 30 60 90 120 150
FEET
Limit of Excavation
REVI
SIO
NS
7 JA
N 2
014
9 JA
N 2
014
60% DESIGN FOR PERMITTING
Not For Construction
7 OF 9

MH
HW
(+
8.0' M
LLW
)
Rem
ove Revetm
ent Rock
Existing G
round
(survey)
Existing G
round
(LiD
AR)
Cut Slope Above Revetm
ent
to Consistent Slope
MH
HW
(+
8.0' M
LLW
)
MH
HW
(+
8.0' M
LLW
)
Rem
ove Revetm
ent Rock
Rem
ove Revetm
ent Rock
Proposed
Finished G
rade
Proposed
Finished G
rade
Proposed
Finished G
rade
Fill W
ith Soil Cut
Above Revetm
ent
Fill W
ith Soil Cut
Above Revetm
ent
Fill W
ith Soil Cut
Above Revetm
ent
Cut Slope Above Revetm
ent
to Consistent Slope
Cut Slope Above Revetm
ent
to Consistent Slope
Existing G
round
(survey)
Existing G
round
(survey)
Rem
ove Exposed Rock in Fill Surface
Rem
ove Exposed Rock in Fill Surface
Rem
ove Exposed Rock in Fill Surface
C:\C
ivil3
DPro
ject
s\Sk
agitC
o\Sh
anno
nPt\
13-0
15-S
hann
onPt
Surv
ey_T
ablo
idSe
t.dw
g
C5.1SHEET:
1/10/14DATE:
SCALE: AS NOTED
MLLW=0.0'
DRA
WN
BY:
JFW
DES
IGN
ED B
Y: JW
J C
HECK
ED B
Y: JW
J
DAT
E SU
RVEY
ED:
5/2
8-29
/13
REVI
SIO
NS
7 JA
N 2
014
9 JA
N 2
014
8 OF 9
60%
D
ESIG
N FO
R PERM
ITTIN
G
Not For Construction
Shan
non
Poin
t Bul
khea
d Re
mov
alCr
oss S
ectio
ns 1
- 3
For:
Nor
thw
est S
trai
ts F
ound
atio
n

Existing G
round
(survey)
Existing G
round
(LiD
AR)
MH
HW
(+
8.0' M
LLW
)
MH
HW
(+
8.0' M
LLW
)
MH
HW
(+
8.0' M
LLW
)
Rem
ove Revetm
ent Rock
Rem
ove Revetm
ent Rock
Rem
ove Revetm
ent Rock
Proposed
Finished G
rade
Proposed
Finished G
rade
Proposed
Finished G
rade
Fill W
ith Soil Cut
Above Revetm
ent
Fill W
ith Soil Cut
Above Revetm
ent
Fill W
ith Soil Cut
Above Revetm
ent
Cut Slope Above Revetm
ent
to Consistent Slope
Cut Slope Above Revetm
ent
to Consistent Slope
Existing G
round
(survey)
Existing G
round
(survey)
Rem
ove Exposed Rock in Fill Surface
Rem
ove Exposed Rock in Fill Surface
C:\C
ivil3
DPro
ject
s\Sk
agitC
o\Sh
anno
nPt\
13-0
15-S
hann
onPt
Surv
ey_T
ablo
idSe
t.dw
g
C5.2SHEET:
1/10/14DATE:
SCALE: AS NOTED
MLLW=0.0'
DRA
WN
BY:
JFW
DES
IGN
ED B
Y: C
HECK
ED B
Y: JW
J
DAT
E SU
RVEY
ED:
5/2
8-29
/13
REVI
SIO
NS
7 JA
N 2
014
9 JA
N 2
014
9 OF 9
60%
D
ESIG
N FO
R PERM
ITTIN
G
Not For Construction
Shan
non
Poin
t Bul
khea
d Re
mov
alCr
oss S
ectio
ns 4
- 6
For:
Nor
thw
est S
trai
ts F
ound
atio
n

Existing Minor Contour (Survey)
Existing Major Contour (Survey)
Existing Minor Contour (2 ft int.; LiDAR)
Existing Major Contour (2 ft int.; LiDAR)
Proposed Minor Contour
Proposed Major Contour
OHWM (Ordinary High Water Mark)
MHHW (+8.0 ft MLLW)
Landward Extent of Eelgrass
Approximate Parcel Boundaries
Rock Revetment
Approximate Extent of Backshore Pond
Test Pit
Hub and Tack
Remove Revetment Rock
Cut Top of Bank to Match Lower Slope
Fill to Adjacent Beach Grade
SHANNON POINT BULKHEAD REMOVAL
West Shore Anacortes, Skagit Co., WA
For: Northwest Straits Foundation
INDEX TO DRAWINGS:
1 COVER SHEET
2 EXISTING CONDITIONS - OVERVIEW
3 EXISTING CONDITIONS - SOUTH DETAIL
4 EXISTING CONDITIONS - NORTH DETAIL
5 DEMOLITION PLAN
6 PROPOSED CONDITIONS - SOUTH
7 PROPOSED CONDITIONS - NORTH
8 PROFILES 1 - 3
9 PROFILES 4 - 6
VICINITY MAP:
DRIVING DIRECTIONS:
From I-5 exit 230 proceed west-bound on State
Route 20. At 11.4 miles follow State Route 20
Extension forward toward Anacortes Ferry
Terminal. Bear left at turn-off to ferry terminal
onto Sunset Ave. Turn right onto Sunset Cove
Rd. Follow Sunset Cove to Washington Ct. Park
at end of cul-de-sac and follow marked foot trail
to beach.
LEGEND
DATE:
C:\
Civ
il3D
Pro
ject
s\Sk
agit
Co
\Sh
ann
on
Pt\
13
-01
5-S
han
no
nP
tSu
rvey
_Per
mit
Set
PROPOSED:IN:COUNTY:STATE:APPLICATION BY:
OF:SHEET:
SCALE:
MLLW=MHHW=
Shannon Point Bulkhead RemovalCover Sheet
Northwest Straits Foundation
1 910JAN14
Bulkhead RemovalRosario Strait
SkagitWA
Northwest Straits Foundation1155 N State St, Suite 402Bellingham, WA 98225(360) 733-1725
1155 N State St, Suite 402Bellingham, WA 98225
AS SHOWN
0.0 FT
+8.0 FT

P1
P2
P3
P4
P5
P6
DATE:
C:\
Civ
il3D
Pro
ject
s\Sk
agit
Co
\Sh
ann
on
Pt\
13
-01
5-S
han
no
nP
tSu
rvey
_Per
mit
Set
PROPOSED:IN:COUNTY:STATE:APPLICATION BY:
OF:SHEET:
SCALE:
MLLW=MHHW=
Shannon Point Bulkhead RemovalExisting Conditions
Northwest Straits Foundation
2 910JAN14
Bulkhead RemovalRosario Strait
SkagitWA
Northwest Straits Foundation1155 N State St, Suite 402Bellingham, WA 98225(360) 733-1725
Overview
1155 N State St, Suite 402Bellingham, WA 98225
AS SHOWN
0.0 FT
+8.0 FT
0 120 240 360
FEET
60% DESIGN FOR PERMITTING
Not For Construction

P1
P2
P3
P4
DATE:
C:\
Civ
il3D
Pro
ject
s\Sk
agit
Co
\Sh
ann
on
Pt\
13
-01
5-S
han
no
nP
tSu
rvey
_Per
mit
Set
PROPOSED:IN:COUNTY:STATE:APPLICATION BY:
OF:SHEET:
SCALE:
MLLW=MHHW=
Shannon Point Bulkhead RemovalExisting Conditions
Northwest Straits Foundation
3 910JAN14
Bulkhead RemovalRosario Strait
SkagitWA
Northwest Straits Foundation1155 N State St, Suite 402Bellingham, WA 98225(360) 733-1725
South Detail
1155 N State St, Suite 402Bellingham, WA 98225
AS SHOWN
0.0 FT
+8.0 FT
0 50 100 150
FEET
60% DESIGN FOR PERMITTING
Not For Construction

P4
P5
P6
DATE:
C:\
Civ
il3D
Pro
ject
s\Sk
agit
Co
\Sh
ann
on
Pt\
13
-01
5-S
han
no
nP
tSu
rvey
_Per
mit
Set
PROPOSED:IN:COUNTY:STATE:APPLICATION BY:
OF:SHEET:
SCALE:
MLLW=MHHW=
Shannon Point Bulkhead RemovalExisting Conditions
Northwest Straits Foundation
4 910JAN14
Bulkhead RemovalRosario Strait
SkagitWA
Northwest Straits Foundation1155 N State St, Suite 402Bellingham, WA 98225(360) 733-1725
North Detail
1155 N State St, Suite 402Bellingham, WA 98225
AS SHOWN
0.0 FT
+8.0 FT
0 50 100 150
FEET
60% DESIGN FOR PERMITTING
Not For Construction

P1
P2
P3
P4
P5
P6
DATE:
C:\
Civ
il3D
Pro
ject
s\Sk
agit
Co
\Sh
ann
on
Pt\
13
-01
5-S
han
no
nP
tSu
rvey
_Per
mit
Set
PROPOSED:IN:COUNTY:STATE:APPLICATION BY:
OF:SHEET:
SCALE:
MLLW=MHHW=
Shannon Point Bulkhead RemovalDemolition Plan
Northwest Straits Foundation
5 910JAN14
Bulkhead RemovalRosario Strait
SkagitWA
Northwest Straits Foundation1155 N State St, Suite 402Bellingham, WA 98225(360) 733-1725
1155 N State St, Suite 402Bellingham, WA 98225
AS SHOWN
0.0 FT
+8.0 FT
0 80 160 240
FEET
60% DESIGN FOR PERMITTING
Not For Construction
Notes
1. Remove rocks from revetment and
beachface for offsite disposal. Remove
toppled rock from beachface waterward of
revetment toe.
2. Excavate (cut) top of bank above revetment
to match slope exposed by rock removal.
3. Use excavated sediment removed from top
of bank above revetment for filling voids left
by revetment toe rock removal.
4. No cut in bank landward of failed revetment.
2
1
3
4
Potential Barge
Access Corridor

P1
P2
P3
P4
DATE:
C:\
Civ
il3D
Pro
ject
s\Sk
agit
Co
\Sh
ann
on
Pt\
13
-01
5-S
han
no
nP
tSu
rvey
_Per
mit
Set
PROPOSED:IN:COUNTY:STATE:APPLICATION BY:
OF:SHEET:
SCALE:
MLLW=MHHW=
Shannon Point Bulkhead RemovalProposed Conditions
Northwest Straits Foundation
6 910JAN14
Bulkhead RemovalRosario Strait
SkagitWA
Northwest Straits Foundation1155 N State St, Suite 402Bellingham, WA 98225(360) 733-1725
South Detail
1155 N State St, Suite 402Bellingham, WA 98225
AS SHOWN
0.0 FT
+8.0 FT
0 50 100 150
FEET
60% DESIGN FOR PERMITTING
Not For Construction
Limit of Excavation
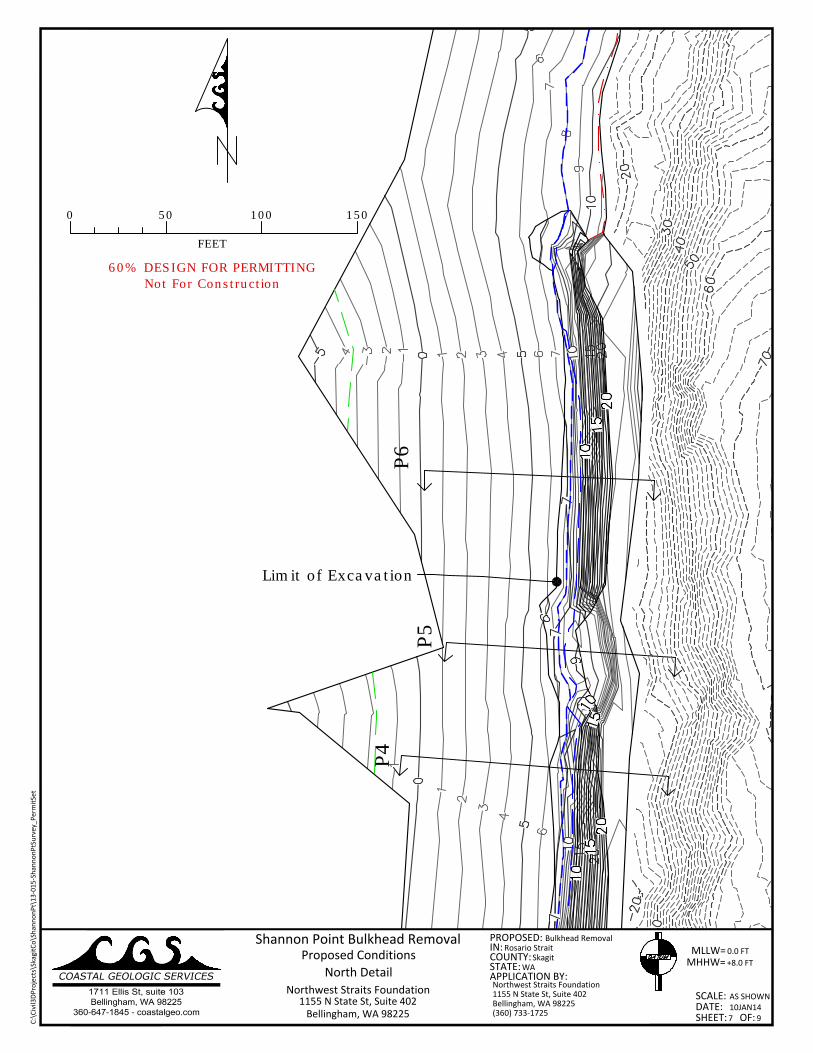
P4
P5
P6
DATE:
C:\
Civ
il3D
Pro
ject
s\Sk
agit
Co
\Sh
ann
on
Pt\
13
-01
5-S
han
no
nP
tSu
rvey
_Per
mit
Set
PROPOSED:IN:COUNTY:STATE:APPLICATION BY:
OF:SHEET:
SCALE:
MLLW=MHHW=
Shannon Point Bulkhead RemovalProposed Conditions
Northwest Straits Foundation
7 910JAN14
Bulkhead RemovalRosario Strait
SkagitWA
Northwest Straits Foundation1155 N State St, Suite 402Bellingham, WA 98225(360) 733-1725
North Detail
1155 N State St, Suite 402Bellingham, WA 98225
AS SHOWN
0.0 FT
+8.0 FT
0 50 100 150
FEET
60% DESIGN FOR PERMITTING
Not For Construction
Limit of Excavation

Remove Exposed Rock in Fill Surface
Remove Exposed Rock in Fill Surface
Remove Exposed Rock in Fill Surface
MHHW (+8.0' MLLW)
Remove Revetment Rock
Existing Ground
(survey)
Existing Ground
(LiDAR)
Cut Slope Above Revetment
to Consistent Slope
MHHW (+8.0' MLLW)
MHHW (+8.0' MLLW)
Remove Revetment Rock
Remove Revetment Rock
Proposed
Finished Grade
Proposed
Finished Grade
Proposed
Finished Grade
Fill With Soil Cut
Above Revetment
Fill With Soil Cut
Above Revetment
Fill With Soil Cut
Above Revetment
Cut Slope Above Revetment
to Consistent Slope
Cut Slope Above Revetment
to Consistent Slope
Existing Ground
(survey)
Existing Ground
(survey)
DATE:
C:\
Civ
il3D
Pro
ject
s\Sk
agit
Co
\Sh
ann
on
Pt\
13
-01
5-S
han
no
nP
tSu
rvey
_Per
mit
Set
PROPOSED:IN:COUNTY:STATE:APPLICATION BY:
OF:SHEET:
SCALE:
MLLW=MHHW=
Shannon Point Bulkhead RemovalProfiles 1 - 3
Northwest Straits Foundation
8 910JAN14
Bulkhead RemovalRosario Strait
SkagitWA
Northwest Straits Foundation1155 N State St, Suite 402Bellingham, WA 98225(360) 733-1725
1155 N State St, Suite 402Bellingham, WA 98225
AS SHOWN
0.0 FT
+8.0 FT
60% DESIGN FOR PERMITTING
Not For Construction

Remove Exposed Rock in Fill Surface
Remove Exposed Rock in Fill Surface
Existing Ground
(survey)
Existing Ground
(LiDAR)
MHHW (+8.0' MLLW)
MHHW (+8.0' MLLW)
MHHW (+8.0' MLLW)
Remove Revetment Rock
Remove Revetment Rock
Remove Revetment Rock
Proposed
Finished Grade
Proposed
Finished Grade
Proposed
Finished Grade
Fill With Soil Cut
Above Revetment
Fill With Soil Cut
Above Revetment
Fill With Soil Cut
Above Revetment
Cut Slope Above Revetment
to Consistent Slope
Cut Slope Above Revetment
to Consistent Slope
Existing Ground
(survey)
Existing Ground
(survey)
DATE:
C:\
Civ
il3D
Pro
ject
s\Sk
agit
Co
\Sh
ann
on
Pt\
13
-01
5-S
han
no
nP
tSu
rvey
_Per
mit
Set
PROPOSED:IN:COUNTY:STATE:APPLICATION BY:
OF:SHEET:
SCALE:
MLLW=MHHW=
Shannon Point Bulkhead RemovalProfiles 4 - 6
Northwest Straits Foundation
9 910JAN14
Bulkhead RemovalRosario Strait
SkagitWA
Northwest Straits Foundation1155 N State St, Suite 402Bellingham, WA 98225(360) 733-1725
1155 N State St, Suite 402Bellingham, WA 98225
AS SHOWN
0.0 FT
+8.0 FT
60% DESIGN FOR PERMITTING
Not For Construction