county sales & price, july 2015
DESCRIPTION
July home sales climb to highest level in nearly three years as prices remain near recent high. The County MLS median price and sales data in the tables are generated from a survey of more than 90 associations of REALTORS® throughout the state, and represent statistics of existing single-family detached homes only.TRANSCRIPT

CALIFORNIAHOUSING MARKETUPDATE
Monthly Sales and Price Statistics
July 2015
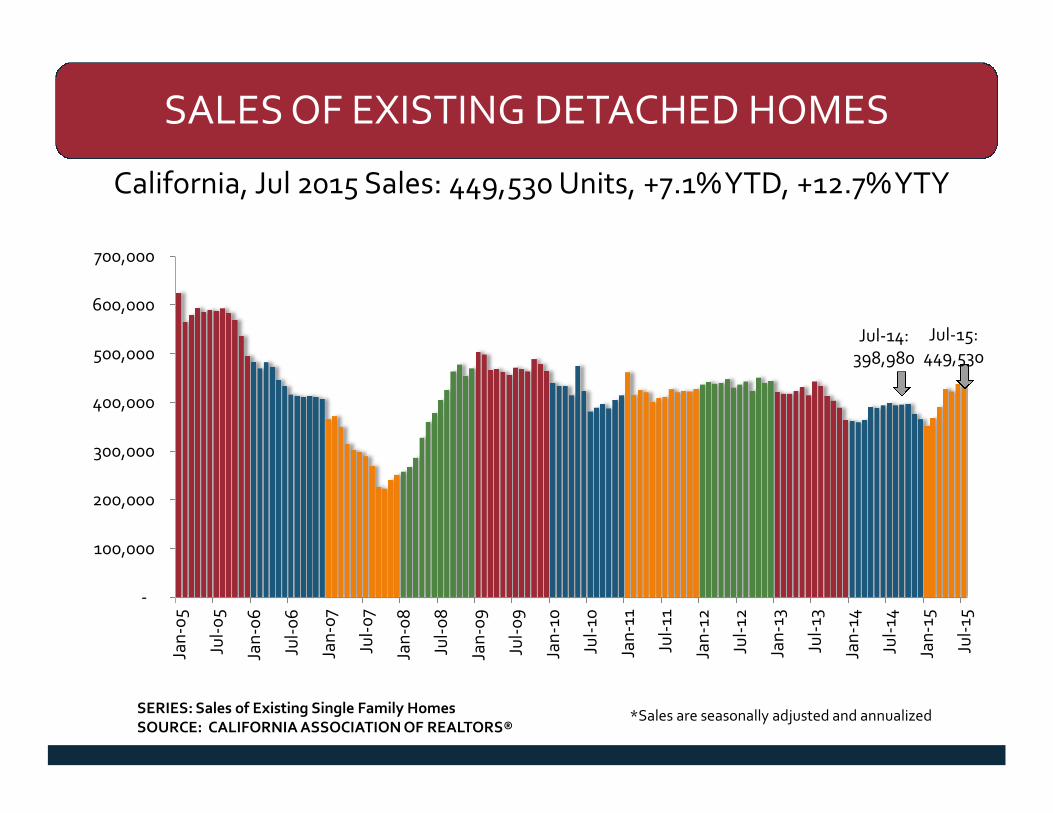
SALES OF EXISTING DETACHED HOMES
California, Jul 2015 Sales: 449,530 Units, +7.1%YTD, +12.7%YTY
-
100,000
200,000
300,000
400,000
500,000
600,000
700,000
Jan
-05
Jul-
05
Jan
-06
Jul-
06
Jan
-07
Jul-
07
Jan
-08
Jul-
08
Jan
-09
Jul-
09
Jan
-10
Jul-
10
Jan
-11
Jul-
11
Jan
-12
Jul-
12
Jan
-13
Jul-
13
Jan
-14
Jul-
14
Jan
-15
Jul-
15
*Sales are seasonally adjusted and annualizedSERIES: Sales of Existing Single Family HomesSOURCE: CALIFORNIA ASSOCIATION OF REALTORS®
Jul-15:449,530
Jul-14:398,980

CALIFORNIA SALES
SERIES: Sales of Existing Single Family Homes, Seasonally AdjustedSOURCE: CALIFORNIA ASSOCIATION OF REALTORS®
-25%
-20%
-15%
-10%
-5%
0%
5%
10%
15%
Jan
-10
Ap
r-10
Jul-
10
Oct
-10
Jan
-11
Ap
r-11
Jul-
11
Oct
-11
Jan
-12
Ap
r-12
Jul-
12
Oct
-12
Jan
-13
Ap
r-13
Jul-
13
Oct
-13
Jan
-14
Ap
r-14
Jul-
14
Oct
-14
Jan
-15
Ap
r-15
Jul-
15
Year-over-Year % Chg 6 per. Mov. Avg. (Year-over-Year % Chg)

CHANGE IN SALES BY PRICE RANGE
(Year-to-Year)
-11.1%
15.8% 15.4%17.7%
26.4%
23.3%20.9%
13.5%
-15%
-10%
-5%
0%
5%
10%
15%
20%
25%
30%
Jul-15
SERIES: Sales of Existing Detached HomesSOURCE: CALIFORNIA ASSOCIATION OF REALTORS®

BAY AREA SALES (EXISTING SFH)
SERIES: Sales, Not Seasonally AdjustedSOURCE: CALIFORNIA ASSOCIATION OF REALTORS®
-25%
-20%
-15%
-10%
-5%
0%
5%
10%
15%
20%
25%
30%
Jan
-10
Ap
r-10
Jul-
10
Oct
-10
Jan
-11
Ap
r-11
Jul-
11
Oct
-11
Jan
-12
Ap
r-12
Jul-
12
Oct
-12
Jan
-13
Ap
r-13
Jul-
13
Oct
-13
Jan
-14
Ap
r-14
Jul-
14
Oct
-14
Jan
-15
Ap
r-15
Jul-
15
Bay Area 6 per. Mov. Avg. (Bay Area)

CENTRAL VALLEY SALES (EXISTING SFH)
SERIES: Sales, Not Seasonally AdjustedSOURCE: CALIFORNIA ASSOCIATION OF REALTORS®
-30%
-25%
-20%
-15%
-10%
-5%
0%
5%
10%
15%
20%
25%
Jan
-10
Ap
r-10
Jul-
10
Oct
-10
Jan
-11
Ap
r-11
Jul-
11
Oct
-11
Jan
-12
Ap
r-12
Jul-
12
Oct
-12
Jan
-13
Ap
r-13
Jul-
13
Oct
-13
Jan
-14
Ap
r-14
Jul-
14
Oct
-14
Jan
-15
Ap
r-15
Jul-
15
Central Valley 6 per. Mov. Avg. (Central Valley)

SOUTHERN CALIFORNIA (EXISTING SFH)
SERIES: Sales, Not Seasonally AdjustedSOURCE: CALIFORNIA ASSOCIATION OF REALTORS®
-25%
-20%
-15%
-10%
-5%
0%
5%
10%
15%
20%
25%
Jan
-10
Ap
r-10
Jul-
10
Oct
-10
Jan
-11
Ap
r-11
Jul-
11
Oct
-11
Jan
-12
Ap
r-12
Jul-
12
Oct
-12
Jan
-13
Ap
r-13
Jul-
13
Oct
-13
Jan
-14
Ap
r-14
Jul-
14
Oct
-14
Jan
-15
Ap
r-15
Jul-
15
So CA 6 per. Mov. Avg. (So CA)

MEDIAN PRICE OF EXISTING DETACHED HOMES
California, Jul 2015: $488,260, -0.3% MTM, +5.4%YTY
$-
$100,000
$200,000
$300,000
$400,000
$500,000
$600,000
$700,000
Jan
-05
Jul-
05
Jan
-06
Jul-
06
Jan
-07
Jul-
07
Jan
-08
Jul-
08
Jan
-09
Jul-
09
Jan
-10
Jul-
10
Jan
-11
Jul-
11
Jan
-12
Jul-
12
Jan
-13
Jul-
13
Jan
-14
Jul-
14
Jan
-15
Jul-
15
P: May-07$594,530
T: Feb-09$245,230-59% frompeak
SERIES: Median Price of Existing Single Family HomesSOURCE: CALIFORNIA ASSOCIATION OF REALTORS®
Jul-15:$488,260
Jul-15:$463,330

CA MEDIAN PRICE (EXISTING SFH)
SERIES: Median Price, Not Seasonally AdjustedSOURCE: CALIFORNIA ASSOCIATION OF REALTORS®
-15%
-10%
-5%
0%
5%
10%
15%
Jan
-05
Jun
-05
No
v-0
5
Ap
r-0
6
Sep
-06
Feb
-07
Jul-
07
Dec
-07
May
-08
Oct
-08
Mar
-09
Au
g-0
9
Jan
-10
Jun
-10
No
v-10
Ap
r-11
Sep
-11
Feb
-12
Jul-
12
Dec
-12
May
-13
Oct
-13
Mar
-14
Au
g-1
4
Jan
-15
Jun
-15
Month-to-Month % Chg

INVENTORY CONTINUED TODECLINE FROM LASTYEAR
Jul 2014: 3.8 Months; Jul 2015: 3.3 Months
Note: “Unsold Inventory Index” represents the number of months it would take to sell the remaining inventory for the month in question. Theremaining inventory for the month is defined as the number of properties that were “Active”, “Pending”, and “Contingent” (when available) anddivide the sum by the number of “Sold” properties for the month in question.
0
2
4
6
8
10
12
14
16
18
Jan
-05
Jul-
05
Jan
-…
Jul-
06
Jan
-07
Jul-
07
Jan
-…
Jul-
08
Jan
-…
Jul-
09
Jan
-10
Jul-
10
Jan
-11
Jul-
11
Jan
-12
Jul-
12
Jan
-13
Jul-
13
Jan
-14
Jul-
14
Jan
-15
Jul-
15
SERIES: Unsold Inventory Index of Existing Single Family HomesSOURCE: CALIFORNIA ASSOCIATION OF REALTORS®

INVENTORY DROPPED SIGNIFICANTLYIN THE BAY AREA SINCE 2009
BUT REMAINED TIGHT
Note: “Unsold Inventory Index” represents the number of months it would take to sell the remaining inventory for the month in question. Theremaining inventory for the month is defined as the number of properties that were “Active”, “Pending”, and “Contingent” (when available) anddivide the sum by the number of “Sold” properties for the month in question.
2.0
3.4
3.6
0.0
1.0
2.0
3.0
4.0
5.0
6.0
7.0
8.0
9.0
Jan-09 Jul-09 Jan-10 Jul-10 Jan-11 Jul-11 Jan-12 Jul-12 Jan-13 Jul-13 Jan-14 Jul-14 Jan-15 Jul-15
Bay Area Central Valley So CA
SERIES: Unsold Inventory Index of Existing Single Family HomesSOURCE: CALIFORNIA ASSOCIATION OF REALTORS®

PRICE PER SQUARE FOOT
Jul 2015: $228, Up 1% MTM, Up 3.4%YTY
$0
$50
$100
$150
$200
$250
$300
$350
$400
Jan
-07
Ap
r-0
7Ju
l-0
7O
ct-0
7Ja
n-0
8A
pr-
08
Jul-
08
Oct
-08
Jan
-09
Ap
r-0
9Ju
l-0
9O
ct-0
9Ja
n-1
0A
pr-
10Ju
l-10
Oct
-10
Jan
-11
Ap
r-11
Jul-
11O
ct-1
1Ja
n-1
2A
pr-
12Ju
l-12
Oct
-12
Jan
-13
Ap
r-13
Jul-
13O
ct-1
3Ja
n-1
4A
pr-
14Ju
l-14
Oct
-14
Jan
-15
Ap
r-15
Jul-
15
PRICE PER SQ. FT.
SERIES: Median Price Per Square FeetSOURCE: CALIFORNIA ASSOCIATION OF REALTORS®

SALES-TO-LIST RATIO
Jul 2015: 98.8%, Down 0.2% MTM, Up 0.3%YTY
99.0%
86%
88%
90%
92%
94%
96%
98%
100%
102%
Jan
-07
Ap
r-0
7
Jul-
07
Oct
-07
Jan
-08
Ap
r-0
8Ju
l-0
8O
ct-0
8
Jan
-09
Ap
r-0
9
Jul-
09
Oct
-09
Jan
-10
Ap
r-10
Jul-
10O
ct-1
0
Jan
-11
Ap
r-11
Jul-
11O
ct-1
1Ja
n-1
2
Ap
r-12
Jul-
12O
ct-1
2
Jan
-13
Ap
r-13
Jul-
13O
ct-1
3Ja
n-1
4
Ap
r-14
Jul-
14O
ct-1
4
Jan
-15
Ap
r-15
Jul-
15
Sales-to-List Price Ratio
SERIES: Sales-to-List RatioSOURCE: CALIFORNIA ASSOCIATION OF REALTORS®

DEMAND OUTPACING SUPPLY
5%
18%
14%
-13%
-4%
2%
-20%
-10%
0%
10%
20%
San Francisco Bay Area Southern California Central Valley
Sales Active ListingsYear-to-Year % Chg
SOURCE: CALIFORNIA ASSOCIATION OF REALTORS®
July 2015