county of maui department of water supply state … · ground water and surface water in the haiku...
TRANSCRIPT

U.S. Department of the Interior
Ground Water and Surface Water in the Haiku Area, East Maui, Hawaii
GO
U.S. GEOLOGICAL SURVEYWater-Resources Investigations Report 98-4142
Prepared in cooperation with the
COUNTY OF MAUI DEPARTMENT OF WATER SUPPLYSTATE OF HAWAII COMMISSION ON WATER RESOURCE MANAGMENT
USGSscience for a changing world


Ground Water and Surface Water in the Haiku Area, East Maui, Hawaii
By Stephen B. Gingerich
U.S. GEOLOGICAL SURVEY
Water-Resources Investigations Report 98-4142
Prepared in cooperation with the
COUNTY OF MAUI DEPARTMENT OF WATER SUPPLYSTATE OF HAWAII COMMISSION ON WATER RESOURCE MANAGEMENT
Honolulu, Hawaii 1999

U.S. DEPARTMENT OF THE INTERIOR
BRUCE BABBITT, Secretary
U.S. GEOLOGICAL SURVEY
Charles G. Groat, Director
The use of firm, trade, and brand names in this report is for identification purposes only and does not constitute endorsement by the U.S. Geological Survey.
For additional information write to:
District ChiefU.S. Geological Survey677 Ala Moana Blvd., Suite 415Honolulu, HI 96813
Copies of this report can be purchased from:
U.S. Geological Survey Branch of Information Services Box 25286 Denver, CO 80225-0286

CONTENTS
Abstract........................................................................................ 1Introduction..................................................................................... 2
Purpose and Scope.......................................................................... 2Surface-Water Gaging Station Numbers ......................................................... 2Acknowledgments.......................................................................... 2
Description of Study Area. ......................................................................... 2Hydrogeology ................................................................................... 4
Extrusive Volcanic Rocks .................................................................... 4Geology ............................................................................ 4Hydraulic Conductivity ................................................................ 8
Intrusive Volcanic Rocks..................................................................... 9Geology ............................................................................ 9Hydraulic Conductivity ................................................................. 11
Hydrology..;................................................................................... 11Ground-Water Recharge ..................................................................... 11Ground-Water Withdrawal.................................................................... 11Streamflow................................................................................. 14
Maliko Gulch ........................................................................ 15Kuiaha Gulch ........................................................................ 20Kaupakulua Gulch ..................................................................... 20Kakipi Gulch ........................................................................ 21
Ground-Water Levels........................................................................ 23Spatial Distribution.................................................................... 23Temporal Variation.................................................................... 28
Chloride Concentration ...................................................................... 28Conceptual Model of Ground-Water Occurrence and Movement ........................................... 28
Perched High-Level Ground Water............................................................. 28Freshwater Lens............................................................................ 29Variably Saturated Flow System ............................................................... 30Development of Variably Saturated Ground-Water Flow Model ...................................... 30
Representation of the Physical System. .................................................... 30Hydraulic Characteristics............................................................... 31Results of the Model Simulations......................................................... 31
Data Needs ..................................................................................... 33Summary and Conclusions ......................................................................... 34References Cited................................................................................. 36
FIGURES
1-2. Maps showing:
.1. Haiku study area, east Maui, Hawaii...................................................... 3
Contents iii

2. Mean annual rainfall in the Haiku study area, east Maui, Hawaii................................ 5
3. Graph showing annual rainfall at Haleakala Ranger Station, Kailiili, and Pauwela rain gages,east Maui, Hawaii ..................................................................... 6
4-6. Maps showing:
4. Generalized surficial geology of Maui, Hawaii.............................................. 7
5. Selected wells in the Haiku study area, east Maui, Hawaii..................................... 10
6. Average annual ground-water recharge in the Haiku study area, east Maui, Hawaii ................. 12
7-8. Graphs showing:
7. Monthly or annual withdrawal, selected water levels, and chloride concentrations ofground water from selected wells, Haiku study area, east Maui, Hawaii ........................ 13
8. Topographic profile of Maliko Gulch, east Maui, Hawaii...................................... 15
9. Map showing surface-water gaging stations; springs; and dry, losing, and gaining sectionsof selected streams, Haiku study area, east Maui, Hawaii....................................... 16
10. Graph showing measured discharge and calculated base flow at selected surface-water gagingstations, Haiku study area, east Maui, Hawaii................................................ 22
11-12. Maps showing:
11. Generalized water table for selected wells completed above sea level and for springs,1948-97, Haiku study area, east Maui, Hawaii............................................ 26
12. Generalized water table for selected wells completed below sea level, 1948-97, Haikustudy area, east Maui, Hawaii ......................................................... 27
13-14. Graphs showing:
13. Model grid used to simulate a variably saturated flow system, and model-predictedpressure head and saturation distributions for selected simulations ............................ 32
14. Response of the ground-water flow model to changes in the saturated vertical hydraulicconductivity of the middle layer ....................................................... 34
TABLES
1. Specific capacities of selected wells, Haiku study area, east Maui, Hawaii................................ 9
2. Summary of influence of surface-water diversions on streams, Haiku study area, east Maui, Hawaii ........... 14
3. Results of measurements in selected streams, Haiku study area, east Maui, Hawaii......................... 17
4. Chloride-concentration data and water-level information used to construct generalized water- table maps, Haiku area, east Maui, Hawaii ...................................................... 24
5. Summary of VS2DT parameter values held constant in the ground-water flow model, Haikustudy area, east Maui, Hawaii................................................................. 33
6. Summary of VS2DT parameter values varied in the ground-water flow model, Haiku area,east Maui, Hawaii.......................................................................... 33
iv Ground Water and Surface Water in the Haiku Area, East Maui, Hawaii

Ground Water and Surface Water in the Haiku Area, East
Maui, Hawaii
By Stephen B. Gingerich
Abstract
The Haiku study area lies on the gently sloping eastern flank of the East Maui Volcano (Haleakala) between the drainage basins of Maliko Gulch to the west and Kakipi Gulch to the east. The study area lies on the northwest rift zone of East Maui Vol cano, a geologic feature 3 to 5 miles wide marked by surface expressions such as cinder, spatter, and pumice cones. The study area contains two geo logic units, the main shield-building stage Hono- manu Basalt and the Kula Volcanics. The hydraulic conductivity of the Honomanu Basalt was esti mated to be between 1,000 and 3,600 feet per day on the basis of aquifer tests and 3,300 feet per day on the basis of the regional recharge rate and observed ground-water heads. The hydraulic con ductivity of the Kula Volcanics is expected to be several orders of magnitude lower.
An estimated 191 million gallons per day of rainfall and 22 million gallons per day of fog drip reach the study area and about 98 million gallons per day enters the ground-water system as recharge. Nearly all of the ground water currently withdrawn in the study area is from well 5520-01 in Maliko Gulch, where historic withdrawal rates have averaged about 2.8 million gallons per day. An additional 18 million gallons per day of ground- water withdrawal is proposed.
Flow in Waiohiwi Gulch, a tributary to Maliko Gulch, is perennial between about 2,000 ft and 4,000 ft altitude. At lower altitudes in Maliko Gulch, flow is perennial at only a few spots down stream of springs and near the coast. The Kuiaha and Kaupakulua Gulch systems are usually dry from sea level to an altitude of 350 feet and gain water from about 350 feet to about 900 feet altitude. The
two main branches of the Kaupakulua Gulch system alternately gain and lose water as high as 2,400 feet altitude. Kakipi Gulch has perennial flow over much of its length but is often dry near the coast below 400 feet altitude.
Fresh ground water occurs in two main forms: (1) as perched high-level water held up by relatively low-permeability geologic layers, and (2) as a fresh water lens floating on denser, underlying saltwater. The rocks beneath the contact between the Kula Volcanics and the underlying Honomanu Basalt and above the freshwater lens appear to be unsaturated on the basis of several observations: (1) streams are dry or losing water where they are incised into the .Honomanu Basalt, (2) the hydraulic conductivity of the Honomanu Basalt is too high to support a thick ground-water lens given the estimated recharge to the study area, and (3) wells that penetrate through the contact have encountered conditions of cascad ing water from above the contact and dry lava tubes in the Honomanu Basalt. More than 90 percent of the recharge to the study area is estimated to flow downward through the perched high-level water body to reach the freshwater lens.
A cross-sectional, steady-state, variably satu rated ground-water flow model using the computer code VS2DT was constructed to evaluate whether a two-layer, variably saturated ground-water flow system could exist given the hydrologic and geo logic conditions of the Haiku study area. Using 25 inches per year of recharge and hydraulic character istics representative of the Kula Volcanics and the Honomanu Basalt, the model demonstrates that a 13-foot thick geologic layer with a saturated vertical hydraulic conductivity less than 6.6x10"2 feet per day can impede vertical ground-water flow enough to produce two separate saturated zones with an unsaturated zone between them. Subsequent lower
Abstract 1

vertical hydraulic conductivity values for the impeding layer allow even less water to reach the lower layer.
INTRODUCTION
A growing population and new agricultural users have increased demand on the existing water-supply systems in many areas of the island of Maui, Hawaii. A potential source of additional water development is ground water in northeast Maui. The County of Maui Department of Water Supply has proposed drilling new wells and using existing wells to ultimately withdraw 16.5 Mgal/d of ground water from the Haiku area between Maliko and Kakipi Gulches (County of Maui Department of Water Supply, 1992). An additional withdrawal of 1.5 Mgal/d from a private well is pro posed. There is concern that withdrawing ground water for domestic and agricultural uses could reduce ground- water discharge into streams. The State of Hawaii Water Resources Protection Plan (State of Hawaii, 1990) emphasizes the importance of instream uses of water and the natural relations between ground-water and surface-water resources. Sustained streamflow pro vides a critical habitat for several endangered and threatened native animal species. Current knowledge of the relation between surface water and ground water in northeast Maui is limited and a better understanding of the ground-water flow system is needed for water- resource management purposes.
In cooperation with the State of Hawaii Commis sion on Water Resource Management and the County of Maui Department of Water Supply, the U.S. Geological Survey (USGS) investigated the interaction between ground water and surface water on the north flank of East Maui Volcano. Because additional ground-water development is projected to first occur in the Haiku area, a significant part of the study was focused on this area. Historic and new streamflow and ground-water data were collected and analyzed to determine gains and losses of streamflow in selected areas, and a conceptual model of the ground-water system in the study area was formulated.
Purpose and Scope
The purpose of this report is to describe (1) the regional relation between surface water and ground
water, (2) the conceptual model of ground-water occurrence, and (3) flow characteristics of individual streams in the Haiku area of northeastern Maui. Exist ing streamflow data were analyzed to estimate ground- water discharge into streams. Reconnaissance-level observations of geologic features and their relation to ground-water discharge were done throughout much of the study area. Streamflow measurements were made along selected streams in the study area to characterize the gains and losses along the stream length. Water- level maps were produced on the basis of water-level information contained in the drilling records of wells in the area. A two-dimensional, variably saturated numer ical ground-water flow model was constructed to eval uate whether the observed geologic and hydrologic conditions could support a multi-layered variably satu rated flow system. An understanding of the dynamics of the ground-water flow system is important for evaluat ing the effects of ground-water withdrawal on streams in the area.
Surface-Water Gaging Station Numbers
The surface-water gaging stations mentioned in this report are numbered according to the USGS num bering system. For this report, however, the complete 8-digit number is abbreviated to the middle 4 digits; for example, station 16596200 is referred to as 5962.
Acknowledgments
Garret Hew of East Maui Irrigation Co., Inc. and many private land owners in the study area provided cooperation and assistance. Mike Robertson of Wailani Drilling provided useful information on several wells in the study area.
DESCRIPTION OF STUDY AREA
The Haiku study area lies on the gently sloping eastern flank of the East Maui Volcano (Haleakala) which forms the eastern part of the island of Maui, the second-largest island in the Hawaiian archipelago (fig. 1). The wedge-shaped study area, covering about 42 mi , is bounded to the north by about 5 mi of coastline and lies between Maliko Gulch to the west and tributar ies of Kakipi Gulch to the east (fig. 1). About 7 mi from the coast at an altitude of 2,400 ft, these two gulches are
2 Ground Water and Surface Water in the Haiku Area, East Maui, Hawaii

156°20' 156°15'
20°55' -
20°50'
Base modified from U.S. Geological Survey digital data, 1:24,000, 1983, Albers equal area projection, standard parallels 20°39'30" and 20°57'30", central meridian 156°20'15"
160° 158° 156°
22C
EXPLANATION
STUDY-AREA BASIN BOUNDARY
1000 TOPOGRAPHIC CONTOUR-Interval 1,000 feet
Figure 1. Haiku study area, east Maui, Hawaii.
20°
f ^-J Kauai Niihau ^\
Oahu
HAWAII
Molokai
Lanai "O Kahoolawe
Maui
/cOr Hawaii
LOCATION MAP
Description of Study Area 3

less than 0.5 mi from each other. The upper tributaries of the gulches are roughly parallel above this altitude to near an altitude of 5,000 ft where they are no longer dis tinguishable on a 1:24,000 scale topographic map. The area above 5,000 ft to the summit near 9,000 ft lies in the drainage basins of Kailua Gulch to the west or Waikamoi Stream to the east.
Land use at lower altitudes (below 4,000 ft) in the study area has changed from primarily livestock grazing prior to the 1920's to primarily pineapple cultivation in the 1920's and 1930's and then to pineapple cultivation mixed with livestock grazing and some residential areas from the 1940's to the present (1998) (Territorial Plan ning Board, 1939; Economic Planning and Coordina tion Authority, 1957; Soil Conservation Service, 1982). At higher altitudes, much of the land has historically been forested State conservation land or used for live stock grazing.
Rainfall distribution on the northern flank of the volcano is primarily governed by the orographic effect. Precipitation is heaviest where the prevailing northeast erly trade winds encounter the flank of the volcano, forcing warm, moist air into the cool, higher altitudes. The highest rainfall amounts are usually recorded between 2,000 and 6,000 ft altitude. The study area lies on the western side of where these effects are most pre dominant (fig. 2). Mean annual rainfall increases from about 60-80 in/yr at the coast to nearly 200 in/yr at an altitude of 2,500 ft on the eastern side of the study area and then decreases to about 60-80 in/yr near 5,000 ft altitude (Giambelluca and others, 1986). Above an alti tude of 1,000 ft, rainfall contours are nearly perpendic ular to the coast.
Annual rainfall at 7,030 ft altitude (Haleakala Ranger Station, rain gage 338, fig. 2) ranged from about 18 to 111 inches during 1939-96 (fig. 3). Downslope at 2,520 ft altitude (Kailiili, rain gage 436, fig. 2), annual rainfall ranged from about 57 to 201 inches during 1925-80 (fig. 3). Nearer the coast at 485 ft altitude (Pauwela, rain gage 490, fig. 2), rainfall ranged from about 36 to 94 inches annually during 1919-69.
The rainfall maps of Giambelluca and others (1986) were digitized and used as an input data set for a water budget model of east Maui (Shade, in press). On the basis of Shade's data, the total volume of average rainfall in the Haiku study area is estimated to be 191 Mgal/d, or 96 in/yr averaged over the entire study area.
Studies on the islands of Hawaii, Lanai, and Oahu (Juvik and Nullet, 1995; Giambelluca and Nullet, 1991; Ekern, 1964; and Ekern, 1983) have shown that, in addition to measured rainfall, water reaches the ground surface through cloud-water interception (fog drip). The fog zone on the windward side of East Maui Vol cano extends from about 1,970 ft to the lower limit of the most frequent temperature inversion base height at about 6,560 ft (Giambelluca and Nullet, 1991). Using digitized rainfall maps of this area and fog-drip/rainfall ratios estimated from a study on the windward side of Mauna Loa on the island of Hawaii, the amount of fog drip in the Haiku study area was estimated to be about 22 Mgal/d in the water-budget study of east Maui (Shade, in press).
No published pan-evaporation records exist for any sites in the study area. The nearest site is about 1 mi to the west of Maliko Gulch (station 485, fig. 2) where the station altitude was 320 ft. During 1963-70, mea sured pan evaporation at this station ranged from 85.15 to 102.62 inches (Ekern and Chang, 1985). Shade used a one-to-one relation between pan evaporation and potential evapotranspiration to estimate that about 33 percent of rainfall and fog drip or 70 Mgal/d is accounted for by evapotranspiration in the Haiku study area (Shade, in press).
HYDROGEOLOGY
East Maui Volcano is formed primarily by extru sive shield- and post-shield-stage lavas and secondarily by rejuvenated-stage volcanic rocks which cover the summit and southern and eastern regions (fig. 4). Intru sive volcanic rocks in the form of dikes associated with rift zones and volcanic vents are found along three axes.
Extrusive Volcanic Rocks
Geology
Extrusive volcanic rocks consist mainly of lava flows that effused from fissures and vents. Most lava flows emerge from fissures as pahoehoe, characterized by smooth, ropy surfaces, and can change to aa as they advance downslope. Pahoehoe flows generally domi nate near the rift zones of volcanoes, whereas aa flows dominate farther down the flanks. Aa flows contain massive central cores typically sandwiched between rubbly clinker layers.
4 Ground Water and Surface Water in the Haiku Area, East Maui, Hawaii

156°20'
20°55'
20°50'
156°15'
PACIFIC OCEAN
Base modified from U.S. Geological Survey digital data, 1:24,000, 1983, Albers equal area projection, standard parallels 20°39'30" and 20°57'30", central meridian 156°20'15"
-20-
321,
EXPLANATION
STUDY-AREA BASIN BOUNDARY
LINE OF EQUAL MEAN ANNUAL RAINFALL Interval, in inches, is variable
RAIN-GAGING STATION AND NUMBER
Pacific Ocean
Figure 2. Mean annual rainfall in the Haiku study area, east Maui, Hawaii (modified from Giambelluca and others, 1986).
Hydrogeology 5

300
200
100
- HALEAKALA RANGER STATION AT 7,030 FT (rain gage 338)- Data not available for 1991
300
200
100
COLUI O
<cc0^
KAILIILI AT 2,520 FT (rain gage 436)Data not available for 1942,1954,1961,1969-71,1973-76, 1978, 1980-present
Mean annual rainfall
300
200
100
- PAUWELA AT 485 FT (rain gage 490)- Data not available for 1942,1950,1956,1961,1970-present
Mean annual rainfall
0 'J " ' 'J .
YEAR
Figure 3. Annual rainfall at Haleakala Ranger Station, Kailiili, and Pauwela rain gages, east Maui, Hawaii (Data from U.S. Department of Commerce digital data, National Climatic Data Center, and East Maui Irrigation Co., Inc.. in unpub. files, U.S. Geological Survey, Hawaii District office).
The East Maui Volcano was built by eruptions principally from three rift zones and a presumed central vent (Stearns and Macdonald, 1942). Rocks formed from the main shield-building stage of the volcano are known as the Honomanu Basalt (fig. 4) and consist of tholeiitic basalt found as thick accumulations of thin lava flows and associated intrusive rocks and rare pyro- clastic deposits (Langenheim and Clague, 1987). The end of the shield-building stage of the volcano has been estimated to be between 0.93 and 0.97 million years ago on the basis of potassium-argon age dating (Chen and others, 1991). The lavas of the Honomanu Basalt have typical dips of 2° to 22° with the flatter dips near the
isthmus where flows approached the West Maui Vol cano. The basalts were laid down as very vesicular pahoehoe and aa flows averaging about 15 ft thick (Stearns and Macdonald, 1942, p. 61). Contrary to typ ical observations of shield-stage lava flows in which aa is typically found in greater abundance than pahoehoe away from the volcanic vents, pahoehoe flows are abun dant throughout the Honomanu Basalt, even at the periphery of the volcano.
In the study area, exposures of Honomanu Basalt are found in Maliko Gulch, Kakipi Gulch, and along the coast between the two gulches (Stearns, 1942). Expo sures are easily identified as Honomanu Basalt in the
6 Ground Water and Surface Water in the Haiku Area, East Maui, Hawaii
EX
PLA
NA
TIO
N
<
Q.
156°
40'
21
| -|
SED
IMEN
TAR
Y D
EPO
SITS
(H
oloc
ene
and
Plei
stoc
ene)
WE
ST M
AU
1 V
OL
CA
NO
Lah
aina
Vol
cani
cs (
Plei
stoc
ene)
Hon
olua
Vol
cani
cs (
Plei
stoc
ene)
Wai
luku
Bas
alt (
Plei
stoc
ene)
EA
ST M
AU
I (H
AL
EA
KA
LA
) V
OL
CA
NO
Han
a V
olca
nics
(H
oloc
ene
and
Plei
stoc
ene?
)
Kip
ahul
u M
embe
r (P
leis
toce
ne?)
Kul
a V
olca
nics
(Pl
eist
ocen
e)
Hon
oman
u B
asal
t (Pl
eist
ocen
e)
WE
ST
MA
UI
VO
LCA
NO
CIN
DE
R, S
PAT
TE
R,
AN
D P
UM
ICE
CO
NE
S
CO
NT
AC
T
APP
RO
XIM
AT
E
CA
LD
ER
A B
OU
ND
AR
Y
""""
»
AX
IS O
F R
IFT
ZO
NE
-
App
roxi
mat
ely
loca
ted
BO
UN
DA
RY
OF
STU
DY
AR
EA
156°
Bas
e m
odifi
ed f
rom
U.S
. G
eolo
gica
l S
urve
y di
gita
l da
ta,
1:24
,000
, 19
83,
Alb
ers
equa
l ar
ea
proj
ectio
n, s
tand
ard
para
llels
20°
39'3
0" a
nd
20°5
7'30
", c
entr
al m
erid
ian
156°
20'1
5"
02
4 M
ILE
Si
i i
i i
02
4 K
ILO
ME
TE
RS
Han
a
Kaa
pahu
B
ay
Kip
ahul
u
Bay
La P
erou
set
Bay
^O
(D
Figu
re 4
. G
ener
aliz
ed s
urfic
ial g
eolo
gy,
Mau
i, H
awai
i (m
odifi
ed fr
om L
ange
nhei
m a
nd C
lagu
e, 1
987)
.

field when they are thin bedded, porphyritic, and com monly show characteristics typical of pahoehoe flows. Field reconnaissance has shown that exposures of Honomanu Basalt can be found nearly 4 mi from the coast at an altitude of about 600 ft in Maliko Gulch and almost 1 mi from the coast in Kakipi Gulch at an alti tude of about 100 ft. These exposures are much more extensive than those shown on the map by Stearns (1942) which shows the Honomanu Basalt exposed in Maliko Gulch for less than a mile from the coast and no exposures in Kakipi Gulch.
The Kula Volcanics, which overlies the Hono manu Basalt, consists of post-shield-stage lava flows of hawaiite with some ankaramite and alkalic basalt and associated intrusive rocks and pyroclastic and sedimen tary deposits (Langenheim and Clague, 1987). The Kula Volcanics is estimated to be 0.36 to 0.93 million years old with many of the oldest rocks having chemical com positions transitional from the shield- to post-shield- stage lava (Chen and others, 1991). Rocks from this transitional phase are 50 to 100 ft thick and can be dif ficult to characterize as belonging to either the Hono manu Basalt or the Kula Volcanics. In some places the two units are separated by a thin red soil layer that has undoubtedly been altered by the weight and heat of the overlying flows. The Kula Volcanics almost completely covers the underlying Honomanu Basalt and exposures range from 2,500 ft thick near the summit to 50 to 200 ft thick near the coast. Individual flows average about 20 ft in thickness near the summit and 50 ft near the periphery, but flows as much as 200 ft thick are not rare (Stearns and Macdonald, 1942, p. 75). The usual dip of the flows is about 10 degrees. The flows are generally thicker and narrower than the Honomanu Basalt and have more lenticular bedding due to the filling of swales and valleys eroded into the underlying rocks. Flows of the Kula Volcanics cover almost all of the study area (fig-4).
Rejuvenated-stage lavas of alkalic basalt and basanite, named the Hana Volcanics, are exposed only in the southern and eastern areas of east Maui (fig. 4) and are not found in the study area.
Hydraulic Conductivity
Hydraulic conductivity is a measure of the capac ity of a rock to transmit water. The main elements of lava flows contributing to their high hydraulic conduc tivity are (1) clinker zones associated with aa flows,
(2) voids along the contacts between flows, (3) cooling joints normal to flow surfaces, and (4) lava tubes asso ciated with pahoehoe flows. No published estimates are available of hydraulic conductivity for rocks in the study area and few are available for Maui in general.
The horizontal hydraulic conductivity of the Hono manu Basalt in the study area was estimated to be 3,600 ft/d on the basis of a single-well aquifer test done at well 5419-01 (C.D. Hunt, Jr., hydrologist, USGS, written commun., 1997). An analysis of a variable-discharge test at well 5420-01, which is open to the Honomanu Basalt and located just west of the study area, yielded a horizontal hydraulic conductivity estimate of greater than 1,000 ft/d (unpub. data, aquifer-test archive, USGS, Hawaii District). Stearns and Macdonald (1942) classify the Honomanu Basalt as extremely permeable and considered it hydrologically similar to dike-free shield-building-stage lavas on Oahu which have reported horizontal hydraulic conductivity values of 500 to 5,000 ft/d (Hunt, 1996).
In the absence of more long-term aquifer tests, a comparison of specific capacities of wells open to the Honomanu Basalt can be made to evaluate the relative yield of the aquifer penetrated by each well. The spe cific capacities of nine wells in or near the Haiku study area, which penetrate below sea level and are therefore expected to be in the Honomanu Basalt, average about 600 gal/min/ft of drawdown (table 1). The values decrease toward the east and range from 1,400 gal/min/ft of drawdown at the westernmost well (5320-01) to 0.67 gal/min/ft of drawdown at the east ernmost well (5514-01).
Hydraulic conductivity can also be estimated using an equation for a water-table surface in a coastal aquifer (modified from Marsily, 1986, p. 224):
(1)
where:h - hydraulic head, in feet;P = density ratio between freshwater and saltwater,
0.025;Q = ground-water flow, in cubic feet per day; K = hydraulic conductivity, in feet per day; L = width of cross section of ground-water flow, in
feet; and x = distance from coast, in feet.
8 Ground Water and Surface Water in the Haiku Area, East Maui, Hawaii

Table 1. Specific capacities of selected wells, Haiku study area, east Maui, Hawaii[All well information is from unpublished data, USGS, Hawaii District well files unless otherwise noted; drawdown values are not corrected for wellloss; --, not measured or no data; datum is mean sea level; <, less than; >, greater than]
State well number
6-5317-016-5320-016-5413-016-5413-09 6-5419-01
6-5420-016-5420-026-5513-016-5514-016-5516-016-5519-016-5519-026-5520-016-5616-02
Well name
KulamaluHamakuapoko 2
Huelo 1Hagar Haiku
Maui High SchoolHamakuapoko 1
TavaresMarquard
FeehanPauwelaBehnke
HC&S11 A,BMartin
Withdrawal rate (gallons per
minute)
l,400a700; 840
614
350; 500; 700
150-50049210
21; 251
4807
2,35435
Length of test (minutes)
5,2106,000; 8,640
360250
4,320; 4 680-10,0804,3156,090
13014; 483
273,900---
480
Specific capacity Altitude of bottom Drawdown (gallons per minute of open interval
(feet) per foot of drawdown) (feet)
18.30.4; 0.6
1800.25
0.6; 0.95; 1.0
0.2-1.71.5145
78; 3767
0.46781.9
<0.1
771,750; 1,400
0.0356
583; 526; 700
750-2943280.07
0.27; 0.680.011,0430.091,239>350
-128-32
230-33 -43
-22-3479
-61185-34132-93-39
a Austin, Tsutsumi and Associates, Inc. (1998)
Ground-water flow, Q, was set equal to the 1.3xl07ft3/d recharge (from the section "Ground-Water Recharge" later in this report), head in the aquifer was measured at well 5317-01 located 20,000 ft from the coast (location shown on fig. 5) so h was set equal to 12 ft (also from the section entitled "Ground-Water Levels") and L was set equal to 26,400 ft (5 mi). Using equation 1 and solving for K yields an estimate for hydraulic conductivity of about 3,300 ft/d. At well 5519-01, located 5,300 ft from the coast, the head is 5.4 ft and the resulting hydraulic-conductivity estimate from equation 1 is 4,400 ft/d.
No estimates are available for the hydraulic con ductivity of the Kula Volcanics in the study area. An aquifer test was done on well 4806-48, near Nahiku, Maui which penetrates about 350 ft of the transitional rocks of the lower Kula Volcanics and the upper Hono- manu Basalt and the resulting horizontal hydraulic con ductivity estimate was 0.83 ft/d (unpub. data, aquifer- test archive, USGS, Hawaii District). The specific capacities of four wells that presumably are open to the Kula Volcanics range from 0.01 to 0.09 gal/min/ft of drawdown. The average specific capacity of these four wells is about four orders of magnitude lower than the average specific capacity of the wells that penetrate into the Honomanu Basalt.
Intrusive Volcanic Rocks
Geology
Intrusive volcanic rocks include those rocks, such as dikes that formed when magma cooled below the ground surface. Dikes associated with rift zones are the dominant intrusive rocks in Hawaiian volcanoes. The East Maui Volcano has three primary rift zones (Stearns and Macdonald, 1942; Langenheim and Clague, 1987) and the study area lies on one of these, the northwest rift zone (fig. 4). Because of the relative youth of East Maui Volcano, exposures of dikes are scarce and limited to the walls of the summit and the larger valleys (Stearns, 1942) (fig. 4). But positive gravity anomalies extending from the summit to the northwest, southwest, and east, indicate the presence of dense, intrusive dikes beneath the ground surface (Kinoshita and Okamura, 1965). These gravity anomalies correspond to the locations of typical rift-zone surface features: cinder, spatter, and pumice cones.
The dikes and the rocks they intrude are commonly referred to as dike complexes. In Hawaiian volcanoes, dike complexes range in width from 1.5 to 3 mi and average about 1.9 mi (Macdonald and others, 1983). The dike complex associated with the northwest rift zone of East Maui Volcano appears to be about 3 mi wide near the coast and could be greater than 5 mi wide
Hydrogeology 9
156°20'
20°55'
20°50'
156°15'
PACIFIC OCEAN
Base modified from U.S. Geological Survey digital data, 1:24,000, 1983, Albers equal area projection, standardparallels 20°39'30" and 20°57'30", central meridian 156°20'15"
EXPLANATION
STUDY-AREA BASIN BOUNDARY
.5021-01 WELL AND NUMBER
Pacific Ocean
Figure 5. Selected wells in the Haiku study area, east Maui, Hawaii.
10 Ground Water and Surface Water in the Haiku Area, East Maui, Hawaii

at an altitude of 4,000 ft on the basis of the locations of the cinder and spatter cones which are in two parallel and roughly linear patterns (fig. 4). The entire study area lies within this dike complex. On Oahu, the dike complexes near the ancient caldera are marked by swarms of closely spaced, nearly vertical, and nearly parallel dikes (Takasaki and Mink, 1985). Dikes in a dike complex average about 100 to 200 per mile of width (Macdonald and others, 1983) and compose 10 percent or more of the rock volume (Takasaki and Mink, 1985). The number of dikes in the dike complex is expected to increase with increasing depth and could average 500 to 600 per mile of width of the complex (Macdonald and others, 1983). The dike complexes are hydrologically important because dikes have low per meability and tend to impound ground water to high altitudes between dikes.
Hydraulic Conductivity
In general, the average hydraulic conductivity of a dike complex decreases as the number of dike intru sions within the dike complex increases. In addition, hydraulic conductivity is expected to be higher in the direction parallel to the strike of the dikes rather than perpendicular to the strike. On the basis of a numerical model, Meyer and Souza (1995) estimated that dikes
c o
have a hydraulic conductivity of 10 to 10 ft/d and that the dikes reduce the average, effective hydraulic conductivity of the dike complex to about 0.01 to 0.1 ft/d. In a summary of aquifer-test analyses for wells on Oahu, Hunt (1996) shows that estimates of hydraulic conductivity for dike-intruded shield-building-stage lava flows are about 10 to 100 times lower than for dike- free, shield-building-stage lava flows.
HYDROLOGY
Ground-Water Recharge
Ground-water recharge in the Haiku study area was estimated to be 98 Mgal/d on the basis of a monthly water budget for all of east Maui calculated for natural vegetation conditions (Shade, in press) (fig. 6). This estimate represents an average recharge of about 49
7in/yr over the 42 mi study area. However, recharge var ies areally from a minimum of less than 10 in/yr in some areas near the coast to a maximum of almost 150 in/yr in the areas of highest rainfall and fog drip between alti
tudes of 2,000 and 6,000 ft. The recharge estimate rep resents the average of two different monthly water- budget computation methods which differ by the order in which recharge and evapotranspiration are taken into account. Each water-budget computation method pro duced a recharge estimate that differed from the average value by about 21 percent. The 98 Mgal/d of estimated recharge is about 46 percent of the rainfall and fog drip in the study area.
Compared with natural vegetation, pineapple culti vation can increase recharge to an area because evapo transpiration from unirrigated pineapple fields is less than evapotranspiration from areas of natural vegeta tion. Potential evapotranspiration from pineapple fields is estimated to be about 20 percent of measured pan evaporation whereas potential evapotranspiration from sugarcane fields and areas of natural vegetation is equal to pan evaporation (Giambelluca, 1983). The-Haiku study area has had areas of pineapple cultivation that have been, in the 1960's, as large as about 9 mi2 , or 21 percent of the study area (University of Hawaii Land Study Bureau, 1967). Therefore, the estimate of recharge calculated on the basis of natural vegetation conditions is probably slightly low when the effects of pineapple cultivation are considered. Also, a small amount of water probably recharges the aquifer by infil tration from the surface-water diversion ditches and tunnels and from associated surface reservoirs, but this amount is unknown.
Ground-Water Withdrawal
Nearly all of the ground water currently withdrawn in the study area is from well 5520-01 in Maliko Gulch (fig. 5). The well, which consists often vertical borings as deep as 90 ft below sea level connected with two lat eral tunnels and two pumps (pumps 11A and 1 IB), was drilled during 1897-99 into Honomanu Basalt (Stearns and Macdonald, 1942, p. 217), although one account suggests that the well draws water from the gravel in the base of Maliko Gulch (K.N. Vaksvik, 1929, unpub lished note in files of the USGS, Hawaii District). Water from this system is pumped to the Haiku Ditch for irri gation. The records of yearly or monthly pumpage show that the annual ground-water withdrawal averaged 2.8 Mgal/d during 1913-96, which includes the period 1954-60 when the pumps in the well were not in oper ation (fig. 7). Monthly pumpage from the well has
Hydrology 11

156°20' 156°15'
20°55' -
20°50'
Base modified from U.S. Geological Survey digital data, 1:24,000, 1983, Albers equal area projection, standard parallels 20°39'30" and 20°57'30", central meridian 156°20'15"
Pacific Ocean
EXPLANATION
ESTIMATED GROUND-WATER RECHARGE, IN INCHES
Less than or equal to 10 Greater than or equal to 50 and less than 100
tt-ioxi Greater than or equal to 100 and less than 150
^H| Greater than or equal to 150
Greater than or equal to 10 and less than 25
Greater than or equal to 25 and less than 50 _.._.._ STUDY-AREA BASIN BOUNDARY
Figure 6. Average annual ground-water recharge in the Haiku study area, east Maui, Hawaii (modified from Shade, 1999).
12 Ground Water and Surface Water in the Haiku Area, East Maui, Hawaii

IU
8
6
4
2
0
I i i i I I i i i i I i i i | i i i i
WELL 5520-01 - No withdrawa - data not available for 1898-1912, 191
-
_
-
"-[} ,J
-: ; p 7
:: : ;. > _ : >"
-: :'- .: '^ ^.; > ' \ : ' ':: ;.;, \ >'
II III III 1 1 1 1 1 1 1 1 1 1 1 1 1 1 1 1 1 1 1 1 1 1 1 1 1 1 1 1 1 1 1 1 1 1 1 1 1 1 1 1 1 1 1 1 1 1 1 1 1 1 1
1 durng 1954-61, Annual withdrawal 8-22, 1942-43, 1989, 1997
Fl',--::
: 5^S -^ __
1 ;'; 1 ft t l|
r:i~~,
Average annual withdrawal
bilu...^:
Tl:i:
H-
, ._ :,.; A. -;
; :; ;: ';.' >' :/ .'
''. *' -- ^.' ' ': '''' :
-"
IS ;ln:,:
fc litL- ' &
'' '' ' 1 I 1
LU COz <LU
LLJ
O CO
i I I i i i I I i i
> o 5520-01 5519-01' > 5419-01
I I
DC 2,000 LU
1,500
^ 1,000
ccO-j 500
I I ' ' ' I I ' ' ' I I ' ' ' I I '
-~* 5520-01 (COMBINED)-° 5520-01 (PUMP 11 A)- 5520-01 (PUMP11B)
^ p. i i i i i i i i i i i i i i i i i i i
YEAR
Figure 7. Monthly or annual withdrawal, selected water levels, and chloride concentrations of ground water from selected wells, Haiku study area, east Maui, Hawaii.
varied seasonally from zero to as much as 17 Mgal/d. Unreported withdrawals from domestic wells in the area probably total less than 0.2 Mgal/d on the basis of well- installation specifications listed on various well-permit applications (Department of Land and Natural Resources). A well (5318-01) presently being con structed (1998) near Kaupakulua (fig. 5) is proposed for withdrawal of about 1.5 Mgal/d from the Honomanu Basalt (Department of Land and Natural Resources pump installation permit, 1998).
Attempts have been made to enhance discharge from several small springs in the area by tunneling to obtain water for domestic supplies. Waihou Spring (wells 4817-01, -02; fig. 5) supplied about 15,000 gal/d to Haleakala Ranch from three short tunnels in a lava- covered cinder cone in the Kula Volcanics at an altitude of 3,350 ft (Stearns and Macdonald, 1942, p. 213) but the water-supply system is now abandoned. Kawaikoa tunnel is reported to be a 100-ft long tunnel at an alti tude of 10 ft in Maliko Gulch that intercepts about 5,000 gal/d of water from a soil and gravel layer between the
Hydrology 13

Table 2. Summary of influence of surface-water diversions on streams, Haiku study area, east Maui, Hawaii[Datum is mean sea level]
Diversion system
Upper Kula PipelineLower Kula PipelineOpana TunnelKaluanui DitchWailoa DitchKauhikoa/New
Hamakua DitchLowrie DitchHaiku Ditch
Approximate altitude of
system (feet)
4,2002,8002,2001,6001,2001,000
600400
Kakipi Gulch system: includes Kakipi,
Halehaku, and Opana Gulches
takes waterno effect
takes waterdoes not cross
takes wateradds then takes water
takes watertakes water
Kaupakulua Gulch system: includes
Kaupakulua, Opaepilau, Kalakohi, and Awalau Gulches
does not crossdoes not cross
adds then takes watertakes water
no effecttakes water
takes watertakes water
Kuiaha Gulchsystem: includes
Kuiaha, Ohia, Huluhulunui,
Kapuaahoohui, Pauwela, and
Lilikoi Gulches
does not crossdoes not crossdoes not cross
adds waterno effect
takes water
takes watertakes water
Maliko Gulch system: includes
Waiohiwi and Kahakapao
Gulches
no effectno effectno effect
abandonedno effectno effect
no effectno effect
Kula Volcanics and the Honomanu Basalt (tunnel 24, Stearns and Macdonald, 1942, p. 213). But the geologic map (Stearns, 1942) shows tunnel 24 at an altitude of about 1,110 ft on the east side of Maliko Gulch. This site matches the location of well 5319-01 (fig. 5) in the State records named Silveno Spring (Department of Land and Natural Resources, 1991) so there appears to be a discrepancy in the naming of this tunnel. Silveno Spring could be the same spring that is called both Pukalani Spring and spring 17 by Stearns and Mac donald (1942, p. 212). This spring is located about 200 ft upstream of the Wailoa Ditch siphon on the floor of Maliko Gulch at an altitude of about 840 ft and dis charges from an interbedded ash and soil layer in the Kula Volcanics. Both the tunnel and the spring lie well above the contact between the Honomanu Basalt and the Kula Volcanics. Well 5620-01 (fig. 5) is a 130-ft long tunnel that also intercepts water from a soil and gravel layer between the Kula Volcanics and the Hono manu Basalt at an altitude of 50 ft near the mouth of Maliko Gulch (tunnel 23, Stearns and Macdonald, 1942, p. 213). According to Stearns and Macdonald (1942), well 5620-01 supplies about 10,000 gal/d of water, some of which is currently used as a domestic supply for several homes in the area.
Streamflow
The drainage pattern of the stream valleys on east Maui is radial from the summit of East Maui Volcano to the ocean. The streams in the study area drain to the
north. Valley development is in a youthful stage as streams are eroding downward into the original volcano slope, forming steep-sided valleys and leaving nearly uneroded upland areas (planezes) between the stream valleys. Streamflow consists of direct runoff, base flow, and flow added to some streams from the network of irrigation ditches that cross the study area. Base flow represents ground-water discharge to the stream. Maliko and Kakipi Gulches are the major drainage fea tures of the study area (fig. 1). Twelve minor stream valleys (not all shown on fig. 1) enter the ocean between these two gulches and the largest of these minor streams are the Kuiaha and Kaupakulua Gulch drainages. Eight surface-water diversion systems carry water across the study area from east to west and all of these systems either remove water from or add water to at least one stream in the study area (fig. 1, table 2). Currently, the USGS maintains one surface-water gaging station on an upper tributary of Kaupakulua Gulch to measure streamflow-diversion from Kakipi Gulch. The USGS has also historically maintained gaging stations on trib utaries of Kakipi Gulch (Fontaine, 1996).
The rate at which a stream is observed to gain water is dependent on hydrogeologic conditions and on the spacing of Streamflow measurements made along the stream channel. Ideally, Streamflow should be mea sured at sites spaced at equal distances along the entire length of the channel, but because of the large size of the study area, the rugged terrain, and the presence of surface-water diversion systems, this approach was impractical. Therefore, stream measurements were
14 Ground Water and Surface Water in the Haiku Area, East Maui, Hawaii

LLJ >LU
LU
2,000
1,800
1,600
< 1,400
2 1,2002 LU
o 1,000
800
Q 600D
< 400
200
Topographic profik of upland surface
Topographic profile of Maliko Gulch
Contact between Kula Volcanics and Honomanu Basalt
5,000 10,000 15,000 20,000 25,000
DISTANCE FROM OCEAN, IN FEET
30,000 35,000 40,000
Figure 8. Topographic profile of Maliko Gulch, east Maui, Hawaii.
made at sites determined by accessibility and the loca tion of the streamflow diversions.
Maliko Gulch
Maliko Gulch is the most deeply incised stream valley in the study area with some sections of the valley floor more than 400 ft below the upland surface (fig. 8). The floor of the gulch gradually rises from sea level to about 600 ft altitude at a distance of about 3.4 mi from the coast. Along this entire length, the valley is eroded through the Kula Volcanics into the Honomanu Basalt. Above 600 ft altitude the valley floor lies on the thick flows of the Kula Volcanics, which provide more resis tance to erosion. Here the valley profile has a more stairlike configuration with numerous small waterfalls and a steeper gradient; the altitude of the base of the gulch increases from 600 ft to 1,200 ft after only another
mile of length inland. The gulch splits into two main tributaries, Kahakapao and Waiohiwi Gulches, at about 1,800 ft altitude and these gulches rise at a gradient of about 840 ft/mi to about 5,400 and 4,000 ft altitude, respectively. None of the eight surface-water diversion systems that cross Maliko Gulch are built to take water from the gulch. Occasionally, water is added to Maliko Gulch at the Wailoa Ditch crossing.
Flow is perennial in Waiohiwi Gulch between 2,000 ft and 4,000 ft altitude. At lower altitudes in Maliko Gulch, flow is perennial at only a few spots downstream of springs and near the coast (fig. 9, table 3). Near the coast, a few feet above sea level, ground water discharges into the streambed from below, but at higher altitudes, streamflow is fed by springs issuing from the walls of the gulch. At sites Maliko 2 through Maliko 6, the springs seem to be associated with an ashy
Hydrology 15
156j20' 156j15'
20(55' -
20j50'
Haiku* ^M s- I »/ SKuiaha 20
v Maliko6.1^ ,}UJ.,ha10
I II I 1 ffi Kaupakulua 11.2
FLOW-MEASUREMENT SITE
Base modified from U.S. Geological Survey digital data, 1:24,000, 1983, Albers equal area projection, standard parallels 20j39'30" and 20i57'30", central meridian 156i20'15"
STUDY-AREA BOUNDARY
GAINING STREAM SECTION
LOSING STREAM SECTION
DRY STREAM SECTION
LKP Spring Q SPRING
SURFACE-WATER GAGING STATION AND ABBREVIATED NUMBER-Complete number is 16596200
-2000- TOPOGRAPHIC CONTOUR-Interval1,000 feet
Figure 9. Surface-water gaging stations; springs; and dry, losing, and gaining sections of selected streams, Haiku study area, east Maui, Hawaii.
16 Ground Water and Surface Water in the Haiku Area, East Maui, Hawaii

Tabl
e 3.
Res
ults
of
mea
sure
men
ts in
sel
ecte
d st
ream
s, H
aiku
stu
dy a
rea,
eas
t M
aui,
Haw
aii
[ft, f
eet;
Mga
l/d,
mill
ion
gallo
ns p
er d
ay;
°C, d
egre
es C
elsi
us;
uS/c
m,
mic
rosi
emen
s pe
r cen
timet
er; m
g/L
, mill
igra
ms
per
liter
;U
SGS
1:24
,000
-sca
le to
pogr
aphi
c m
aps
(Hai
ku a
nd P
aia
quad
rang
les)
; dat
um is
mea
n se
a le
vel;
<, le
ss th
an]
-, n
ot a
vaila
ble,
not
app
licab
le, o
r no
sam
ple;
alti
tude
s es
timat
ed f
rom
198
3
Hydrology
Stat
ion
num
ber
Mal
iko
1
Mal
iko
2
Mal
iko
2.1
Mal
iko
3
Mal
iko
4
Mal
iko
5
Mal
iko
5.1
Mal
iko
6
Mal
iko
6.1
Mal
iko
7
Mal
iko
7.1
Mal
iko
8
Mal
iko
8.1
Mal
iko
9
Mal
iko
9.1
Mal
iko
9.2
Mal
iko
9.3
Mal
iko
10
Kui
aha
1
Kui
aha
2
Kui
aha
3
Kui
aha
4
Kui
aha
5
Kui
aha
6
Kui
aha
7.1
Str
eam
nam
e
Mal
iko
Gul
ch
Mal
iko
Gul
ch
Mal
iko
Gul
ch
Mal
iko
Gul
ch
Mal
iko
Gul
ch
(unn
amed
tri
buta
ry)
Mal
iko
Gul
ch
Mal
iko
Gul
ch
Mal
iko
Gul
ch
Mal
iko
Gul
ch
Mal
iko
Gul
ch
Mal
iko
Gul
ch
Mal
iko
Gul
ch
Mal
iko
Gul
ch
Mal
iko
Gul
ch
Mal
iko
Gul
ch
Mal
iko
Gul
ch
Mal
iko
Gul
ch
Wai
ohiw
i G
ulch
Kui
aha
Gul
ch
Kui
aha
Gul
ch
Kui
aha
Gul
ch
Kui
aha
Gul
ch
Lili
koi
Gul
ch
Lili
koi
Gul
ch
Lili
koi
Gul
ch
Alti
tude
(f
t) 3 50 50 60 135
140
170
200
500
800
840
1,15
0
1,28
0
1,68
0
1,74
0
1,89
0
1,96
0
2,08
0 5
110
180
200
305
310
360
Dat
e
11/1
1/93
9/28
/93
11/1
1/93
10/7
/93
9/28
/93
9/28
/93
11/1
1/93
9/28
/93
9/28
/93
9/30
/93
11/1
2/93
9/28
/93
11/1
5/93
8/
20/9
7 10
/27/
97
10/2
7/97
10/5
/93
10/5
/93
9/29
/93
9/29
/93
9/29
/93
9/29
/93
2/6/
98
10/2
9/97
10/2
9/97
10/2
9/97
10/2
9/97
10/2
9/97
10/2
9/97
10/2
9/97
Flow
(M
gal/d
)
0.04
0.05
0.
05
<0.
01 0.02
0.04
0.
06
0.03
0 0.05
0.
10
0 0.05
-- --
<0.
01 0.01
0.01
0.03
-- 0 0 0 0 0 0 0.23
0.19
Typ
e of
st
ream
flow
up
stre
am o
f si
te
losi
ng
losi
ng
dry
losi
ng
dry
dry
losi
ng
dry
losi
ng
dry
dry
dry
losi
ng
losi
ng
losi
ng
gain
ing
dry
losi
ng
dry
dry
dry
dry
dive
rsio
n
gain
ing
gain
ing
Wat
er
tem
pera
ture
22.2
23.3
23
.1
23.6
25.5
26.6
23
.7
24.1 -- 24.6
20
.9 -- 19.6
21.4 -- 24.6
22.1
23.1
22.7
21.2
23.1 -- -- -- --
22.1
24.9
Wat
er s
peci
fic
cond
ucta
nce
(uS/
cm)
103
294
258
605
275
278
277
411 --
141
123 --
158
146 --
123
186 78 71 80 58 -- -- -- --
189
172
Chl
orid
e co
ncen
trat
ion
(mg/
L)
Com
men
ts
--
Wel
l 56
20-0
1
Mal
iko
Spri
ng a
t 50
ft-
Mal
iko
Spri
ng a
t 13
5ft
--
all
flow
sin
ks i
nto
stre
ambe
d
Mal
iko
Spri
ng a
t 20
0 ft
all
flow
sin
ks i
nto
stre
ambe
d
Mal
iko
Spri
ng a
t 80
0 ft
24
Puka
lani
Spr
ing;
min
or a
mou
nt o
f flo
w w
as o
bser
ved
on f
loor
of g
ulch
--
Mal
iko
Spri
ng a
t 1 ,
280
ft- -- -- gb
W
aioh
iwi
Spri
ng a
t 1,
960
ft
all
flow
sin
ks i
nto
stre
ambe
d-- - --
all w
ater
div
erte
d by
Hai
ku D
itch
23
22

00 O o c Q.
Sf
(D 0) 3 Q.
C O (D B* ** 5" 5 o n> c 5 0) m (0 2 X 1 OJ
Tab
le 3
. R
esul
ts o
f mea
sure
men
ts in
sel
ecte
d st
ream
s, H
aiku
stu
dy a
rea,
eas
t Mau
i, H
awai
i-C
ontin
ued
[ft,
feet
; M
gal/d
, m
illi
on g
allo
ns p
er d
ay;
°C,
degr
ees
Cel
sius
; uS
/cm
, m
icro
siem
ens
per
cent
imet
er;
mg/
L,
mill
igra
ms
per
liter
; --
, no
t av
aila
ble,
not
app
licab
le,
or n
o sa
mpl
e; a
ltitu
des
esti
mat
ed f
rom
198
3 U
SGS
1 :24
,000
-sca
le t
opog
raph
ic m
aps
(Hai
ku a
nd P
aia
quad
rang
les)
; da
tum
is
mea
n se
a le
vel;
<, l
ess
than
]
Sta
tion
num
ber
Kui
aha
1.2
Kui
aha
8
Kui
aha
9
Kui
aha
10
Kui
aha
1 1
Kui
aha
12
Kui
aha
13.1
Kui
aha
13.2
Kui
aha
14
Kui
aha
15
Kui
aha
16.1
Kui
aha
16.2
Kui
aha
17
Kui
aha
18
Kui
aha
19
Kui
aha
20
Kui
aha
21
Kui
aha
22
Kui
aha
23
Kui
aha
24
Kui
aha
25
Kui
aha
26
Kui
aha
27
Kui
aha
28
Kau
paku
lua
1
Kau
paku
lua
2
Kau
paku
lua
3
Kau
paku
lua
4
Str
eam
nam
e
Lili
koi
Gul
ch
Lili
koi
Gul
ch
Lili
koi
Gul
ch
Lili
koi
Gul
ch
Lili
koi
Gul
ch
Lili
koi
Gul
ch
Pauw
ela
Gul
ch
Pauw
ela
Gul
ch
Pauw
ela
Gul
ch
Pauw
ela
Gul
ch
Pauw
ela
Gul
ch
Pauw
ela
Gul
ch
Pauw
ela
Gul
ch
Pauw
ela
Gul
ch
Ohi
a G
ulch
Ohi
a G
ulch
Ohi
a G
ulch
Ohi
a G
ulch
Ohi
a G
ulch
Ohi
a G
ulch
Kap
uaah
oohu
i G
ulch
Kap
uaah
oohu
i G
ulch
Kal
uanu
i di
tch
Hul
uhul
unui
Gul
ch
Kau
paku
lua
Gul
ch
Kau
paku
lua
Gul
ch
Kau
paku
lua
Gul
ch
Kau
paku
lua
Gul
ch
Alti
tude
(ft) 38
0
490
530
930
960
1,40
0
300
330
375
475
560
560
840
960
240
400
490
575
930
960
1,26
0
1,42
0
1,52
0
1,14
0 5
340
350
480
Dat
e
10/2
9/97
.
10/2
9/97
10/2
9/97
10/2
9/97
10/2
9/97
10/2
8/97
10/2
8/97
10/2
8/97
10/2
8/97
10/2
8/97
10/2
8/97
10/2
8/97
10/2
8/97
10/2
8/97
10/2
9/97
10/2
8/97
10/2
8/97
10/2
8/97
10/2
8/97
10/2
8/97
10/2
8/97
10/2
8/97
10/2
8/97
10/2
8/97
11/1
7/97
11/1
7/97
11/1
7/97
11/1
7/97
Flow
(Mga
l/d)
0.09
0 0.10
0.01
0.17
0 0.01
0.02
a
0.26
0.25
0.04
0.21
0 0 0 0 0 0.10
0.01 1.34
1.29
0 1.20
0 0 0
0.06
-0.0
73
0
Typ
e of
st
ream
flow
upst
ream
of
site
gain
ing
dive
rsio
n
gain
ing
dive
rsio
n
gain
ing
dry
losi
ng
dive
rsio
n
gain
ing
gain
ing
dive
rsio
n
gain
ing
dry
dry
dry
dry
dive
rsio
n
gain
ing
dive
rsio
n
gain
ing
gain
ing
dry - dry
dry
dive
rsio
n
gain
ing
dive
rsio
n
Wat
erte
mpe
ratu
re(°
C)
23.8 -- 20.9 20.5 22.4
22.9
22.9
22.2
22.2 -- -- -- -- -- 22.2 23.5
20.5 -- 19.7 - 21.2 -- 21.8 -
Wat
er s
peci
fic
Chl
orid
eco
nduc
tanc
e(u
S/cm
)
147 -- 84
140 -
188
175
167
159
135 -- -- -- -- --
135 87 89.3
-- 81 -- 53 -
129
conc
entr
atio
n(m
g/L)
20 - 11 20 -- -- 24 23 23-
- -- -- - -- 22 12 12*
11 -- 8 - 21
Com
men
ts
all w
ater
div
erte
d by
Low
rie
Ditc
h
mos
t wat
er d
iver
ted
by K
auhi
koa
Ditc
h
mos
t w
ater
div
erte
d by
Hai
ku D
itch
wat
er d
iver
ted
from
Ohi
a G
ulch
incl
udes
wat
er d
iver
ted
from
Ohi
aG
ulch
all
wat
er d
iver
ted
to P
auw
ela
Gul
ch
mos
t wat
er d
iver
ted
by K
auhi
koa
Ditc
h
wat
er a
dded
to
stre
am
pool
with
no
flow
all w
ater
div
erte
d by
Hai
ku D
itch
all w
ater
div
erte
d by
Low
rie
Ditc
h
Tab
le 3
. R
esul
ts o
f m
easu
rem
ents
in s
elec
ted
stre
ams,
Hai
ku s
tudy
are
a, e
ast
Mau
i, H
aw
aii-
Co
ntin
ue
d[f
t, fe
et;
Mga
l/d, m
illio
n ga
llons
per
day
; °C
, deg
rees
Cel
sius
; uS
/cm
, m
icro
siem
ens
per c
entim
eter
; m
g/L
, mill
igra
ms
per
liter
; , n
ot a
vaila
ble,
not
app
licab
le, o
r no
sam
ple;
alti
tude
s es
timat
ed f
rom
198
3U
SGS
1:24
,000
-sca
le t
opog
raph
ic m
aps
(Hai
ku a
nd P
aia
quad
rang
les)
; dat
um is
mea
n se
a le
vel;
<, le
ss th
an]
Stat
ion
num
ber
Kau
paku
lua
5
Kau
paku
lua
5.1
Kau
paku
lua
6
Kau
paku
lua
7
Kau
paku
lua
7.1
Kau
paku
lua
8
Kau
paku
lua
9
Kau
paku
lua
9.1
Kau
paku
lua
10
Kau
paku
lua
10.1
Kau
paku
lua
1 1
Kau
paku
lua
11.1
Kau
paku
lua
11.2
Kau
paku
lua
12
Kau
paku
lua
13
Kau
paku
lua
14
Kau
paku
lua
15
Kau
paku
lua
15.1
Stre
am n
ame
Qpa
epila
u G
ulch
unna
med
tri
buta
ry
unna
med
trib
utar
y
unna
med
tri
buta
ry
unna
med
trib
utar
y
Opa
epila
u G
ulch
Opa
epila
u G
ulch
Opa
epila
u G
ulch
Aw
alau
Gul
ch
unna
med
tri
buta
ry
Aw
alau
Gul
ch
Aw
alau
Gul
ch
Aw
alau
Gul
ch
Aw
alau
Gul
ch
Aw
alau
Gul
ch
Kal
akoh
i G
ulch
Kal
akoh
i G
ulch
Kal
akoh
i G
ulch
Alti
tude
(f
t) 630
630
1,01
0
1,01
5
1,18
0
790
1,03
0
940
1,23
0
1,42
0
1,78
0
1,78
0
1,70
0
2,03
0
2,25
0
1,40
0
1,03
0
1,02
0
Dat
e
11/1
7/97
11/1
7/97
11/1
7/97
11/1
7/97
11/1
8/97
11/1
7/97
11/1
8/97
11/1
8/97
11/1
7/97
11/1
8/97
11/1
8/97
11/1
8/97
11/1
8/97
11/1
8/97
11/1
8/97
11/1
8/97
11/1
8/97
11/1
8/97
Flow
(M
gal/d
)
0.05
a
0 0 0.11
- 0 0 0.08
0 0.02
1.85
0.02
0.05
2.06
1.31
0.26
0.0
la
0
Type
of
stre
amfl
ow
upst
ream
of
site
gain
ing
dry
dive
rsio
n
gain
ing
dry
losi
ng
dry
gain
ing
losi
ng
dry
losi
ng
dive
rsio
n
gain
ing
gain
ing
dive
rsio
n
gain
ing
losi
ng
dive
rsio
n
Wat
er
tem
pera
ture
(°
C)
21.1 --
Wat
er s
peci
fic
cond
ucta
nce
(uS/
cm)
63 --
Chl
orid
e co
ncen
trat
ion
(mg/
L)
10 --
Com
men
ts
all
wat
er d
iver
ted
by K
auhi
koa
Ditc
h
20.9
21.2 - - 20.1 -- 20.2
17.6
18.9
18.8
18.5
18.3
18.9 --
81 129 -- -- 93 -- 75 54 68 81 54 47 60 --
-- 18 -- -- -- -- - 7 - 7 7 11 --
Sant
os S
prin
g
Aw
alau
Spr
ing
at 9
40 f
t
Aw
alau
Spr
ing
at 1
,420
ft
min
or le
akag
e pa
st d
iver
sion
st
ream
bed
seep
age
Aw
alau
Spr
ing
at 1
,700
ft
plus
som
e w
ater
add
ed to
str
eam
fro
m
Opa
na T
unne
l
all w
ater
div
erte
d by
Kau
hiko
a D
itch
a E
stim
ated
flo
w
b C
hlor
ide
sam
ple
colle
cted
Oct
ober
29,
199
7
X
Q.
O^
O
(Q

soil layer at the contact between the Honomanu Basalt and the Kula Volcanics. The springs at higher altitudes issue from between layers of the Kula Volcanics. At all of the springs located above 100 ft in altitude, flow was observed to continue downstream for a few tens of feet to about 1,000 ft before seeping into the floor of the gulch. The site where perennial flow in Waiohiwi Gulch begins was not visited but no flow was observed at about 4,200 ft altitude. Perennial flow stops at about 2,080 ft (Maliko 10) where all the flow sinks into the valley bottom upstream of Waiohiwi Falls (Maliko 9.3 on figure 9).
The total measured discharge below 2,000 ft altitude in the Maliko Gulch drainage system is about 0.4 Mgal/d, nearly all of which issues from the Kula Volcanics (site Maliko 1 through Maliko 9.3, table 3). Because much of the measured discharge in the gulch eventually seeps back into the ground, this value is possibly an overestimate of the total amount of ground- water discharge because the same flow may be reap pearing farther downstream.
Kuiaha Gulch
The next important drainage system to the east of Maliko Gulch is the Kuiaha Gulch drainage system. Kuiaha Gulch splits into three gulches at about 200 ft altitude Lilikoi Gulch to the west, Pauwela Gulch in the middle, and to the east, the longest and deepest, Ohia Gulch, which splits into Kapuahoohui and Hulu- hulunui Gulches (fig. 1). Huluhulunui Gulch can be traced to a maximum altitude of about 2,000 ft on the 1983 USGS l:24,000-scale topographic map (Haiku quadrangle). The Kuiaha Gulch system is incised as much as 180 ft below the upland surface and the valley bottoms are eroded only into the Kula Volcanics.
The Kuiaha system is usually dry from sea level to an altitude of about 300 ft in Lilikoi and Pauwela Gulches (fig. 9). At altitudes of about 300, 480, and 1,000 ft respectively, the Haiku, Lowrie, and Kauhikoa Ditches, cross Lilikoi Gulch and remove nearly all base flow gained between the ditches (table 3). Stream mea surements made during October 28-29,1997 show that sections of the stream in Lilikoi Gulch gained about 0.5 Mgal/d between 1,400 ft and 310 ft altitude. The most substantial gain was measured where a landowner pointed out a 1,000-ft long section of the stream between sites Kuiaha 7.1 and Kuiaha 7.2 that gained water noticeably throughout the year.
Pauwela Gulch, the shortest branch of the Kuiaha Gulch system, is intersected by two surface-water diversion systems. Haiku Ditch, at about 330 ft, inter cepts almost all base flow, and a tunnel which diverts water from Ohia Gulch at about 540 ft adds water to Pauwela Gulch. Lowrie Ditch does not intercept any flow in Pauwela Gulch. The amount of streamflow gain measured in Pauwela Gulch on October 28, 1997 was about 0.2 Mgal/d between 840 and 375 ft altitude. The small amount of flow in the gulch bypassing the Haiku Ditch was observed to seep into the floor of the gulch within about 600 ft downstream of the diversion.
Ohia Gulch is usually dry downstream of about 520 ft altitude where a tunnel diverts all base flow to Pauwela Gulch. Upstream of this tunnel to about 1,400 ft altitude the stream gained about 0.2 Mgal/d on Octo ber 28,1997. Upstream of Kauhikoa Ditch, the gulch carries water put into the stream at an altitude of about 1,430 ft from the Kaluanui Ditch but also gained nearly 0.1 Mgal/d on the day of measurement.
The total amount of ground-water discharge mea sured in the Kuiaha Gulch drainage system is about 1.0 Mgal/d, all of which is discharged from the Kula Volcanics.
Kaupakulua Gulch
The Kaupakulua Gulch drainage system (fig. 1) lies to the east of the Kuiaha Gulch drainage system and the geomorphology of the systems is similar. Base flow is taken from the Kaupakulua Gulch system by surface- water diversion systems at about 350 ft, 550 ft, ,1,000 ft, and 1,800 ft altitude, and the gulch carries excess water from the Opana Tunnel for a distance of about 7,000 ft between about 2,400 and 1,800 ft altitude. Kaupakulua Gulch is usually dry from the ocean upstream to about 350 ft altitude where the Haiku Ditch takes all of the base flow of the stream. On November 17, 1997, base flow at an altitude of 350 ft (Kaupakulua 3) was about 0.06 Mgal/d, all of which was gained in a section of the stream below an altitude of 480 ft (Kaupakulua 4) (table 3). At about 640 ft altitude, upstream of the Kaupakulua Reservoir, the gulch splits into two branches, the west branch is unnamed and the east branch is the Opaepilau Gulch, which splits into the Awalau and Kalakohi Gulches farther upstream. Flow in the unnamed tribu tary, which originates from a spring at an altitude of about 1,180 ft (Kaupakulua 7.1), was 0.11 Mgal/d and all of the flow was diverted to the Kauhikoa Ditch. This
20 Ground Water and Surface Water in the Haiku Area, East Maui, Hawaii
tributary was dry downstream between this diversion and the intersection with Opaepilau Gulch. In both Awalau and Kalakohi Gulches, the stream has gaining, losing, and dry reaches at altitudes between 2,400 ft (Kaupakulua 13) and 630 ft (Kaupakulua 5.1) (fig. 9). The highest seepage rates measured during the study were for the reach between 2,250 and 2,030 ft altitude in Awalau Gulch where the stream gained about 0.75 Mgal/d over a 3,000-ft long section.
Ground-water discharge measured in the Kaupa kulua Gulch system totaled about 1.4 Mgal/d. Because this system had both gaining and losing reaches, the total discharge estimate possibly includes ground water that discharged in more than one place along the stream channel.
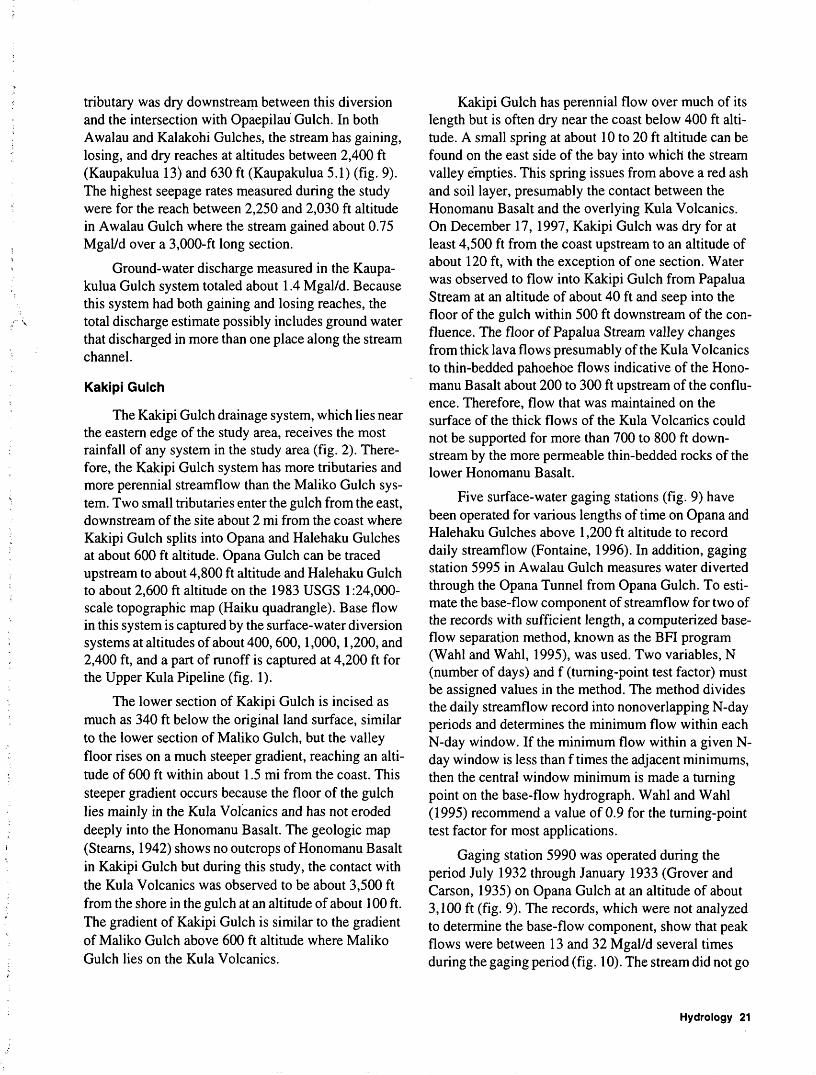
Kakipi Gulch
The Kakipi Gulch drainage system, which lies near the eastern edge of the study area, receives the most rainfall of any system in the study area (fig. 2). There fore, the Kakipi Gulch system has more tributaries and more perennial streamflow than the Maliko Gulch sys tem. Two small tributaries enter the gulch from the east, downstream of the site about 2 mi from the coast where Kakipi Gulch splits into Opana and Halehaku Gulches at about 600 ft altitude. Opana Gulch can be traced upstream to about 4,800 ft altitude and Halehaku Gulch to about 2,600 ft altitude on the 1983 USGS 1:24,000- scale topographic map (Haiku quadrangle). Base flow in this system is captured by the surface-water diversion systems at altitudes of about 400,600,1,000,1,200, and 2,400 ft, and a part of runoff is captured at 4,200 ft for the Upper Kula Pipeline (fig. 1).
The lower section of Kakipi Gulch is incised as much as 340 ft below the original land surface, similar to the lower section of Maliko Gulch, but the valley floor rises on a much steeper gradient, reaching an alti tude of 600 ft within about 1.5 mi from the coast. This steeper gradient occurs because the floor of the gulch lies mainly in the Kula Volcanics and has not eroded deeply into the Honomanu Basalt. The geologic map (Stearns, 1942) shows no outcrops of Honomanu Basalt in Kakipi Gulch but during this study, the contact with the Kula Volcanics was observed to be about 3,500 ft from the shore in the gulch at an altitude of about 100 ft. The gradient of Kakipi Gulch is similar to the gradient of Maliko Gulch above 600 ft altitude where Maliko Gulch lies on the Kula Volcanics.
Kakipi Gulch has perennial flow over much of its length but is often dry near the coast below 400 ft alti tude. A small spring at about 10 to 20 ft altitude can be found on the east side of the bay into which the stream valley empties. This spring issues from above a red ash and soil layer, presumably the contact between the Honomanu Basalt and the overlying Kula Volcanics. On December 17, 1997, Kakipi Gulch was dry for at least 4,500 ft from the coast upstream to an altitude of about 120 ft, with the exception of one section. Water was observed to flow into Kakipi Gulch from Papalua Stream at an altitude of about 40 ft and seep into the floor of the gulch within 500 ft downstream of the con fluence. The floor of Papalua Stream valley changes from thick lava flows presumably of the Kula Volcanics to thin-bedded pahoehoe flows indicative of the Hono manu Basalt about 200 to 300 ft upstream of the conflu ence. Therefore, flow that was maintained on the surface of the thick flows of the Kula Volcanics could not be supported for more than 700 to 800 ft down stream by the more permeable thin-bedded rocks of the lower Honomanu Basalt.
Five surface-water gaging stations (fig. 9) have been operated for various lengths of time on Opana and Halehaku Gulches above 1,200 ft altitude to record daily streamflow (Fontaine, 1996). In addition, gaging station 5995 in Awalau Gulch measures water diverted through the Opana Tunnel from Opana Gulch. To esti mate the base-flow component of streamflow for two of the records with sufficient length, a computerized base- flow separation method, known as the BFI program (Wahl and Wahl, 1995), was used. Two variables, N (number of days) and f (turning-point test factor) must be assigned values in the method. The method divides the daily streamflow record into nonoverlapping N-day periods and determines the minimum flow within each N-day window. If the minimum flow within a given N- day window is less than f times the adjacent minimums, then the central window minimum is made a turning point on the base-flow hydrograph. Wahl and Wahl (1995) recommend a value of 0.9 for the turning-point test factor for most applications.
Gaging station 5990 was operated during the period July 1932 through January 1933 (Grover and Carson, 1935) on Opana Gulch at an altitude of about 3,100 ft (fig. 9). The records, which were not analyzed to determine the base-flow component, show that peak flows were between 13 and 32 Mgal/d several times during the gaging period (fig. 10). The stream did not go
Hydrology 21
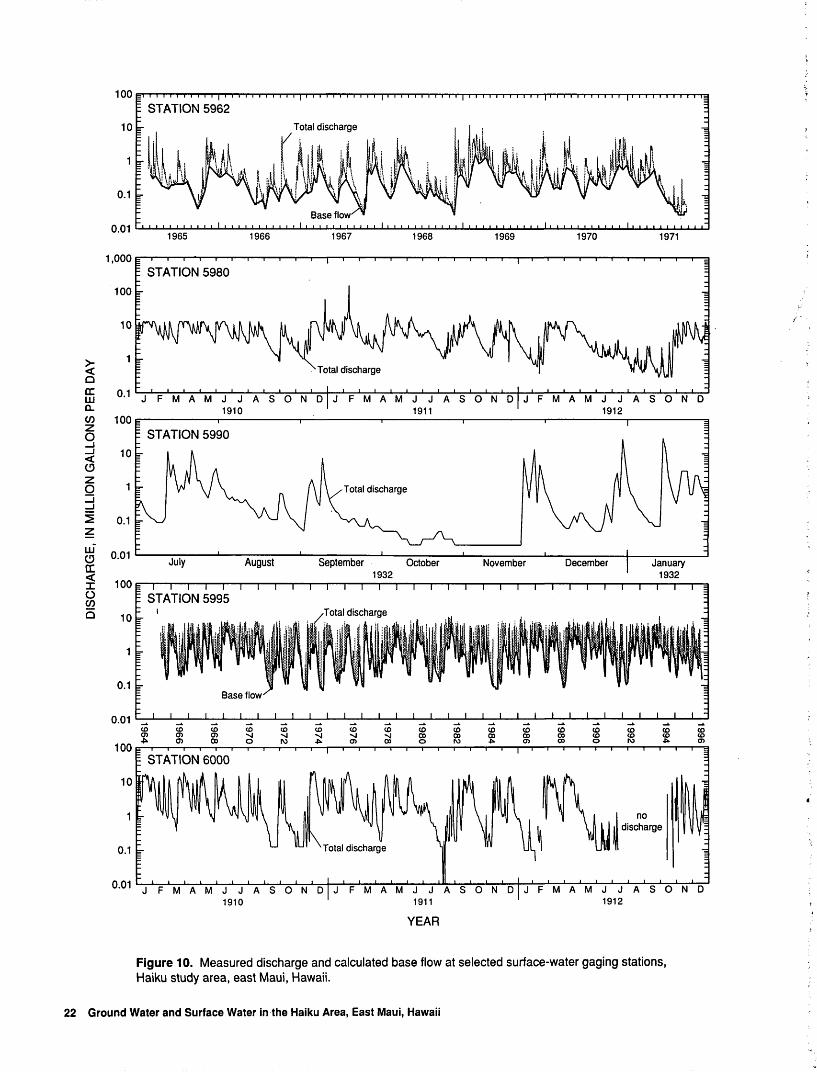
E STATION 5962Total discharge
100
10
1
0.1
0.01
1,000
100
10
> 1Q
£ °' 1 JFMAMJJASONDJFMAMJJASONDJFMAMJ JASOND °- 1910 1911 1912
1965 1966 1967 1968 1969 1970 1971
E STATION 5980
"Total discharge
100
10
0.1
0.01
<
ZO
zUJ
E STATION 5990
July August September October November December January1932 1932
± 100 F i i i i i i i i i i i i i i i i i i i i i i i i i i i iE STATION 5995
- i i i i i : i i i i i i i i i i i i i i i i i i i iCOCO(OCOCOCO(OCOCOCO(O(OCO
co o roo> oo o to
STATION 6000
J FMAMJ JASOND0.01 JFMAMJJASOND 1910
JFMAMJ JASOND 1912
Figure 10. Measured discharge and calculated base flow at selected surface-water gaging stations, Haiku study area, east Maui, Hawaii.
22 Ground Water and Surface Water in the Haiku Area, East Maui, Hawaii

dry at the gaging station during the gaging period, which was one of above average rainfall (fig. 3). Further downstream at an altitude of about 2,400 ft, gaging station 5995 has recorded the amount of water diverted from the gulch through the Opana Tunnel and into a local domestic water-distribution system (fig. 1). The gaging station record covers the period from 1965 to the present and shows all but the peak flows that bypass the diversion to the Opana Tunnel (fig. 1). During the period 1966 to 1996, estimated base flow at gaging sta tion 5995 averaged 1.1 Mgal/d and yearly averages ranged from 0.3 Mgal/d in 1981 to 2.3 Mgal/d in 1969. The stream did not go dry any time during the period of record indicating that ground water was probably con tinuously discharging to the stream upstream of the gag ing station.
Gaging station 6000, at an altitude of about 1,200 ft (fig. 9), recorded the amount of diversion of all low and medium flows from Opana Gulch to the New Hamakua/Kauhikoa Ditch from 1910 to 1912 (Martin and Pierce, 1913; Pierce and Larrison, 1914). Gaging station 6010, located at least 400 ft downstream of the diversion was reported to record only flood flows that bypassed the diversion but the records of gage height indicate that there was almost always flow at the gaging station, even when the channel at gaging station 6000 was reported dry (Pierce and Larrison, 1914, p. 196). Therefore, either the diversion did not divert all of the water, even at low flow conditions, or Opana Gulch was gaining water between the diversion and gaging station 6010. The site descriptions and data are insufficient to determine which possibility was most likely.
On Halehaku Gulch, two surface-water gaging stations were operated, one at 2,340 ft altitude (gaging station 5962) and one at about 1,200 ft altitude (gaging station 5980) (fig. 9). Estimated base flow at gaging sta tion 5962 during the period 1966 to 1971 averaged 0.3 Mgal/d and yearly averages ranged from 0.2 to 0.5 Mgal/d (fig. 10). The stream did not go dry during the 7-year period of record. Flow was also continuous at the lower gaging station for the period 1910 to 1912 but the record was not sufficient for analysis using the BFI pro gram (fig. 10). Total flow at the lower gaging station ranged from 0.3 to 13 Mgal/d, the upper limit of the recording instrumentation at the gaging station (Martin and Pierce, 1913).
Ground-Water Levels
Ground-water flow rates and directions are diffi cult to measure directly, and are usually inferred from water levels. Changes in ground-water levels can also be indicators of changes in recharge or withdrawals from the ground-water system, and can be an indicator of freshwater-lens thickness.
Spatial Distribution
Water levels from wells in and around the study area have been separated into two groups, one contain ing water levels measured in wells that did not penetrate to sea level at the time of measurement and one contain ing water levels measured in wells that are open to the aquifer at or below sea level (table 4). Water levels mea sured during drilling in seven wells (5320-01,5414-01, 5420-01, 5420-02, 5514-01, 5518-03, and 5519-01) which eventually penetrated below sea level are included in the first group because the base of each well was above sea level at the time of measurement. Water levels measured in these same wells after their comple tion below sea level are included in the second group. Two water-level maps were constructed on the basis of the water-level information, one for the wells above sea level (fig. 11) and one for the wells at or below sea level (fig. 12). Because these water levels were measured over several decades, short-term variations caused by factors such as ground-water development, irrigation, or reservoir seepage cannot be adequately identified. The short-term effects are probably localized and small because ground-water withdrawal is limited and land use has been relatively stable for decades; thus, although the water-level maps do not represent any instant in time, they provide a view of the region gener alized over time. In addition to the well data, the alti tudes of springs and gaining sections of streams were used to construct the water-level map of the Kula Vol- canics upper rock unit. These areas of ground-water dis charge indicate places where the upper water table intersects the ground surface.
The upper water-level surface generally mimics topography but an abrupt increase in water levels from west to east across Maliko Gulch, the western boundary of the assumed dike complex, is apparent. In the middle of the study area, the water table rises away from the coastline with a slope of about 340 ft/mi. Farther to the east, the water-table gradient is steeper (about 500
Hydrology 23

O ound
Watei 0) a 1 o (D Q> 5 3 (D X B> 5? c <3 m D) 52. D) E. X 0) n>
Tab
le 4
. C
hlor
ide-
conc
entr
atio
n da
ta a
nd w
ater
-lev
el i
nfor
mat
ion
used
to c
onst
ruct
gen
eral
ized
wat
er-t
able
map
s, H
aiku
are
a, e
ast
Mau
i, H
awai
i[f
t, fe
et;
mg/
L, m
illig
ram
s pe
r lit
er; , n
ot a
vaila
ble;
na,
not
app
licab
le;
all
wel
l in
form
atio
n is
fro
m u
npub
lishe
d da
ta, U
SGS,
Haw
aii
Dis
tric
t wel
l fil
es u
nles
s ot
herw
ise
note
d. D
atum
is m
ean
sea
leve
l; ch
lori
de m
easu
rem
ents
mad
e af
ter
wel
l w
as c
ompl
eted
]
Wel
l op
en a
bove
sea
leve
l
Alti
tude
of
top
of o
pen
Stat
e w
ell
num
ber
6-50
21-0
16-
5318
-01
6-53
19-0
16-
5320
-01
6-53
21-0
1
6-53
23-0
1
6-54
13-0
1
6-54
13-0
8
6-54
13-0
96-
5414
-01
6-54
19-0
16-
5420
-01
6-54
20-0
2
6-54
22-0
1
6-54
22-0
26-
5424
-01
6-55
13-0
1
6-55
14-0
1
6-55
15-0
1
6-55
15-0
2
6-55
16-0
16-
5518
-03
6-55
19-0
1
6-55
19-0
2
6-55
19-0
3
Wel
l nam
e
Puka
lani
Ter
race
Kul
amal
uK
awai
koa
tunn
el*3
Ham
akua
poko
2
Keh
ekaP
IS
Paia
2H
uelo
1
Low
en
Hag
arH
ipp
Hai
ku
Mau
i H
igh
Scho
ol
Ham
akua
poko
1
Paia
13
Paia
17
Spre
ckel
svill
e 1
Tava
res
Mar
quar
d
Peah
i G
ushe
r
Wils
on
Feeh
an 1
T118
Pauw
ela
Beh
nke
Bal
dwin
Man
or
inte
rval
(ft) --
1,21
7 na 780
390
373 --
547 --
349
780 -- -- --
138
134
408
134
3208 436
364
360
Alti
tude
of
bot
tom
of o
pen
inte
rval
(ft) -
1,20
5 na 479 __ ~
230
358 ~
507 -
148
378 ~ - ~ 79 9
200
130
185 81 5
132
Wat
er-
leve
l(ft
) -
1,20
51,
000C
483d .. ~
410
378
507 --
<148 37
8 - - -
233 87 270
130
252
373
228
210
Wel
l ope
n at
or
belo
w s
ea le
vel
Alti
tude
of
Dat
e of
to
p of
ope
nw
ater
-lev
elm
easu
rem
ent
~
9/97
ana
1992
a..
2/7/
79
6/18
/97
5/97
a.. na
a
naa - ~ ~
12/8
6
7/9/
90a
4/73
1996
a
12/8
93/
2/48
a4/
10/6
73
2/74
inte
rval
(ft)
1,03
3 99 na 0 12 8 na na 222
387 -1 -1 - 10 13 - na -41 na 134 na 436 3 na 6
Alti
tude
of
bot
tom
of o
pen
inte
rval
(ft)
-43
-128 na -3
2 -6 -8 na na -33
-42
-43
-22
-34 -4 -2 - na -61 na -55 na -24
-34 na -34
Wat
er-
leve
l(ft
)
8 12.2
na 4.7
6.2e
3.9e
na na - 4.9
3.4
3.9
3.8e
4.0e
3.5e
na 15 na -- na 17h 5.
4
na 5
Dat
e of
wat
er-l
evel
mea
sure
men
t
4/4/
725/
17/9
8
na1/
19/9
3
12/5
/70
12/5
/70
na na ~ -
4/79
-12/
94f
6/1/
64
11/1
2/95
12/5
/70
12/5
/70
12/5
/70
na
7/13
/90
na -- na3/
11/4
8
12/7
0-5/
86na
11/2
2/86
Chl
orid
eco
ncen
trat
ion
(mg/
L)
550 11 _ 49 .. ~ _ 20 200
120 60 81 55 -- -- - 96 72 --
200
120 --
156
Dat
e of
chlo
ride
-co
ncen
trat
ion
sam
ple
8/5/
866/
2/98 ..
11/1
8/92
- _
6/18
/97
6/20
/97
6/6/
97
5/29
/79
4/11
/66
4/6/
92 ~ -- -
9/5/
96
9/6/
96 ~
10/3
0/96
~
5/11
/67
~
11/2
5/86

Tab
le 4
. C
hlor
ide-
conc
entr
atio
n da
ta a
nd w
ater
-leve
l in
form
atio
n us
ed t
o co
nstr
uct
gene
raliz
ed w
ater
-tab
le m
aps,
Hai
ku a
rea,
eas
t M
aui,
Ha
wa
ii-C
on
tinu
ed
[ft,
feet
; m
g/L
, mill
igra
ms
per
liter
; --
, not
ava
ilabl
e; n
a, n
ot a
pplic
able
; al
l w
ell
info
rmat
ion
is f
rom
unp
ublis
hed
data
, USG
S, H
awai
i D
istr
ict w
ell
files
unl
ess
othe
rwis
e no
ted.
Dat
um is
mea
n se
a le
vel;
chlo
ride
mea
sure
men
ts m
ade
afte
r w
ell
was
com
plet
ed]
Wel
l ope
n ab
ove
sea
leve
l
Sta
te w
ell
num
ber
6-55
20-0
1
6-55
22-0
1
6-56
15-0
2
6-56
20-0
1
Wel
l na
me
HC
&S
1 1
A,B
Kua
u 12
Phi
llips
Mal
iko
tun
nelb
Alti
tude
of
top
of o
pen
inte
rval
(ft) - --
142 na
Alti
tude
of b
otto
mof
ope
nin
terv
al(f
t) - - 45 na
Wat
er-
leve
l(f
t)
- -- 45 50C
Dat
e of
wat
er-le
vel
mea
sure
men
t
~ --
1995
a
na
Wel
l op
en a
t or
bel
ow s
ea l
evel
Alti
tude
of
top
of o
pen
inte
rval
(ft) 50 15 45 na
Alti
tude
of b
otto
mof
ope
nin
terv
al(f
t)
-93 -5 -85 na
Wat
er-
leve
l(f
t) 3.2e
-f
4.0e
- na
Dat
e of
wat
er-le
vel
mea
sure
men
t
7/46
-12/
53
12/5
/70
- na
Chl
orid
eco
ncen
trat
ion
(mg/
L)
270-
1,66
8 -
180 19
Dat
e of
chlo
ride
-co
ncen
trat
ion
sam
ple
1925
-96
-
10/5
/95
9/6/
96
a M
easu
red
duri
ng d
rilli
ng;
Aus
tin, T
suts
umi
and
Ass
ocia
tes,
Inc
. (1
998)
b St
earn
s an
d M
acdo
nald
(19
42)
c A
ltitu
de o
f tun
nel
Dep
th b
elow
low
est
men
tion
of "
no w
ater
" in
dri
llers
log
e M
aui-
type
sha
ft (
infi
ltrat
ion
galle
ry)
at s
ea le
vel
f A
rith
met
ic m
ean
of a
vaila
ble
data
dur
ing
the
indi
cate
d tim
e pe
riod
g E
stim
ated
fro
m 1
983
USG
S 1:
24,0
00-s
cale
topo
grap
hic
map
(H
aiku
qua
dran
gle)
h
Val
ue n
oted
as
ques
tiona
ble
in r
ecor
ds
a
o.
o

20j55'
20j50'
156j20' 156j15'
PACIFIC OCEAN
Base modified from U.S. Geological Survey digital data, 1:24,000,1983, Albers equal area projection, standard parallels 20|39'30" and 20j57'30", central meridian156 i 20' 15" EXPLANATION
400 WATER-TABLE CONTOUR--Shows altitude of watertable 1948-97. Interval 200 feet. Dashed where approximate. Datum is mean sea level
1,000.
840.
WELL AND WATER LEVEL, IN FEET ABOVE MEAN SEA LEVEL
Pacific Ocean
SPRING AND ALTITUDE, IN FEET ABOVE MEAN SEA LEVEL
_.._.._ STTjDY-AREA BASIN BOUNDARY
1000 TOPOGRAPHIC CONTOUR-Interval 1,000 feet
Figure 11. Generalized water table for selected wells completed above sea level and for springs, 1948-97, Haiku study area, east Maui, Hawaii.
26 Ground Water and Surface Water in the Haiku Area, East Maui, Hawaii
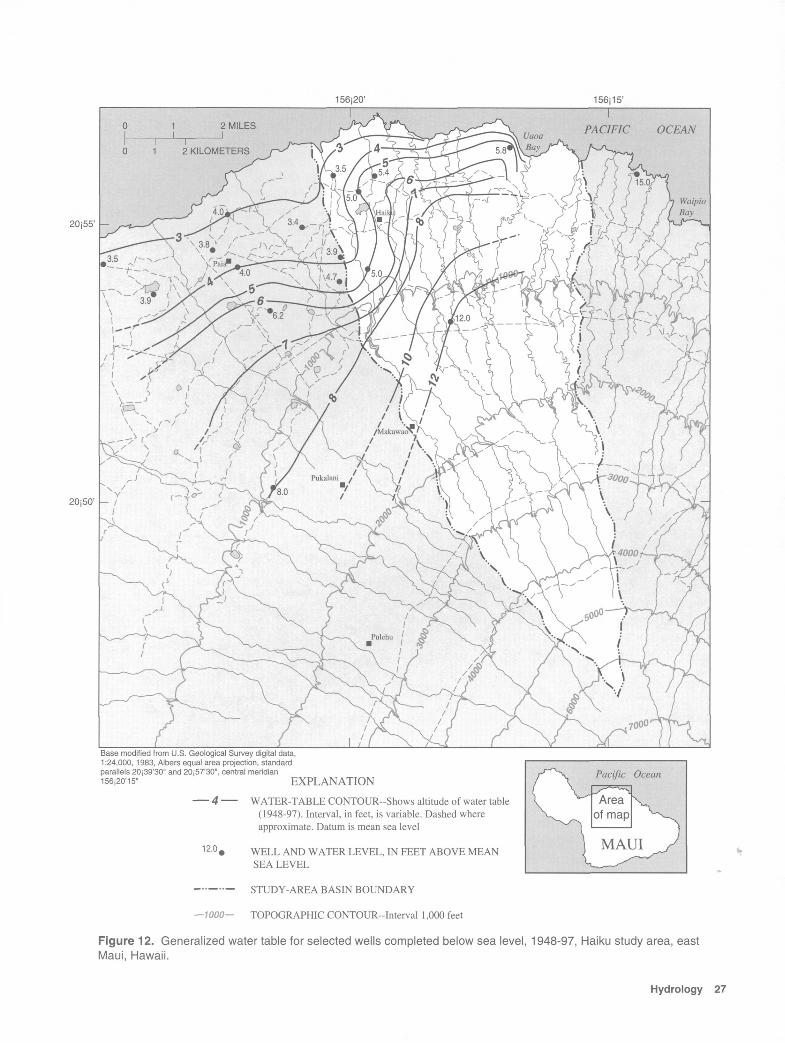
156j20'
20j55'
20j50'
156j15'
PACIFIC OCEAN
Base modified from U.S. Geological Survey digital data, 1:24,000, 1983, Albers equal area projection, standard parallels 20j39'30" and 20i57'30", central meridianI56i20'is" EXPLANATION
4 WATER-TABLE CONTOUR-Shows altitude of water table (1948-97). Interval, in feet, is variable. Dashed where approximate. Datum is mean sea level
12.0 WELL AND WATER LEVEL, IN FEET ABOVE MEAN SEA LEVEL
Pacific Ocean
STUDY-AREA BASIN BOUNDARY
WOO TOPOGRAPHIC CONTOUR-Interval 1,000 feet
Figure 12. Generalized water table for selected wells completed below sea level, 1948-97, Haiku study area, east Maui, Hawaii.
Hydrology 27

ft/mi) which may be attributed to higher recharge and/or lower permeability of the aquifer.
The water-level map for the lower rock units shows a surface that has a much flatter water-level gra dient throughout the study area but still includes the rise in water levels across the western boundary of the dike complex. In the Haiku area, the gradient of the lower water-level surface is about 3 ft/mi away from the coast line within the dike complex. To the west of Maliko Gulch, the slope of the'water-level surface is about 1 to 2 ft/mi. Farther to the east, the water-level data are sparse but indicate that the gradient of the lower surface is much steeper than 3 ft/mi.
Temporal Variation
At most wells, only single water-level measure ments are available. At three wells, water-level mea surements are available over several-year periods (fig. 7). Water levels in well 5520-01 were collected occa sionally during 1946-53, sometimes when water was being withdrawn. Water levels measured during pump operation were about 2 ft lower than water levels mea sured when the pump was off. During July 19-24,1946, total tidal fluctuations in the well were about 0.2 to 0.4 ft. Occasional water-level measurements were made in well 5519-01 during 1970-86 and in well 5419-01 dur ing 1979-95. The water level in both wells appear to mimic the rainfall variations recorded at rain gage 338. The highest measured water levels in well 5519-01 were during 1980-83, a period when the two wettest years (1980 and 1982) were recorded at the rain gage. Water levels in well 5419-01 show a similar rise in response to the two above-average rainfall years of 1989 and 1990.
Chloride Concentration
Chloride concentration is used as an indicator of saltwater intrusion into the ground-water system. The only long-term record of chloride concentration avail able is for well 5520-01 in Maliko Gulch (fig. 7 and table 4). Between 1925 and 1996, chloride concentra tion ranged from 270 to 1,668 mg/L. The fluctuation in concentration appears to have been caused by changes in the amount of water withdrawal from the well. Gen erally, greater withdrawal from a well in a coastal aqui fer will cause an increase in the chloride concentration of the pumped water as more saline water is induced to
flow towards the well. Much of the chloride-concentra tion data is reported annually with no indication if the value represents a single sample at the end of the year or a composite of more than one sample collected throughout the year. In most cases, the value probably represents the chloride concentration as the well is being pumped. Overall, the existing data do not indicate any significant long-term change in chloride concentra tion. Chloride-concentration values from other wells in or east of the Haiku study area that penetrate to below sea level range from 49 to 200 mg/L (table 4). The high est concentrations were in samples from wells located nearest the coast where the freshwater lens is thinnest. All of the chloride concentrations are from samples col lected after each well was completed. Water from well 5021-01, west of the study area, has an unexplained high chloride concentration of 550 mg/L.
Chloride concentrations averaged about 20 mg/L in water from well 5413-08, which does not penetrate to sea level; from the Maliko Tunnel, and from streams consisting of only base flow (tables 3 and 4). For com parison, the chloride concentration of rainfall is typi cally less than 20 mg/L (Swain, 1973). One shallow well (5513-01) has a chloride concentration of 96 mg/L.
CONCEPTUAL MODEL OF GROUND- WATER OCCURRENCE AND MOVEMENT
Ground water is recharged by direct infiltration of rainfall over the entire study area. The area of greatest recharge (near 150 in/yr) lies between 2,000 and 6,000 ft altitude where rainfall and fog drip are greatest. Fresh ground water is found in two main forms: (1) as perched high-level water held up by relatively low-permeability geologic layers, and (2) as a freshwater lens floating on denser, underlying saltwater.
Perched High-Level Ground Water
The water levels measured in shallow wells and the presence of springs indicate that a water table lies sev eral tens of feet below the ground surface in the thick lava flows and interbedded soils of the Kula Volcanics. Where the ground surface is incised into the high-level water table, ground water discharges at springs or directly into streambeds. Conversely, streamflow infil trates into the aquifer in several places where a stream
28 Ground Water and Surface Water in the Haiku Area, East Maui, Hawaii

bottom lies above the high-level water table and is suf ficiently permeable. Perennial discharge of ground water to streams has been measured at altitudes greater than 2,400 ft in the Kakipi Gulch system. Total ground- water discharge from the Kula Volcanics to streams in the study area is about 3 to 6 Mgal/d, all of which is either removed from the streams by surface-water diversion systems or which infiltrates back into the ground. This ground-water discharge is only about 3 to 6 percent of the estimated recharge to the study area, therefore more than 90 percent of the recharge must flow downward to the freshwater lens. Because most ground-water flow is vertically downward through the perched high-level water body, ground-water heads should decrease with depth in the high-level water body but no water-level data exist to support this conclusion.
The high-level water-table surface mimics topog raphy and its location depends on the presence of the rocks of the Kula Volcanics. The base of the perched high-level water body is defined by the transition from the lower permeability Kula Volcanics and associated weathered soil and ash beds to the underlying higher permeability Honomanu Basalt. The thickness of the high-level water body is therefore controlled by the thickness of the Kula Volcanics, which is about 100 to 400 ft thick where exposed in the walls of Maliko Gulch (fig. 8).
Volcanic dikes, which commonly impound water because of their low permeability, do not appear to be a major factor in controlling the shape of the high-level water table below about 2,000 ft in the study area. Too few data exist from areas above this altitude to draw any conclusions about the presence or effect of volcanic dikes. Ground-water flow, from south to north, in the high-level water body appears to be mainly controlled by the layered nature of the aquifer. The presence of dikes appears to have little effect on ground-water flow. However, the high-level water-table map (fig. 11) indi cates that ground-water flow may be impeded more from east to west in a direction perpendicular to the pre ferred orientation of the dikes in the dike complex.
Freshwater Lens
Within the high-permeability rocks of the Hono manu Basalt, a lens of freshwater floats on denser underlying saltwater. The freshwater lens system is often referred to as "basal ground water" in Hawaii. The source of freshwater in the lens is ground-water
recharge from overlying high-level ground-water areas and infiltration of rainfall. It appears that more than 90 percent of the recharge reaching the high-level water body flows vertically through unsaturated rocks below the high-level water body to recharge the freshwater lens. Fresh ground water flows from inland recharge areas to the coast where it discharges at springs and by diffuse seepage at and below sea level. In coastal aqui fers, a saltwater-circulation system exists beneath the lens (Souza and Voss, 1987). Saltwater flows landward in the deeper parts of the aquifer, rises, and then mixes with seaward-flowing freshwater. This mixing creates a freshwater-saltwater transition zone. No wells in the study area penetrate the transition zone or underlying saltwater.
For hydrostatic conditions, the thickness of the freshwater lens can be estimated by the Ghyben- Herzberg principle. If the specific gravities of fresh water and saltwater are assumed to be 1.000 and 1.025, respectively, than the Ghyben-Herzberg principle pre dicts that every foot of freshwater above sea level must be balanced by 40 ft of freshwater below sea level. For dynamic conditions, the Ghyben-Herzberg principle tends to overestimate the freshwater lens thickness in the recharge zone and underestimate the freshwater lens thickness near the discharge zone.
Although the study area is in a dike complex where dike-impounded water is expected, water levels in the freshwater lens form a hydraulic gradient of about 3 ft/mi inland, which is in the range of 1 to 5 ft/mi found in coastal aquifers formed by flank lava flows on other Hawaiian islands (Stearns and Macdonald, 1946; Hunt, 1996). The hydraulic gradient immediately to the west of the dike complex in flank lava flows is about 1 to 2 ft/mi. Because the principal direction of ground-water flow is parallel to the dike complex, it appears that vol canic dikes are not numerous enough or oriented in such a way as to impound ground water to a significant extent. A low ground-water gradient has been observed in the East Rift Zone of Kilauea Volcano on the island of Hawaii where ground-water flow is oriented parallel to the emplacement orientation of volcanic dikes. The reported hydraulic gradient is about 1.7 ft/mi within about 4 mi from the coast in an area where recharge and hydraulic conductivity estimates are similar to those of the Haiku study area (Sorey and Colvard, 1994).
In addition to similar hydraulic gradients, the water-table configuration in the Kilauea's East Rift Zone and in the Haiku area are similar; showing a
Conceptual Model of Ground-Water Occurrence and Movement 29

convex pattern of water-level contours inside the dike complex. This similarity or pattern indicates that volca nic dikes do affect the flow of water perpendicular to the dike orientation and that the preferred ground-water flow direction is downrift rather than across the dike complex. Therefore, the effects of ground-water with drawal from wells drilled in the dike complex would tend to be more noticeable along the dike complex to the north and south and less noticeable across the dike complex to the east and west.
Variably Saturated Flow System
The rocks beneath the contact between the Kula Volcanics and the underlying Honomanu Basalt and above the freshwater lens appear to be unsaturated on the basis of several observations.
1. Stream channels incised into the Honomanu Basalt (Maliko and Kakipi Gulch) are dry or losing streamflow during base-flow conditions. All streamflow seeps into the Honomanu Basalt as it travels downstream from the Kula Volcanics.
2. The hydraulic conductivity of the Honomanu Basalt, on the basis of aquifer tests, is too high to support a thick ground-water lens given the estimated recharge to the study area. Kanemoeala Spring is a perennial spring about 700 ft from the coast at an altitude of 50 ft in Kanemoeala Gulch (fig. 9). If the spring, which is located at the Kula Volcanics/Honomanu Basalt contact, were to be discharging ground water from a vertically extensive freshwater lens, the hydraulic conductivity of the aquifer would have to be 7 ft/d on the basis of equation 1:
2 x 0.025 x 13 x 106 -P- x 700 ft __________ d
( 50 ft) 2 x 1.025x26400 ft= 7 .
d(2)
Estimates of the hydraulic conductivity of the aquifer based on aquifer tests are about three orders of magnitude higher. Therefore, it is likely that the freshwater lens is not thick enough to be discharging at this spring.
3. From discussions with several drillers andgeologists working in the area, it is apparent that wells that penetrate through the contact have encountered conditions of cascading water from
above the Kula Volcanics/Honomanu Basalt contact and dry lava tubes in the Honomanu Basalt.
The existence of an unsaturated zone between the high-level water body and the freshwater lens has important implications for ground-water development and the effect of groundr water withdrawal on streams. Unsaturated hydraulic conductivity values of shield- building lavas are not available but can be estimated from values estimated for coarse gravel. A layer of gravel can be considered analogous to a layer of rubble in an aa interflow zone. The hydraulic conductivity of gravel drops by about 14 orders of magnitude almost immediately after the water content of the gravel drops below saturation (Johnson and others, 1983). Therefore, the effects of pumping from the freshwater lens will be immeasurable at streams that are separated from the freshwater lens by more than 100 ft of the unsaturated basalt because of the very low hydraulic conductivity expected.
Development of Variably Saturated Ground- Water Flow Model
To evaluate the likelihood that a variably saturated system could develop in the Haiku study area, a two- dimensional, cross-sectional ground-water flow model using the computer code VS2DT (Healy, 1990) was developed to simulate steady-state movement of ground water in a variably saturated vertical section. The verti cal section was designed to be representative of the geo logic and hydrologic properties observed in the Haiku study area. VS2DT is a finite-difference code that sim ulates the transport of solutes and the flow of water by solving the nonlinear water-flow equation for unsatur ated and saturated porous media, and the code can incorporate infiltration, evapotranspiration, and seep age faces. In the version of the code used, the moisture- characteristic curve for the porous media is represented by the van Genuchten (1980) algebraic equation. The VS2DT code is a supplemental version of VS2D described in Lappala and others (1987). Solute transport was not simulated in this study.
Representation of the Physical System
The model was designed to represent a vertical section of a layered aquifer system, about 60 ft high and 3.5 ft wide, with thick-bedded lava flows overlying
30 Ground Water and Surface Water in the Haiku Area, East Maui, Hawaii
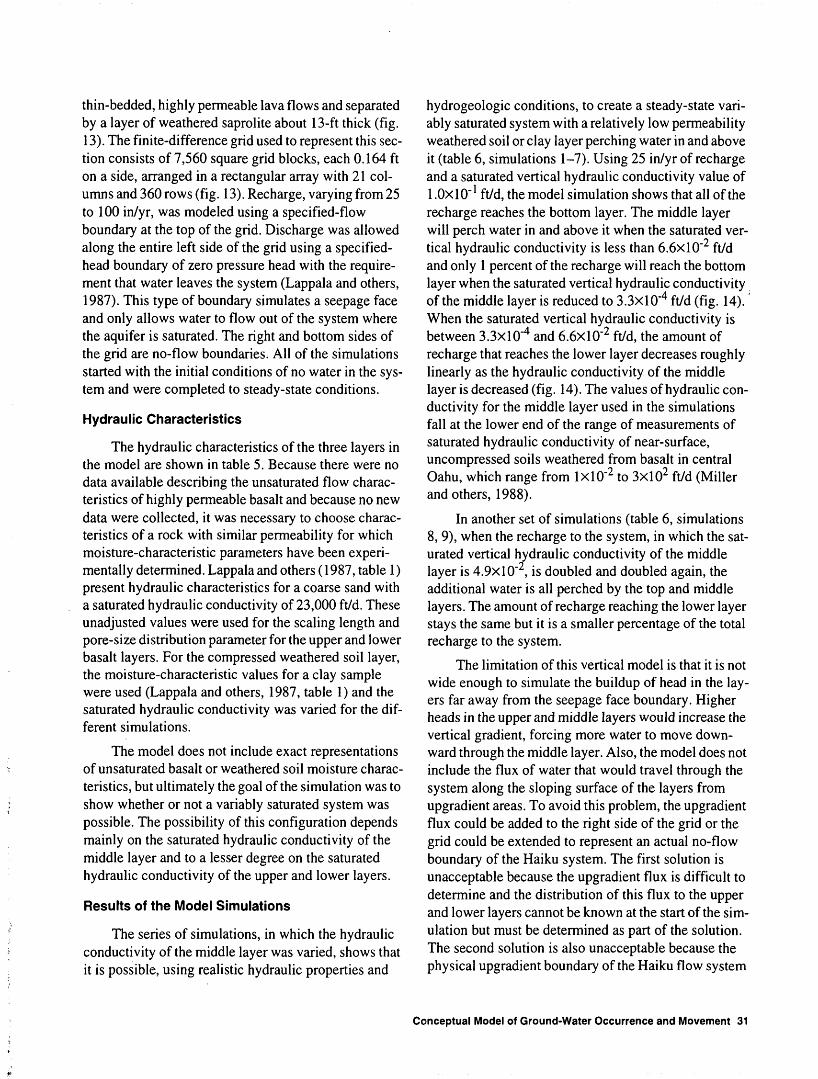
thin-bedded, highly permeable lava flows and separated by a layer of weathered saprolite about 13-ft thick (fig. 13). The finite-difference grid used to represent this sec tion consists of 7,560 square grid blocks, each 0.164 ft on a side, arranged in a rectangular array with 21 col umns and 360 rows (fig. 13). Recharge, varying from 25 to 100 in/yr, was modeled using a specified-flow boundary at the top of the grid. Discharge was allowed along the entire left side of the grid using a specified- head boundary of zero pressure head with the require ment that water leaves the system (Lappala and others, 1987). This type of boundary simulates a seepage face and only allows water to flow out of the system where the aquifer is saturated. The right and bottom sides of the grid are no-flow boundaries. All of the simulations started with the initial conditions of no water in the sys tem and were completed to steady-state conditions.
Hydraulic Characteristics
The hydraulic characteristics of the three layers in the model are shown in table 5. Because there were no data available describing the unsaturated flow charac teristics of highly permeable basalt and because no new data were collected, it was necessary to choose charac teristics of a rock with similar permeability for which moisture-characteristic parameters have been experi mentally determined. Lappala and others (1987, table 1) present hydraulic characteristics for a coarse sand with a saturated hydraulic conductivity of 23,000 ft/d. These unadjusted values were used for the scaling length and pore-size distribution parameter for the upper and lower basalt layers. For the compressed weathered soil layer, the moisture-characteristic values for a clay sample were used (Lappala and others, 1987, table 1) and the saturated hydraulic conductivity was varied for the dif ferent simulations.
The model does not include exact representations of unsaturated basalt or weathered soil moisture charac teristics, but ultimately the goal of the simulation was to show whether or not a variably saturated system was possible. The possibility of this configuration depends mainly on the saturated hydraulic conductivity of the middle layer and to a lesser degree on the saturated hydraulic conductivity of the upper and lower layers.
Results of the Model Simulations
The series of simulations, in which the hydraulic conductivity of the middle layer was varied, shows that it is possible, using realistic hydraulic properties and
hydrogeologic conditions, to create a steady-state vari ably saturated system with a relatively low permeability weathered soil or clay layer perching water in and above it (table 6, simulations 1-7). Using 25 in/yr of recharge and a saturated vertical hydraulic conductivity value of l.OxlO" 1 ft/d, the model simulation shows that all of the recharge reaches the bottom layer. The middle layer will perch water in and above it when the saturated ver tical hydraulic conductivity is less than 6.6x10"2 ft/d and only 1 percent of the recharge will reach the bottom layer when the saturated vertical hydraulic conductivity of the middle layer is reduced to 3.3xlO'4 ft/d (fig. 14).' When the saturated vertical hydraulic conductivity is between 3.3xlO"4 and 6.6X10'2 ft/d, the amount of recharge that reaches the lower layer decreases roughly linearly as the hydraulic conductivity of the middle layer is decreased (fig. 14). The values of hydraulic con ductivity for the middle layer used in the simulations fall at the lower end of the range of measurements of saturated hydraulic conductivity of near-surface, uncompressed soils weathered from basalt in central Oahu, which range from IxlO'2 to 3x102 ft/d (Miller and others, 1988).
In another set of simulations (table 6, simulations 8, 9), when the recharge to the system, in which the sat urated vertical hydraulic conductivity of the middle layer is 4.9x10 , is doubled and doubled again, the additional water is all perched by the top and middle layers. The amount of recharge reaching the lower layer stays the same but it is a smaller percentage of the total recharge to the system.
The limitation of this vertical model is that it is not wide enough to simulate the buildup of head in the lay ers far away from the seepage face boundary. Higher heads in the upper and middle layers would increase the vertical gradient, forcing more water to move down ward through the middle layer. Also, the model does not include the flux of water that would travel through the system along the sloping surface of the layers from upgradient areas. To avoid this problem, the upgradient flux could be added to the right side of the grid or the grid could be extended to represent an actual no-flow boundary of the Haiku system. The first solution is unacceptable because the upgradient flux is difficult to determine and the distribution of this flux to the upper and lower layers cannot be known at the start of the sim ulation but must be determined as part of the solution. The second solution is also unacceptable because the physical upgradient boundary of the Haiku flow system
Conceptual Model of Ground-Water Occurrence and Movement 31
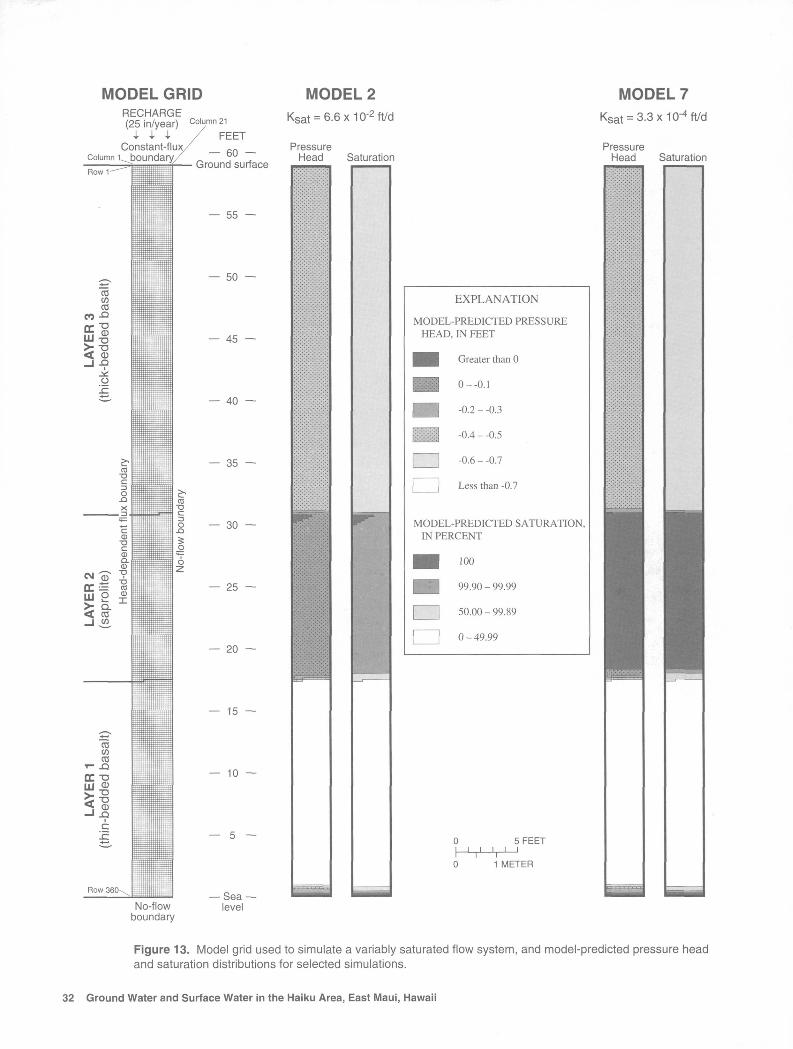
MODEL GRIDRECHARGE (25 in/year) Column 21
4. i 4 / FEET Constant-flux,
Column t^boundary
MODEL 2Ksat = 6.6x10⁻² ft/d
ra wCO
n-Q(f T3 %%>: ~&< oj -9
^ o
CM ^g-m 'g
> CL< TO_l «
<a <n <a
i- J3 ^"P-
Row 360
60 Ground surface
Pressure Head Saturation
MODEL?at = 3.3x10⁻⁴ ft/d
Pressure Head Saturation
No-flow boundary
55
50
45
40
35
30-
25
20
15
10
5
level
EXPLANATION
MODEL-PREDICTED PRESSURE HEAD, IN FEET
^^| Greater than 0
f""| -0.2 - -0.3
IjilJH -0.4 - -0.5
| | -0.6 - -0.7
| j Less than -0.7
MODEL-PREDICTED SATURATION, IN PERCENT
^| 100
^| 99.90 - 99.99
| | 50.00 - 99.89
I I 0 - 49.99
5 FEET
1 METER
Figure 13. Model grid used to simulate a variably saturated flow system, and model-predicted pressure head and saturation distributions for selected simulations.
32 Ground Water and Surface Water in the Haiku Area, East Maui, Hawaii

Table 5. Summary of VS2DT parameter values held constant in the ground-water flow model, Haiku study area, east Maui, Hawaii
Top layer
Middle layer
Bottom layer
Geologic feature
thick-bedded lava flows
saprolite
thin-bedded lava flows
Saturatedhorizontalhydraulic
conductivity,Ksat
(feet per day)
1
varied
1,000
Ratio of vertical to horizontal
hydraulic conductivity
0.1
1.0
0.1
Porosity
0.1
0.495
0.1
Van Genuchten (1995) scaling
length, a' (feet)
-0.466
-1.316
-0.466
Residual moisture content,
©r
0.025
0.175
0.025
Van Genuchten (1995) pore-size
distribution parameter, (V
6.3
1.6
6.3
Table 6. Summary of VS2DT parameter values varied in the ground-water flow model, Haiku area, east Maui, Hawaii
Model simulation number
1
2
3
4
5
6
7
8
9
Saturated horizontal and verticalhydraulic conductivity of
middle layer, Ksat (feet per day)
l.OxlQ- 1
6.6x1 0'25.7xlO-2
4.9x1 0'23.3xlO'2
l.OxlO'2
3.3xlO'4
4.9x1 0'2
4.9x1 0'2
Recharge, (inches per year)
25
25
25
25
25
25
25
50
100
Amount of recharge reaching lower layer,
(percent of total recharge)
100
97
92
83
55
17
1
41
21
is unknown and may very well be the flow divide at the 2. center of East Maui Volcano 10 to 15 miles inland.
DATA NEEDS
Additional data are needed to improve and confirm the understanding of the ground-water flow system in the study area. A few specific data needs are briefly 3. described below.
1. Data from exploratory wells could confirm the existence of an unsaturated layer between the upper and lower water tables. The wells would be open only to a small part of the aquifer (a few tens of feet) above the freshwater lens but still in the Honomanu Basalt. Unsaturated conditions would be confirmed if the well remains dry or negative pressures can be measured in the well.
Continuous monitoring of selected springs and streamflow in the area is needed to measure baseline ground-water discharge before the start of proposed additional ground-water withdrawal. Comparisons can then be made to determine if the additional withdrawal is affecting ground-water discharge at the high-level streams or springs.
An aquifer test in the Honomanu Basalt with multiple observation wells arranged both parallel and perpendicular to the preferred volcanic-dike orientation is needed to determine if the dike complex does indeed have higher conductivity in the north-south direction compared to the east- west direction. In addition, an observation well open only to the upper water body could be used to monitor any hydrologic effects felt there.
Data Needs 33

100
90
80
oLLJ
3CC
£DC 70 O <-j i
z S 60
LU u_ 00^ \- S^ogUJ g-
LL a. 0 Z
O
<
50
40
30
20
10
i i i _ i r i
RECHARGE
25 in/year
50 in/year
^ 100 in/year
0.01 0.02 0.03 0.04 0.05 0.06 0.07 0.08 0.09 0.10 0.11 0.12
SATURATED VERTICAL HYDRAULIC CONDUCTIVITY OF MIDDLE LAYER, IN FEET PER DAY
Figure 14. Response of the ground-water flow model to changes in the saturated vertical hydraulic conductivity of the middle layer.
4. Geologic logging of all additional wells drilled in the area could provide more information on the relation of the upper water body to the stratigraphy. Water levels in the wells need to be monitored daily during drilling to determine the vertical-flow gradient in the ground-water system.
SUMMARY AND CONCLUSIONS
The Haiku study area lies on the gently sloping eastern flank of the East Maui Volcano (Haleakala).
?\
The wedge-shaped study area, covering about 42 mi , is bounded to the north by about 6 mi of coastline and lies between the drainage basins of Maliko Gulch to the west and Kakipi Gulch to the east. About 7 mi from the
coast at an altitude of 2,400 ft, these two gulches are less than 0.5 mi apart. Land use is currently dominated by pineapple cultivation, some residential areas, and at higher altitudes by livestock grazing and forested state conservation land.
The study area lies on the northwest rift zone of East Maui Volcano, a geologic feature 3 to 5 mi wide marked by surface expressions such as cinder, spatter, and pumice cones and by a positive gravity anomaly. Rift zones are intruded by magma that cools to form volcanic dikes hydrologically significant features that can impede the flow of water as a result of their low hydraulic conductivity. The study area contains two geologic units, the main shield-building stage Hono- manu Basalt, a thick accumulation of thin lava flows,
34 Ground Water and Surface Water in the Haiku Area, East Maui, Hawaii

and above that the Kula Volcanics, which consist mainly of lava flows that are many tens to hundreds of feet thick. The two units may be separated by a transi tional phase lava and a red layer of weathered soil and ash.
The hydraulic conductivity of the Honomanu Basalt in the study area was estimated to be between 1,000 and 3,600 ft/d on the basis of aquifer tests and between 3,300 and 4,400 ft/d on the basis of the regional recharge rates and observed freshwater heads. No estimates are available for the hydraulic conductiv ity of the Kula Volcanics but estimates of specific capacity range from 0.01 to 0.09 gal/min per ft of draw down. These estimates are about four orders of magni tude lower than the average specific capacity of the wells that penetrate into the Honomanu Basalt.
About 191 Mgal/d of rainfall and 22 Mgal/d of fog drip enters the study area with the highest amounts occurring between 2,000 and 6,000 ft altitude. Of the total precipitation, about 98 Mgal/d enters the ground- water system as recharge. Nearly all of the ground water currently withdrawn in the study area is from well 5520- 01 in Maliko Gulch. Historic withdrawal rates have averaged about 2.8 Mgal/d at this site. Total withdrawal at all other wells in the study area is probably about 10 percent of the withdrawal from well 5520-01. An addi tional 18 Mgal/d of ground-water withdrawal is pro posed.
The drainage pattern of the stream valleys on East Maui is radial and the streams in the study area drain north to the ocean. The two most deeply incised stream valleys in the study area, Maliko Gulch and Kakipi Gulch, have floors formed near the coast by the Hono manu Basalt. The upper parts of these valleys and all of the other stream valleys in the study area lie in the Kula Volcanics. Flow in Waiohiwi Gulch, a tributary to Maliko Gulch, is perennial between about 2,000 ft and 4,000 ft altitude. At lower altitudes in Maliko Gulch, flow is perennial at only a few spots downstream of springs and near the coast. The total measured discharge from springs in Maliko Gulch is about 0.4 Mgal/d, nearly all of which occurs from the Kula Volcanics.
The Kuiaha and Kaupakulua Gulch systems are usually dry from sea level to an altitude of about 350 ft. The three branches of the Kuiaha Gulch system gain water from about 900 ft to about 350 ft altitude. The two main branches of the Kaupakulua Gulch system
alternately gain and lose water from 2,400 ft to 900 ft altitude. The total amount of ground-water discharge measured in the Kuiaha Gulch and Kaupakulua Gulch systems is about 1.0 Mgal/d and 1.4 Mgal/d, respec tively, all of which is discharged from the Kula Volcanics.
Kakipi Gulch has perennial flow over much of its length but is often dry near the coast below 400 ft alti tude. Five surface-water gaging stations have been operated for various lengths of time on branches of Kakipi Gulch above 1,200 ft altitude to record daily streamflow. A gaging station at 3,100 ft altitude shows that the stream has gone dry after periods of low rain fall, but at 2,400 ft altitude, streamflow has been contin uous from 1966 to the present (1998) and has averaged about 1.1 Mgal/d. In all of the drainage systems of the study area, all of the ground-water discharge from the Kula Volcanics not captured by surface-water diver sions eventually returns to the ground-water system through streambed seepage.
Measured water levels in wells completed above sea level and the altitudes of springs and gaining sec tions of streams were used to construct a map of an upper (high-level) water table. The upper water table generally mimics topography and lies several tens of feet below the ground surface outside of the stream val leys. The upper water body lies entirely in the Kula Vol canics and exists because the relatively low permeability of the interbedded and underlying soil and ash layers impedes the downward movement of the ground water.
Measured water levels in wells that penetrate below sea level were used to construct a map of the fresh ground-water lens. The hydraulic gradient of the lens surface rises away from the coast with a slope of about 3 ft/mi within the dike complex. Although the hydraulic gradient in the dike complex is steeper than the gradient outside the complex, it is still relatively flat and suggests that because ground-water flow is gener ally in the same direction as the dike orientation, signif icant impoundment of ground water is not occurring. Temporal variations in water levels show the influence of the ocean tides but seasonal and interannual varia tions appear to be less than a foot. No long-term trends are apparent in the water levels.
Chloride concentration is used as an indicator of saltwater intrusion into the ground-water system. The
Summary and Conclusions 35

only long-term record of chloride concentration avail able is for well 5520-01 in Maliko Gulch, where between 1925 and 1996, chloride concentration ranged from 270 to 1,668 mg/L and fluctuated in response to changes in the amount of withdrawal from the well. Chloride-concentration values for samples from other wells that penetrate to below sea level range from 49 to 200 mg/L, the highest concentrations were in samples from wells nearest the coast where the freshwater lens is thinnest. Chloride concentrations averaged about 20 mg/L in water from well 5413-08, which does not pen etrate sea level, from the Maliko Tunnel, and from streams consisting of only base flow.
Fresh ground water in the study area is found in two main forms: (1) as perched high-level water held up by relatively low-permeability geologic layers, and (2) as a freshwater lens floating on denser, underlying salt water. The rocks beneath the contact between the Kula Volcanics and the underlying Honomanu Basalt and above the freshwater lens appear to be unsaturated on the basis of several observations: (1) streams are dry or losing water where they are incised into the Honomanu Basalt, (2) the hydraulic conductivity of the Honomanu Basalt is too high to support a thick ground-water lens given the estimated recharge to the study area, and (3) wells that penetrate through the contact have encoun tered conditions of cascading water from above the con tact and dry lava tubes in the Honomanu Basalt.
A cross-sectional, steady-state, variably saturated ground-water flow model using the computer code VS2DT (Healy, 1990) was developed to evaluate whether a two-layer, variably saturated ground-water flow system could develop given the hydrologic and geologic conditions of the Haiku study area. Using 25 in/yr of recharge and hydraulic characteristics represen tative of the Kula Volcanics and the Honomanu Basalt, the model demonstrates that a 13-ft thick geologic layer with a saturated vertical hydraulic conductivity below 6.6x10"2 ft/d can impede vertical ground-water flow enough to produce two saturated water bodies with an unsaturated zone between them. Subsequent lower ver tical hydraulic conductivity values for the impeding layer allow even less water to reach the lower layer.
REFERENCES CITED
Austin, Tsutsumi and Associates, Inc., 1998, Preliminary engineering report for new potable water sources, Kau- pakulua Well, Haiku, Maui, Hawaii: prepared for Kula- malu Limited Partnership, 1997 East Main Street, Wailuku, Maui, Hawaii, 96793, Honolulu, Hawaii, 19 p.
Chen, C.-Y., Frey, F.A., Garcia, M.O., Dalrymple, G.B., and Hart, S.R., 1991, The tholeiite to alkalic basalt transition at Haleakala Volcano, Maui, Hawaii: Contributions to Mineralogy and Petrology, v. 106, p. 183-200.
County of Maui Department of Water Supply, 1992, East Maui water development plan September 1992: Wailuku, Hawaii, 34 p. plus appendixes.
Department of Land and Natural Resources, 1991, Ground water index and summary, February 5, 1991: State of Hawaii, Honolulu, Hawaii, variously paged.
Economic Planning and Coordination Authority, 1957, An inventory of available information on land use in Hawaii, volume 1: evaluation and recommendations prepared by Harland Bartholomew and Associates for the Economic Planning and Coordination Authority of the Territory of Hawaii: Honolulu, Hawaii, 100 p.
Ekern, P.C., 1964, Direct interception of cloud water on Lanaihale, Hawaii: Soil Science Society of America, v. 28, no. 3, p. 419-421.
Ekern, P.C., 1983, Measured evaporation in high rainfall areas, leeward Koolau Range, Oahu, Hawaii: University of Hawaii Water Resources Research Center, Technical Report No. 156, 60 p.
Ekern, P.C., and Chang, J-H., 1985, Pan evaporation: State of Hawai'i, 1894-1983: State of Hawaii, Department of Land and Natural Resources, Report R74, 172 p.
Fontaine, R.A., 1996, Evaluation of the surface-water quan tity, surface-water quality, and rainfall data-collection programs in Hawaii, 1994: U.S. Geological Survey Water-Resources Investigations Report 95-4212, 125 p.
Giambelluca, T.W., 1983, Water balance of the Pearl Harbor- Honolulu Basin, Hawai'i, 1946-1975: Water Resources Research Center, University of Hawaii Technical Report 151, 151 p.
Giambelluca, T.W., Nullet, M.A., and Schroeder, T.A., 1986, Rainfall atlas of Hawai'i: State of Hawaii, Department of Land and Natural Resources, Report R76, 267 p.
Giambelluca, T.W., and Nullet, Dennis, 1991, Influence of the trade-wind inversion on the climate of a leeward
36 Ground Water and Surface Water in the Haiku Area, East Maui, Hawaii
mountain slope in Hawaii: Climate Research, v. 1, p. 207-216.
Grover, N.C., and Carson, M.H., 1935, Surface water supply of Hawaii, July 1, 1932 to June 30, 1933: U.S. Geologi cal Survey Water-Supply Paper 755, 125 p.
Healy, R.W., 1990, Simulation of solute transport in variably saturated porous media with supplemental information on modification to the U. S. Geological Survey's com puter program VS2D: U.S. Geological Survey Water- Resources Investigations Report 90-4025, 125 p.
Hunt, C.D., Jr., 1996, Geohydrology of the island of Oahu, Hawaii: U.S. Geological Survey Professional Paper 1412-B,54p.
Johnson, T.M., Cartwright, K., Herzog, B.L., and Larson, T.H., 1983, Modeling of moisture movement through layered trench covers in Mercer, J.W., Rao, P.S.C., and Marine, I.W., eds., Role of the unsaturated zone in radio active and hazardous waste disposal: Ann Arbor, Mich., Ann Arbor Science Publishers, p. 11-26.
Juvik, J.O., and Nullet, Dennis, 1995, Relationships between rainfall, cloud-water interception, and canopy through- fall in a Hawaiian montane forest, in Hamilton, L.S., Juvik, J.O., and Scatena, F.N., eds., Tropical montane cloud forests: New York, Springer-Verlag, p. 165-182.
Kinoshita, W.T., and Okamura, R.T., 1965, A gravity survey of the island of Maui, Hawaii: Pacific Science, v. 19, p. 341-342.
Langenheim, V.A.M., and Clague, D.A., 1987, The Hawai ian-Emperor volcanic chain, part II, stratigraphic frame work of volcanic rocks of the Hawaiian Islands in Decker, R.W., Wright, T.L., and Stauffer, P.H., eds., Volcanism in Hawaii: U.S. Geological Survey Profes sional Paper 1350, v. 1, p. 55-84.
Lappala, E.G., Healy, R.W., and Weeks, E.P., 1987, Docu mentation of computer program VS2D to solve the equa tions of fluid flow in variably saturated porous media: U.S. Geological Survey Water-Resources Investigations Report 83-4099, 131 p.
Macdonald, G.A., Abbott, A.T., and Peterson, F.L., 1983, Volcanoes in the sea (2d ed.): Honolulu, University of Hawaii Press, 517 p.
Marsily, Ghislain de, 1986, Quantitative Hydrogeology: San Diego, Calif., Academic Press, Inc., 440 p.
Martin, W.F., and Pierce, C.H., 1913, Water resources of Hawaii, 1909-1911: U.S. Geological Survey Water- Supply Paper 318, 552 p.
Meyer, William, and Souza, W.R., 1995, Factors that control the amount of water that can be diverted to wells in a high-level aquifer, in Hermann, Raymond, Back, Will iam, Sidle, R.C., and Johnson, A.I., eds., Water Resources and Environmental Hazards: Emphasis on Hydrologic and Cultural Insight in the Pacific Rim, Pro
ceedings of the American Water Resources Association Annual Summer Symposium, Honolulu, Hawaii, June 25-28, 1995, p. 207-216.
Miller, M.E., Green, R.E., Peterson, F.L., Jones, R.C., and Loague, K., 1988, Hydrogeologic characteristics of sub soil and saprolite and their relation to contaminant trans port, Central O'ahu, Hawai'i: Water Resources Research Center, University of Hawaii Technical Report 178, 76 p.
Pierce, C.H., and Larrison, G.K., 1914, Water resources of Hawaii, 1912: U.S. Geological Survey Water-Supply Paper 336, 392 p.
Shade, P.J., 1999, Water budget for east Maui, Hawaii: U.S. Geological Survey Water-Resources Investigations Report 98-4159, 36 p.
Soil Conservation Service, 1982, Agricultural land use in the State of Hawaii, island of Maui: Fort Worth, Texas, 1 sheet.
Sorey, M.L., and Colvard, E.M., 1994, Potential effects of the Hawaii Geothermal Project on ground-water resources on the island of Hawaii: U.S. Geological Survey Water- Resources Investigations Report 94-4028, 22 p.
Souza, W.R., and Voss, C.I., 1987, Analysis of an anisotropic coastal aquifer system using variable-density flow and solute transport simulation: Journal of Hydrology, v. 92, p. 17-41.
State of Hawaii, 1990, Water Resources Protection Plan, vol umes I and II, Hawaii Water Plan: State of Hawaii, Com mission on Water Resource Management, variously paged.
Stearns, H.T., 1942, Geologic and topographic map, Island of Maui, Hawaii, scale 1:62,500 in Stearns, H.T., and Mac donald, G.A., 1942, Geology and ground-water resources of the Island of Maui, Hawaii: Hawaii Division of Hydrography Bulletin 7, 344 p.
Stearns, H.T., and Macdonald, G.A., 1942, Geology and ground-water resources of the Island of Maui, Hawaii: Hawaii Division of Hydrography Bulletin 7, 344 p.
Stearns, H.T., and Macdonald, G.A., 1946, Geology and ground-water resources of the Island of Hawaii: Hawaii Division of Hydrography Bulletin 9, 363 p.
Swain, L.A., 1973, Chemical quality of ground water in Hawaii: State of Hawaii, Department of Land and Natu ral Resources, Report R48, 54 p.
Takasaki, K.J., and Mink, J.F., 1985, Evaluation of major dike-impounded ground-water reservoirs, island of Oahu: U.S. Geological Survey Water-Supply Paper 2217, 77 p.
Territorial Planning Board, 1939, An historic inventory of the physical, social and economic and industrial resources of the Territory of Hawaii: Honolulu, Hawaii, 322 p.
References Cited 37

University of Hawaii Land Study Bureau, 1967, Detailed land classification - Island of Maui: University of Hawaii, Honolulu, Land Study Bureau Bulletin no. 7, 162 p.
van Genuchten, M.Th., 1980, A closed-form equation for pre dicting the hydraulic conductivity of unsaturated soils: Soil Science of America Proceedings, v. 44, no. 5, p. 892-898.
Wahl, K.L., and Wahl, T.L., 1995, Determining the flow of Comal Springs at New Braunfels, Texas: Proceedings of Texas Water '95, A Component Conference of the First International Conference on Water Resources Engineer ing, American Society of Civil Engineers, August 16- 17, 1995, San Antonio, Tex., p. 77-86.
U.S. Geological Survey, 1983a, Haiku quadrangle, Hawaii- Maui County, island of Maui: 7.5-minute series (topo graphic map), 1:24,000 scale.
U.S. Geological Survey, 1983b, Paia quadrangle, Hawaii- Maui County, island of Maui: 7.5-minute series (topo graphic map), 1:24,000 scale.
38 Ground Water and Surface Water in the Haiku Area, East Maui, Hawaii
it U.S. GOVERNMENT PRINTING OFFICE: 2000 589-387 / 16003 Region No. 10

Q13'CO CDo"
O 33 OC
m 33
C33
o m
Im33
HIm
IDm
m >O)
>
3333COc» jk4^.ro
Printed on recycled paper