country –fiji islands presenter – hasmukh patel, ceo of fiji electricity authority
TRANSCRIPT

COUNTRY –FIJI ISLANDSCOUNTRY –FIJI ISLANDS
PRESENTER – HASMUKH PATEL, CEO OF FIJI ELECTRICITY AUTHORITY

Introduction
energizing our nation
Butoni Wind Farm

Energy Sector OverviewEnergy Sector Overview
• Population:850,000• Electrification Rate:4,000 new
customers/year• Population Connected to Grid:600,000• Energy Stakeholders: Government, Land
Owners, IPPs• Deficit in electrical energy:Nil
– Installed Capacity in 2011 – 200MW; 240MW in 2012
– Total Renewable Energy by Dec 2011 – 140MW– Maximum Demand in 2011– 140MW

POWER DEVELOPMENT PLAN TO 2015
0
200
400
600
800
1000
1200
2007 2008 2009 2010 2011 2012 2013 2014 2015
GW
h
Diesel generation (FEA)
Lower Wailoa Additions (FEA)
Wailoa improvements (FEA)
Tropik Nadi (IPP)
Nadarivatu (FEA)
Iviti Bio Mass (IPP)
Deuba Bio Mass (IPP)
Tropik Drasa (IPP)
FSC Lautoka (IPP)
Butoni (FEA)
FSC Labasa (IPP)
Wainikasou/Nagado (IPP)
Monasavu (FEA)

Power GenerationPower Generation
• Total Power Generation - 856,680MWh
• Power Generation Mix(2010)
– Hydro – 49%
– Thermal – 48%
– Wind – 1%
– Biomass(IPP) – 2%
Renewable EnergyRenewable Energy
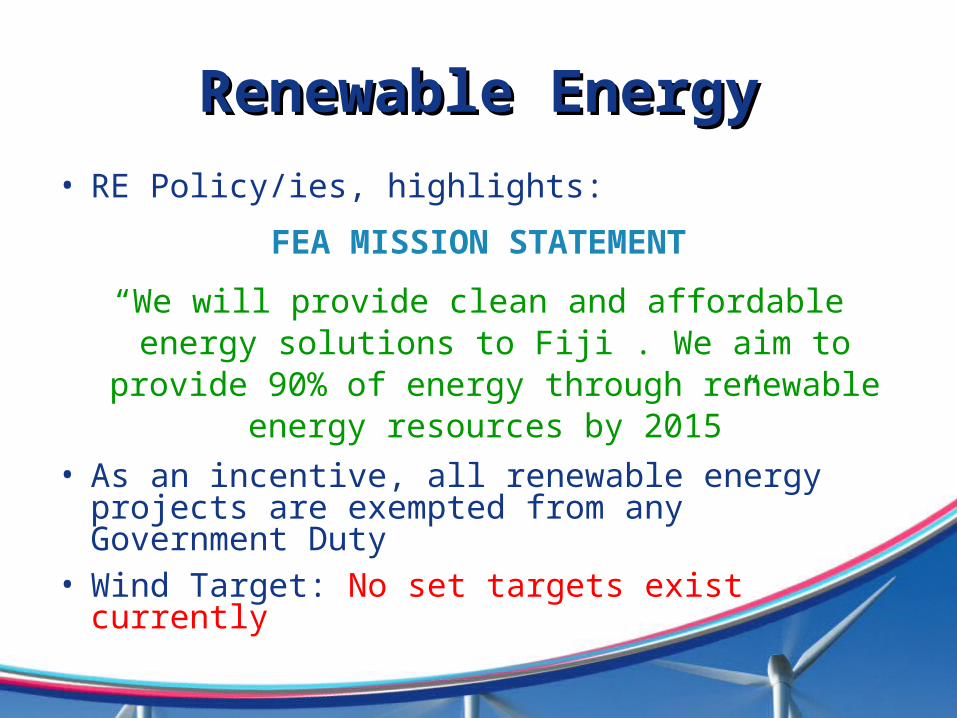
• RE Policy/ies, highlights:
FEA MISSION STATEMENT
“We will provide clean and affordable energy solutions to Fiji . We aim to provide 90% of
energy through renewable energy resources by 2015”
• As an incentive, all renewable energy projects are exempted from any Government Duty
• Wind Target: No set targets exist currently

Electricity Cost: Electricity Cost: Subsidies and IncentivesSubsidies and Incentives
• RE Subsidies
• Fossil Fuel Subsidies
RE Source Base Rate (US$/kWh)
Subsidy ($/kWh)
Wind 0.1457 NA
Solar 0.1457 NA
Biogas 0.1457 NA
Others 0.1457 NA
Fossil Fuel Base Rate ($/kWh) Subsidy ($/kWh)
Coal NA NA
Oil NA NA
Wind Resource PotentialWind Resource Potential
• Country Wind Potential (MW, source):
- Yet to be assessed
• Realizable Potential (MW):
- Yet to be assessed


Total Installed Wind Total Installed Wind CapacityCapacity
as of December 2010as of December 2010
Operational Wind Projects MW Year
1. Butoni Wind Farm 10 2007
2.
3.
TOTAL 10

Photo of Butoni Wind Farm -Fiji

Status of the backup software called « server »
Green light when the software is running
Gray light when it’s stopped.
Main date of park totals- The active power.-The reactive power.-The three composed voltages (U1-U2 / U1-U3 / U2-U3).-The power factor (ratio between active and apparent power).-The total energy since the wind farm has been started.-The date when the main counters have started (wind farm installation).-The total WTG installed on site.-Number of WTG in production.
The summary « Status of the power station » explains the different symbols and colours behaviours
The power curves page
Butoni Windfarm Overview

Additional Wind CapacityAdditional Wind Capacity
Pipeline of Wind Projects MW Estimated Year
Estimated Cost
1. Ovalau Wind Farm 0.5 2014 US$0.6
2.
3.
TOTAL
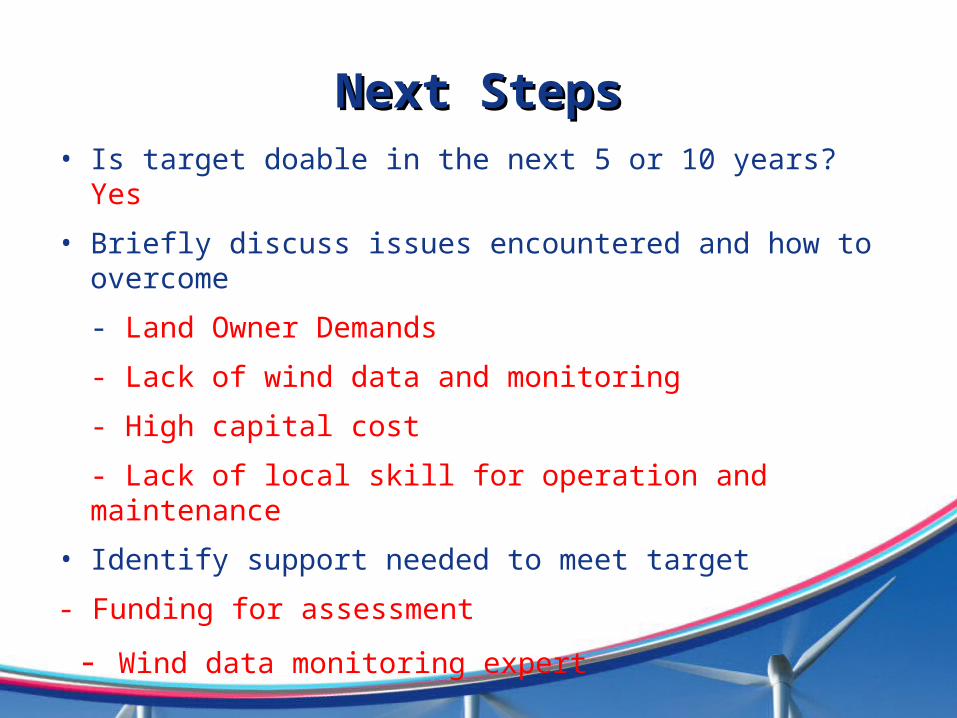
Next StepsNext Steps• Is target doable in the next 5 or 10 years? Yes
• Briefly discuss issues encountered and how to overcome
- Land Owner Demands
- Lack of wind data and monitoring
- High capital cost
- Lack of local skill for operation and maintenance
• Identify support needed to meet target
- Funding for assessment
- Wind data monitoring expert
THANK YOU