counting the costs of a twenty-first century census: south africa's census 2001
TRANSCRIPT
This article was downloaded by: [University of Glasgow]On: 19 December 2014, At: 15:46Publisher: RoutledgeInforma Ltd Registered in England and Wales Registered Number: 1072954 Registeredoffice: Mortimer House, 37-41 Mortimer Street, London W1T 3JH, UK
Development Southern AfricaPublication details, including instructions for authors andsubscription information:http://www.tandfonline.com/loi/cdsa20
Counting the costs of a twenty-firstcentury census: South Africa's census2001Julian May & Pali LehohlaPublished online: 19 Jan 2007.
To cite this article: Julian May & Pali Lehohla (2005) Counting the costs of a twenty-firstcentury census: South Africa's census 2001, Development Southern Africa, 22:2, 215-232, DOI:10.1080/03768350500163279
To link to this article: http://dx.doi.org/10.1080/03768350500163279
PLEASE SCROLL DOWN FOR ARTICLE
Taylor & Francis makes every effort to ensure the accuracy of all the information (the“Content”) contained in the publications on our platform. However, Taylor & Francis,our agents, and our licensors make no representations or warranties whatsoever as tothe accuracy, completeness, or suitability for any purpose of the Content. Any opinionsand views expressed in this publication are the opinions and views of the authors,and are not the views of or endorsed by Taylor & Francis. The accuracy of the Contentshould not be relied upon and should be independently verified with primary sourcesof information. Taylor and Francis shall not be liable for any losses, actions, claims,proceedings, demands, costs, expenses, damages, and other liabilities whatsoever orhowsoever caused arising directly or indirectly in connection with, in relation to or arisingout of the use of the Content.
This article may be used for research, teaching, and private study purposes. Anysubstantial or systematic reproduction, redistribution, reselling, loan, sub-licensing,systematic supply, or distribution in any form to anyone is expressly forbidden. Terms &Conditions of access and use can be found at http://www.tandfonline.com/page/terms-and-conditions
Counting the costs of a twenty-firstcentury census: South Africa’sCensus 2001
Julian May & Pali Lehohla1
Increasingly complex societies necessitate the collection of more information, or more sophisticated
ways of estimation. This places upward pressure on the cost of collecting such information, as family
structures are more complex, mobility more frequent, and willingness to provide information
declines. As a result, rising census costs have become an issue in many countries. South Africa’s
2001 Census was arguably the most expensive in the country’s history. However, assessing the
cost of a census requires a closer scrutiny of the cost of census-taking as well as the procedures
that were followed and the benefits that might arise. This paper uses information provided by
Statistics South Africa to analyse the cost of Census 2001 and explore lessons that may be
derived for future census activities.
1. INTRODUCTION
While increasingly complex societies necessitate the collection of more information or
more sophisticated ways of estimation, the costs of collecting such information are a
concern. One aspect of this is the increasing cost of census-taking, which has been experi-
enced in both developing and developed countries (Alam, 2001; Diop, 2001; Leete, 2001;
UK Parliament, 2001). Reasons given for the high and rising costs of census-taking
include population growth; smaller and more complex family structures; increasing
national and trans-national mobility; the high cost of labour-saving and time-saving tech-
nologies, and the learning curve associated with changing from long-established methods
to new approaches; increased labour costs, and the need to adhere to the employment
practices adopted by progressive governments (Simpson, 2001: 423). Other concerns
relate to resistance to census-taking by certain populations, attempts to improve coverage
of groups traditionally excluded from census-taking, such as the homeless and young
males from poor communities, and reliance on private sector suppliers who have
access to scarce skills.
The costs and benefits of census-taking, once taken for granted, are now being called into
question. How cost-effective a census has been can be thought of as the outcome of a
number of inter-related dimensions, of which efficient resource allocation is only one
component (Holt & Diamond, 2001: 446).
. First, and most important, is the accuracy of the count and distribution of the popu-
lation, and the extent to which bias and error can be identified and taken into account.
1Respectively, Associate Professor, School of Development Studies, University of KwaZulu-Natal;and Statistician-General, Statistics South Africa. The analysis in this paper and the conclusions thatare drawn are those of the authors only, and do not reflect the views of the Statistics Council or theUniversity of Natal. The information and assistance provided by Statistics South Africa staff andmanagement are however acknowledged, as are the comments received from the members of theCensus sub-committee of the Statistics Council and two anonymous referees. An earlier versionof this paper was presented at the Joint Population Conference on Urban and Rural SustainableDevelopment, 13–17 October, 2003, Potchefstroom.
Development Southern Africa Vol. 22, No. 2, June 2005
ISSN 0376-835X print=ISSN 1470-3637 online=05=020215-18 # 2005 Development Bank of Southern AfricaDOI: 10.1080=03768350500163279
Dow
nloa
ded
by [
Uni
vers
ity o
f G
lasg
ow]
at 1
5:46
19
Dec
embe
r 20
14

. Secondly, the breadth and depth of the information that has been collected beyond the
population count and basic demographic characteristics of the population.
. Thirdly, the accessibility of the census data to decision-makers and researchers. In part
this refers to the timeliness with which information is made available, and in part, to
the format that is used when disseminating the results.
. Finally, the way in which the resources made available to the census were deployed to
achieve efficient procurement procedures, employment generation, investment in
research and development activities and investment in physical capital such as com-
puter equipment. Although this article will largely focus on this component, the
success achieved in the three items above must ultimately determine any assessment
of a census.
The article starts by examining the lessons that Statistics South Africa1 reported had been
learnt from the South African Census held in 1996, for the management of the Census
held in 2001. The cost of Census 2001 is then examined in comparison to Census
1996 and the costs of other population censuses in countries similar to South Africa.
The article goes on to analyse the items that contributed towards the cost of Census
2001, isolating those components that represent an investment in knowledge or physical
capital from those that are the direct and one-off costs associated with a project of this
scale. The expected benefits of Census 2001 are then reviewed and finally the article
draws out lessons for consideration in planning future census-taking in South Africa
as well as broader lessons for the activities of national statistical agencies.
2. LESSONS FOR COST-EFFECTIVENESS FROM CENSUS 1996
Despite some flaws, Census 1996 is acknowledged as a benchmark for South Africa, as it
represents the first attempt to count the population of post-apartheid South African and to
obtain essential planning information through the census process. It provided a base
against which other data can be placed into perspective, and the R400 million that
was spent on it at the time appears to have been a worthwhile investment, despite
some concerns over the accuracy of the count.
Several reviews of Census 1996 have been undertaken: these offer important insights that
could have facilitated the management of Census 2001. While most of these lessons
relate to technical issues such as statistically adjusting for the undercount, improving
coverage and ensuring quality control, three issues are important for this review of the
costs and benefits of census-taking. These are improvements in organisation efficacy,
data processing and the depth of the information that is gathered.
2.1 Organisational efficacy
Administrative capacity was identified as an important constraint in the administration of
Census 1996. In 1996, the census project had to create its own administrative support
mechanism. This was said to have resulted in duplication and waste through inexperience
as well as through deliberate fraud. To resolve this, review documents comment that the
Stats SA management intended to develop viable administrative structures that would
work in unison with the technical activities (Stats SA, 1999a). In the early planning docu-
ments for Census 2001, improvements in administration were identified as a potential
strength that would help reduce cost and wastage through effective management and
1Hereafter referred to as Stats SA.
216 J May & P Lehohla
Dow
nloa
ded
by [
Uni
vers
ity o
f G
lasg
ow]
at 1
5:46
19
Dec
embe
r 20
14
ensure timely delivery of services. Indeed, in July 1999, Stats SA claimed that the admin-
istrative wing of Stats SA was probably at full strength (Stats SA, 1999a).
Management capacity was identified as being a related constraint in 1996. By mid-1995
the Central Statistical Service (CSS), the precursor to Stats SA, was still in transition and
a new management team had only just been put in place. The internal review of Census
1996 identified that management had been too heavily involved in detail and the ‘big
picture’ of the Census was not properly managed (Stats SA, 1999a). In particular, too
many new and ambitious projects were embarked on, while logistical planning was
poor. In addition, financial management was also identified as being unacceptable. In
response to this, early planning documents for Census 2001 indicated that external
project managers would be appointed, and that sub-projects would be reviewed with
the view of simplifying processes (Stats SA, 1999b).
The final issue reflecting organisational efficacy related to the procurement processes fol-
lowed in 1996. Considered to be less than satisfactory, the document proposed that the
tender process be reviewed to allow fast-tracking, with streamlined processes, in order to
overcome problems of delays and inadequate service provision.
2.2 Data processing
Slow and costly data processing was identified as a problem in Census 1996. In this
census, about 35 per cent of the data-processing budget was spent on paying wages.
Another 15 per cent went on office rentals and equipment. It was judged that excessive
time had been devoted to staff management rather than to production. To counter this, the
data processing plan envisaged in the assessment of Census 1996 was to use ‘intelligent’
optical reading devices or scanners for Census 2001 (Stats SA, 1999b). It was argued that
the initial cost of equipment could be amortised by using this equipment for follow-up
household surveys, economic surveys and processing vital data registration. The envi-
saged plan was expected to reduce the cost of this phase by between 30 and 40 per
cent of the cost of Census 1996.
2.3 Information depth
The questionnaire in Census 1996 was long and detailed, and contained 65 questions.
This was said to reflect the ambition to produce detailed information about the South
African people; however, it was acknowledged that this decision increased the cost of
census-taking. It was suggested that planning for Census 2001 should consider concen-
trating on a few main questions whose answers are essential at a detailed level (Stats SA,
1999a). The length of the questionnaire was also identified as likely to have an impact on
almost all phases in census-taking.
3. HAS CENSUS 2001 COST MORE?
Given these anticipated improvements, and the hope that was expressed that the costs of
the census might be reduced, the next issue to resolve is whether Census 2001 actually cost
more than Census 1996, once all of the appropriate adjustments are made for changes in
purchasing power and population growth. However, judging the extent to which the costs
of the census exceeded expectations is complicated by the existence of numerous budgets
and several allocation approvals, not to mention the difficulties associated in estimating
cost changes in any census-taking (Edmonston & Schultze, 1995: 44–6).
South Africa’s Census 2001 217
Dow
nloa
ded
by [
Uni
vers
ity o
f G
lasg
ow]
at 1
5:46
19
Dec
embe
r 20
14

3.1 Estimating the total cost of census 2001
The following is an incomplete list that provides some idea of the range over which the
cost of Census 2001 was estimated (Scott, 2003; Stats SA, nd, a; Stats SA, nd, b; Stats
SA, nd, c; Stats SA, nd, d).
. R490,6 million: original allocation, 1998
. R590,8 million: estimate from a Technical Discussion Document prepared in response
to the original allocation, 1999
. R626,0 million: original budget prepared in 1998
. R710,6 million: revised allocation, 1999
. R848,3 million: original allocation plus approved additional amount, 2001
. R901,8 million: submission to the Minister of Finance, 2002
The final cost of Census 2001 as used in this article is broken down as follows:2
† Original allocation of R633 055 000 plus
† Additional approved amount of R215 275 000 equals
† Total Approved Expenditure R848 330 000 plus
† Unauthorised over-expenditure of R122 000 000 equals
† Total Cost R970 330 000
Based on these figures, an initial comparison of the costs of Census 1996 and Census 2001
suggests an alarming increase in the cost of census-taking, from R408 million to R970
million. Indeed, at one level Census 2001 could be accused of having massively exceeded
the original allocation of R490,5 million (in 1999 Rand), while at the very least the Census
incurred an unauthorised over-expenditure equal to 14 per cent of the approved allocation.
However, a number of adjustments can legitimately be argued for if a true picture is to be
derived of the census costs (Riche, 1997). These include taking account of inflation,
population growth and changes in household structure.
After these adjustments Table 1 suggests that the increase in costs between the two
Censuses may be less worrisome.3
Using estimates corrected for inflation prepared by Stats SA, the cost per person increased
from R17.96 in 1996 to R22.03 in 2001, while the cost per household enumerated
increased from R80.10 to R84.36. This was caused by a substantial decline in average
household size between 1996 and 2001, and hence a greater than expected increase in
the number of households that had to be visited. The data in the table thus suggest a
real increase in census costs of R258 million, equal to 35 per cent of the total Census
1996 cost expressed in 2001 prices, but only some 5 per cent of the per household cost.
2A spreadsheet provided by Stats SA will be used for analysing the breakdown of expenditure incomparison to the budgeted amounts (Scott, 2003; Stats SA, nd, a). Thus all analysis at the line itemlevel sums to R968,9 million. During the time of the Census planning and implementation, theSouth African Rand experienced substantial fluctuation against most major currencies, althoughat the time of writing the exchange rate is approximately R6:$1.3The adjusted population and household figures have been used. Prices were corrected by Stats SA,using the Consumer Price Index (De Beer, 2003). This is a still a somewhat crude estimate, as theprices of different components of the Census would have increased at different rates, and a substan-tial proportion of Census costs were absorbed by wages and the cost of hiring professional services.In addition, the currency fluctuations over the period of the census would have affected the cost ofimported goods and services. Finally, as De Beer comments, in Census 1996 Stats SA administeredan amount of R100 million for aerial photography on behalf of the Independent Electoral Commis-sion. This amount was included as part of the main budget in Census 2001, and it is not clearwhether the amount has been allocated to the costs.
218 J May & P Lehohla
Dow
nloa
ded
by [
Uni
vers
ity o
f G
lasg
ow]
at 1
5:46
19
Dec
embe
r 20
14

3.2 Allocation of resources
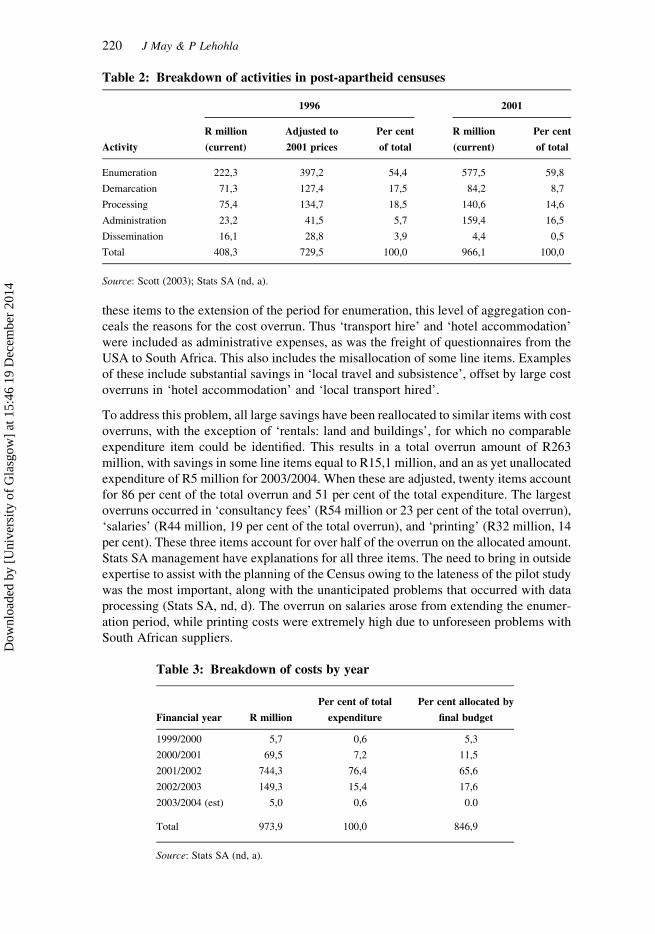
Turning to a comparison of the cost breakdowns of Census 1996 and Census 2001,
Table 2 shows comparable activities and their final cost.
These figures show that the total amount, and the proportion, of resources allocated to
enumeration increased between 1996 and 2001, while cost savings equal to some R43
million were incurred in the demarcation process. To some extent this represents the
investments made in improved mapping and demarcation in 1996 and is hopefully
indicative of savings that are possible in future census-taking from such investment in
knowledge infrastructure. Savings were also achieved in data processing as a proportion
of the total, although it seems likely that some costs may have been categorised differ-
ently in 1996 and 2001, given the apparent increase in the proportion of resources
expended on administration. Finally, a significantly smaller proportion of expenditure
was allocated to dissemination activities in 2001 than had been done in 1996, although
this is partly because Census 2001 shows the breakdown of expenditure over the five
years of Census activity.
As might be expected, the financial year of the Census (2001/2002) absorbed 76 per cent
of all funds utilised over the 5 years in which costs have been incurred. However, when
the budget is re-estimated eliminating funds rolled over into later years, the initial expen-
diture in the first year of the Census process was one tenth the amount budgeted for. This
supports an important reason given by Stats SA officials for the problems experienced by
the Census: that the initial allocation was insufficient to undertake a census, which
delayed planning activities and affected the measures that were to have been
implemented to reduce census costs (Stats SA, nd, d).
3.3 Detailed budget breakdown
Table 4 refers to the period from 1999 to the end of the 2003 financial year and indicates
the broad categories of expenditure compared to the amounts that had been budgeted in
the revised allocation for these categories.4 The table also shows the variance between
allocation and actual expenditure.
Immediately apparent from this table are the large cost overruns in personnel expenditure
(R63 million or 24 per cent of the total overrun), administrative expenditure (R52 million
or 20 per cent of the total overrun) and professional services (R98 million or 25 per cent
of the total amount of R263 million). While Stats SA management ascribe the first of
Table 1: Per capita cost of post-apartheid censuses
Census 1996 Census 2001
Real cost R729 million R987 million
Population 40,6 million 448 million
Households 9,1 million 11,7 million
Cost per capita R17.96 R22.03
Cost per household R80.10 R84.36
Source: Stats SA (nd,a); authors’ calculations.
4It must be noted that the approved allocation was actually R848,3 million and that this table doesnot represent unapproved over-expenditure. However, a detailed budget for this amount was notavailable.
South Africa’s Census 2001 219
Dow
nloa
ded
by [
Uni
vers
ity o
f G
lasg
ow]
at 1
5:46
19
Dec
embe
r 20
14
these items to the extension of the period for enumeration, this level of aggregation con-
ceals the reasons for the cost overrun. Thus ‘transport hire’ and ‘hotel accommodation’
were included as administrative expenses, as was the freight of questionnaires from the
USA to South Africa. This also includes the misallocation of some line items. Examples
of these include substantial savings in ‘local travel and subsistence’, offset by large cost
overruns in ‘hotel accommodation’ and ‘local transport hired’.
To address this problem, all large savings have been reallocated to similar items with cost
overruns, with the exception of ‘rentals: land and buildings’, for which no comparable
expenditure item could be identified. This results in a total overrun amount of R263
million, with savings in some line items equal to R15,1 million, and an as yet unallocated
expenditure of R5 million for 2003/2004. When these are adjusted, twenty items account
for 86 per cent of the total overrun and 51 per cent of the total expenditure. The largest
overruns occurred in ‘consultancy fees’ (R54 million or 23 per cent of the total overrun),
‘salaries’ (R44 million, 19 per cent of the total overrun), and ‘printing’ (R32 million, 14
per cent). These three items account for over half of the overrun on the allocated amount.
Stats SA management have explanations for all three items. The need to bring in outside
expertise to assist with the planning of the Census owing to the lateness of the pilot study
was the most important, along with the unanticipated problems that occurred with data
processing (Stats SA, nd, d). The overrun on salaries arose from extending the enumer-
ation period, while printing costs were extremely high due to unforeseen problems with
South African suppliers.
Table 2: Breakdown of activities in post-apartheid censuses
1996 2001
Activity
R million
(current)
Adjusted to
2001 prices
Per cent
of total
R million
(current)
Per cent
of total
Enumeration 222,3 397,2 54,4 577,5 59,8
Demarcation 71,3 127,4 17,5 84,2 8,7
Processing 75,4 134,7 18,5 140,6 14,6
Administration 23,2 41,5 5,7 159,4 16,5
Dissemination 16,1 28,8 3,9 4,4 0,5
Total 408,3 729,5 100,0 966,1 100,0
Source: Scott (2003); Stats SA (nd, a).
Table 3: Breakdown of costs by year
Financial year R million
Per cent of total
expenditure
Per cent allocated by
final budget
1999/2000 5,7 0,6 5,3
2000/2001 69,5 7,2 11,5
2001/2002 744,3 76,4 65,6
2002/2003 149,3 15,4 17,6
2003/2004 (est) 5,0 0,6 0.0
Total 973,9 100,0 846,9
Source: Stats SA (nd, a).
220 J May & P Lehohla
Dow
nloa
ded
by [
Uni
vers
ity o
f G
lasg
ow]
at 1
5:46
19
Dec
embe
r 20
14

Other items are however problematic, such as the R18 million expenditure on telephones
and cell-phones, 35 times more than the R0,5 million that was budgeted for this line item.
Overall, a comparison between the detailed allocation and actual expenditure shows that
actual expenditure was more than double the budgeted amounts for 53 of the 161 expen-
diture items, while there was no budget for another 72 items.
Some comparison is possible with Census 1996, and De Beer (2003) estimates that real
expenditure on equipment in 2001 prices increased from R33 million in Census 1996 to
R98 million for Census 2001, reflecting both the increased cost of capital goods and an
investment for Stats SA. Personnel costs also increased from R403 million to R436
million. However, the largest increase was on professional services, which increased
six-fold, from R34 million in 1996 to R189 million in 2001.
3.4 Comparison with best practice
International comparison of best practice in census-taking may be of limited value
because the environment for the collection of information varies widely, as do issues
of the quality and depth of the census (Alam, 2001: 1). In addition to the inherent pro-
blems, the period over which Census 2001 was planned and implemented was one of
extreme exchange-rate uncertainty, in which the value of the South African Rand fell
from ZAR5.53 to the US dollar during the period of project planning to ZAR9.27
when enumeration started in October 2001, reached ZAR13.85 in December 2001 as
data processing began, and returned to ZAR10.33 one year later, in 2002 (SARB Quar-
terly Bulletin, 2002). Nonetheless, a rough attempt to convert the Census 2001 cost in
each year to US dollars, using the weighted average of bank daily rates provided by
the Reserve Bank, suggests that the Census cost some US$112,3 m. This is
US$16,5 m more that the estimate reported by the United Nations Population Fund
(UNFPA) in September 2000 (UNFPA, 2000: 50), and gives a per capita cost of
$2.51. An even rougher attempt to estimate the cost of Census 1996 in US dollars
gives a per capita cost of $2.82 per person at the prevailing exchange rate and prices
in 1996, suggesting that Census 2001 may have actually cost less per person in dollar
terms than did Census 1996 (authors’ calculations). While at the upper end of the
Table 4: Categories of expenditure
Item
Final
allocation
(R)
Expenditure
1999–2003
(R)
Variance
(R)
Variance as
per cent of
allocation
Per cent of
total
variance
Personnel 78 522 395 141 876,346 (63 353 951) 80,7 24,1
Administrative 90 731 777 143 447,778 (52 716 002) 58,1 20,0
Inventory 58 353 815 98 015 125 (39 661 310) 68,0 15,1
Equipment 76 905 356 90 729 514 (13 824 158) 18,0 5,2
Buildings 13 459 111 539 863 12 919 248 96,0 24,9
Professional services 392 556 646 491 304 364 (98 747 718) 25,2 37,5
Miscellaneous 41 628 3 008 756 (2 967 128) 7 127,7 1,1
Not yet allocated na 5 000 000 na na 1,9
Total 710 570 728 973 921 746 (263 351 018) 37,1 100,0
Source: Scott (2003); authors’ calculations.
South Africa’s Census 2001 221
Dow
nloa
ded
by [
Uni
vers
ity o
f G
lasg
ow]
at 1
5:46
19
Dec
embe
r 20
14
scale of census-taking in African countries, this seems comparable to countries such as
Mauritius ($2.06) and Zambia ($1.83) (Anon, nd) and is well below figures estimated for
Australia ($6.69), the United Kingdom ($5.59) and the USA ($22.25) (Ngwenya,
2002:4). However, it must be remembered that along with Japan, Turkey, Australia
and Canada, South Africa has been one of the small number of countries with popu-
lations of more than 10 million that undertake a census every five years, thereby doubling
the cost census-taking each decade.
4. WHAT WERE THE REASONS FOR THE COST OVERRUNS?
Reasons for the cost overruns extend across a range of issues, some of which may have
been foreseeable. Some relate to the increasing costs of census-taking observed interna-
tionally, while others are difficult to account for in a review of this nature and are best
dealt with through normal public accounting procedures.
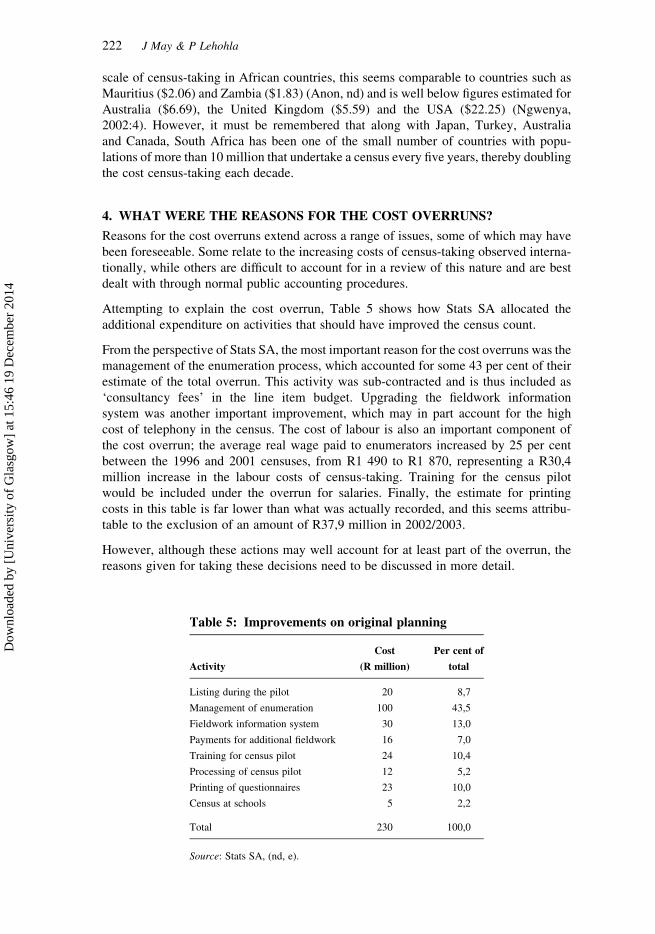
Attempting to explain the cost overrun, Table 5 shows how Stats SA allocated the
additional expenditure on activities that should have improved the census count.
From the perspective of Stats SA, the most important reason for the cost overruns was the
management of the enumeration process, which accounted for some 43 per cent of their
estimate of the total overrun. This activity was sub-contracted and is thus included as
‘consultancy fees’ in the line item budget. Upgrading the fieldwork information
system was another important improvement, which may in part account for the high
cost of telephony in the census. The cost of labour is also an important component of
the cost overrun; the average real wage paid to enumerators increased by 25 per cent
between the 1996 and 2001 censuses, from R1 490 to R1 870, representing a R30,4
million increase in the labour costs of census-taking. Training for the census pilot
would be included under the overrun for salaries. Finally, the estimate for printing
costs in this table is far lower than what was actually recorded, and this seems attribu-
table to the exclusion of an amount of R37,9 million in 2002/2003.
However, although these actions may well account for at least part of the overrun, the
reasons given for taking these decisions need to be discussed in more detail.
Table 5: Improvements on original planning
Activity
Cost
(R million)
Per cent of
total
Listing during the pilot 20 8,7
Management of enumeration 100 43,5
Fieldwork information system 30 13,0
Payments for additional fieldwork 16 7,0
Training for census pilot 24 10,4
Processing of census pilot 12 5,2
Printing of questionnaires 23 10,0
Census at schools 5 2,2
Total 230 100,0
Source: Stats SA, (nd, e).
222 J May & P Lehohla
Dow
nloa
ded
by [
Uni
vers
ity o
f G
lasg
ow]
at 1
5:46
19
Dec
embe
r 20
14
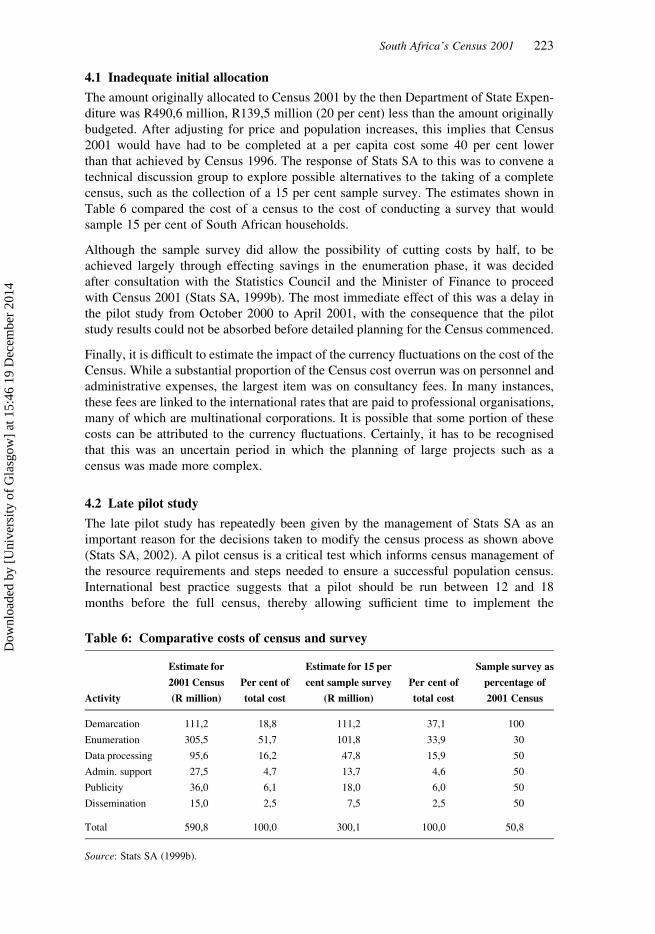
4.1 Inadequate initial allocation
The amount originally allocated to Census 2001 by the then Department of State Expen-
diture was R490,6 million, R139,5 million (20 per cent) less than the amount originally
budgeted. After adjusting for price and population increases, this implies that Census
2001 would have had to be completed at a per capita cost some 40 per cent lower
than that achieved by Census 1996. The response of Stats SA to this was to convene a
technical discussion group to explore possible alternatives to the taking of a complete
census, such as the collection of a 15 per cent sample survey. The estimates shown in
Table 6 compared the cost of a census to the cost of conducting a survey that would
sample 15 per cent of South African households.
Although the sample survey did allow the possibility of cutting costs by half, to be
achieved largely through effecting savings in the enumeration phase, it was decided
after consultation with the Statistics Council and the Minister of Finance to proceed
with Census 2001 (Stats SA, 1999b). The most immediate effect of this was a delay in
the pilot study from October 2000 to April 2001, with the consequence that the pilot
study results could not be absorbed before detailed planning for the Census commenced.
Finally, it is difficult to estimate the impact of the currency fluctuations on the cost of the
Census. While a substantial proportion of the Census cost overrun was on personnel and
administrative expenses, the largest item was on consultancy fees. In many instances,
these fees are linked to the international rates that are paid to professional organisations,
many of which are multinational corporations. It is possible that some portion of these
costs can be attributed to the currency fluctuations. Certainly, it has to be recognised
that this was an uncertain period in which the planning of large projects such as a
census was made more complex.
4.2 Late pilot study
The late pilot study has repeatedly been given by the management of Stats SA as an
important reason for the decisions taken to modify the census process as shown above
(Stats SA, 2002). A pilot census is a critical test which informs census management of
the resource requirements and steps needed to ensure a successful population census.
International best practice suggests that a pilot should be run between 12 and 18
months before the full census, thereby allowing sufficient time to implement the
Table 6: Comparative costs of census and survey
Activity
Estimate for
2001 Census
(R million)
Per cent of
total cost
Estimate for 15 per
cent sample survey
(R million)
Per cent of
total cost
Sample survey as
percentage of
2001 Census
Demarcation 111,2 18,8 111,2 37,1 100
Enumeration 305,5 51,7 101,8 33,9 30
Data processing 95,6 16,2 47,8 15,9 50
Admin. support 27,5 4,7 13,7 4,6 50
Publicity 36,0 6,1 18,0 6,0 50
Dissemination 15,0 2,5 7,5 2,5 50
Total 590,8 100,0 300,1 100,0 50,8
Source: Stats SA (1999b).
South Africa’s Census 2001 223
Dow
nloa
ded
by [
Uni
vers
ity o
f G
lasg
ow]
at 1
5:46
19
Dec
embe
r 20
14
lessons and shifts in direction, including the budgetary recalculations, indicated by the
outcomes of the pilot (Strengell, nd).
The pilot for Census 2001 was run in March 2001, less than seven months before the full
enumeration scheduled for October 2001. The key lessons from the pilot began emerging
ten days after field operations were concluded, before pilot questionnaires were pro-
cessed. Management, in anticipation of the impact of these lessons, immediately
began implementing the remedial actions listed above to resolve key deficiencies as it
could not wait for the detailed report that would only be tabled in September, a month
before enumeration was to begin.
Briefing the Statistics Council in April 2001, Stats SA managers concluded that the
Census management was in crisis mode well before the actual census-taking process,
and noted the following main concerns:
. No integration existed between the sub-projects of the census.
. The critical path required to implement the census was not being respected and dead-
lines were not adhered to nor regarded as priorities.
. The top management of Stats SA was in disarray, with inadequate internal communi-
cation and personality clashes.
Rather than delay the census, Stats SA announced that they intended implementing a
Nerve Centre which would ‘. . . develop, maintain and manage the big picture’. The
objective of the Nerve Centre was to bring together management and project managers
to make quick but informed decisions and to consolidate status reporting and progress
reporting. The Nerve Centre was also expected to consolidate communication between
the various individuals and groups. Central to the Nerve Centre was the decision to
source external expertise to provide us with additional management capacity. This
was largely through the appointment of consultants as project management specialists.
A number of other concerns were also identified:
. deficiencies in the budget and also with expenditure control
. inefficiencies with payments procedures, especially slow turnaround and access to
funds.
. inadequate audit trail processes and support systems.
In an attempt to overcome these problems it was proposed that the relationship between
financial management of the Census and the financial management of Stats SA as a
whole required clarification and that state accountants be appointed in each province.
The pilot study also showed that ratio of one supervisor to every ten enumerators had to
be revised to a ratio of one supervisor to every five enumerators. Assessment of the
quality of enumeration in the pilot census made it clear that increased supervision, for
a longer period of time, was essential to ensure an improvement in the quality of enumer-
ation, and hence in the quality of final census data.
Finally, it is worth noting that the pilot census document makes no mention of the project
costs of the census, although there is a heading on timelines and costs. Thus although the
pilot study did include data processing, severe problems that were later encountered with
the optical scanning activities were not identified, and data capture is barely mentioned in
the pilot study report.
224 J May & P Lehohla
Dow
nloa
ded
by [
Uni
vers
ity o
f G
lasg
ow]
at 1
5:46
19
Dec
embe
r 20
14
4.3 Extended enumeration
During the enumeration phase it became apparent that the time allocated for Census 2001
would have to be extended if the count was to be more complete. This had an obvious
impact upon the costs of salaries, as well as a more indirect impact on the costs of trans-
portation and administration. Although the extension should have minimised bias in the
Census, there were problems with the way in which these mop-up activities were under-
taken. In particular, because the mop-up was not anticipated, the logistics seem not have
been properly planned, monitored or documented. This problem was exacerbated when
the field workers went on strike because the payment sub-contractor failed to deliver.
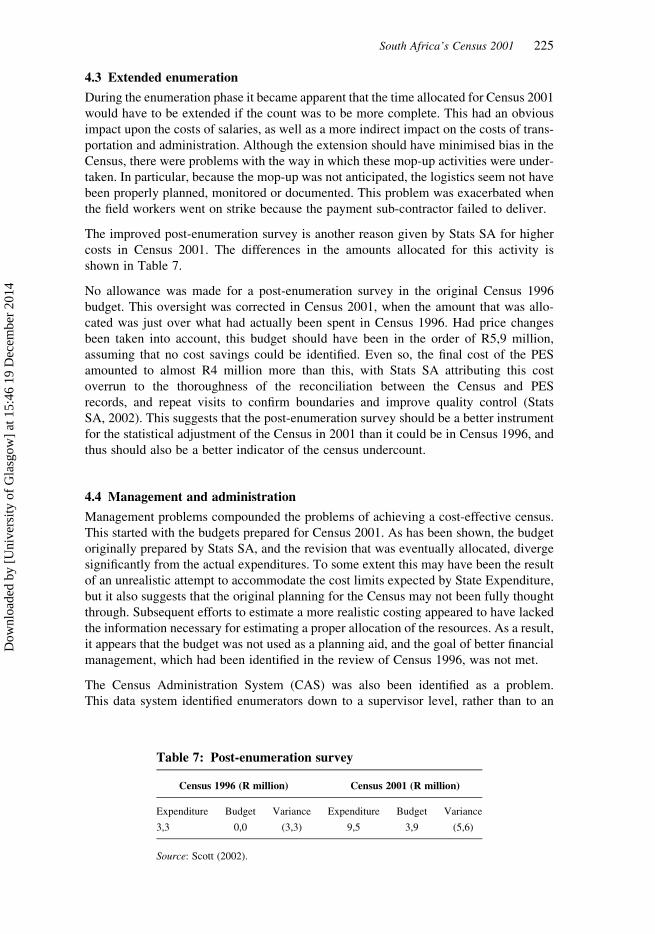
The improved post-enumeration survey is another reason given by Stats SA for higher
costs in Census 2001. The differences in the amounts allocated for this activity is
shown in Table 7.
No allowance was made for a post-enumeration survey in the original Census 1996
budget. This oversight was corrected in Census 2001, when the amount that was allo-
cated was just over what had actually been spent in Census 1996. Had price changes
been taken into account, this budget should have been in the order of R5,9 million,
assuming that no cost savings could be identified. Even so, the final cost of the PES
amounted to almost R4 million more than this, with Stats SA attributing this cost
overrun to the thoroughness of the reconciliation between the Census and PES
records, and repeat visits to confirm boundaries and improve quality control (Stats
SA, 2002). This suggests that the post-enumeration survey should be a better instrument
for the statistical adjustment of the Census in 2001 than it could be in Census 1996, and
thus should also be a better indicator of the census undercount.
4.4 Management and administration
Management problems compounded the problems of achieving a cost-effective census.
This started with the budgets prepared for Census 2001. As has been shown, the budget
originally prepared by Stats SA, and the revision that was eventually allocated, diverge
significantly from the actual expenditures. To some extent this may have been the result
of an unrealistic attempt to accommodate the cost limits expected by State Expenditure,
but it also suggests that the original planning for the Census may not been fully thought
through. Subsequent efforts to estimate a more realistic costing appeared to have lacked
the information necessary for estimating a proper allocation of the resources. As a result,
it appears that the budget was not used as a planning aid, and the goal of better financial
management, which had been identified in the review of Census 1996, was not met.
The Census Administration System (CAS) was also been identified as a problem.
This data system identified enumerators down to a supervisor level, rather than to an
Table 7: Post-enumeration survey
Census 1996 (R million) Census 2001 (R million)
Expenditure Budget Variance Expenditure Budget Variance
3,3 0,0 (3,3) 9,5 3,9 (5,6)
Source: Scott (2002).
South Africa’s Census 2001 225
Dow
nloa
ded
by [
Uni
vers
ity o
f G
lasg
ow]
at 1
5:46
19
Dec
embe
r 20
14
enumerator area level. This does not permit problems to be identified with data collection
at the appropriate unit of analysis, that is, at the point of collection. Instead, it is argued
that a CAS system will be needed, at least at the regional level, to provide this infor-
mation. This would show whether an enumerator had gone to the area allocated to
that person; whether the correct bar-coded questionnaires had been distributed and
returned; and whether enumeration and returns were proceeding as planned.
4.5 Procurement and consultant support
Despite the hoped-for improvements in administrative and project management capacity,
the pilot study highlighted the extreme fragility of both systems. Eventually resort was
made to consultants in the expectation that private sector efficiency would resolve the
problems. However, at R164 million, consultancy fees are the single largest variance
that diverges from any of the budgets prepared by Stats SA or approved by Treasury.
They thus require additional explanation. The responsibilities were spread between the
main suppliers as follows (Stats SA, nd, a):
† Project management 18 per cent
† Remuneration of enumerators: 8 per cent
† Processing of questionnaires 59 per cent
† Publicity 15 per cent.
Project management consultants were contracted to develop a census administration
system (CAS), which included management of the warehouse, packing, receiving
materials in each regional office, handling appointments, allocating people to areas at
a cost said to be R30 m. Human resource consultants were also subcontracted to
manage payments using the CAS and paid R16 million for this. The project managers
were also to ensure that accurate records of all financial transactions were kept, including
subcontracts. Information technology consultants were to take responsibility for the
design of the ‘intelligent’ automation system and the subsequent data processing on
this system.
The initial tender document for data processing was clear about the tasks expected of the
successful supplier. These were:
. check-in and tracking of census questionnaires
. the efficient extraction of data from Census 2001 and Post-Enumeration Survey ques-
tionnaires and images
. efficient operation of data capture and quality assurance procedures, within defined
intermediate processing milestones for zero backlog, and predictable time frames
. ease of technology upgrade, compatibility with modern software and hardware designs
used by Stats SA
. remote and automated access to the major subsystems for data processing which
would permit status monitoring, quality control and performance management.
The data processing problems that actually occurred included incorrect identification of
the hardware required to complete the task, inappropriate tracking and data quality
procedures and the use of proprietary software that Stats SA were unable to adapt to
meet their specific needs. These problems placed unexpected pressure upon Stats SA
managers and technicians, who had to work with the consultants to find solutions to
the scanning and validation problems. This represents a substantial and hidden cost of
Census 2001 that also detracted from the other activities of Stats SA.
226 J May & P Lehohla
Dow
nloa
ded
by [
Uni
vers
ity o
f G
lasg
ow]
at 1
5:46
19
Dec
embe
r 20
14
A number of other procurement problems were identified of which the most costly
related to the printing of the census questionnaire. Timely delivery of questionnaires,
in adequate numbers, and to the quality appropriate for scanning technologies, was a
critical deliverable for the success of Census 2001. When it emerged that the only
local supplier able to print questionnaires to specification was falling behind schedule,
and that there were questions over print quality, it became necessary to seek and alterna-
tive for the balance of questionnaire printing. In addition, when the finalisation of the
GIS project indicated that the number of enumerator areas defined had increased from
the projected 70 000 to 81 000, it became necessary to increase the print order for ques-
tionnaires. The financial implications of this involved both the increased costs of printing
(R30 million) and the cost of transporting questionnaires from the United States, where a
supplier that could meet these criteria could be sourced, to South Africa (R10 million).
The overall financial implication estimated by Stats SA was therefore R40 million.
Having discussed and compared the cost of Census 2001, and reviewed the reasons
given for the significant cost overrun, it remains to briefly consider the benefits of the
census-taking.
5. WHAT ARE THE BENEFITS OF THE CENSUS?
In addition to the value generated by census-taking when put to use for decision making,
planning and the allocation of public and private sector resources, benefits flowing from
census-taking include the immediate impact of the jobs that are created and equipment
that is acquired, the research and development activities made during and after the census
process which constitute an investment in ‘knowledge capital’.
5.1 Planning and resource allocation
Counting the population is important for planning in its own right, especially in the context
of the system of provincial governance that characterises South Africa. The most obvious
reason for undertaken a census is then for improved planning and resource allocation
through the formulation and evaluation of policies and interventions. This not only
affects public sector resources since the private sector also makes extensive use of the
census. This is the major contribution of most census that are undertaken, and in the
United Kingdom, it is estimated that the census costs less than one twentieth of one per
cent of the total amount of public resources allocated over a ten-year period on the evidence
that it provides (UK Parliament, 2001). Other planning benefits that rely upon an accurate
census include elections planning such as the demarcation for elections, and the multi-
billion private sector advertising sector. Census data are also used as the dominator in
most monitoring indicators used in assessing coverage or the attainment of targets.
The allocation of resources between provinces is one of the most important aspects of
this usage given the structure of federal government in South Africa, and amounts to esti-
mated R600 billion over the five-year period between census years (Republic of South
Africa, 2003 and authors’ calculations). Viewed in this way, the cost of the census is
less than one-sixth of one per cent of the value of just one component of public sector
allocation that relies upon an accurate count for their allocation. Calculated over a
ten-year period, this percentage seems comparable to that estimated by the UK National
Statistician to the UK Parliament.
Maximising the return on a census requires more than simply the use of the population
count in the allocation of national revenue and includes the other information that is
collected during enumeration. In this regard, the South African Census 2001 was a
South Africa’s Census 2001 227
Dow
nloa
ded
by [
Uni
vers
ity o
f G
lasg
ow]
at 1
5:46
19
Dec
embe
r 20
14
comparative lengthy questionnaire comprising questions on 45 population items, and 75
questions in total. This needs to be compared to Census 1996 (65 questions), the 2001
Census in the United Kingdom (41 questions), and to censuses in Kenya (20 population
items), Zambia (30 population items) and Tanzania (23 population items) (Anon, nd, 3).
Accurate and accessible census results and adequate information with which these results
can be projected between census years are thus central to proper planning and resource
allocation in South Africa. Estimating the benefits that result is difficult since the cost of
error is enormous both in financially and politically. Even recognising that any census
result will contain a margin of error, even flawed information allows for more objective
and transparent allocation of public resources if there is agreement over the extent and
distribution of error. Wide dissemination is required through which greater awareness
of Census products can be achieved, along with greater usage of the different results
with hopefully an enhanced impact on the quality of life of South Africans.
5.2 Employment creation
Although not a direct intention of most census-taking, job creation has been catered for in
both of the post-apartheid censuses. By trying to include as many educated but unem-
ployed people into demarcation, enumeration and processing activities, this aspect of
the Census can be thought of as a large scale public works programme that has the poten-
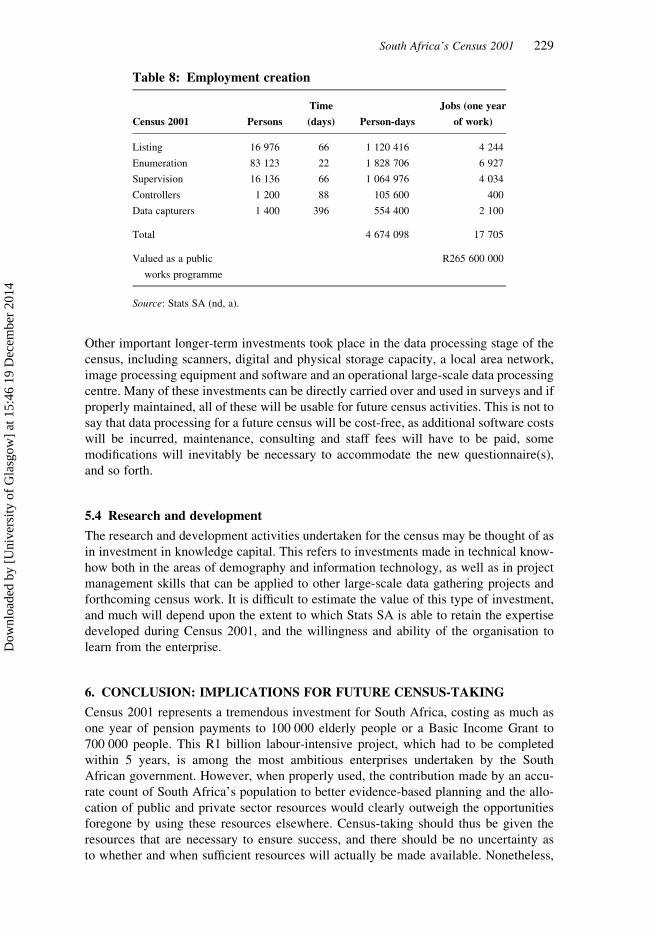
tial to create jobs in the services sector. Table 8 shows that over 4,5 million person-days
of work were created in short-term contract appointments during Census 2001, equal to
just over 17 000 jobs (person-years of work).
Using the conventional public works programme, it can be estimated that job creation of
this scale would have cost R265,6 million.5 This is an improvement on the employment
creation achieved during Census 1996 which can be estimated to have created 11 000
jobs that would have required R159 million in 2001 prices, if valued as a public
works programme.
5.3 Knowledge infrastructure
The technical, administrative and physical capacity of the census-taking organisation is
an important issue that has to be taken into consideration when assessing the investment
component of Census 2001 costs. This improvement in South Africa’s knowledge
infrastructure includes investments made in new equipment and procedures, electronic
information systems and the skills of Stats SA staff. The aerial photography, demarcation
and GIS activities undertaken for the census are another potentially useful resource to the
Independent Electoral Commission, as were these activities in Census 1996.
The automated geographic dictionary that has been established using these data is an
important investment for future census work, other surveys, and potentially the activities
of other government departments that will be brought into a national statistical system
over time. In addition, electronic dictionaries on occupations and industry have been
established along with the intelligent electronic recognition procedures required to
build further dictionaries. Finally the equipment, procedures and programmes are in
place for future censuses or other data collection activities. Indeed, Stats SA manage-
ment are of the opinion that only Australia has reached South Africa’s level of develop-
ment in electronic dictionaries for census data processing (Stats SA, 2002).
5Estimate based on public works wages plus administrative cost taken from McCord (2002).
228 J May & P Lehohla
Dow
nloa
ded
by [
Uni
vers
ity o
f G
lasg
ow]
at 1
5:46
19
Dec
embe
r 20
14
Other important longer-term investments took place in the data processing stage of the
census, including scanners, digital and physical storage capacity, a local area network,
image processing equipment and software and an operational large-scale data processing
centre. Many of these investments can be directly carried over and used in surveys and if
properly maintained, all of these will be usable for future census activities. This is not to
say that data processing for a future census will be cost-free, as additional software costs
will be incurred, maintenance, consulting and staff fees will have to be paid, some
modifications will inevitably be necessary to accommodate the new questionnaire(s),
and so forth.
5.4 Research and development
The research and development activities undertaken for the census may be thought of as
in investment in knowledge capital. This refers to investments made in technical know-
how both in the areas of demography and information technology, as well as in project
management skills that can be applied to other large-scale data gathering projects and
forthcoming census work. It is difficult to estimate the value of this type of investment,
and much will depend upon the extent to which Stats SA is able to retain the expertise
developed during Census 2001, and the willingness and ability of the organisation to
learn from the enterprise.
6. CONCLUSION: IMPLICATIONS FOR FUTURE CENSUS-TAKING
Census 2001 represents a tremendous investment for South Africa, costing as much as
one year of pension payments to 100 000 elderly people or a Basic Income Grant to
700 000 people. This R1 billion labour-intensive project, which had to be completed
within 5 years, is among the most ambitious enterprises undertaken by the South
African government. However, when properly used, the contribution made by an accu-
rate count of South Africa’s population to better evidence-based planning and the allo-
cation of public and private sector resources would clearly outweigh the opportunities
foregone by using these resources elsewhere. Census-taking should thus be given the
resources that are necessary to ensure success, and there should be no uncertainty as
to whether and when sufficient resources will actually be made available. Nonetheless,
Table 8: Employment creation
Census 2001 Persons
Time
(days) Person-days
Jobs (one year
of work)
Listing 16 976 66 1 120 416 4 244
Enumeration 83 123 22 1 828 706 6 927
Supervision 16 136 66 1 064 976 4 034
Controllers 1 200 88 105 600 400
Data capturers 1 400 396 554 400 2 100
Total 4 674 098 17 705
Valued as a public
works programme
R265 600 000
Source: Stats SA (nd, a).
South Africa’s Census 2001 229
Dow
nloa
ded
by [
Uni
vers
ity o
f G
lasg
ow]
at 1
5:46
19
Dec
embe
r 20
14
as Ngwenya (2002: 4) has asked, ‘. . . does adequate funding guarantee good census
results?’ In reviewing international evidence, and using undercount as a measure of
success, he concludes that although the evidence is mixed, ‘. . . it is critically important
that adequate funding for such a massive and complex operation be secured’.
The evaluation of Census 2001 conducted by the Statistics Council concluded that
the count was adequate for most planning purposes, although the final figures concealed
a number of compensating distortions in the composition of gender, age and population
group. In fact, a special warning was given concerning the accuracy of the labour market
information (Statistics Council, 2003). An under-count of 16 per cent eventually
emerged from the census, which is well above what is deemed acceptable by
Ngwenya (2001).
That unauthorised over-expenditure of R122 million occurred is of concern, as is the fact
that Census 2001 cost at least R50 million (7 per cent) more than Census 1996, even
when all possible adjustments are made to allow for price increases, changes in house-
hold structure and population growth. Perhaps even more worrying is why, in its own
budget, Stats SA initially anticipated that the cost per person of the count would
decline from R18 to just under R14, without making any adjustment for price
changes, at a time when international evidence had overwhelmingly indicated that the
costs of census-taking had increased (Alam, 2001; Leete, 2001; UK Parliament,
2001). While some of this has to do with inadequate planning in the initial budgeting
of the Census, the ethos of tight fiscal discipline that prevailed in the late 1990s is
also likely to have played a part. It is now hoped that down-sizing, to the detriment of
right-sizing, has been recognised as a hindrance to the production of accurate and
timely official statistics. Moreover, the experience of the two post-apartheid censuses
should mean that better information is now available for future planning.
In two areas at least, the cost overruns of Census 2001 are of concern. The first relates to
the extremely high costs of communication and co-ordination. The second relates to the
reliance upon costly private sector suppliers (R164 million, equal to 17 per cent of the
total cost of the census), and what seems to be largely disappointing delivery by some
of these suppliers. Such reliance will need to be carefully reviewed in future. Census
planning, just as census-taking, may well be one of the activities best left in the hands
of the official statistics agency supported by its own skilled project managers.
Another concern is that not all the learning gained from Census 1996 seems actually to
have been absorbed. The events of the last decade of apartheid government, and the tre-
mendous changes that occurred during the 1990s, meant that census-taking in 1996
required new institutional capacities. This should have created some form of basis on
which Census 2001 could have been built, even though there was a high turnover of
staff between the two Censuses. However, administrative systems were still inadequate,
senior officials remained deeply involved in detailed planning and day-to-day manage-
ment, the procurement of services was again a problem, and the breadth of information
collected by the Census again introduced additional complexity. The suggestion of using
‘intelligent’ automation for data processing was taken up in Census 2001, although the
anticipated cost savings did not emerge. All of the above were compounded by the initial
uncertainty over the resources that were available. Yet the wide divergence between the
planned expenditure and actual expenditure suggests that these problems would still have
emerged, even if the Department of State Expenditure had agreed to the initial budget.
Solving the problem of planning, learning from Census 2001, and ensuring that the
230 J May & P Lehohla
Dow
nloa
ded
by [
Uni
vers
ity o
f G
lasg
ow]
at 1
5:46
19
Dec
embe
r 20
14
skills to manage a public enterprise of this scale are in place, must be given high priority
if future census-taking is to be cost-effective and the considerable investment in physical
and knowledge capital is to be realised.
If savings are to be achieved in future census-taking, it will be important to know how to
contain the costs of census management activities. In 2001 some of the costs incurred
may have been worth while, in that consultants were successfully used to manage the
distribution and collection of the census forms. Other costs, such as those for payment
and recruitment of staff, and for the design of the data-processing procedures, seem to
have been less well handled. Finally, the management tasks involved in a census must
not be underestimated, and these call for far more than technical or statistical skills.
Aptly compared to a vast oil tanker that once set in motion can only stop when the
data are finally released, census-taking is no place for crisis management.
REFERENCES
ALAM, I, 2001. A critical appraisal of census costs. Paper presented to the UNFPA/
Paris 21 International Expert Group Meeting on Mechanisms for Ensuring Continuity
of 10-year Population Censuses: Strategies for Reducing Census Costs, Pretoria,
26–30 November.
ANON, nd. Comparison of questionnaire items and processing from recent African
censuses. Unpublished memo.
DE BEER, J, 2003. Comparisons at constant prices. Memo to Pali Lehohla, 11 March.
Unpublished.
DIOP, L, 2001. Organisation and financing of population censuses in sub-Saharan
Africa: problems and prospects. Paper presented to the Symposium on Global Review
of 2000 Round of Population and Housing Censuses: Mid-Decade Assessment and
Future Prospects, New York, 7–10 August.
EDMONSTON, B & SCHULTZE, C, 1995. Modernizing the US Census. Washington
DC: National Academy Press.
HOLT, T & DIAMOND, I, 2001. Risk in official statistics: a case study of the 2001 one-
number census project. The Statistician 50(4), 441–56.
LEETE, R, 2001. Funding crisis in the 2000 round of population censuses. Paper
presented to the UNFPA/Paris 21 International Expert Group Meeting Mechanism for
Ensuring Continuity of 10 Year Population Censuses: Strategies for Reducing Census
Costs, Pretoria, 26–30 November, 2001.
MCCORD, A, 2002. Indicative fiscal estimates – public works programming,
South Africa. Mimeograph. Public Works Research Project, University of Cape Town.
Unpublished.
NGWENYA, L, 2002. International lessons on the evaluation of population censuses.
South African Statistics Council Census Sub-Committee document, CSC-03-02.
Pretoria: South African Statistics Council.
REPUBLIC OF SOUTH AFRICA, 2003. Budget Review 2003. Pretoria: National Treasury.
RICHE, MF, 1997. Should the Census Bureau use ‘statistical sampling’ in Census 2000?
Insight, 18 August.
SCOTT, M., 2003. Julian May 03062003. Excel spreadsheet. Unpublished.
SIMPSON, L, 2001. Editorial: UK Census 2001 – progress and promise, Journal of the
Royal Statistical Association, 164(3), 423–5.
SOUTH AFRICAN RESERVE BANK (SARB), 2002. Quarterly Bulletin, December.
South Africa’s Census 2001 231
Dow
nloa
ded
by [
Uni
vers
ity o
f G
lasg
ow]
at 1
5:46
19
Dec
embe
r 20
14
STATISTICS COUNCIL, 2003. Statement by the Statistics Council on Census
2001. Available online at: http://www.statssa.gov.za/SpecialProjects/Census2001/
HTML/Stats_Council_Statement.pdf
STATS SA, 1999a. Census 2001: users’ workshop. Technical Discussion Document, 21
July 1999. Word Document. Unpublished.
STATS SA, 1999b. Census options for TDD. Word document. Unpublished.
STATS SA, 2002. Financial management: inputs for 10-point discussion with Minister
on Tuesday 17 September 2002. Word document. Unpublished.
STATS SA, nd, a. Census 2001: comparison of original budget estimates, original
budget allocations, and actual expenditure, 1999–2000, 2000–2001, 2001–2002.
Word document. Unpublished.
STATS SA, nd, b. Budget: Finance Minister. Excel workbook. Unpublished.
STATS SA, nd, c. Census 2001: activity costing, 2000–2002. Excel workbook.
Unpublished.
STATS SA, nd, d. Census budget, SG discussion with Minister. Excel workbook.
Unpublished.
STATS SA, nd, e. Census cost improvements: cost implications. Word document.
Unpublished.
STRENGELL, G., nd. How and why a pilot census? Draft I, internal Stats SA memo.
Unpublished.
UNITED KINGDOM PARLIAMENT, 2001. The need for a census. Select Committee
on Treasury, First Report. Available online at: http://www.parliament.the-stationery-
office.co.uk/pa/cm200102/cmtreasy
UNITED NATIONS POPULATION FUND (UNFPA), 2000. Compendium of census
activities in sub-Saharan Africa for the 2000 round of Censuses. Africa Division
Report. New York: UNFPA.
232 J May & P Lehohla
Dow
nloa
ded
by [
Uni
vers
ity o
f G
lasg
ow]
at 1
5:46
19
Dec
embe
r 20
14