counting the cost: impact of invasive animals in australia, 2004 · 2014-10-12 · counting the...
TRANSCRIPT
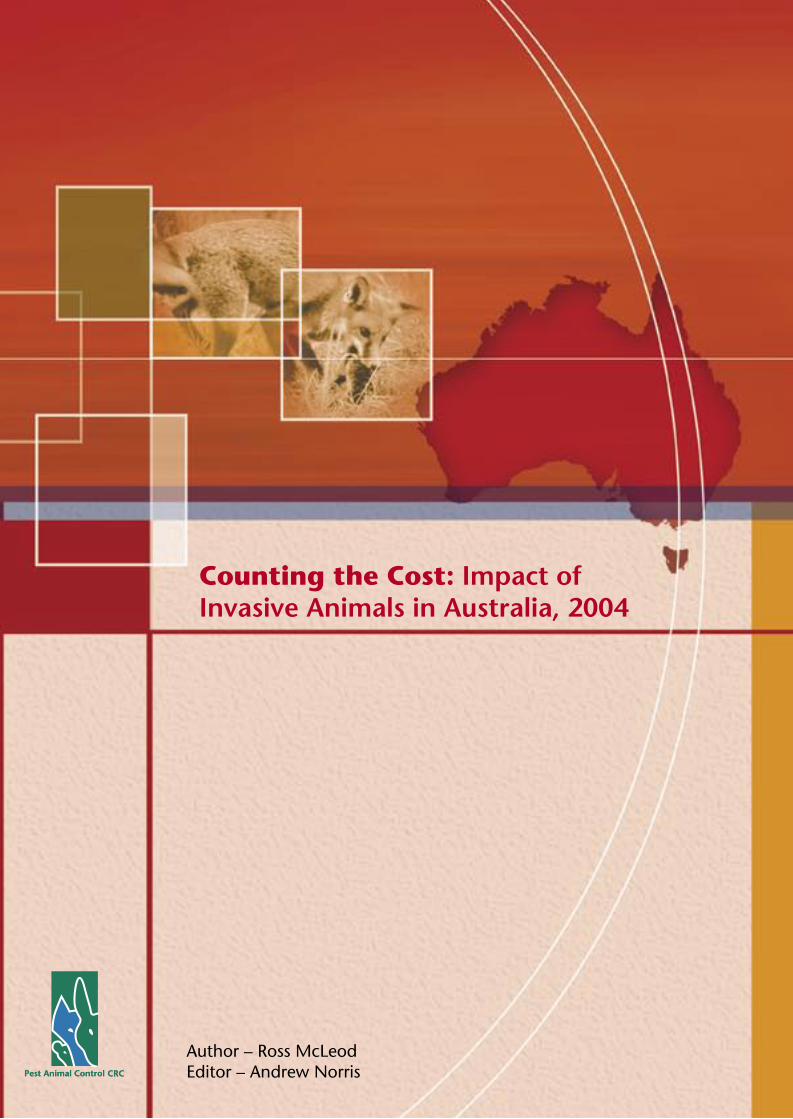
Counting the Cost: Impact ofInvasive Animals in Australia, 2004
Author – Ross McLeodEditor – Andrew Norris
Pest Animal Control Cooperative Research Centrec/ – CSIRO Sustainable EcosystemsBarton Highway Crace Canberra ACT AustraliaGPO Box 284 Canberra ACT 2601 AustraliaPhone: + 61 2 6242 1768Fax: + 61 2 6242 1511Email: office@pest animal.crc.org.auWeb: www pestanimal.crc.org.au
Co
un
ting
the C
ost: Im
pact of In
vasive An
imals in
Australia, 2004
Counting the Cost: Impact of Invasive Animals in Australia, 2004
Author – Ross McLeodEditor – Andrew Norris
Counting the Cost: Impact of Invasive Animals in Australia, 2004
© Cooperative Research Centre for Pest Animal Control.
ISBN 0-9750979-2-X
This work is copyright. The Copyright Act 1968 permits fair dealing for study, research, news reporting,criticism or review. Selected passages, tables or diagrams may be reproduced for such purposes providedacknowledgement of the source is included. Major extracts of the entire document may not be reproducedby any process.
Published by the Cooperative Research Centre for Pest Animal Control.
http://www.pestanimal.crc.org.au/
Further copies may be requested from the Cooperative Research Centre for Pest Animal Control, GPO Box 284, Canberra ACT 2601.
This publication should be cited as:McLeod, R. (2004) Counting the Cost: Impact of Invasive Animals in Australia 2004. Cooperative ResearchCentre for Pest Animal Control. Canberra.
April 2004
Foreword
FOREWORDEvery Australian knows that invasive animals cause economic and environmentalproblems. We are taught at school that rabbits were “the grey blanket” over thecountry after the second world war and that one of the great achievements of theCSIRO was to deliver an (almost) knockout blow to the pest. Indeed myxomatosismay well be the best known animal disease amongst Australians.
In my role leading the Pest Animal Control Cooperative Research Centre, I oftenrefer to the three “C’s” meaning cats, cane toads and carp. The mere mention ofthese seem to ignite strong passion in many people, making me believe that thesocial impact of invasive animals has received little attention. When I take someoneinto our Centre’s animal house, I can tell immediately if they’ve lived through a mouse plague by the shudder that the smell brings on. Wool producers tell heart wrenching stories about dog and fox attacks.
But while most people acknowledge the impact of invasive animals, to date we’ve had relatively littleinformation on the overall impact on our economy, our environment and our society. This report, Countingthe Cost: Impact of invasive animals in Australia 2004, is intended to give us a starting point for documentingthe impact of invasive animals and its results are quite staggering: at least a $700 million annual impact onAustralia.
It is important to point out several things about the report:1. It is not exhaustive. Dr. McLeod was commissioned only to bring together existing information and
compile it in a consistent manner;2. It is conservative. An important term of reference to Dr. McLeod was that he must use the lowest
figure whenever a range estimate was provided in a cited report. We believe it is important to look at the impact of invasive animals, but not overstate or exaggerate the problem; and
3. It is transparent. All methodology is included in the report to enable others to build on it or too argue whether an impact is under or overstated.
The report therefore provides us with a springboard for looking at investments into invasive animalmanagement. It does not stand alone, but adds substantially to our ability to prioritise research, control andprevention strategies and to explain to the Australian public the ongoing impact of invasive animals. Thisreport is also useful in identifying knowledge gaps in the ability to quantify invasive animal damage, mostmarkedly in the areas of counting the environmental and social costs.
Finally, I would like to thank the large number of people that have made comments on the report during itsdevelopment. We have had the report extensively examined prior to publication and are grateful to thosethat provided additional papers, unpublished data and comments from the general to the specific.
Dr. Tony Peacock
CEO, Pest Animal Control CRC
Counting the Cost: Impact of Invasive Animals in Australia, 2004
eSYS DEVELOPMENT (www.esys.com.au) AND DR ROSS MCLEODThe consulting firm eSYS Development Pty Limited was commissioned by the Pest Animal CRC to supplyDr Ross McLeod ([email protected]) as the pest impact costing specialist. Dr McLeod is a projecteconomist and financial analyst with 10 years experience designing, costing, implementing, evaluating andreviewing environmental, health and agricultural projects throughout 15 countries in Africa and Asia, andalso Australia. With a Doctorate of Philosophy, his focus is on the union of science and economics. Todaythis is primarily associated with strategic and business planning, along with facilitating public-privatepartnership development to maximise the returns from publicly financed science and infrastructuredevelopment.
He has been responsible for the management of, and has participated in, numerous projects. Examples ofwhich include, assessing the economic and ecological impact of selected environmental project designoptions on World Heritage – Great Barrier Reef hard coral communities, development of business plans forthe commercialisation of animal health vaccines in southern and eastern Africa, feasibility of anenvironmental trust fund for Lake Victoria, Kenya to promote sustainable resource use, financial assessmentof program development options for the Expanded Program of Child Immunisation in Pakistan andeconomic appraisal of product development opportunities for the Australian wine industry.
He is fully conversant with the techniques required to economically assess biologically-related projects andcurrently evaluates approximately 200+ projects per year for organisations such as Australian WoolInnovation, Grape and Wine R&D Corporation, Australian Pork Limited, Fisheries R&D Corporation, Forestand Wood Products R&D Corporation, Sugar R&D Corporation, Bureau of Sugar Experiment Stations,Australian Centre for International Agricultural Research and numerous CRCs.
In the field of pest and disease cost impact assessment he has undertaken and published several analyses.Examples include, the economic impact of parasites on the Australian sheep industry (International Journalfor Parasitology), the economic impact of weeds, pests and diseases on the Australian sugar industry (PlantProtection Quarterly), and the economic impact of tick-borne diseases in cattle of Africa, Asia and Australia(Proceedings of The Association of Institutions for Tropical Veterinary Medicine).
Executive summary
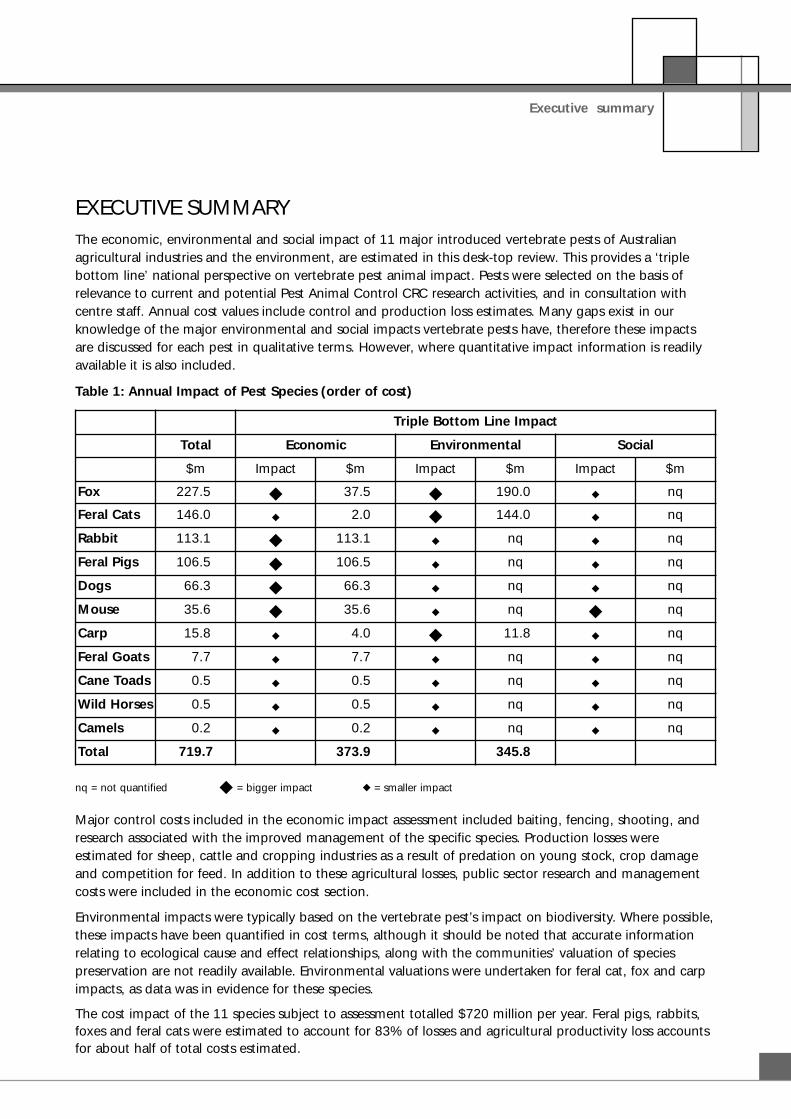
EXECUTIVE SUMMARYThe economic, environmental and social impact of 11 major introduced vertebrate pests of Australianagricultural industries and the environment, are estimated in this desk-top review. This provides a ‘triplebottom line’ national perspective on vertebrate pest animal impact. Pests were selected on the basis ofrelevance to current and potential Pest Animal Control CRC research activities, and in consultation withcentre staff. Annual cost values include control and production loss estimates. Many gaps exist in ourknowledge of the major environmental and social impacts vertebrate pests have, therefore these impactsare discussed for each pest in qualitative terms. However, where quantitative impact information is readilyavailable it is also included.
Table 1: Annual Impact of Pest Species (order of cost)
nq = not quantified � = bigger impact � = smaller impact
Major control costs included in the economic impact assessment included baiting, fencing, shooting, andresearch associated with the improved management of the specific species. Production losses wereestimated for sheep, cattle and cropping industries as a result of predation on young stock, crop damageand competition for feed. In addition to these agricultural losses, public sector research and managementcosts were included in the economic cost section.
Environmental impacts were typically based on the vertebrate pest’s impact on biodiversity. Where possible,these impacts have been quantified in cost terms, although it should be noted that accurate informationrelating to ecological cause and effect relationships, along with the communities’ valuation of speciespreservation are not readily available. Environmental valuations were undertaken for feral cat, fox and carpimpacts, as data was in evidence for these species.
The cost impact of the 11 species subject to assessment totalled $720 million per year. Feral pigs, rabbits,foxes and feral cats were estimated to account for 83% of losses and agricultural productivity loss accountsfor about half of total costs estimated.
Triple Bottom Line Impact
Total Economic Environmental Social
$m Impact $m Impact $m Impact $m
Fox 227.5 � 37.5 � 190.0 � nq
Feral Cats 146.0 � 2.0 � 144.0 � nq
Rabbit 113.1 � 113.1 � nq � nq
Feral Pigs 106.5 � 106.5 � nq � nq
Dogs 66.3 � 66.3 � nq � nq
Mouse 35.6 � 35.6 � nq � nq
Carp 15.8 � 4.0 � 11.8 � nq
Feral Goats 7.7 � 7.7 � nq � nq
Cane Toads 0.5 � 0.5 � nq � nq
Wild Horses 0.5 � 0.5 � nq � nq
Camels 0.2 � 0.2 � nq � nq
Total 719.7 373.9 345.8
Counting the Cost: Impact of Invasive Animals in Australia, 2004
Identified issues and recommendationsThe main purpose of the consultancy was to estimate the social, economic and environmental impacts ofmajor vertebrate pests. This is the first time ‘triple bottom line’ reporting, suggested in reports such as theGlobal Reporting Initiative’s Sustainability Reporting Guidelines and Environment Australia’s Triple Bottom LineReporting in Australia, has been used to assess pest impact. In addition to summarizing the triple bottomline results, some points for future research have been outlined.
� Economic costs associated with competition by pests with sheep and cattle were the most straight forward impacts to derive, due to a large range of grazing experiments and previously conducted impact assessments. Economic impacts derived in this study are well below those previously calculated – largely due to contraction in the size of the national sheep flock and in the case of rabbits, the release of rabbit calicivirus (RHDV), which has decreased rabbit population pressures in many areas.
� Rabbits, foxes, feral pigs and feral cats were shown to inflict the greatest cost impact on the Australian economy. In the case of rabbits and pigs, the major component of the impact comes from reduced agricultural production, principally in the sheep and cattle industries. Given the heavy impact these pests impose on these industries, collaborative research projects should be sought with sheep and cattle producers, as they would be the major beneficiaries of such research.
� Feral cats and foxes were estimated to inflict large costs associated with predation of native fauna. In the absence of specific data specifying the Australian community’s valuation of this impact, ‘per bird killed’ cost estimates were assumed for the analysis reported in Pimentel et al. (2000) and using analyses taken from the NSW EPA database. Given the large impact of this assumption, it is essential that survey work be conducted in Australia to determine community attitudes to the impact of fox and cat predation so more accurate of definition of loss can be determined.
� Social impacts were the most difficult impacts to estimate. The Global Reporting Initiative guidelines suggest that social performance measurement enjoys less consensus than environmental performance. Within this report, pest impacts on employment, health and indigenous peoples ways of life are documented in relevant sections. Only the costs of vehicle accidents associated with kangaroos are quantified, while the commercial use value of differing species are outlined.
� Although not regarded as a pest to the general Australia community, kangaroos inflict significant costs on grazing industries through pasture competition and damage of fences. These costs are substantial and comparable with other vertebrate species that inflict large losses within grazing industries. Given this large impact, along with traffic crash costs and substantial tourist and commercial resource value of kangaroos, it is desirable that the issue of population density management be assessed further and management tools devised to minimise costs and maximise the benefit of this national symbol.
� Despite inflicting a major impact, research into managing all of these pest species may not necessarily deliver the greatest benefit. Research projects need to be assessed in terms of their ability to reduce the overall cost of a pest species, along with risks of the investment generating an outcome. Benefit-cost analysis could be used to derive estimates of each projects expected economic pay off – as measured by a project’s net present value (the difference between project benefits and costs) and benefit-cost ratio (the ratio of all project benefits to all project costs).
Dr Ross McLeodeSYS Development
Table of contents
TABLE OF CONTENTSOverview . . . . . . . . . . . . . . . . . . . . . . . . . . . . . . . . . . . . . . . . . . . . . . . . . . . . . . . . . . . .1
Background . . . . . . . . . . . . . . . . . . . . . . . . . . . . . . . . . . . . . . . . . . . . . . . . . . . . .1
Triple Bottom Line Reporting . . . . . . . . . . . . . . . . . . . . . . . . . . . . . . . . . . . . . . . .1
Economic Impact . . . . . . . . . . . . . . . . . . . . . . . . . . . . . . . . . . . . . . . . . . . . . . . . .2
Environmental Impact . . . . . . . . . . . . . . . . . . . . . . . . . . . . . . . . . . . . . . . . . . . . . .4
Social Impact . . . . . . . . . . . . . . . . . . . . . . . . . . . . . . . . . . . . . . . . . . . . . . . . . . . .7
Structure of the Report . . . . . . . . . . . . . . . . . . . . . . . . . . . . . . . . . . . . . . . . . . . . .7
References . . . . . . . . . . . . . . . . . . . . . . . . . . . . . . . . . . . . . . . . . . . . . . . . . . . . . .7
House Mouse . . . . . . . . . . . . . . . . . . . . . . . . . . . . . . . . . . . . . . . . . . . . . . . . . . . . . . . . .9History . . . . . . . . . . . . . . . . . . . . . . . . . . . . . . . . . . . . . . . . . . . . . . . . . . . . . . . . .9
Distribution . . . . . . . . . . . . . . . . . . . . . . . . . . . . . . . . . . . . . . . . . . . . . . . . . . . . . .9
Economic Impact. . . . . . . . . . . . . . . . . . . . . . . . . . . . . . . . . . . . . . . . . . . . . . . . .10
Environmental Impact. . . . . . . . . . . . . . . . . . . . . . . . . . . . . . . . . . . . . . . . . . . . .11
Social Impact . . . . . . . . . . . . . . . . . . . . . . . . . . . . . . . . . . . . . . . . . . . . . . . . . . .11
References . . . . . . . . . . . . . . . . . . . . . . . . . . . . . . . . . . . . . . . . . . . . . . . . . . . . .12
Rabbits . . . . . . . . . . . . . . . . . . . . . . . . . . . . . . . . . . . . . . . . . . . . . . . . . . . . . . . . . . . . .13
History . . . . . . . . . . . . . . . . . . . . . . . . . . . . . . . . . . . . . . . . . . . . . . . . . . . . . . . .13
Distribution . . . . . . . . . . . . . . . . . . . . . . . . . . . . . . . . . . . . . . . . . . . . . . . . . . . . .13
Economic Impact . . . . . . . . . . . . . . . . . . . . . . . . . . . . . . . . . . . . . . . . . . . . . . . .14
Environmental Impact . . . . . . . . . . . . . . . . . . . . . . . . . . . . . . . . . . . . . . . . . . . . .16
Social Impact . . . . . . . . . . . . . . . . . . . . . . . . . . . . . . . . . . . . . . . . . . . . . . . . . . .17
References . . . . . . . . . . . . . . . . . . . . . . . . . . . . . . . . . . . . . . . . . . . . . . . . . . . . .17
European Fox . . . . . . . . . . . . . . . . . . . . . . . . . . . . . . . . . . . . . . . . . . . . . . . . . . . . . . .19
History . . . . . . . . . . . . . . . . . . . . . . . . . . . . . . . . . . . . . . . . . . . . . . . . . . . . . . . .19
Distribution . . . . . . . . . . . . . . . . . . . . . . . . . . . . . . . . . . . . . . . . . . . . . . . . . . . . .20
Economic Impact . . . . . . . . . . . . . . . . . . . . . . . . . . . . . . . . . . . . . . . . . . . . . . . .20
Environmental Impact . . . . . . . . . . . . . . . . . . . . . . . . . . . . . . . . . . . . . . . . . . . . .23
Social Impact . . . . . . . . . . . . . . . . . . . . . . . . . . . . . . . . . . . . . . . . . . . . . . . . . . .23
References . . . . . . . . . . . . . . . . . . . . . . . . . . . . . . . . . . . . . . . . . . . . . . . . . . . . .23
Feral Pigs . . . . . . . . . . . . . . . . . . . . . . . . . . . . . . . . . . . . . . . . . . . . . . . . . . . . . . . . . . .25
History . . . . . . . . . . . . . . . . . . . . . . . . . . . . . . . . . . . . . . . . . . . . . . . . . . . . . . . .25
Distribution . . . . . . . . . . . . . . . . . . . . . . . . . . . . . . . . . . . . . . . . . . . . . . . . . . . . .25
Economic Impact . . . . . . . . . . . . . . . . . . . . . . . . . . . . . . . . . . . . . . . . . . . . . . . .26Environmental Impact . . . . . . . . . . . . . . . . . . . . . . . . . . . . . . . . . . . . . . . . . . . . .27Social Impact . . . . . . . . . . . . . . . . . . . . . . . . . . . . . . . . . . . . . . . . . . . . . . . . . . .28
References . . . . . . . . . . . . . . . . . . . . . . . . . . . . . . . . . . . . . . . . . . . . . . . . . . . . .28
Carp
History . . . . . . . . . . . . . . . . . . . . . . . . . . . . . . . . . . . . . . . . . . . . . . . . . . . . . . . .30
Distribution . . . . . . . . . . . . . . . . . . . . . . . . . . . . . . . . . . . . . . . . . . . . . . . . . . . . .30
Economic Impact . . . . . . . . . . . . . . . . . . . . . . . . . . . . . . . . . . . . . . . . . . . . . . . .30
Environmental Impact . . . . . . . . . . . . . . . . . . . . . . . . . . . . . . . . . . . . . . . . . . . . .31
Social Impact . . . . . . . . . . . . . . . . . . . . . . . . . . . . . . . . . . . . . . . . . . . . . . . . . . .32
References . . . . . . . . . . . . . . . . . . . . . . . . . . . . . . . . . . . . . . . . . . . . . . . . . . . . .33
Feral Goats . . . . . . . . . . . . . . . . . . . . . . . . . . . . . . . . . . . . . . . . . . . . . . . . . . . . . . . . .34
History . . . . . . . . . . . . . . . . . . . . . . . . . . . . . . . . . . . . . . . . . . . . . . . . . . . . . . . .34
Distribution . . . . . . . . . . . . . . . . . . . . . . . . . . . . . . . . . . . . . . . . . . . . . . . . . . . . .34
Economic Impact . . . . . . . . . . . . . . . . . . . . . . . . . . . . . . . . . . . . . . . . . . . . . . . .34
Environmental Impact . . . . . . . . . . . . . . . . . . . . . . . . . . . . . . . . . . . . . . . . . . . . .36
Social Impact . . . . . . . . . . . . . . . . . . . . . . . . . . . . . . . . . . . . . . . . . . . . . . . . . . .36
References . . . . . . . . . . . . . . . . . . . . . . . . . . . . . . . . . . . . . . . . . . . . . . . . . . . . .37
Dogs and Dingoes . . . . . . . . . . . . . . . . . . . . . . . . . . . . . . . . . . . . . . . . . . . . . . . . . . . .38
History . . . . . . . . . . . . . . . . . . . . . . . . . . . . . . . . . . . . . . . . . . . . . . . . . . . . . . . .38
Distribution . . . . . . . . . . . . . . . . . . . . . . . . . . . . . . . . . . . . . . . . . . . . . . . . . . . . .38
Economic Impact . . . . . . . . . . . . . . . . . . . . . . . . . . . . . . . . . . . . . . . . . . . . . . . .40
Environmental Impact . . . . . . . . . . . . . . . . . . . . . . . . . . . . . . . . . . . . . . . . . . . . .41
Social Impact . . . . . . . . . . . . . . . . . . . . . . . . . . . . . . . . . . . . . . . . . . . . . . . . . . .41
References . . . . . . . . . . . . . . . . . . . . . . . . . . . . . . . . . . . . . . . . . . . . . . . . . . . . .42
Camels . . . . . . . . . . . . . . . . . . . . . . . . . . . . . . . . . . . . . . . . . . . . . . . . . . . . . . . . . . . . .43
History . . . . . . . . . . . . . . . . . . . . . . . . . . . . . . . . . . . . . . . . . . . . . . . . . . . . . . . .43
Distribution . . . . . . . . . . . . . . . . . . . . . . . . . . . . . . . . . . . . . . . . . . . . . . . . . . . . .43
Economic Impact . . . . . . . . . . . . . . . . . . . . . . . . . . . . . . . . . . . . . . . . . . . . . . . .43
Environmental Impact . . . . . . . . . . . . . . . . . . . . . . . . . . . . . . . . . . . . . . . . . . . . .45
Social Impact . . . . . . . . . . . . . . . . . . . . . . . . . . . . . . . . . . . . . . . . . . . . . . . . . . .45
References . . . . . . . . . . . . . . . . . . . . . . . . . . . . . . . . . . . . . . . . . . . . . . . . . . . . .45
Counting the Cost: Impact of Invasive Animals in Australia, 2004
Overview
Cane Toads . . . . . . . . . . . . . . . . . . . . . . . . . . . . . . . . . . . . . . . . . . . . . . . . . . . . . . . . .46
History . . . . . . . . . . . . . . . . . . . . . . . . . . . . . . . . . . . . . . . . . . . . . . . . . . . . . . . .46
Distribution . . . . . . . . . . . . . . . . . . . . . . . . . . . . . . . . . . . . . . . . . . . . . . . . . . . . .46
Economic Impact . . . . . . . . . . . . . . . . . . . . . . . . . . . . . . . . . . . . . . . . . . . . . . . .47
Environmental Impact . . . . . . . . . . . . . . . . . . . . . . . . . . . . . . . . . . . . . . . . . . . . .47
Social Impact . . . . . . . . . . . . . . . . . . . . . . . . . . . . . . . . . . . . . . . . . . . . . . . . . . .47
References . . . . . . . . . . . . . . . . . . . . . . . . . . . . . . . . . . . . . . . . . . . . . . . . . . . . .47
Wild Horses . . . . . . . . . . . . . . . . . . . . . . . . . . . . . . . . . . . . . . . . . . . . . . . . . . . . . . . . .48
History . . . . . . . . . . . . . . . . . . . . . . . . . . . . . . . . . . . . . . . . . . . . . . . . . . . . . . . .48
Distribution . . . . . . . . . . . . . . . . . . . . . . . . . . . . . . . . . . . . . . . . . . . . . . . . . . . . .48
Economic Impact . . . . . . . . . . . . . . . . . . . . . . . . . . . . . . . . . . . . . . . . . . . . . . . .48
Environmental Impact . . . . . . . . . . . . . . . . . . . . . . . . . . . . . . . . . . . . . . . . . . . . .49
Social Impact . . . . . . . . . . . . . . . . . . . . . . . . . . . . . . . . . . . . . . . . . . . . . . . . . . .49
References . . . . . . . . . . . . . . . . . . . . . . . . . . . . . . . . . . . . . . . . . . . . . . . . . . . . .49
Feral Cats . . . . . . . . . . . . . . . . . . . . . . . . . . . . . . . . . . . . . . . . . . . . . . . . . . . . . . . . . . .50
History . . . . . . . . . . . . . . . . . . . . . . . . . . . . . . . . . . . . . . . . . . . . . . . . . . . . . . . .50
Distribution . . . . . . . . . . . . . . . . . . . . . . . . . . . . . . . . . . . . . . . . . . . . . . . . . . . . .50
Economic Impact . . . . . . . . . . . . . . . . . . . . . . . . . . . . . . . . . . . . . . . . . . . . . . . .50
Environmental Impact . . . . . . . . . . . . . . . . . . . . . . . . . . . . . . . . . . . . . . . . . . . . .51
Social Impact . . . . . . . . . . . . . . . . . . . . . . . . . . . . . . . . . . . . . . . . . . . . . . . . . . .53
References . . . . . . . . . . . . . . . . . . . . . . . . . . . . . . . . . . . . . . . . . . . . . . . . . . . . .53
Kangaroo . . . . . . . . . . . . . . . . . . . . . . . . . . . . . . . . . . . . . . . . . . . . . . . . . . . . . . . . . . .54
History . . . . . . . . . . . . . . . . . . . . . . . . . . . . . . . . . . . . . . . . . . . . . . . . . . . . . . . .54
Distribution . . . . . . . . . . . . . . . . . . . . . . . . . . . . . . . . . . . . . . . . . . . . . . . . . . . . .54
Economic Impact . . . . . . . . . . . . . . . . . . . . . . . . . . . . . . . . . . . . . . . . . . . . . . . .54
Environmental Impact . . . . . . . . . . . . . . . . . . . . . . . . . . . . . . . . . . . . . . . . . . . . .56
Social Impact . . . . . . . . . . . . . . . . . . . . . . . . . . . . . . . . . . . . . . . . . . . . . . . . . . .56
References . . . . . . . . . . . . . . . . . . . . . . . . . . . . . . . . . . . . . . . . . . . . . . . . . . . . .58
Conclusions . . . . . . . . . . . . . . . . . . . . . . . . . . . . . . . . . . . . . . . . . . . . . . . . . . . . . . . . .60
Summary of Results . . . . . . . . . . . . . . . . . . . . . . . . . . . . . . . . . . . . . . . . . . . . . .60
Potential Impact of New Introduction . . . . . . . . . . . . . . . . . . . . . . . . . . . . . . . . .61
Vertebrate Pest Management Research . . . . . . . . . . . . . . . . . . . . . . . . . . . . . . . .63
Setting Research Priorities . . . . . . . . . . . . . . . . . . . . . . . . . . . . . . . . . . . . . . . . . .64
References . . . . . . . . . . . . . . . . . . . . . . . . . . . . . . . . . . . . . . . . . . . . . . . . . . . . .64
Appendices . . . . . . . . . . . . . . . . . . . . . . . . . . . . . . . . . . . . . . . . . . . . . . . . . . . . . . . . .65
List of Figures
Figure 1: ABARE Agricultural Regions . . . . . . . . . . . . . . . . . . . . . . . . . . . . . . . . . . . . . . . . . . . . . . .2Figure 2: Mice Plague Areas . . . . . . . . . . . . . . . . . . . . . . . . . . . . . . . . . . . . . . . . . . . . . . . . . . . . . .9Figure 3: Rabbit Distribution (Courtesy BRS) . . . . . . . . . . . . . . . . . . . . . . . . . . . . . . . . . . . . . . . .13Figure 4: Fox Distribution (Courtesy BRS) . . . . . . . . . . . . . . . . . . . . . . . . . . . . . . . . . . . . . . . . . . .19Figure 5: Distribution of Feral Pigs (Courtesy BRS) . . . . . . . . . . . . . . . . . . . . . . . . . . . . . . . . . . . .25Figure 6: Distribution of Carp (Courtesy BRS) . . . . . . . . . . . . . . . . . . . . . . . . . . . . . . . . . . . . . . . .30Figure 7: Distribution of Feral Goats (Courtesy BRS) . . . . . . . . . . . . . . . . . . . . . . . . . . . . . . . . . . .34Figure 8: Distribution of Wild Dogs (Courtesy BRS) . . . . . . . . . . . . . . . . . . . . . . . . . . . . . . . . . . .39Figure 9: Distribution of Cane Toads . . . . . . . . . . . . . . . . . . . . . . . . . . . . . . . . . . . . . . . . . . . . . .46Figure 10: Range of Feral Cats . . . . . . . . . . . . . . . . . . . . . . . . . . . . . . . . . . . . . . . . . . . . . . . . . . .50Figure 11: Climatic Suitability for Stoats (Courtesy BRS) . . . . . . . . . . . . . . . . . . . . . . . . . . . . . . . .61
List of Tables
Table 2: Summary of Biodiversity Valuation Studies (Terrestrial) . . . . . . . . . . . . . . . . . . . . . . . . . . .5Table 3: Summary of Biodiversity Valuation Studies (Aquatic) . . . . . . . . . . . . . . . . . . . . . . . . . . . . .6Table 4: Annual Cost Impact of House Mouse . . . . . . . . . . . . . . . . . . . . . . . . . . . . . . . . . . . . . . .10Table 5: Annual Cost Impact of Rabbits . . . . . . . . . . . . . . . . . . . . . . . . . . . . . . . . . . . . . . . . . . . .14Table 6: Rabbit Agricultural Productivity Cost . . . . . . . . . . . . . . . . . . . . . . . . . . . . . . . . . . . . . . . .15Table 7: Flora and Fauna Species by threatened Rabbits . . . . . . . . . . . . . . . . . . . . . . . . . . . . . . . .16Table 8: Annual Cost Impact of Foxes (2002) . . . . . . . . . . . . . . . . . . . . . . . . . . . . . . . . . . . . . . . .20Table 9: Summary of Fox Biodiversity Impact Assumptions (Fox) . . . . . . . . . . . . . . . . . . . . . . . . .21Table 10: Summary of Fauna Species threatened by Foxes . . . . . . . . . . . . . . . . . . . . . . . . . . . . . .22Table 11: Annual Cost Impact of Feral Pigs . . . . . . . . . . . . . . . . . . . . . . . . . . . . . . . . . . . . . . . . . .26Table 12: Flora and Fauna Species threatened by Feral Pigs . . . . . . . . . . . . . . . . . . . . . . . . . . . . .27Table 13: Annual Cost Impact of Carp . . . . . . . . . . . . . . . . . . . . . . . . . . . . . . . . . . . . . . . . . . . . .31Table 14: Current Threatened Freshwater Fish Species . . . . . . . . . . . . . . . . . . . . . . . . . . . . . . . . .32Table 15: Annual Cost Impact of Feral Goats . . . . . . . . . . . . . . . . . . . . . . . . . . . . . . . . . . . . . . . .35Table 16: Goat Agricultural Productivity Costs . . . . . . . . . . . . . . . . . . . . . . . . . . . . . . . . . . . . . . .35Table 17: Flora and Fauna Species threatened by Feral Goats . . . . . . . . . . . . . . . . . . . . . . . . . . . .36Table 18: Annual Cost Impact of Wild Dogs . . . . . . . . . . . . . . . . . . . . . . . . . . . . . . . . . . . . . . . . .40Table 19: Annual Cost Impact of Camels . . . . . . . . . . . . . . . . . . . . . . . . . . . . . . . . . . . . . . . . . . .44Table 20: Camel Agricultural Productivity Costs . . . . . . . . . . . . . . . . . . . . . . . . . . . . . . . . . . . . . .44Table 21: Annual Cost Impact of Cane Toads . . . . . . . . . . . . . . . . . . . . . . . . . . . . . . . . . . . . . . . .47Table 22: Annual Cost Impact of Wild Horses . . . . . . . . . . . . . . . . . . . . . . . . . . . . . . . . . . . . . . . .48Table 23: Annual Cost Impact of Feral Cats . . . . . . . . . . . . . . . . . . . . . . . . . . . . . . . . . . . . . . . . .51Table 24: Fauna Species Threatened by Feral Cats . . . . . . . . . . . . . . . . . . . . . . . . . . . . . . . . . . . .52Table 25: Annual Cost Impact of Kangaroo . . . . . . . . . . . . . . . . . . . . . . . . . . . . . . . . . . . . . . . . .55Table 26: Kangaroo Agricultural Productivity Costs . . . . . . . . . . . . . . . . . . . . . . . . . . . . . . . . . . .56Table 27: Annual Impact of Pest Species (order of cost) . . . . . . . . . . . . . . . . . . . . . . . . . . . . . . . .60Table 28: Summary of Stoat Biodiversity Impact Assumptions . . . . . . . . . . . . . . . . . . . . . . . . . . .62Table 29: Potential Annual Impact of Stoats . . . . . . . . . . . . . . . . . . . . . . . . . . . . . . . . . . . . . . . . .62Table 30: Summary of Key Areas for Future Pest R&D . . . . . . . . . . . . . . . . . . . . . . . . . . . . . . . . .63Table 31: Gross Margin Budgets for Wheat and Barley . . . . . . . . . . . . . . . . . . . . . . . . . . . . . . . . .65Table 32: Gross Margin Budgets for Sheep . . . . . . . . . . . . . . . . . . . . . . . . . . . . . . . . . . . . . . . . . .66Table 33: Gross Margin Budgets for Cattle . . . . . . . . . . . . . . . . . . . . . . . . . . . . . . . . . . . . . . . . . .67Table 34: Regional Agricultural Statistics NSW (2002) . . . . . . . . . . . . . . . . . . . . . . . . . . . . . . . . .68Table 35: Regional Agricultural Statistics Victoria (2002) . . . . . . . . . . . . . . . . . . . . . . . . . . . . . . .68Table 36: Regional Agricultural Statistics Queensland (2002) . . . . . . . . . . . . . . . . . . . . . . . . . . . .69Table 37: Regional Agricultural Statistics South Australia (2002) . . . . . . . . . . . . . . . . . . . . . . . . . .69Table 38: Regional Agricultural Statistics Western Australia (2002) . . . . . . . . . . . . . . . . . . . . . . . .70Table 39: Regional Agricultural Statistics Tasmania and NT (2002) . . . . . . . . . . . . . . . . . . . . . . . .70
Counting the Cost: Impact of Invasive Animals in Australia, 2004
1
Overview
BackgroundFollowing the terms of reference from the Pest Animal Control Cooperative Research Centre (PAC CRC), thisreport has the following objectives:
� Review existing impacts of pest animals on Australia’s environment, economy and society, � Describe the possible impact of a new pest animal introduction; and� Prioritise the ‘top five’ areas where R&D could make a difference to the ‘triple bottom line’
As part of the consultancy, the analyst liaised with key organisations to determine impacts, identify keyliterature and set priorities for 11 major pest animal species being Fox, Pigs, Rabbit, Mice, Goats, Carp,Dogs, Cane Toad, Camels, Feral Cats and Wild Horses. In addition to these pest species, the Kangaroo hasagricultural, environmental and social impacts that are both positive and negative. These impacts areexplored in the last of the individual species chapters.
Triple Bottom Line ReportingIn addition to the reporting of financial and economic performance, there is demand for organisations todemonstrate accountability in the domains of social and environmental impact. The concept of ‘triplebottom line’ has emerged to encapsulate this form of reporting and incorporates the three elements ofsocial, environmental and economic accountability. Key features of each of these elements are summarisedbelow.
� Economic performance includes fiscal performance, relating to demand for products and services, community contributions and local procurement policies.
� Environmental performance includes impacts on air, water, land, natural resources, flora, and fauna made through processes, products or services.
� Social performance includes involvement in shaping local, national and international public policy, equality, treatment of minorities, employee issues and public concern.
Each of these elements of triple bottom line reporting are outlined throughout this report in relation to theimpact of vertebrate pests in Australia. Individual chapters are presented for each species. A concludingchapter is included in the report, which presents the potential impacts of a new pest introduction, alongwith research priorities and future research requirements for existing vertebrate pest species.
� Economic, social and environmental impacts of 11 major vertebrate pest species are outlined in the report
� Cost impact is estimated on the basis of pest distribution, value of agricultural production and, where possible, social impact and biodiversity
� Research priorities for vertebrate pest management in Australia conclude the report
OVERVIEW
2
Economic ImpactEconomic impact in the context of this report refers to the economic value of reduced agriculturalproductivity associated with each pest species. In order to estimate this impact the distribution of the pest isestimated, the value of agricultural production within the range of the pest identified and an assessment ofthe reduced value of production as result of the pest is calculated. Any research or management costsassociated with the pest are also estimated. Each of these elements of the economic impact estimationprocedure is provided in the following section.
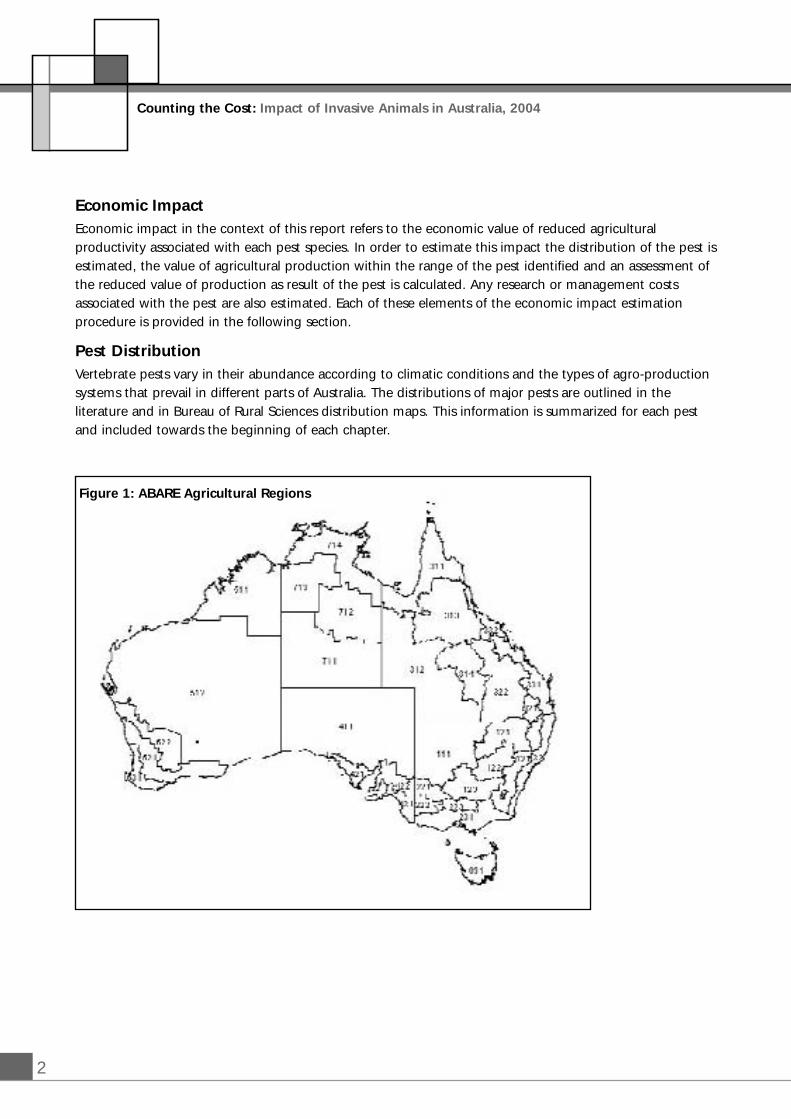
Pest DistributionVertebrate pests vary in their abundance according to climatic conditions and the types of agro-productionsystems that prevail in different parts of Australia. The distributions of major pests are outlined in theliterature and in Bureau of Rural Sciences distribution maps. This information is summarized for each pestand included towards the beginning of each chapter.
Counting the Cost: Impact of Invasive Animals in Australia, 2004
Figure 1: ABARE Agricultural Regions
3
Overview
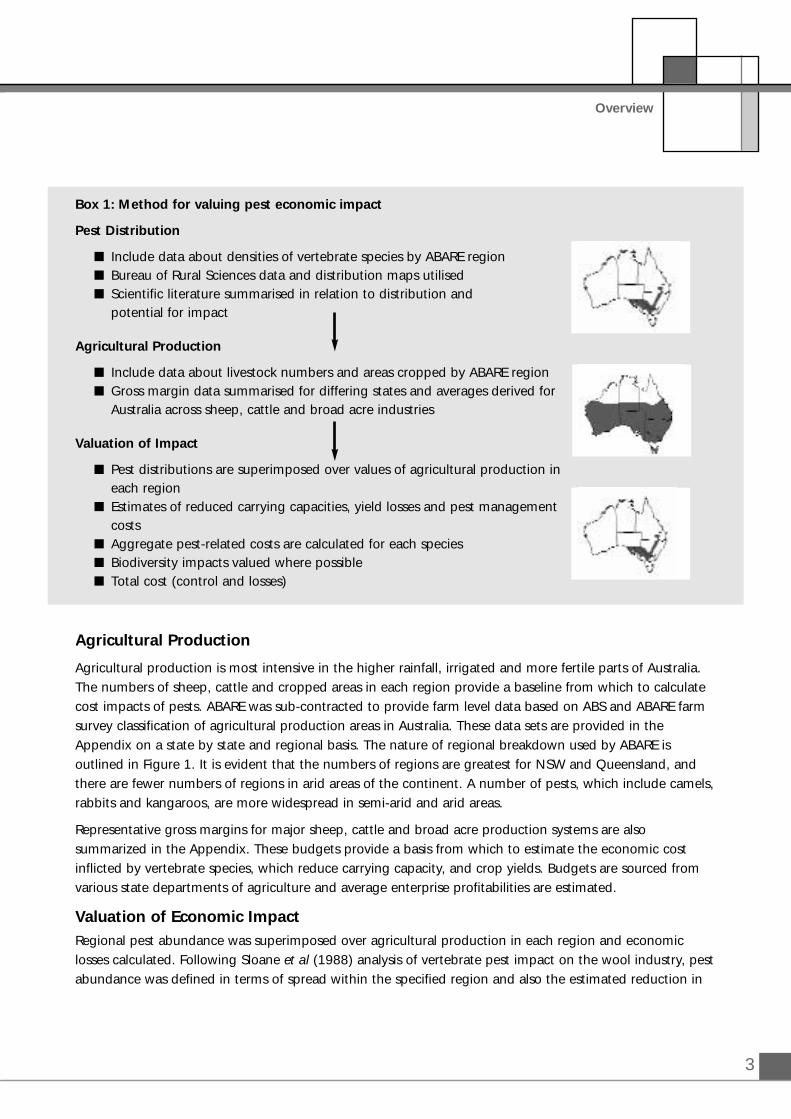
Box 1: Method for valuing pest economic impact
Pest Distribution
� Include data about densities of vertebrate species by ABARE region� Bureau of Rural Sciences data and distribution maps utilised� Scientific literature summarised in relation to distribution and
potential for impact
Agricultural Production
� Include data about livestock numbers and areas cropped by ABARE region� Gross margin data summarised for differing states and averages derived for
Australia across sheep, cattle and broad acre industries
Valuation of Impact
� Pest distributions are superimposed over values of agricultural production in each region
� Estimates of reduced carrying capacities, yield losses and pest management costs
� Aggregate pest-related costs are calculated for each species� Biodiversity impacts valued where possible� Total cost (control and losses)
Agricultural Production
Agricultural production is most intensive in the higher rainfall, irrigated and more fertile parts of Australia.The numbers of sheep, cattle and cropped areas in each region provide a baseline from which to calculatecost impacts of pests. ABARE was sub-contracted to provide farm level data based on ABS and ABARE farmsurvey classification of agricultural production areas in Australia. These data sets are provided in theAppendix on a state by state and regional basis. The nature of regional breakdown used by ABARE isoutlined in Figure 1. It is evident that the numbers of regions are greatest for NSW and Queensland, andthere are fewer numbers of regions in arid areas of the continent. A number of pests, which include camels,rabbits and kangaroos, are more widespread in semi-arid and arid areas.
Representative gross margins for major sheep, cattle and broad acre production systems are alsosummarized in the Appendix. These budgets provide a basis from which to estimate the economic costinflicted by vertebrate species, which reduce carrying capacity, and crop yields. Budgets are sourced fromvarious state departments of agriculture and average enterprise profitabilities are estimated.
Valuation of Economic ImpactRegional pest abundance was superimposed over agricultural production in each region and economiclosses calculated. Following Sloane et al (1988) analysis of vertebrate pest impact on the wool industry, pestabundance was defined in terms of spread within the specified region and also the estimated reduction in
4
carrying capacity within affected areas. For the most part, production losses were estimated to be mostsevere in semi-arid areas where pests such as rabbits and kangaroos are likely to impose greater competitivepressure on grazing livestock. Within each chapter, losses are provided on a regional basis. Additionally,public sector research and management costs, along with private landholder control costs are alsoestimated and provided. Regional costs are aggregated to a national basis.
Environmental ImpactA range of environmental indicators has been highlighted for incorporation in triple bottom line reportingframeworks. Some of the key indicators outlined in Global Reporting Initiative (2002) and EnvironmentAustralia (2003) include description of major impacts on energy consumption, water quality, emissions,ozone depletion, land degradation and biodiversity in terrestrial, freshwater and marine environments.Vertebrate pests can cause land degradation, reduce water quality and decrease biodiversity.
Foxes and feral cats have had, and continue to have, an important impact on biodiversity. Correspondingly,the species listed under the Environment Protection and Biodiversity Conservation Act 1999 for whichvertebrate pests are a known or perceived threat, are outlined within each individual chapter of this impactassessment. Environment Australia (2003) noted that biodiversity within Australia provides a substantialcontribution to the national economy, estimated to be in the vicinity of US$ 245 billion for terrestrialecosystems and $US 640 billion for marine ecosystems. Given the substantial value of biodiversity, andconsequent large potential cost threats vertebrate pests pose, environmental cost impacts have beenquantified using environmental valuation techniques.
The community may gain value from biodiversity by being able to see birds of interest or catch desirablefish when using parks and waterways. Conversely, the absence of these species as a result of vertebrate pestpredation imposes costs on the community as the amenity value of ecosystems is degraded. Biodiversity inthese cases provides amenity value. The mere knowledge of species existing may also be of utility topeople. This non-use value is commonly referred to as ‘existence value’. Survey-based techniques such as‘contingent valuation’ are typically used to determine how much people value these use and non-usevalues. Within surveys respondents are provided with scenarios and asked to state their willingness to pay(WTP) (or less commonly their willingness to accept compensation) in dollars for a change in environmentalconditions (See Jakobsson and Dragun, 1996 for discussion of methods).
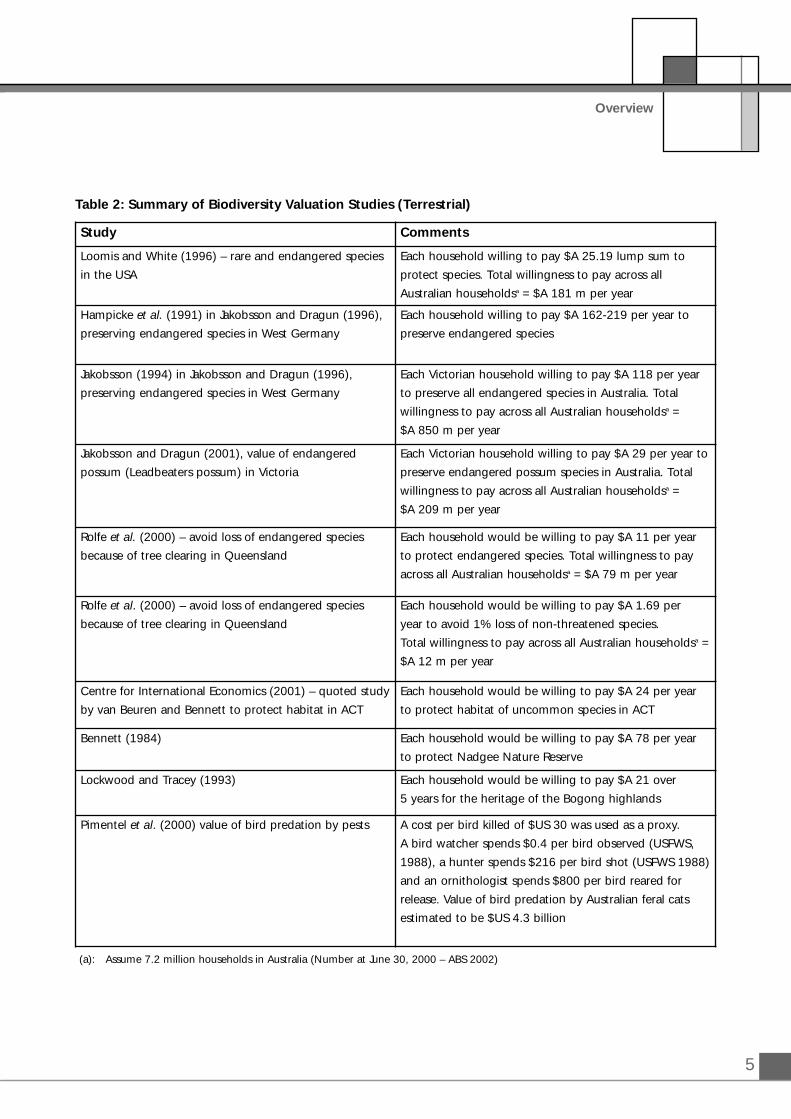
Results from a range of surveys where people were asked to value ‘willingness to pay’ for ecosystems or forcertain fauna species to be protected are presented in the following table – primarily using data from theENVALUE database. These values are compared with valuation of vertebrate pest impacts. While there arelimitations in transferring the results of a range of studies to derive a precise dollar value for impacts, itprovides an indication of the likely magnitude of environmental values.
Counting the Cost: Impact of Invasive Animals in Australia, 2004
5
Overview
Table 2: Summary of Biodiversity Valuation Studies (Terrestrial)
Study Comments
Loomis and White (1996) – rare and endangered species
in the USA
Each household willing to pay $A 25.19 lump sum to
protect species. Total willingness to pay across all
Australian householdsa = $A 181 m per year
Hampicke et al. (1991) in Jakobsson and Dragun (1996),
preserving endangered species in West Germany
Each household willing to pay $A 162-219 per year to
preserve endangered species
Jakobsson (1994) in Jakobsson and Dragun (1996),
preserving endangered species in West Germany
Each Victorian household willing to pay $A 118 per year
to preserve all endangered species in Australia. Total
willingness to pay across all Australian householdsa =
$A 850 m per year
Jakobsson and Dragun (2001), value of endangered
possum (Leadbeaters possum) in Victoria
Each Victorian household willing to pay $A 29 per year to
preserve endangered possum species in Australia. Total
willingness to pay across all Australian householdsa =
$A 209 m per year
Rolfe et al. (2000) – avoid loss of endangered species
because of tree clearing in Queensland
Each household would be willing to pay $A 11 per year
to protect endangered species. Total willingness to pay
across all Australian householdsa = $A 79 m per year
Rolfe et al. (2000) – avoid loss of endangered species
because of tree clearing in Queensland
Each household would be willing to pay $A 1.69 per
year to avoid 1% loss of non-threatened species.
Total willingness to pay across all Australian householdsa =
$A 12 m per year
Centre for International Economics (2001) – quoted study
by van Beuren and Bennett to protect habitat in ACT
Each household would be willing to pay $A 24 per year
to protect habitat of uncommon species in ACT
Bennett (1984) Each household would be willing to pay $A 78 per year
to protect Nadgee Nature Reserve
Lockwood and Tracey (1993) Each household would be willing to pay $A 21 over
5 years for the heritage of the Bogong highlands
Pimentel et al. (2000) value of bird predation by pests A cost per bird killed of $US 30 was used as a proxy.
A bird watcher spends $0.4 per bird observed (USFWS,
1988), a hunter spends $216 per bird shot (USFWS 1988)
and an ornithologist spends $800 per bird reared for
release. Value of bird predation by Australian feral cats
estimated to be $US 4.3 billion
(a): Assume 7.2 million households in Australia (Number at June 30, 2000 – ABS 2002)
6
Counting the Cost: Impact of Invasive Animals in Australia, 2004
A major impact of vertebrate predation is the potential extinction of fauna and flora species. SurveyedAustralian households expressed a ‘willingness to pay’ to protect endangered species to be in the order of $11–118 per household per year. If this willingness was projected across all Australian households, then a maximum aggregate willingness to pay for species preservation of $79–850 million per year would beevident. The extinction pressure of vertebrate pests on endangered species, relative to other pressures suchas land clearing and inter-species competition, needs to be ascertained in order to determine the social costimpact of vertebrate pests. The exact nature of these ecological relationships are currently unknown. Aside from endangered species preservation, it is evident that households were willing to pay $1.69 perhousehold per year to prevent a 1% reduction in an uncommon species. Aggregated over 7.2 millionhouseholds this amounts to $12 million per year.
Vertebrate predation leads to the reduction of uncommon and endangered species. Correspondingly, thevalue of damage, in terms of decreased biodiversity, could be a maximum of $12-850 million per year –depending on predatory pressure exerted by specific vertebrate species. These maximum cost estimates aresignificantly less than the value Pimental et al. (2000) derived for the value of bird predation by feral cats inAustralia of $US 4.3 billion per annum. In light of this difference, a conservative estimate of $A 1 per birdkilled by a vertebrate pest is included in the biodiversity impact valuation.
In the absence of survey data directly relating to the value of reduced vertebrate pest pressure, it isimpossible to provide a precise estimate of native fauna value. The preservation of terrestrial biodiversity by the community is not valued to be zero. When valuing damage to a wetland in South Australia usingsurvey-based techniques Bennett et al. (1997) noted the economic estimate of damage: “is an order ofmagnitude estimate only. It should not be employed as the value of the damage avoided. Rather, it shouldbe used as an indicator of the strength of community preferences for protection”.
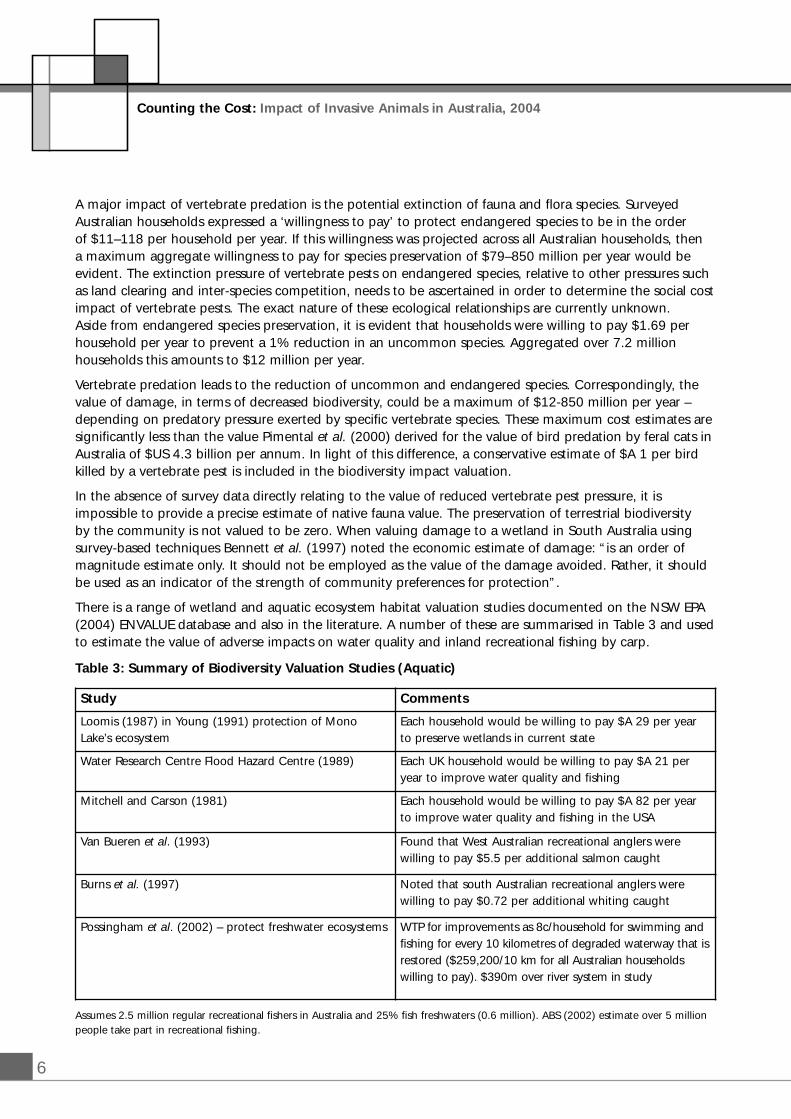
There is a range of wetland and aquatic ecosystem habitat valuation studies documented on the NSW EPA(2004) ENVALUE database and also in the literature. A number of these are summarised in Table 3 and usedto estimate the value of adverse impacts on water quality and inland recreational fishing by carp.
Table 3: Summary of Biodiversity Valuation Studies (Aquatic)
Assumes 2.5 million regular recreational fishers in Australia and 25% fish freshwaters (0.6 million). ABS (2002) estimate over 5 millionpeople take part in recreational fishing.
Study Comments
Loomis (1987) in Young (1991) protection of MonoLake’s ecosystem
Each household would be willing to pay $A 29 per yearto preserve wetlands in current state
Water Research Centre Flood Hazard Centre (1989) Each UK household would be willing to pay $A 21 peryear to improve water quality and fishing
Mitchell and Carson (1981) Each household would be willing to pay $A 82 per yearto improve water quality and fishing in the USA
Van Bueren et al. (1993) Found that West Australian recreational anglers werewilling to pay $5.5 per additional salmon caught
Burns et al. (1997) Noted that south Australian recreational anglers werewilling to pay $0.72 per additional whiting caught
Possingham et al. (2002) – protect freshwater ecosystems WTP for improvements as 8c/household for swimming andfishing for every 10 kilometres of degraded waterway that isrestored ($259,200/10 km for all Australian householdswilling to pay). $390m over river system in study
7
Overview
The range of studies included in Table 3, demonstrate the wide range of biodiversity values. Valuationstudies do, however, indicate that people are willing to pay for enhanced water and fishing quality.Recreational anglers in South Australia and Western Australia indicated a willingness to pay for additionalfish. Such responses suggest that water and fishing quality have significant social value and should beconsidered in addition to many of the agricultural productivity cost estimates included in this report.Specific assumptions relating to carp impacts on water quality and recreational fishing quality are outlinedin the carp section.
Social ImpactSocial impact is perhaps the most difficult element of the ‘triple bottom line’ framework to define and toquantify. A range of social indicators were prescribed by the Global Reporting Initiative (2002) for companyreporting and included the description of a workforce by region, net employment creation, injuries,workforce diversity and education, human rights and indigenous rights. In the context of this report theimpact of vertebrate pests on employment prospects within rural and regional Australia, impact of pests ontraffic accidents and possible impact of some pest species on indigenous Australia are outlined. Theseimpacts may not all be negative. In the case of foxes, camels, kangaroos and rabbits, commercial resourceuse values of each species may lead to increased employment opportunities within regional abattoirs orharvesting enterprises. These benefits are relatively minor in comparison to cost pest impacts in most cases.Benefits are not deducted from cost impacts as data is not available for all species. Benefits associated withhunting, for example, or national symbol value in the case of the kangaroo, are difficult to estimate.
Structure of ReportThe social, economic and environmental impact of 11 major vertebrate pest species are initially describedwithin chapters for each pest species. Following these impact assessments, results are consolidated in thefinal section of the report. Research priorities are described given the magnitude of impacts estimated in theproceeding analysis and a new pest introduction scenario is simulated and costed to gain an appreciationfor possible impact. A great deal of data relating to agricultural production and enterprise profitability hasbeen assembled to estimate pest impact. These data sets are presented in the appendices so baseline dataunderpinning calculations are readily apparent.
ReferencesAustralian Bureau of Statistics (2002) Year Book Australia 2002, Population, Households and Families, 1301 – 2002, AGPS, Canberra
Bennett, J.W. (1984). Using Direct Questioning to Value the Existence Benefits of Preserved Natural Areas.Australian Journal of Agricultural Economics, 28(2,3): 136-152.
Bennett, J.W., Blamey, R. and Morrison, M. (1997) Valuing Damage to South Australian Wetlands using theContingent Valuation Method, Land and Water Resources Research and Development Corporation, Canberra
Burns, M., Damania, D. and Coombs, G. (1997) The Economic Value of King George Whiting and Snapper,Fisheries Research and Development Corporation report, FRDC Project 95/140, June.
Centre for International Economics (CIE) (2001) The CRC for Weed Management Systems: An ImpactAssessment, CRC for Weed Management Systems report
CPA Australia (2004) About Triple Bottom Line Reporting. www.cpaaustralia.com.au
8
Environment Australia (2003) Triple Bottom Line Reporting in Australia: A Guide to Reporting AgainstEnvironmental Indicators, Environment Australia, June 2003.
Global Reporting Initiative (2002) Sustainability Reporting Guidelines 2002. available onlinewww.globalreporting.org
Hampicke et al. (1991) Cited in Romer, A.U. and Pommerechne W.W. (1992) Germany and Switzerland, inNavrud, S. (ed.) Pricing the European Environment, Oslo, SUP.
Institute of Social and Ethical Accountability’s AA1000 Assurance Standard, at www.accountability.org.au
Jakobsson, K.M., and A.K. Dragun (1996) Contingent Valuation and Endangered Species: Methodological Issuesand Applications, Edward Elgar, Cheltenham, UK
Jakobsson, K.M., and A.K. Dragun (2001) The Worth of a Possum: Valuing Species with the ContingentValuation Method, Environmental and Resource Economics 19: 211-227
Lockwood, M. and Tracey, P. (1993) Assessment Of Nonmarket Conservation And Heritage Values RelatedTo Cattle Grazing On The Bogong High Plains, Victoria. 37th Annual Conference of the AgriculturalEconomists, Sydney
Loomis, J.B. (1987) Balancing Public Trust Resources of Mono Lake and Los Angeles Water Rights: AnEconomic Approach. Water Resources Research, 23(8): 1449-1456
Loomis, J.B. and White, D.S (1996) Economic Benefits of Rare and Endangered Species: Summary andMeta-analysis. Ecological Economics, 18: 197-206
Mitchell, R.C. and Carson, R.T. (1981) An Experiment In Measuring Willingness To Pay For Intrinsic WaterPollution Control Benefits. US Environmental Protection Agency report, Cited in Kneese, A.V. (1984)Measuring The Benefits Of Clean Air And Water. Resources for the Future, Washington DC
NSW EPA (2004) ENVALUE database www.epa.gov.au
Pimentel, D., Lach, L., Zuniga, R. and Morrison, D. (2000) Environmental and economic costs of non-indigenous species in the United States, Bioscience, 50(1): 53
Possingham, H, Ryan, S, Baxter, J and Morton, S (2002) Setting Biodiversity Priorities. Paper prepared aspart of the activities of the working group producing the report Sustaining our Natural Systems andBiodiversity for the Prime Minister’s Science, Engineering and Innovation Council in 2002.
Rolfe, J.C., Bennett, J.W. and Blamey, R.K. (2000) An Economic Evaluation of Broadscale Tree Clearing in theDesert Uplands Region of Queensland, Research Report No. 12, Choice Modelling Research Reports
Van Bueren, M.S., Lindner, R.K. and McLeod, P.B. (1993) An Economic Assessment of Relocating Salmon andHerring Stocks from the Commercial Sector to the Recreational Sector in Western Australia, Report to theFisheries Research and Development Corporation, FRDC Project 93,080, FRDC, Canberra.
Water Research Centre and Flood Hazard Research Centre (1989) Investment Appraisal For Sewage Schemes:The Assessment Of Social Costs. Water Research Centre Project Report, Swindon, cited in Barde, J.P. & Pearce,D.W. (1991). Valuing The Environment: Six Case Studies. OECD, Paris
Counting the Cost: Impact of Invasive Animals in Australia, 2004
9
European Mouse (Mus domesticus)
HistoryThe introduced house mouse most probably came to Australia with the First Fleet. Closely associated withhuman activity, mice are now found throughout the country, especially in agricultural and urban areas.Normally population levels are relatively low. However, when conditions are favourable mice numbers canincrease exponentially to plague proportions and they become a serious pest. Similar plagues areuncommon in other countries, even though mice are found worldwide.
The earliest reported mouse plague in Australia was in 1917 on the Darling Downs in Queensland and theyhave been occurring, with increasing frequency, ever since. Mouse plagues are most commonly observedwithin cereal grain producing areas of Queensland, NSW and southern Australia (Hone 1980, Mutze 1989,Plomley 1972, Redhead et al. 1985). Rainfall is the primary environmental cause of a mouse plague. (Hone1980, Mutze 1989, Newsome 1969, Redhead et al. 1985). As a result of changes in farming practices suchas the adoption of stubble retention, continuous cropping and widespread usage of minimum tillage thefrequency of mouse plagues was increasing, although, recent drought years have resulted in reducedmouse population pressures. Somewhere in the order of between 100,000 and 500,000 hectares of graincrops are subject to mouse infestation each year (McLeod and Arthur, 2002).
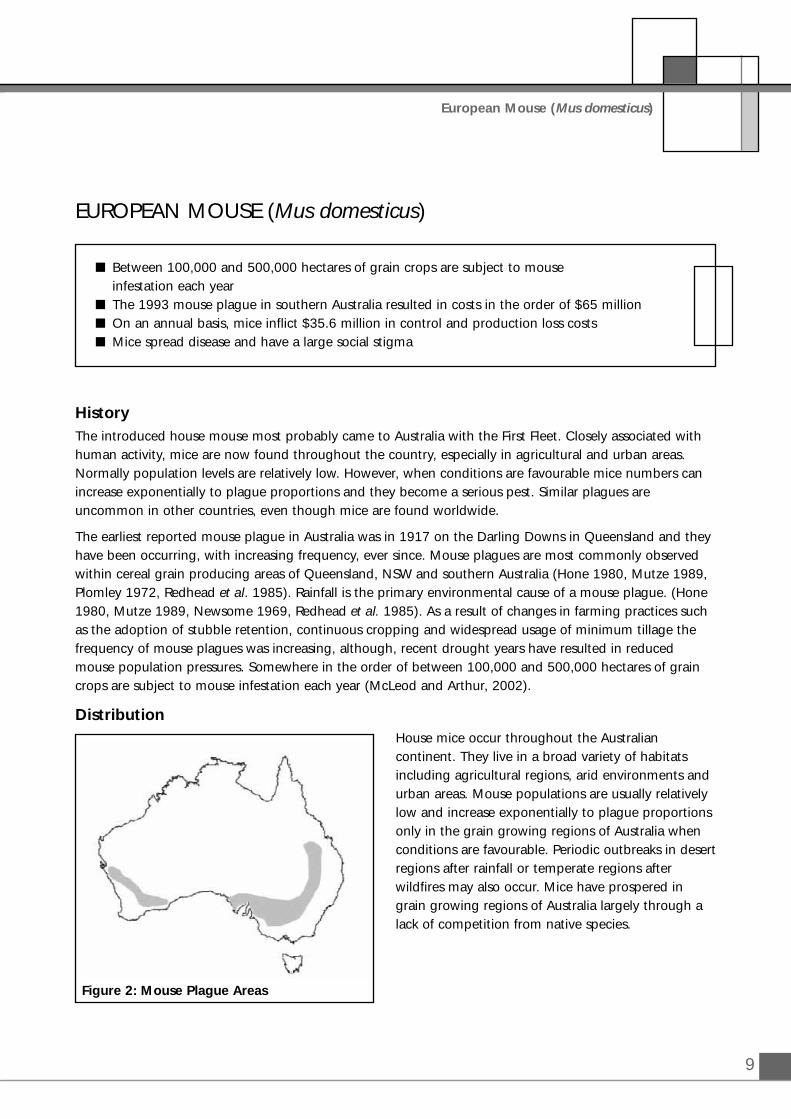
DistributionHouse mice occur throughout the Australiancontinent. They live in a broad variety of habitatsincluding agricultural regions, arid environments andurban areas. Mouse populations are usually relativelylow and increase exponentially to plague proportionsonly in the grain growing regions of Australia whenconditions are favourable. Periodic outbreaks in desertregions after rainfall or temperate regions afterwildfires may also occur. Mice have prospered ingrain growing regions of Australia largely through alack of competition from native species.
� Between 100,000 and 500,000 hectares of grain crops are subject to mouse infestation each year
� The 1993 mouse plague in southern Australia resulted in costs in the order of $65 million� On an annual basis, mice inflict $35.6 million in control and production loss costs� Mice spread disease and have a large social stigma
EUROPEAN MOUSE (Mus domesticus)
Figure 2: Mouse Plague Areas
10
Counting the Cost: Impact of Invasive Animals in Australia, 2004
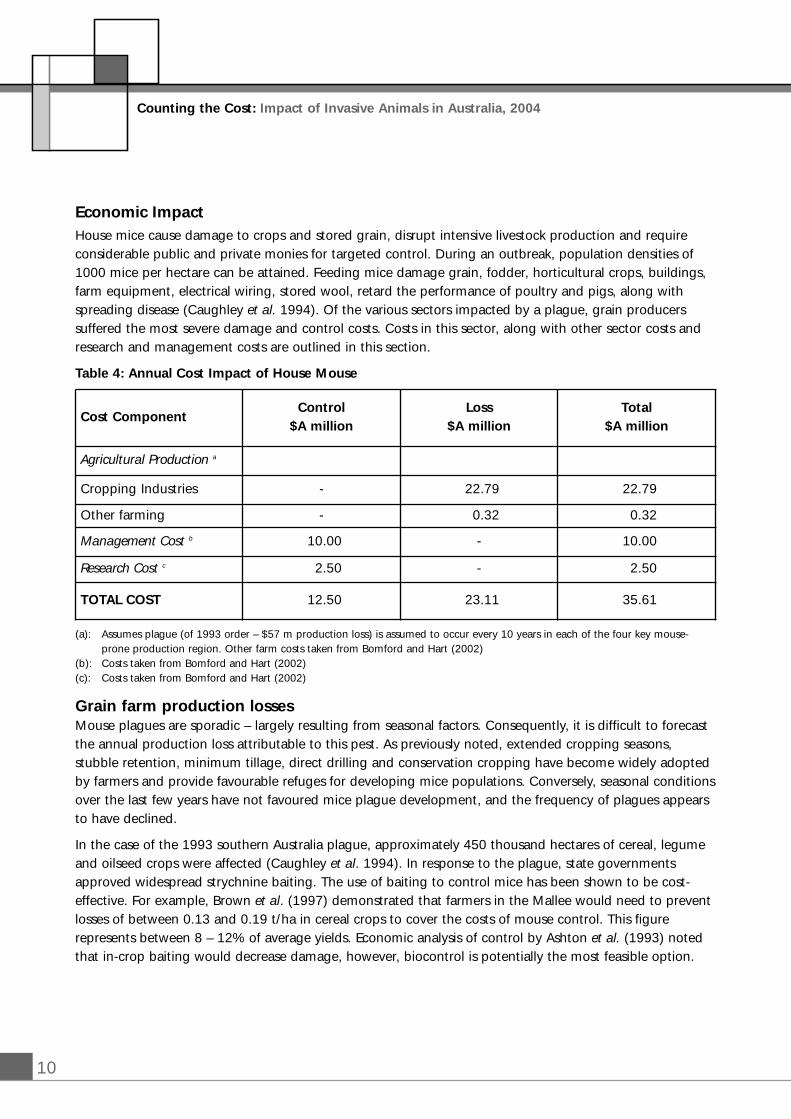
Economic ImpactHouse mice cause damage to crops and stored grain, disrupt intensive livestock production and requireconsiderable public and private monies for targeted control. During an outbreak, population densities of1000 mice per hectare can be attained. Feeding mice damage grain, fodder, horticultural crops, buildings,farm equipment, electrical wiring, stored wool, retard the performance of poultry and pigs, along withspreading disease (Caughley et al. 1994). Of the various sectors impacted by a plague, grain producerssuffered the most severe damage and control costs. Costs in this sector, along with other sector costs andresearch and management costs are outlined in this section.
Table 4: Annual Cost Impact of House Mouse
(a): Assumes plague (of 1993 order – $57 m production loss) is assumed to occur every 10 years in each of the four key mouse-prone production region. Other farm costs taken from Bomford and Hart (2002)
(b): Costs taken from Bomford and Hart (2002)(c): Costs taken from Bomford and Hart (2002)
Grain farm production lossesMouse plagues are sporadic – largely resulting from seasonal factors. Consequently, it is difficult to forecastthe annual production loss attributable to this pest. As previously noted, extended cropping seasons,stubble retention, minimum tillage, direct drilling and conservation cropping have become widely adoptedby farmers and provide favourable refuges for developing mice populations. Conversely, seasonal conditionsover the last few years have not favoured mice plague development, and the frequency of plagues appearsto have declined.
In the case of the 1993 southern Australia plague, approximately 450 thousand hectares of cereal, legumeand oilseed crops were affected (Caughley et al. 1994). In response to the plague, state governmentsapproved widespread strychnine baiting. The use of baiting to control mice has been shown to be cost-effective. For example, Brown et al. (1997) demonstrated that farmers in the Mallee would need to preventlosses of between 0.13 and 0.19 t/ha in cereal crops to cover the costs of mouse control. This figurerepresents between 8 – 12% of average yields. Economic analysis of control by Ashton et al. (1993) notedthat in-crop baiting would decrease damage, however, biocontrol is potentially the most feasible option.
Cost ComponentControl
$A millionLoss
$A millionTotal
$A million
Agricultural Production a
Cropping Industries - 22.79 22.79
Other farming - 0.32 0.32
Management Cost b 10.00 - 10.00
Research Cost c 2.50 - 2.50
TOTAL COST 12.50 23.11 35.61
11
European Mouse (Mus domesticus)
Despite the use of baiting in the 1993 plague, $58.9 million in losses were realised (Caughley et al. 1994).Given that a plague (of 1993 order) is assumed to occur every 10 years in each of the four key mouse-prone production regions, the annual cost of rodents to grain farmers – in any one year – is estimated to be$24.4 million. Of this total cost, $22.79 million is estimated to be production losses.
Other farmsMice invade intensive farming enterprises such as poultry housing and piggeries causing damage toinfrastructure, spoiling feed and, in some cases, causing damage to animals (Caughley et al. 1994). Inaddition to intensive farming, the grazing industry is impacted through mice consuming pastures,destroying feed grain and damaging stored hay. Similarly to grain producers, farm equipment and buildingsare damaged as a result of a plague. During the 1993 plague of southern Australia, losses within piggeriesand poultry farms were quantified as part of a phone survey. Most notably, mortality rates were higheramong new born pigs, stress of weaners decreased growth rates and white muscle disease was found incarcasses. Within egg production enterprises, the laying rate decreased by up to 20%. Based on informationfrom the phone survey, the mouse plague inflicted losses of $0.8 million, which included $0.03 million forbaits (Caughley et al. 1994). Given that a plague (of 1993 order) is assumed to occur every 10 years ineach of the four key mouse-prone production region, the annual cost of mice to other farmers – in any oneyear – is estimated to be $0.32 million.
House Mouse Management CostsIn addition to farming communities, house mice are pests within urban areas. A broad range of activitiesmay be impacted including retail businesses, community services and households. Shops selling food are athigh risk from suffering losses, while hotels and motels – which require high standards of cleanliness – alsoare affected. Schools, hospitals, telecommunications and grain storage facilities are damaged as a result ofmouse population outbreaks (Caughley et al. 1994). In addition to baiting, a number of other managementtechniques can be used to reduce population pressure. Brown et al. (1997) noted that the removal ofrubbish, mouse-proofing of grain storage facilities, grazing livestock on stubble, removal of weeds andoptimisation of machinery harvesting configurations to minimise spillage during harvest, can be pursued.These authors further note that there has been limited habitat modification research (Newsome 1969,Mutze 1991, Kay et al. 1994, Twigg and Kay 1994, Saunders and Korn 1984, Chambers et al. 1996).Bomford and Hart (2002) estimated that the total expenditure on mouse control by public and privatebodies was in the order of $10 million per year and $2.5 million on research targeting this species.
Environmental ImpactIn the past strong poisons were used to kill mice, which would have had non-target species ramifications orpossibly impacted upon natural predators of mice such as owls and other predatory birds. No informationwas found regarding the impacts of house mice on native flora and fauna, although some interaction isexpected.
Social ImpactIn terms of social impact, mice spread disease to humans, but most of all the build up of mice populationshas negative affects on the community as many people regard mice as unpleasant animals and feedingmice destroy household goods.
12
ReferencesAshton, D., Batterham, R., Godden, D. and Drynan, R. (1993) An economic model of rodent plaguedamage in Australia, 37th Annual Conference of the Australian Agricultural Economics Society, University ofSydney, 9-11 February
Bomford, M. (1987) Food and reproduction of wild house mice I. Diet and breeding seasons in varioushabitats on irrigated cereal farms in New South Wales. Australian Wildlife Research 14: 183-96
Bomford, M. and Hart, Q. (2002) Non-indigenous vertebrates in Australia, in Pimentel, D. (ed.) BiologicalInvasions – Economic and Environmental Costs of Alien Plant Animal and Microbe Species, CRC Press.
Brown, P.R., G.R. Singleton, S.C Dunn, D.A. Jones, K. O’Brien, and J.B. Griffiths (1997) Best farmmanagement practices to control mouse populations, Final Report to the Bureau of Resource Sciences and theGrains Research and Development Corporation.
Brown, P.R., Singleton, G.R, Kearns, B., and Griffiths, J. (1997) Evaluation and cost-effectiveness ofstrychnine for control of wild house mouse (Mus domesticus) populations in Victoria. Wildlife Research24: 159-172
Caughley, J., Monamy, B. and Heiden, K. (1994) Impact of the 1993 Mouse Plague, GRDC Occasional PaperNo.7, GRDC.
Chambers, L.K., Singleton, G.R., and van Wensveen, M. (1996) Spatial heterogeneity in wild populations ofhouse mice (Mus domesticus) on the Darling Downs, south-eastern Queensland. Wildlife Research 23: 23-38
Hone, J. (1980) Probabilities of House Mouse (Mus musculus) Plagues and their Use in control, AustralianWildlife Research 7: 417-20
Kay, B.J. Twigg, L.E., Korn, T.J., and Nicol, H.I. (1994) The use of artificial perches to increase predation onhouse mice (Mus domesticus) by raptors, Wildlife Research 21: 95-106
McLeod, R. and Arthur, A. (2002) Product Development Plan, Unpublished Report to the Pest Animal ControlCRC, Canberra, pp. 48
Mutze, G.J. (1989) Mouse Plagues in South Australian Cereal-growing Areas. I. Occurrence and Distributionof Plagues from 1900 to 1984, Australian Wildlife Research 16: 677-83
Mutze, G.J. (1991) Mouse plagues in South Australian cereal-growing areas III. Changes in mouseabundance during plague and non-plague years, and the role of refugia, Wildlife Research 18: 593-604
Newsome, A.E. (1969) A Population Study of House-mice Temporarily Inhabiting a South AustralianWheatfield, Journal of Animal Ecology 38: 341-359
Plomley, N.J.B. (1972) Some notes on plagues of small mammals in Australia, Journal of Natural History6: 363-384
Redhead, T.D., Enright, N. and Newsome, A.E. (1985) Causes and predictions of outbreaks of Mus musculusin irrigated and non-irrigated cereal farms, Acta Zoological Fennica 173: 123-7
Saunders, G., and Korn, T. (1984). Mouse plague control. Agdex 672. Advisory Note No. 15/84. Departmentof Agriculture New South Wales, Orange.
Singleton, G.R. (1989) Population dynamics of an outbreak of house mice (Mus domesticus) in the malleewheatlands of Australia – hypothesis of plague formation, Journal of Zoology (London) 219: 495-515
Twigg, L.E. and Kay, B.J. (1994) The effects of microhabitat and weather on house mouse (Mus domesticus)numbers and the implications for management, Journal of Applied Ecology 31: 651-663
Counting the Cost: Impact of Invasive Animals in Australia, 2004
13
European Rabbits (Oryctolagus cuniculus)
EUROPEAN RABBITS (Oryctolagus cuniculus)
HistoryThe rabbit originated in Spain and southern France and domesticated rabbits arrived in Australia with thefirst fleet. The first feral populations were in south-eastern Tasmania where they numbered in the thousandson some estates by 1827. Thomas Austin, a member of the Victorian Acclimatisation Society, released 24rabbits he had brought from England onto his property near Geelong for sport hunting on Christmas Day,1859. By 1886 rabbits had spread north as far as the Queensland – New South Wales border and by 1900they had reached Western Australia and the Northern Territory.
The rate of spread of the rabbit in Australia was the fastest of any colonising mammal anywhere in theworld and was aided by the presence of burrows of native species and modifications to the naturalenvironment made for farming. Rabbits are now one of the most widely distributed and abundantmammals in Australia. Since the introduction of RHDV, rabbit numbers have been reduced in arid areas,although the biological agent is not as effective in more humid, higher rainfall areas.
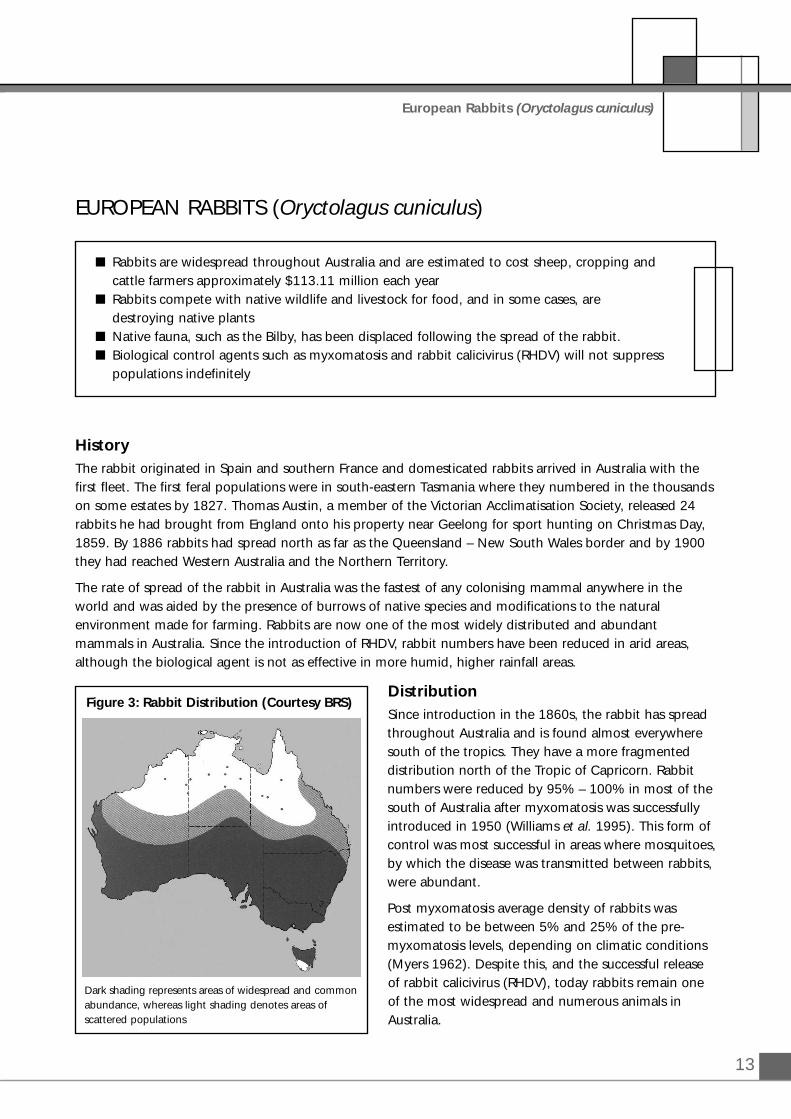
DistributionSince introduction in the 1860s, the rabbit has spreadthroughout Australia and is found almost everywheresouth of the tropics. They have a more fragmenteddistribution north of the Tropic of Capricorn. Rabbitnumbers were reduced by 95% – 100% in most of thesouth of Australia after myxomatosis was successfullyintroduced in 1950 (Williams et al. 1995). This form ofcontrol was most successful in areas where mosquitoes,by which the disease was transmitted between rabbits,were abundant.
Post myxomatosis average density of rabbits wasestimated to be between 5% and 25% of the pre-myxomatosis levels, depending on climatic conditions(Myers 1962). Despite this, and the successful releaseof rabbit calicivirus (RHDV), today rabbits remain oneof the most widespread and numerous animals inAustralia.
Dark shading represents areas of widespread and commonabundance, whereas light shading denotes areas ofscattered populations
� Rabbits are widespread throughout Australia and are estimated to cost sheep, cropping and cattle farmers approximately $113.11 million each year
� Rabbits compete with native wildlife and livestock for food, and in some cases, are destroying native plants
� Native fauna, such as the Bilby, has been displaced following the spread of the rabbit. � Biological control agents such as myxomatosis and rabbit calicivirus (RHDV) will not suppress
populations indefinitely
Figure 3: Rabbit Distribution (Courtesy BRS)
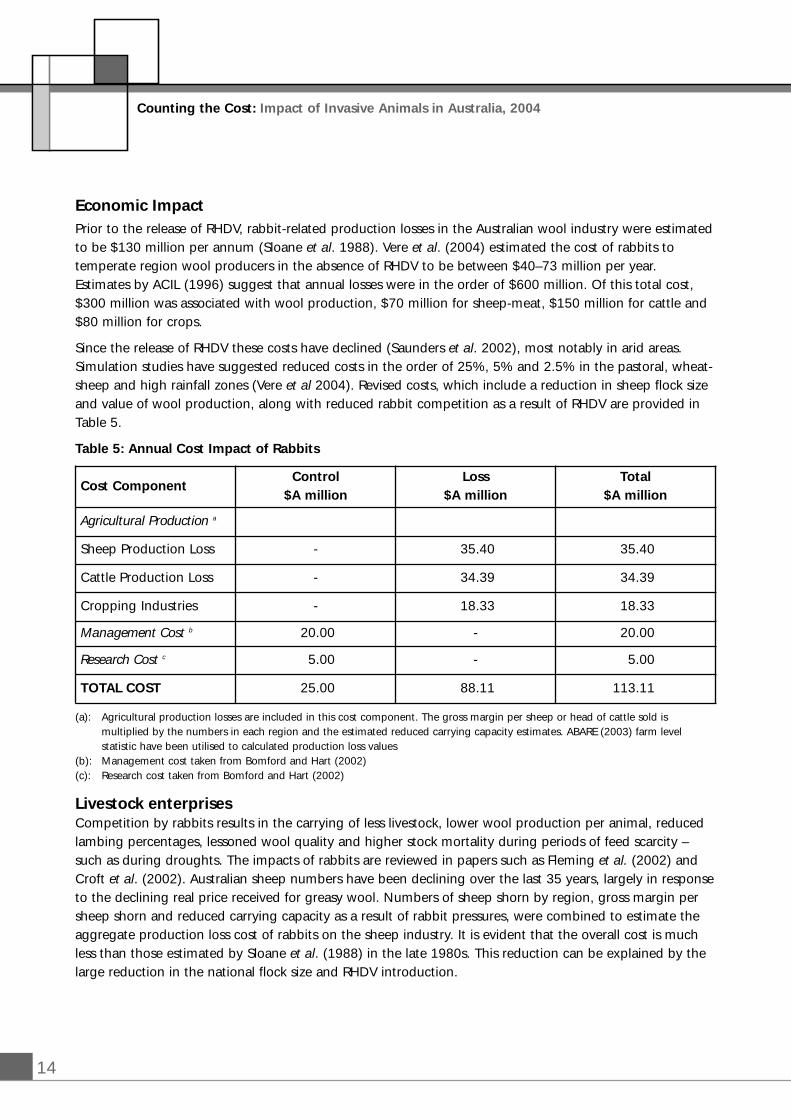
Economic ImpactPrior to the release of RHDV, rabbit-related production losses in the Australian wool industry were estimatedto be $130 million per annum (Sloane et al. 1988). Vere et al. (2004) estimated the cost of rabbits totemperate region wool producers in the absence of RHDV to be between $40–73 million per year. Estimates by ACIL (1996) suggest that annual losses were in the order of $600 million. Of this total cost,$300 million was associated with wool production, $70 million for sheep-meat, $150 million for cattle and$80 million for crops.
Since the release of RHDV these costs have declined (Saunders et al. 2002), most notably in arid areas.Simulation studies have suggested reduced costs in the order of 25%, 5% and 2.5% in the pastoral, wheat-sheep and high rainfall zones (Vere et al 2004). Revised costs, which include a reduction in sheep flock sizeand value of wool production, along with reduced rabbit competition as a result of RHDV are provided inTable 5.
Table 5: Annual Cost Impact of Rabbits
(a): Agricultural production losses are included in this cost component. The gross margin per sheep or head of cattle sold is multiplied by the numbers in each region and the estimated reduced carrying capacity estimates. ABARE (2003) farm level statistic have been utilised to calculated production loss values
(b): Management cost taken from Bomford and Hart (2002)(c): Research cost taken from Bomford and Hart (2002)
Livestock enterprisesCompetition by rabbits results in the carrying of less livestock, lower wool production per animal, reducedlambing percentages, lessoned wool quality and higher stock mortality during periods of feed scarcity –such as during droughts. The impacts of rabbits are reviewed in papers such as Fleming et al. (2002) andCroft et al. (2002). Australian sheep numbers have been declining over the last 35 years, largely in responseto the declining real price received for greasy wool. Numbers of sheep shorn by region, gross margin persheep shorn and reduced carrying capacity as a result of rabbit pressures, were combined to estimate theaggregate production loss cost of rabbits on the sheep industry. It is evident that the overall cost is muchless than those estimated by Sloane et al. (1988) in the late 1980s. This reduction can be explained by thelarge reduction in the national flock size and RHDV introduction.
14
Counting the Cost: Impact of Invasive Animals in Australia, 2004
Cost ComponentControl
$A millionLoss
$A millionTotal
$A million
Agricultural Production a
Sheep Production Loss - 35.40 35.40
Cattle Production Loss - 34.39 34.39
Cropping Industries - 18.33 18.33
Management Cost b 20.00 - 20.00
Research Cost c 5.00 - 5.00
TOTAL COST 25.00 88.11 113.11
15
European Rabbits (Oryctolagus cuniculus)
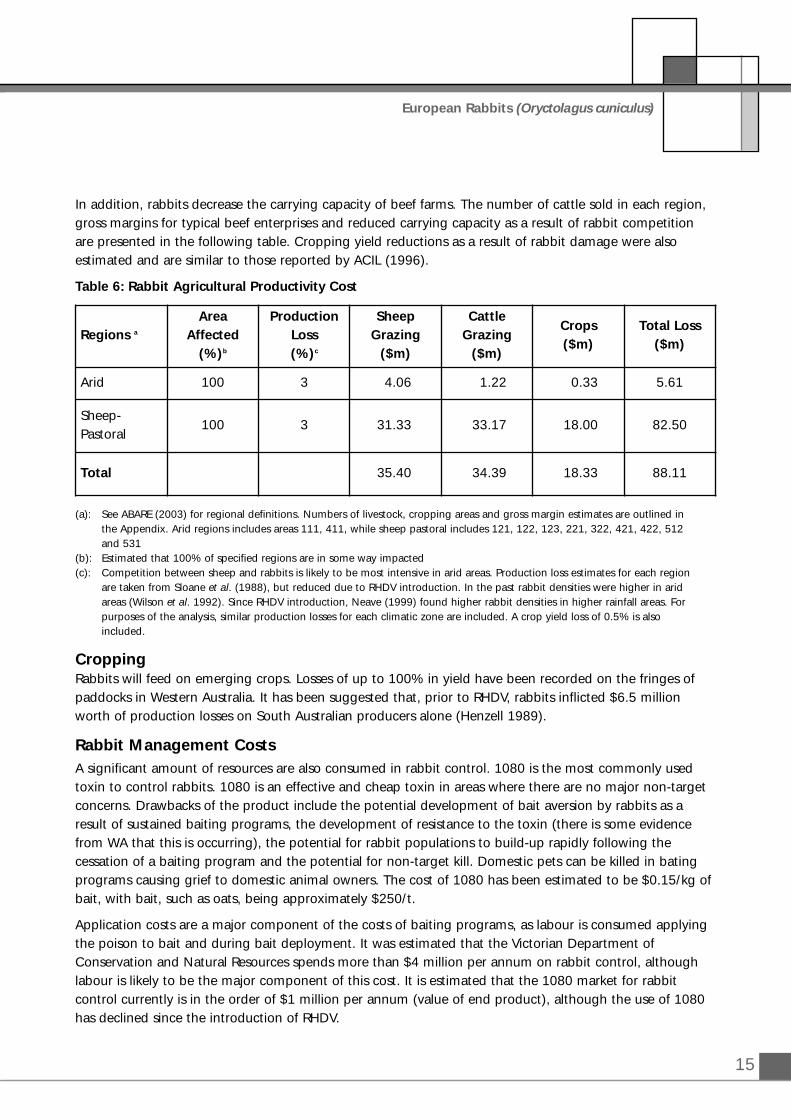
In addition, rabbits decrease the carrying capacity of beef farms. The number of cattle sold in each region,gross margins for typical beef enterprises and reduced carrying capacity as a result of rabbit competitionare presented in the following table. Cropping yield reductions as a result of rabbit damage were alsoestimated and are similar to those reported by ACIL (1996).
Table 6: Rabbit Agricultural Productivity Cost
(a): See ABARE (2003) for regional definitions. Numbers of livestock, cropping areas and gross margin estimates are outlined in the Appendix. Arid regions includes areas 111, 411, while sheep pastoral includes 121, 122, 123, 221, 322, 421, 422, 512 and 531
(b): Estimated that 100% of specified regions are in some way impacted(c): Competition between sheep and rabbits is likely to be most intensive in arid areas. Production loss estimates for each region
are taken from Sloane et al. (1988), but reduced due to RHDV introduction. In the past rabbit densities were higher in arid areas (Wilson et al. 1992). Since RHDV introduction, Neave (1999) found higher rabbit densities in higher rainfall areas. For purposes of the analysis, similar production losses for each climatic zone are included. A crop yield loss of 0.5% is also included.
CroppingRabbits will feed on emerging crops. Losses of up to 100% in yield have been recorded on the fringes ofpaddocks in Western Australia. It has been suggested that, prior to RHDV, rabbits inflicted $6.5 millionworth of production losses on South Australian producers alone (Henzell 1989).
Rabbit Management CostsA significant amount of resources are also consumed in rabbit control. 1080 is the most commonly usedtoxin to control rabbits. 1080 is an effective and cheap toxin in areas where there are no major non-targetconcerns. Drawbacks of the product include the potential development of bait aversion by rabbits as aresult of sustained baiting programs, the development of resistance to the toxin (there is some evidencefrom WA that this is occurring), the potential for rabbit populations to build-up rapidly following thecessation of a baiting program and the potential for non-target kill. Domestic pets can be killed in batingprograms causing grief to domestic animal owners. The cost of 1080 has been estimated to be $0.15/kg ofbait, with bait, such as oats, being approximately $250/t.
Application costs are a major component of the costs of baiting programs, as labour is consumed applyingthe poison to bait and during bait deployment. It was estimated that the Victorian Department ofConservation and Natural Resources spends more than $4 million per annum on rabbit control, althoughlabour is likely to be the major component of this cost. It is estimated that the 1080 market for rabbitcontrol currently is in the order of $1 million per annum (value of end product), although the use of 1080has declined since the introduction of RHDV.
Regions a
AreaAffected
(%)b
ProductionLoss(%)c
SheepGrazing
($m)
Cattle Grazing
($m)
Crops ($m)
Total Loss ($m)
Arid 100 3 4.06 1.22 0.33 5.61
Sheep-Pastoral
100 3 31.33 33.17 18.00 82.50
Total 35.40 34.39 18.33 88.11
16
There are a number of indirect costs of rabbits which include disease transmission and degradation ofrangelands leading to higher soilage of wool. William et al. (1994) noted that rabbit control costs in privateforests can be as high as $80 per hectare during periods when trees are vulnerable to rabbit damage.Management costs are included in this assessment following Bomford and Hart (2002).
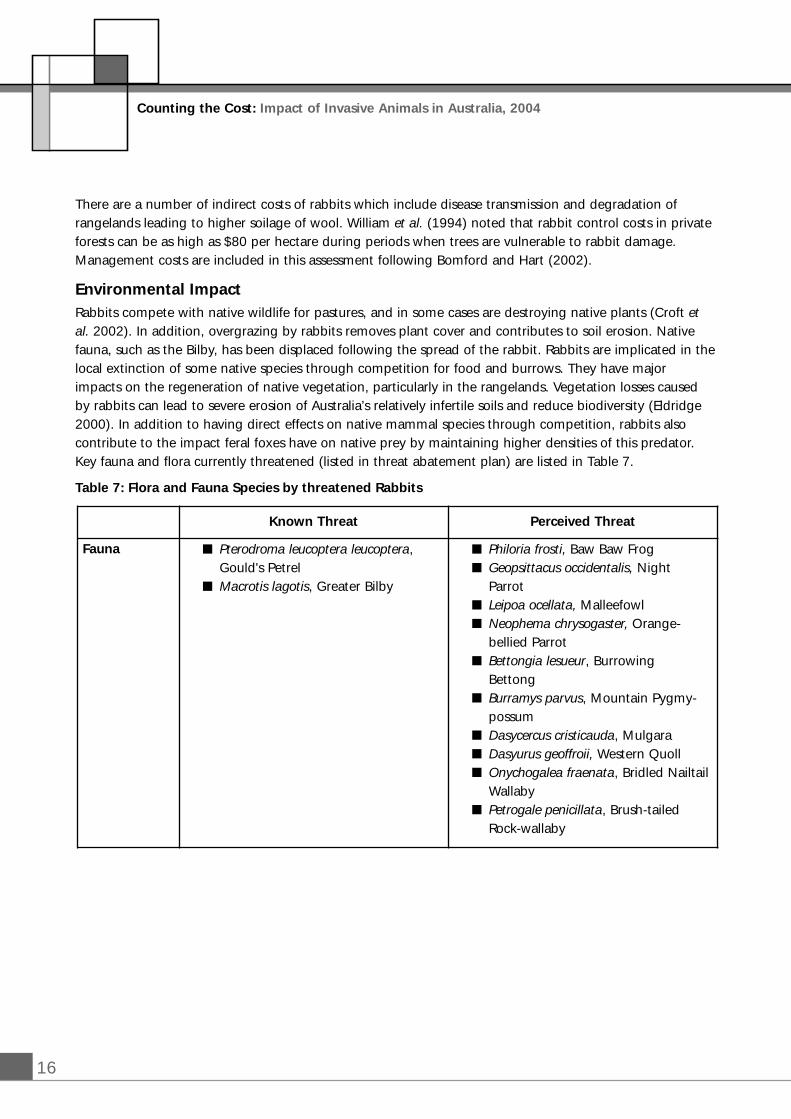
Environmental ImpactRabbits compete with native wildlife for pastures, and in some cases are destroying native plants (Croft etal. 2002). In addition, overgrazing by rabbits removes plant cover and contributes to soil erosion. Nativefauna, such as the Bilby, has been displaced following the spread of the rabbit. Rabbits are implicated in thelocal extinction of some native species through competition for food and burrows. They have majorimpacts on the regeneration of native vegetation, particularly in the rangelands. Vegetation losses causedby rabbits can lead to severe erosion of Australia’s relatively infertile soils and reduce biodiversity (Eldridge2000). In addition to having direct effects on native mammal species through competition, rabbits alsocontribute to the impact feral foxes have on native prey by maintaining higher densities of this predator.Key fauna and flora currently threatened (listed in threat abatement plan) are listed in Table 7.
Table 7: Flora and Fauna Species by threatened Rabbits
Counting the Cost: Impact of Invasive Animals in Australia, 2004
Known Threat Perceived Threat
Fauna � Pterodroma leucoptera leucoptera, Gould's Petrel
� Macrotis lagotis, Greater Bilby
� Philoria frosti, Baw Baw Frog� Geopsittacus occidentalis, Night
Parrot� Leipoa ocellata, Malleefowl� Neophema chrysogaster, Orange-
bellied Parrot� Bettongia lesueur, Burrowing
Bettong� Burramys parvus, Mountain Pygmy-
possum� Dasycercus cristicauda, Mulgara� Dasyurus geoffroii, Western Quoll� Onychogalea fraenata, Bridled Nailtail
Wallaby� Petrogale penicillata, Brush-tailed
Rock-wallaby
17
European Rabbits (Oryctolagus cuniculus)
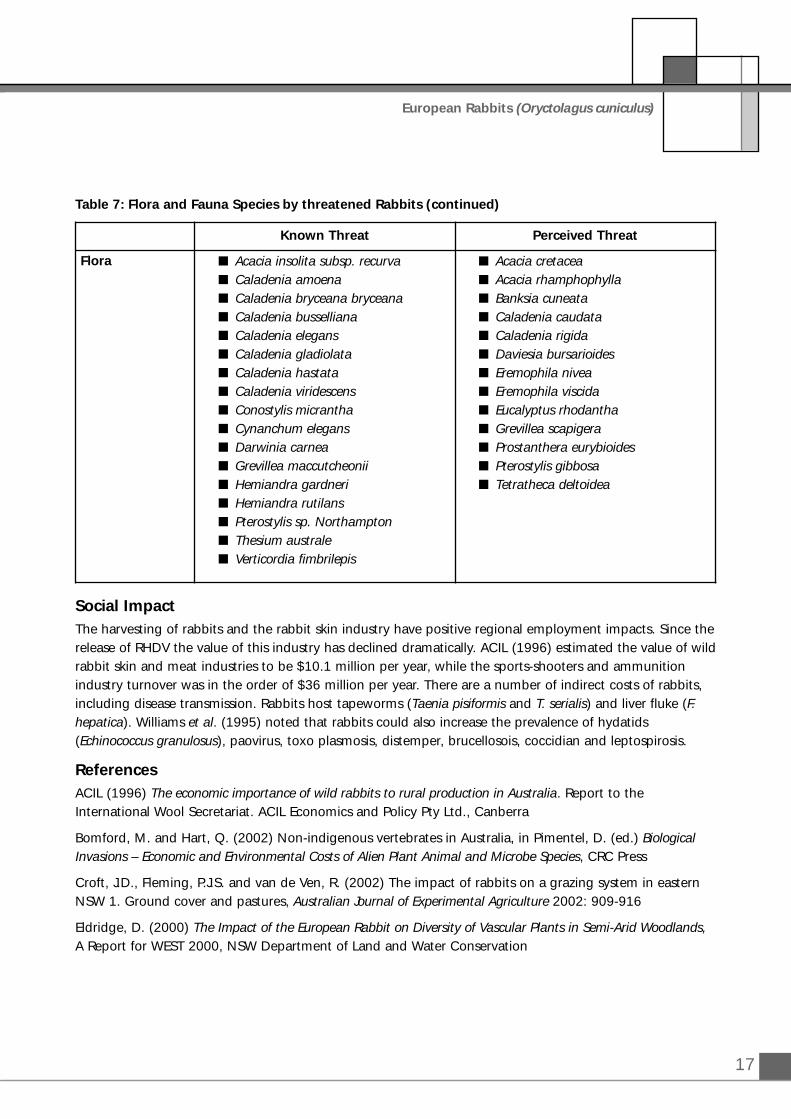
Table 7: Flora and Fauna Species by threatened Rabbits (continued)
Social ImpactThe harvesting of rabbits and the rabbit skin industry have positive regional employment impacts. Since therelease of RHDV the value of this industry has declined dramatically. ACIL (1996) estimated the value of wildrabbit skin and meat industries to be $10.1 million per year, while the sports-shooters and ammunitionindustry turnover was in the order of $36 million per year. There are a number of indirect costs of rabbits,including disease transmission. Rabbits host tapeworms (Taenia pisiformis and T. serialis) and liver fluke (F.hepatica). Williams et al. (1995) noted that rabbits could also increase the prevalence of hydatids(Echinococcus granulosus), paovirus, toxo plasmosis, distemper, brucellosois, coccidian and leptospirosis.
ReferencesACIL (1996) The economic importance of wild rabbits to rural production in Australia. Report to theInternational Wool Secretariat. ACIL Economics and Policy Pty Ltd., Canberra
Bomford, M. and Hart, Q. (2002) Non-indigenous vertebrates in Australia, in Pimentel, D. (ed.) BiologicalInvasions – Economic and Environmental Costs of Alien Plant Animal and Microbe Species, CRC Press
Croft, J.D., Fleming, P.J.S. and van de Ven, R. (2002) The impact of rabbits on a grazing system in easternNSW 1. Ground cover and pastures, Australian Journal of Experimental Agriculture 2002: 909-916
Eldridge, D. (2000) The Impact of the European Rabbit on Diversity of Vascular Plants in Semi-Arid Woodlands,A Report for WEST 2000, NSW Department of Land and Water Conservation
Known Threat Perceived Threat
Flora � Acacia insolita subsp. recurva� Caladenia amoena� Caladenia bryceana bryceana� Caladenia busselliana� Caladenia elegans� Caladenia gladiolata� Caladenia hastata� Caladenia viridescens� Conostylis micrantha� Cynanchum elegans� Darwinia carnea� Grevillea maccutcheonii� Hemiandra gardneri� Hemiandra rutilans� Pterostylis sp. Northampton� Thesium australe� Verticordia fimbrilepis
� Acacia cretacea� Acacia rhamphophylla� Banksia cuneata� Caladenia caudata� Caladenia rigida� Daviesia bursarioides� Eremophila nivea� Eremophila viscida� Eucalyptus rhodantha� Grevillea scapigera� Prostanthera eurybioides� Pterostylis gibbosa� Tetratheca deltoidea

18
Fleming, P.J.S., Croft, J.D., and Nicol, H.I. (2002) The impact of rabbits on a grazing system in eastern NSW2. Sheep production, Australian Journal of Experimental Agriculture 2002: 917-923.
Henzell, R. (1989) Proclaimed Animal Research in South Australia – costs-benefits, future direction and relatedissues, Animal and Plant Control Commission, Adelaide
Myers, K (1962) A survey of myxomatosis and rabbit infestation trends in the eastern Riverina New SouthWales 1951-60, CSIRO Wildlife Research 7: 1-12
Neave, H.M. (1999) Rabbit Calicivirus Disease Program Report 1: Overview of effects on Australian wild rabbitpopulations and implications for agriculture and biodiversity, Rabbit Calicivirus Disease Monitoring andSurveillance Program and Epidemiology Research Program report, RCD Management Group, Bureau ofRural Sciences, Canberra
Saunders, G., Kay, B., Mutze, G. and Choquenot, D. (2002) Observations on the impacts of the rabbitcalicivirus disease on agricultural production values Australia, Wildlife. Research 29: 605-613
Sloane, Cook and King (1988) The Economic Impact of Pasture Weeds, Pests and Diseases on the AustralianWool Industry, consultant Report to the Australian Wool Corporation, December 1988
Vere, D., Jones, R. and G. Saunders (2004) The economic benefits of rabbit control in Australian temperatepastures by the introduction of rabbit haemorrhagic disease, Agricultural Economics 30 (2004): 143-155
Williams, C.K., Parer, I., Coman, B.J., Burley, J. and Braysher, M.L. (1995) Managing Vertebrate Pests: Rabbits,Bureau of Resource Sciences and CSIRO Division of Wildlife and Ecology, AGPS, Canberra
Wilson, G., Dexter, N., O’Brien, P. and Bomford, M. (1992) Pest animals in Australia: a survey of introducedwild mammals, Bureau of Rural Sciences and Kangaroo Press, Canberra, pp 64
Counting the Cost: Impact of Invasive Animals in Australia, 2004
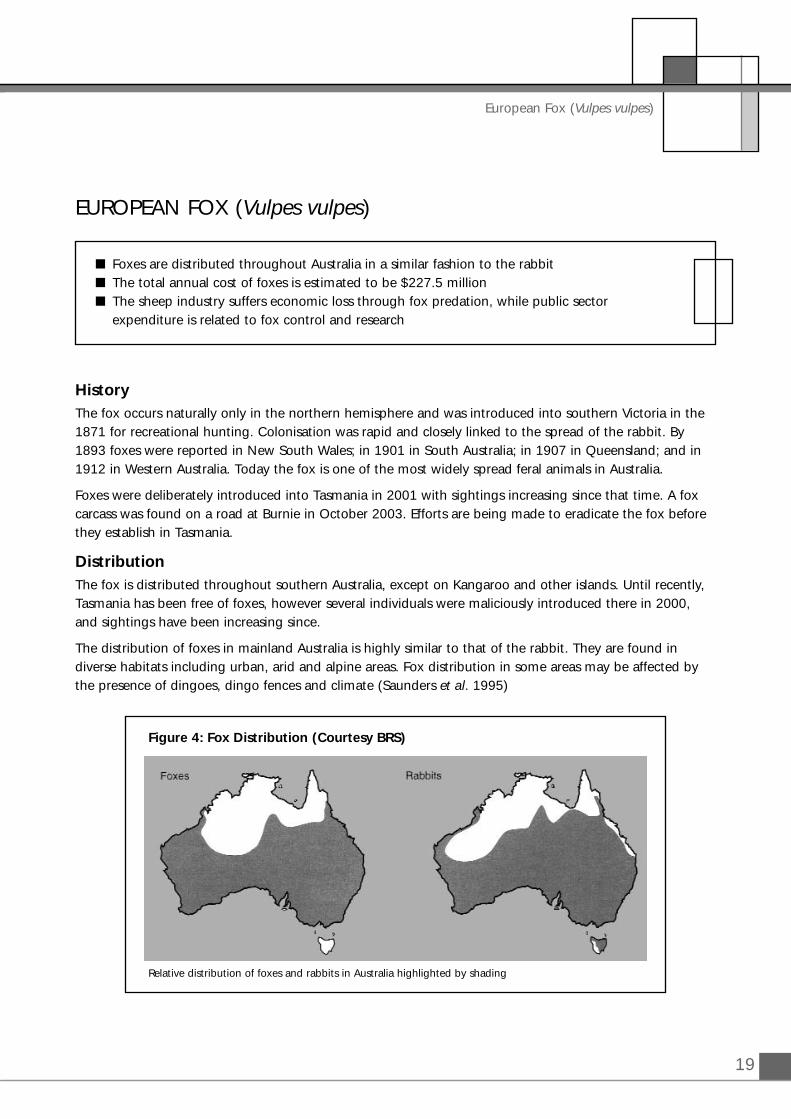
19
European Fox (Vulpes vulpes)
HistoryThe fox occurs naturally only in the northern hemisphere and was introduced into southern Victoria in the1871 for recreational hunting. Colonisation was rapid and closely linked to the spread of the rabbit. By1893 foxes were reported in New South Wales; in 1901 in South Australia; in 1907 in Queensland; and in1912 in Western Australia. Today the fox is one of the most widely spread feral animals in Australia.
Foxes were deliberately introduced into Tasmania in 2001 with sightings increasing since that time. A foxcarcass was found on a road at Burnie in October 2003. Efforts are being made to eradicate the fox beforethey establish in Tasmania.
DistributionThe fox is distributed throughout southern Australia, except on Kangaroo and other islands. Until recently,Tasmania has been free of foxes, however several individuals were maliciously introduced there in 2000,and sightings have been increasing since.
The distribution of foxes in mainland Australia is highly similar to that of the rabbit. They are found indiverse habitats including urban, arid and alpine areas. Fox distribution in some areas may be affected bythe presence of dingoes, dingo fences and climate (Saunders et al. 1995)
� Foxes are distributed throughout Australia in a similar fashion to the rabbit� The total annual cost of foxes is estimated to be $227.5 million� The sheep industry suffers economic loss through fox predation, while public sector
expenditure is related to fox control and research
EUROPEAN FOX (Vulpes vulpes)
Relative distribution of foxes and rabbits in Australia highlighted by shading
Figure 4: Fox Distribution (Courtesy BRS)
20
Counting the Cost: Impact of Invasive Animals in Australia, 2004
Economic ImpactAgricultural, environmental, management and research costs associated with foxes are provided in thefollowing table. It is evident that the sheep industry suffers economic loss through fox predation, whilepublic sector expenditure is related to fox control and research.
Table 8: Annual Cost Impact of Foxes
(a): Key loss is lamb predation. ABARE (2003) estimate 35 million lambs marked per year. Assumed 2% of all lambs marked are taken by foxes at a cost of $25 per head. See Saunders et al. (1997) for background of lamb predation.
(b): Management cost taken from Bomford and Hart (2002). Fox control expenditure in Tasmania of $9 million per year is also included (Tasmanian Dept. of Primary Industries, Water and Environment estimate)
(c): Research cost taken from Bomford and Hart (2002)
Sheep industryStudies quantifying the impact of foxes on lamb production have produced variable results, with reports offoxes taking up to 30% of lambs in some areas (Lugton 1993) At present, there are 35 million lambs inAustralia, with lambing losses being the main impact foxes have on the sheep industry. Significant amountsof resources are committed to fox control. Farmers most commonly shoot foxes and/or implement baitingprograms. These are likely to remain the most effective short-term treatments to protect farms fromlambing losses. Baiting can be difficult in rough terrain, particularly in the east where aerial distribution islargely avoided.
Fox Management CostsAnnually, over $16 million are spent managing the impacts of foxes in Australia. A further $4 million aredevoted to research into fox control and the development of new management tools and strategies.
Environmental ImpactAustralia accounts for about one third of the world’s mammal species that have become extinct in moderntimes (Groombridge 1993). The fox is threatening the survival of many Australian mammals and birds(Saunders et al. 1994). Most commentators agree that the introduction of exotic predators, such as theEuropean Red Fox (Vulpes vulpes), has contributed to the decline of many species of reptiles, mammals andbirds in Australia. Following the methodology in Pimentel et al. (2000), the impact of fox predation on thebird population in Australia is valued. The assumptions used to quantify this impact are summarised in Table9 and described in the subsequent text.
Cost ComponentControl
$A millionLoss
$A millionTotal
$A million
Agricultural Production a
Sheep Production Loss - 17.50 17.50
Environmental Impact Cost - 190.00 190.00
Management Cost b 16.00 - 16.00
Research Cost c 4.00 - 4.00
TOTAL COST 20.00 207.50 227.50
21
European Fox (Vulpes vulpes)
Table 9: Summary of Fox Biodiversity Impact Assumptions (Fox)
It is difficult to ascertain the current number of foxes in Australia as the range and density of foxes in thevarious agro-ecological zones of Australia fluctuate considerably. Saunders et al. (1994) noted that estimatesof fox densities vary from as high as fifteen adults per km2 in urban areas of Britain (Harris and Rayner 1986,Harris and Smith 1987) to as low as 0.1 adults per km2 in tundra and boreal forest (Voigt 1987). In thisassessment it is assumed that about half of Australia supports fox populations, at an average density of 2foxed per km2. Given these assumptions the total Australian fox populations is calculated to be about 7.2million.
The extent of predation is similarly difficult to determine. There has been a range of fox dietary studies todetermine the eating habits of this species. Saunders et al. (1994) indicated that two of the mostcomprehensive were by Coman (1973) and Croft and Hone (1978), in Victoria and New South Walesrespectively. Examination of the gut content of foxes found the most common items to be sheep, rabbitsand house mice. These items accounted for about 70% by volume, while other macropods represented 2% and birds 6% by volume.
Assumptions and value Source
Fox range – 3.6 million km2 From distribution maps, foxes appear to bedispersed across about half of Australia (see maps inSaunders et al. 1994)
Fox density – 2 per km2. Derived from Coman et al1991 for temperate grazing (3.9), Thompson andFleming 1994 for temperate grazing (4.6-7.2),Newsome and Catling 1992 for dry sclerophyllforest (0.2), Newsome and Catling 1992 for semiarid grazing (2.0), Marlow 1992 for arid grazing(0.9), and as high as (0-12) for urban outlined inSaunders et al. 1994
Densities vary widely across Australia from 15 perkm2 in urban areas, to averages of about 1–5 in drysclerophyll and temperate grazing areas and 0.1 intundra. An average of 2 km2 is used in the study
Total Australian fox population – 7.2 million Derived from density and range assumptions
Food requirement for foxes per day – 372 g / fox/day or 136 kg per fox / year
Saunders et al. (1993) constructed a generalisedmodel to estimate the daily energy expenditure,excluding direct costs of reproduction, for urbanfoxes
Live bird off-take by foxes per year – 9.5 million kg Assumes 1% of feed requirement met by live birds(see diet studies by Coman 1973, Croft and Hone1978).
Number of birds equivalent – 190 million per year Assumes each native bird weighs somewherearound 50 g
Value of bird predation – $A 190 million per year Each bird valued at $1 – derived from Pimentel et al. (2000) method
22
Gut content studies give no real indication of the quantum of feed intake by foxes over any period of time.To determine overall feed requirement, Saunders et al. (1993) developed a generalised model to calculatedaily energy expenditure. Based on yearly averages, an adult male required 2001 kJ per day or theequivalent of 372 grams of wild bird. If it is assumed that 1% of the 372 g per day feed intake is birds, thenfoxes account for about 9.5 million kg per year of live bird predation. Converting this volume of off-take by an average bird weight of 50 g, foxes are estimated to account for 190 million fatalities per year. Thisoff-take is converted to a cost value by assuming each bird is valued by the community at $1 and the totalvalue of fox predation is $190 million per year.
Saunders et al. (1994) concluded, “while diet studies indicate the range of prey consumed by foxes, dietstudies alone are not a reliable indication of the extent of damage caused by foxes. Some endangerednative species may occur only rarely in the diet, but foxes may be having a significant impact on theirpopulations. Conversely, other species that occur consistently in fox diet maybe in sufficient numbers thatthey can tolerate long-term fox predation without any resulting decline in population densities. Thedamage that fox predation causes to native fauna can only be quantified by scientifically designed andreplicated studies where fox predation is reduced and the response of the prey is monitored”. With thisissue in mind, the range of fauna current at risk from extinction due to fox predation is detailed in thefollowing table from the national abatement plan.
Table 10: Summary of Fauna Species threatened by Foxes
Counting the Cost: Impact of Invasive Animals in Australia, 2004
Known Threat Perceived Threat
� Leipoa ocellata, Malleefowl� Sterna albifrons, Little Tern� Dasyurus geoffroii, Western Quoll� Lagorchestes hirsutus, Rufous
Hare-wallaby� Macrotis lagotis, Greater Bilby� Myrmecobius fasciatus, Numbat� Perameles gunnii, Eastern Barred
Bandicoot� Petrogale lateralis, Black-footed
Rock-wallaby� Potorous longipes, Long-footed
Potoroo� Caretta caretta, Loggerhead Turtle� Chelonia mydas, Green Turtle
� Philoria frosti, Baw Baw Frog� Geopsittacus occidentalis, Night
Parrot� Neophema chrysogaster, Orange-
bellied Parrot� Pezoporus wallicus flaviventris,
Western Ground Parrot� Stipiturus malachurus intermedius,
Mount Lofty Southern Emu-wren� Turnix melanogaster, Black-breasted
Button-quail� Pseudomys fieldi, Djoongari� Bettongia lesueur, Burrowing
Bettong� Sminthopsis douglasi, Julia Creek
Dunnart� Bettongia tropica, Northern Bettong� Burramys parvus, Mountain Pygmy-
possum� Dasycercus cristicauda, Mulgara� Dasyuroides byrnei, Kowari
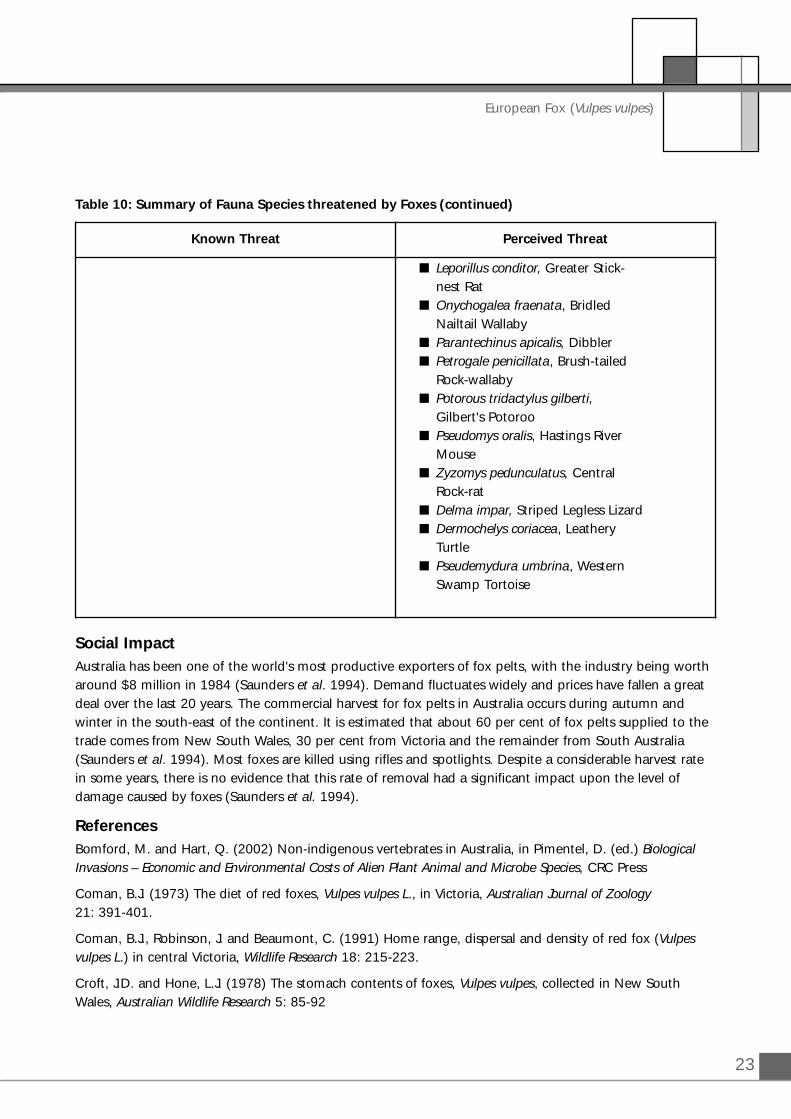
23
European Fox (Vulpes vulpes)
Table 10: Summary of Fauna Species threatened by Foxes (continued)
Social ImpactAustralia has been one of the world's most productive exporters of fox pelts, with the industry being wortharound $8 million in 1984 (Saunders et al. 1994). Demand fluctuates widely and prices have fallen a greatdeal over the last 20 years. The commercial harvest for fox pelts in Australia occurs during autumn andwinter in the south-east of the continent. It is estimated that about 60 per cent of fox pelts supplied to thetrade comes from New South Wales, 30 per cent from Victoria and the remainder from South Australia(Saunders et al. 1994). Most foxes are killed using rifles and spotlights. Despite a considerable harvest ratein some years, there is no evidence that this rate of removal had a significant impact upon the level ofdamage caused by foxes (Saunders et al. 1994).
ReferencesBomford, M. and Hart, Q. (2002) Non-indigenous vertebrates in Australia, in Pimentel, D. (ed.) BiologicalInvasions – Economic and Environmental Costs of Alien Plant Animal and Microbe Species, CRC Press
Coman, B.J. (1973) The diet of red foxes, Vulpes vulpes L., in Victoria, Australian Journal of Zoology21: 391-401.
Coman, B.J., Robinson, J. and Beaumont, C. (1991) Home range, dispersal and density of red fox (Vulpesvulpes L.) in central Victoria, Wildlife Research 18: 215-223.
Croft, J.D. and Hone, L.J. (1978) The stomach contents of foxes, Vulpes vulpes, collected in New SouthWales, Australian Wildlife Research 5: 85-92
Known Threat Perceived Threat
� Leporillus conditor, Greater Stick-nest Rat
� Onychogalea fraenata, Bridled Nailtail Wallaby
� Parantechinus apicalis, Dibbler� Petrogale penicillata, Brush-tailed
Rock-wallaby� Potorous tridactylus gilberti,
Gilbert's Potoroo� Pseudomys oralis, Hastings River
Mouse� Zyzomys pedunculatus, Central
Rock-rat� Delma impar, Striped Legless Lizard� Dermochelys coriacea, Leathery
Turtle� Pseudemydura umbrina, Western
Swamp Tortoise
24
Counting the Cost: Impact of Invasive Animals in Australia, 2004
Harris, S. and Rayner, J.M.V. (1986) Urban fox (Vulpes vulpes) in England and Wales, Symposium of theZoological Society, London 58: 313-328.
Harris, S. and Smith, G.C. (1987) Demography of two urban fox (Vulpes vulpes) populations, Journal ofApplied Ecology 24: 75-86.
Lugton, I. (1993) Fox Predation on Lambs, cited in Hucker, D.A. (ed.) Proceedings Australian Sheep VeterinarySociety, pp. 17-26.
Marlow, N.J. (1992) The ecology of the introduced red fox, Vulpes vulpes, in the arid zone, Ph.D. Thesis,University of New South Wales
Newsome, A.E. and Catling, P.C. (1992) Host range and its implications for wildlife rabies in Australia, Bureauof Rural Resources, Proceedings No. 11: 97-107.
Pimentel, D., Lach, L., Zuniga, R. and Morrison, D. (2000) Environmental and economic costs of non-indigenous species in the United States, Bioscience, 50(1): 53
Saunders, G.R., Greentree, C., and McLeod, L. (1997) Fox Predation: Impact and Management on AgriculturalLand and Associated Remnant Habitat, Final Report to the BRS, NSW Department of Agriculture, December.
Saunders, G., Coman, B., Kinnear, J. and Braysher, M. (1994) Managing Vertebrate Pests: Foxes, Bureau ofResource Sciences, AGPS, Canberra.
Saunders, G.R., White, P.C.L., Harris, S. and Rayner, J.M. (1993) Urban foxes: food acquisition, time andenergy budgeting of a generalised predator, Symposia of the Zoological Society of London 65: 215-243
Thompson, J.A. and Fleming P.J.S. (1994) Evaluation of the efficacy of 1080 poisoning of red foxes usingvisitation to non-toxic baits as an index of fox abundance, Wildlife Research 21: 27-39
Voigt, D.R. (1987) Red fox, cited in Novak, M., Baker, J.A., Obbard, M.E. and Mallock, B. (eds.) Wildfurbearer management and conservation in North America, Ministry of Natural Resources, Ontario, pp. 379-392

25
Feral Pigs (Sus scrofa)
HistoryThe feral pig (Sus scrofa) population in Australia originated from released or escaped domestic stocks thatwere introduced with European settlement. Pigs in Australia were originally of the Berkshire and Tamworthbreeds. These were later modified by cross breeding with breeds from China, India, Timor and other partsof Europe. In the 19th century, problems with stray and feral pigs became apparent in areas surroundingsettled regions.
Feral pigs have colonised many parts of the Northern Territory, Queensland, New South Wales, and otherstates and territories, restricted mainly to watercourses and their associated floodplains in inland orseasonally dry areas of Australia. In eastern Australia and south-west Western Australia, populations are still
spreading, often through deliberate oraccidental releases.
DistributionFeral pigs are established in around 38percent of the continent and estimatesof their numbers in Australia rangefrom 3.5 to 23.5 million (Hone, 1990).The problem is concentrated mostly inQueensland, NSW, the ACT and theNorthern Territory, with more isolatedpopulation pockets across the otherStates and offshore areas, such asFlinders and Kangaroo Island(Choquenot et al 1996). Because oftheir low heat tolerance, feral pigsabundance is highest in wetlands,floodplains and watercourses, wherepopulation densities may reach 10 to20 per kilometre, or higher. Theirdistribution and abundance can varymarkedly from year to year accordingto environmental conditions. Their
FERAL PIGS (Sus scrofa)
Figure 5: Distribution of Feral Pigs (Courtesy BRS)
� Feral pig (Sus scrofa) populations in Australia originated from released or escaped domestic stocks and now inhabit 38% of the mainland
� Pigs inflict losses through livestock predation, crop damage, and native vegetation destruction,and are also vectors of disease
� Feral pigs are currently inflicting $107 million in control and production loss costs per year.� The introduction of Foot and Mouth disease and potential for pigs to harbour the disease would
result in far higher economic costs.
26
Counting the Cost: Impact of Invasive Animals in Australia, 2004
dependence on drinking water and vegetation for shelter means seasonal factors have significant influencesover the number and distribution of the feral pig population (Wilson et al. 1992). Despite this, it may bepertinent to note that feral pigs’ generally sedentary nature has slowed their spread outside their existingterritories (Caley 1993). The distribution of feral pigs in Australia is outlined in the following figure providedby BRS.
Economic ImpactThe economic impact of the feral pig problem stems from the direct damages caused to agriculture andfarming, environmental degradation and the response and control costs associated with these problems. At the same time, sizeable game meat and recreational hunting industries have developed around feralpigs, and it is thought these activities may play important pest control roles.
Table 11: Annual Cost Impact of Feral Pigs
(a): Agricultural production losses are outlined in Bomford and Hart (2002)(b): Outlined in Bomford and Hart (2002)(c): Outlined in Bomford and Hart (2002)
Agricultural Production ImpactFeral pigs inflict direct losses on the agricultural sector through predation of newborn animals, reduce grainand cane yields by devouring and destroying crops, compete with livestock for pasture land, and damageinfrastructure such as fences. The damage bill caused to agricultural production is conservatively estimatedto be at least $100 million per annum.
Sheep farming and wool industries in parts of Australia are threatened by feral pig predation of younglambs. In semi-arid rangelands where the problem is considered most serious, predation rates have beenestimated to be as high as 35 percent (Plant et al. 1978, Pavlov et al. 1981). Because the extent of theproblem is dependent on seasonal variation in feral pig densities, investment in control may be adjustedaccording to these seasonal factors.
Feral pigs are a threat to a variety of crop production because they have a highly adaptable omnivorousdiet. An estimate from 1979-80 suggested damage to grain crop alone stood at $41.4 million (Tisdell1982). For mainstream crops such as wheat, the damage in NSW was estimated to be a 3 percent loss inproduction. Pig rummaging and feeding also threaten the sugarcane industry. Although the loss in 1982was estimated to be only around 0.1 to 0.15 percent of Queensland’s production, it nevertheless amountsto 20,000 tonnes (Tisdell 1982). A 1993 study puts the loss at 25,000 tonnes worth around $625, 000(McIlroy et al.1993).
Cost ComponentControl
$A millionLoss
$A millionTotal
$A million
Agricultural Production a 100.00 100.00
Management Cost b 5.00 - 5.00
Research Cost c 1.50 - 1.50
TOTAL COST 6.50 100.00 106.50
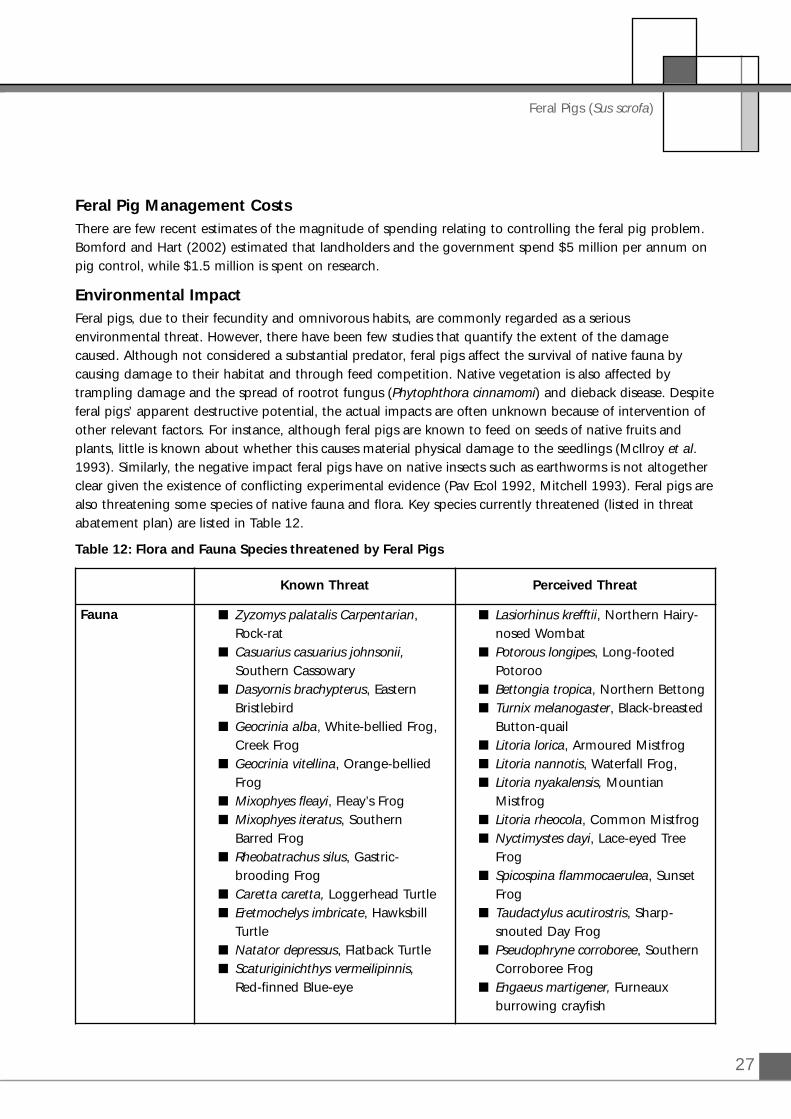
27
Feral Pigs (Sus scrofa)
Known Threat Perceived Threat
Fauna � Zyzomys palatalis Carpentarian, Rock-rat
� Casuarius casuarius johnsonii,Southern Cassowary
� Dasyornis brachypterus, Eastern Bristlebird
� Geocrinia alba, White-bellied Frog, Creek Frog
� Geocrinia vitellina, Orange-bellied Frog
� Mixophyes fleayi, Fleay’s Frog� Mixophyes iteratus, Southern
Barred Frog� Rheobatrachus silus, Gastric-
brooding Frog� Caretta caretta, Loggerhead Turtle� Eretmochelys imbricate, Hawksbill
Turtle� Natator depressus, Flatback Turtle� Scaturiginichthys vermeilipinnis,
Red-finned Blue-eye
� Lasiorhinus krefftii, Northern Hairy-nosed Wombat
� Potorous longipes, Long-footed Potoroo
� Bettongia tropica, Northern Bettong� Turnix melanogaster, Black-breasted
Button-quail� Litoria lorica, Armoured Mistfrog� Litoria nannotis, Waterfall Frog,� Litoria nyakalensis, Mountian
Mistfrog� Litoria rheocola, Common Mistfrog� Nyctimystes dayi, Lace-eyed Tree
Frog� Spicospina flammocaerulea, Sunset
Frog� Taudactylus acutirostris, Sharp-
snouted Day Frog� Pseudophryne corroboree, Southern
Corroboree Frog� Engaeus martigener, Furneaux
burrowing crayfish
Feral Pig Management CostsThere are few recent estimates of the magnitude of spending relating to controlling the feral pig problem.Bomford and Hart (2002) estimated that landholders and the government spend $5 million per annum onpig control, while $1.5 million is spent on research.
Environmental ImpactFeral pigs, due to their fecundity and omnivorous habits, are commonly regarded as a seriousenvironmental threat. However, there have been few studies that quantify the extent of the damagecaused. Although not considered a substantial predator, feral pigs affect the survival of native fauna bycausing damage to their habitat and through feed competition. Native vegetation is also affected bytrampling damage and the spread of rootrot fungus (Phytophthora cinnamomi) and dieback disease. Despiteferal pigs’ apparent destructive potential, the actual impacts are often unknown because of intervention ofother relevant factors. For instance, although feral pigs are known to feed on seeds of native fruits andplants, little is known about whether this causes material physical damage to the seedlings (McIlroy et al.1993). Similarly, the negative impact feral pigs have on native insects such as earthworms is not altogetherclear given the existence of conflicting experimental evidence (Pav Ecol 1992, Mitchell 1993). Feral pigs arealso threatening some species of native fauna and flora. Key species currently threatened (listed in threatabatement plan) are listed in Table 12.
Table 12: Flora and Fauna Species threatened by Feral Pigs
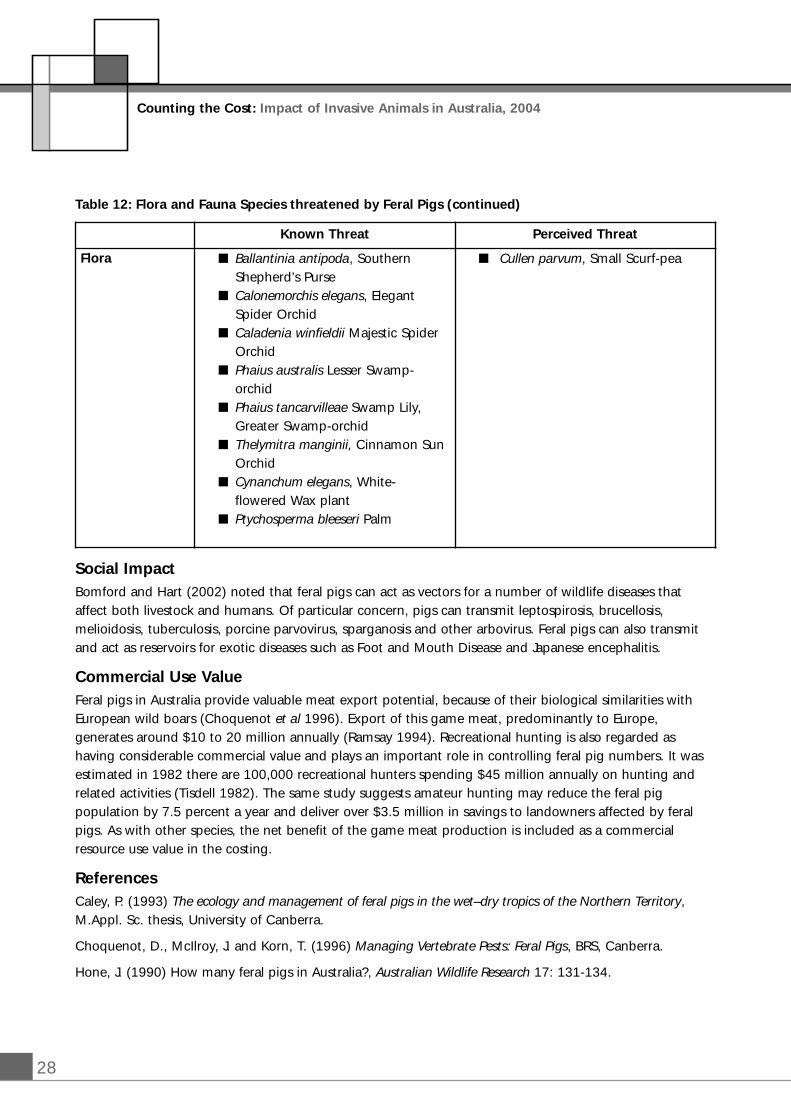
28
Table 12: Flora and Fauna Species threatened by Feral Pigs (continued)
Social ImpactBomford and Hart (2002) noted that feral pigs can act as vectors for a number of wildlife diseases thataffect both livestock and humans. Of particular concern, pigs can transmit leptospirosis, brucellosis,melioidosis, tuberculosis, porcine parvovirus, sparganosis and other arbovirus. Feral pigs can also transmitand act as reservoirs for exotic diseases such as Foot and Mouth Disease and Japanese encephalitis.
Commercial Use ValueFeral pigs in Australia provide valuable meat export potential, because of their biological similarities withEuropean wild boars (Choquenot et al 1996). Export of this game meat, predominantly to Europe,generates around $10 to 20 million annually (Ramsay 1994). Recreational hunting is also regarded ashaving considerable commercial value and plays an important role in controlling feral pig numbers. It wasestimated in 1982 there are 100,000 recreational hunters spending $45 million annually on hunting andrelated activities (Tisdell 1982). The same study suggests amateur hunting may reduce the feral pigpopulation by 7.5 percent a year and deliver over $3.5 million in savings to landowners affected by feralpigs. As with other species, the net benefit of the game meat production is included as a commercialresource use value in the costing.
ReferencesCaley, P. (1993) The ecology and management of feral pigs in the wet–dry tropics of the Northern Territory,M.Appl. Sc. thesis, University of Canberra.
Choquenot, D., McIlroy, J. and Korn, T. (1996) Managing Vertebrate Pests: Feral Pigs, BRS, Canberra.
Hone, J. (1990) How many feral pigs in Australia?, Australian Wildlife Research 17: 131-134.
Counting the Cost: Impact of Invasive Animals in Australia, 2004
Known Threat Perceived Threat
Flora � Ballantinia antipoda, Southern Shepherd’s Purse
� Calonemorchis elegans, Elegant Spider Orchid
� Caladenia winfieldii Majestic Spider Orchid
� Phaius australis Lesser Swamp-orchid
� Phaius tancarvilleae Swamp Lily, Greater Swamp-orchid
� Thelymitra manginii, Cinnamon Sun Orchid
� Cynanchum elegans, White-flowered Wax plant
� Ptychosperma bleeseri Palm
� Cullen parvum, Small Scurf-pea
29
Feral Pigs (Sus scrofa)
McIlroy, J.C., Gifford, E.J., and Forrester, R.I. (1993) Seasonal patterns in bait consumption by feral pigs (Sus scrofa) in the hill country of south-eastern Australia, Wildlife Research 20: 637-651.
Mitchell, J. (1993) Systematic assessment of feral pig damage and recommended pig control methods in the WetTropics World Heritage Area. Final Report to the Wet Tropics Management Agency, Department of Lands,Charters Towers, Queensland.
Pavlov, P.M., Kilgour R.J., and Pederson, H. (1981) Predation by feral pigs on merino lambs at Nyngan, NewSouth Wales, Australian Journal of Experimental Agriculture and Husbandry 21: 570-574.
Pech, R.P. and McIlroy, J.C. (1990) A model of the velocity of advance of foot-and-mouth disease in feralpigs, Journal of Applied Ecology 27: 635-650.
Plant, J.W., Marchant R., Mitchell T.D., and Giles, J.R. (1978) Neonatal lamb losses due to feral pigpredation, Australian Veterinary Journal 54: 426-429.
Ramsay, B.J. (1994) Commercial Use of Wild Animals in Australia, Bureau of Resource Sciences, Canberra.
Tisdell, C.A. (1982) Wild Pigs: Environmental Pest or Economic Resource? Pergamon Press, Sydney
Wilson, G., Dexter, N., O’Brien, P. and Bomford, M. (1992) Pest animals in Australia – a survey of introducedwild mammals, Kangaroo Press and Bureau of Rural Resources, Canberra.
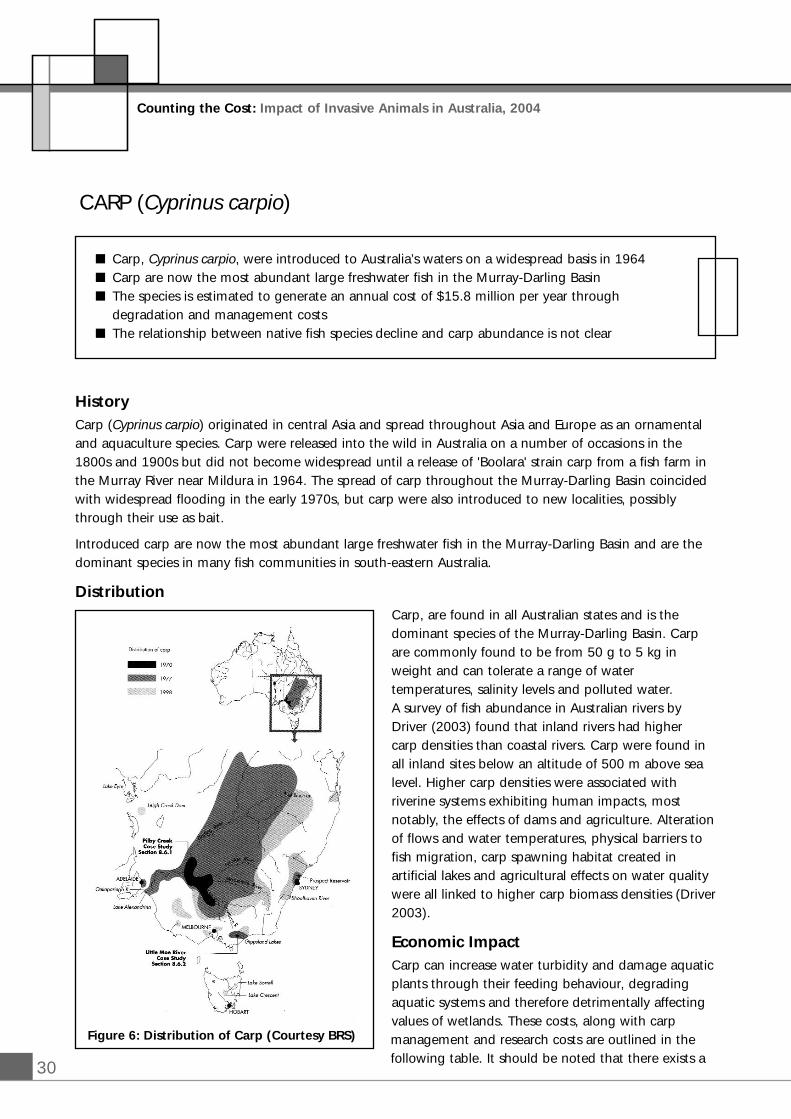
30
Counting the Cost: Impact of Invasive Animals in Australia, 2004
CARP (Cyprinus carpio)
� Carp, Cyprinus carpio, were introduced to Australia’s waters on a widespread basis in 1964� Carp are now the most abundant large freshwater fish in the Murray-Darling Basin� The species is estimated to generate an annual cost of $15.8 million per year through
degradation and management costs� The relationship between native fish species decline and carp abundance is not clear
HistoryCarp (Cyprinus carpio) originated in central Asia and spread throughout Asia and Europe as an ornamentaland aquaculture species. Carp were released into the wild in Australia on a number of occasions in the1800s and 1900s but did not become widespread until a release of 'Boolara' strain carp from a fish farm inthe Murray River near Mildura in 1964. The spread of carp throughout the Murray-Darling Basin coincidedwith widespread flooding in the early 1970s, but carp were also introduced to new localities, possiblythrough their use as bait.
Introduced carp are now the most abundant large freshwater fish in the Murray-Darling Basin and are thedominant species in many fish communities in south-eastern Australia.
DistributionCarp, are found in all Australian states and is thedominant species of the Murray-Darling Basin. Carpare commonly found to be from 50 g to 5 kg inweight and can tolerate a range of watertemperatures, salinity levels and polluted water. A survey of fish abundance in Australian rivers byDriver (2003) found that inland rivers had higher carp densities than coastal rivers. Carp were found inall inland sites below an altitude of 500 m above sealevel. Higher carp densities were associated withriverine systems exhibiting human impacts, mostnotably, the effects of dams and agriculture. Alterationof flows and water temperatures, physical barriers tofish migration, carp spawning habitat created inartificial lakes and agricultural effects on water qualitywere all linked to higher carp biomass densities (Driver2003).
Economic ImpactCarp can increase water turbidity and damage aquaticplants through their feeding behaviour, degradingaquatic systems and therefore detrimentally affectingvalues of wetlands. These costs, along with carpmanagement and research costs are outlined in thefollowing table. It should be noted that there exists a
Figure 6: Distribution of Carp (Courtesy BRS)
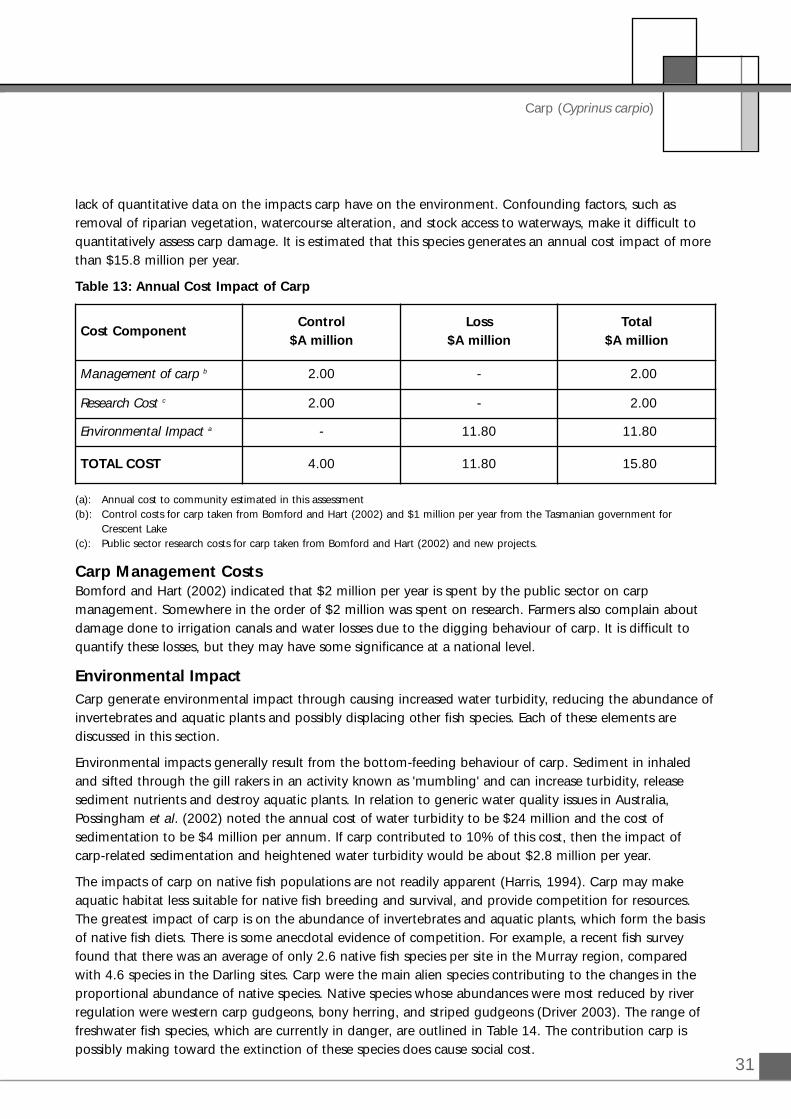
31
Carp (Cyprinus carpio)
lack of quantitative data on the impacts carp have on the environment. Confounding factors, such asremoval of riparian vegetation, watercourse alteration, and stock access to waterways, make it difficult toquantitatively assess carp damage. It is estimated that this species generates an annual cost impact of morethan $15.8 million per year.
Table 13: Annual Cost Impact of Carp
(a): Annual cost to community estimated in this assessment(b): Control costs for carp taken from Bomford and Hart (2002) and $1 million per year from the Tasmanian government for
Crescent Lake(c): Public sector research costs for carp taken from Bomford and Hart (2002) and new projects.
Carp Management CostsBomford and Hart (2002) indicated that $2 million per year is spent by the public sector on carpmanagement. Somewhere in the order of $2 million was spent on research. Farmers also complain aboutdamage done to irrigation canals and water losses due to the digging behaviour of carp. It is difficult toquantify these losses, but they may have some significance at a national level.
Environmental ImpactCarp generate environmental impact through causing increased water turbidity, reducing the abundance ofinvertebrates and aquatic plants and possibly displacing other fish species. Each of these elements arediscussed in this section.
Environmental impacts generally result from the bottom-feeding behaviour of carp. Sediment in inhaledand sifted through the gill rakers in an activity known as 'mumbling' and can increase turbidity, releasesediment nutrients and destroy aquatic plants. In relation to generic water quality issues in Australia,Possingham et al. (2002) noted the annual cost of water turbidity to be $24 million and the cost ofsedimentation to be $4 million per annum. If carp contributed to 10% of this cost, then the impact of carp-related sedimentation and heightened water turbidity would be about $2.8 million per year.
The impacts of carp on native fish populations are not readily apparent (Harris, 1994). Carp may makeaquatic habitat less suitable for native fish breeding and survival, and provide competition for resources.The greatest impact of carp is on the abundance of invertebrates and aquatic plants, which form the basisof native fish diets. There is some anecdotal evidence of competition. For example, a recent fish surveyfound that there was an average of only 2.6 native fish species per site in the Murray region, comparedwith 4.6 species in the Darling sites. Carp were the main alien species contributing to the changes in theproportional abundance of native species. Native species whose abundances were most reduced by riverregulation were western carp gudgeons, bony herring, and striped gudgeons (Driver 2003). The range offreshwater fish species, which are currently in danger, are outlined in Table 14. The contribution carp ispossibly making toward the extinction of these species does cause social cost.
Cost ComponentControl
$A millionLoss
$A millionTotal
$A million
Management of carp b 2.00 - 2.00
Research Cost c 2.00 - 2.00
Environmental Impact a - 11.80 11.80
TOTAL COST 4.00 11.80 15.80
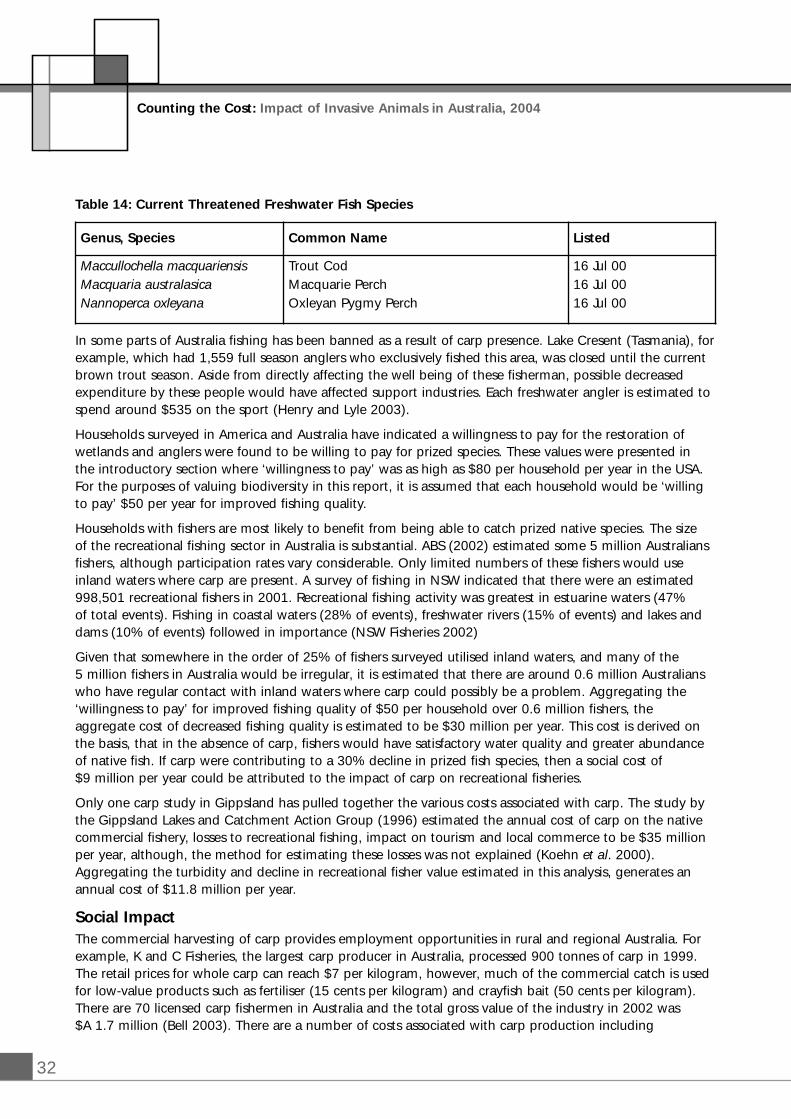
32
Table 14: Current Threatened Freshwater Fish Species
In some parts of Australia fishing has been banned as a result of carp presence. Lake Cresent (Tasmania), forexample, which had 1,559 full season anglers who exclusively fished this area, was closed until the currentbrown trout season. Aside from directly affecting the well being of these fisherman, possible decreasedexpenditure by these people would have affected support industries. Each freshwater angler is estimated tospend around $535 on the sport (Henry and Lyle 2003).
Households surveyed in America and Australia have indicated a willingness to pay for the restoration ofwetlands and anglers were found to be willing to pay for prized species. These values were presented in the introductory section where ‘willingness to pay’ was as high as $80 per household per year in the USA.For the purposes of valuing biodiversity in this report, it is assumed that each household would be ‘willingto pay’ $50 per year for improved fishing quality.
Households with fishers are most likely to benefit from being able to catch prized native species. The size of the recreational fishing sector in Australia is substantial. ABS (2002) estimated some 5 million Australiansfishers, although participation rates vary considerable. Only limited numbers of these fishers would useinland waters where carp are present. A survey of fishing in NSW indicated that there were an estimated998,501 recreational fishers in 2001. Recreational fishing activity was greatest in estuarine waters (47% of total events). Fishing in coastal waters (28% of events), freshwater rivers (15% of events) and lakes anddams (10% of events) followed in importance (NSW Fisheries 2002)
Given that somewhere in the order of 25% of fishers surveyed utilised inland waters, and many of the 5 million fishers in Australia would be irregular, it is estimated that there are around 0.6 million Australianswho have regular contact with inland waters where carp could possibly be a problem. Aggregating the‘willingness to pay’ for improved fishing quality of $50 per household over 0.6 million fishers, theaggregate cost of decreased fishing quality is estimated to be $30 million per year. This cost is derived onthe basis, that in the absence of carp, fishers would have satisfactory water quality and greater abundanceof native fish. If carp were contributing to a 30% decline in prized fish species, then a social cost of $9 million per year could be attributed to the impact of carp on recreational fisheries.
Only one carp study in Gippsland has pulled together the various costs associated with carp. The study bythe Gippsland Lakes and Catchment Action Group (1996) estimated the annual cost of carp on the nativecommercial fishery, losses to recreational fishing, impact on tourism and local commerce to be $35 millionper year, although, the method for estimating these losses was not explained (Koehn et al. 2000).Aggregating the turbidity and decline in recreational fisher value estimated in this analysis, generates anannual cost of $11.8 million per year.
Social ImpactThe commercial harvesting of carp provides employment opportunities in rural and regional Australia. Forexample, K and C Fisheries, the largest carp producer in Australia, processed 900 tonnes of carp in 1999.The retail prices for whole carp can reach $7 per kilogram, however, much of the commercial catch is usedfor low-value products such as fertiliser (15 cents per kilogram) and crayfish bait (50 cents per kilogram).There are 70 licensed carp fishermen in Australia and the total gross value of the industry in 2002 was $A 1.7 million (Bell 2003). There are a number of costs associated with carp production including
Counting the Cost: Impact of Invasive Animals in Australia, 2004
Genus, Species Common Name Listed
Maccullochella macquariensis Macquaria australasicaNannoperca oxleyana
Trout CodMacquarie PerchOxleyan Pygmy Perch
16 Jul 0016 Jul 0016 Jul 00
33
Carp (Cyprinus carpio)
harvesting costs: licences, nets, labour, vehicles, boats, issuance, QAP factors; storage costs: refrigerationplant and running costs, factory approved by govt/AQIS, QAP factors; marketing costs: transport,commission, handling unknown factors, chemical analysis; and packaging costs: cardboard boxes, plasticcrates, ice slurry, plastic bags/liners, pallets (Bells 2003).
ReferencesABS (2002) Year Book Australia 2002 – Forestry and Fishing, AGPS, Canberra
Bell, K. (2003) A review of the commercial use of carp, in Proceedings of the National Carp Control Workshop5 – 6 March 2003, CSIRO Discovery Canberra, Pest Animal Control CRC
Bomford, M. and Hart, Q. (2002) Non-indigenous vertebrates in Australia, in Pimentel, D. (ed.) BiologicalInvasions – Economic and Environmental Costs of Alien Plant Animal and Microbe Species, CRC Press
Driver, P. (2003), Using large spatial scale models to understand where carp prosper in rivers of New SouthWales, CRC Freshwater Ecology website
Driver, P., Harris, J. Norris, R. and Closs, G. (1997) The role of the natural environment and human impactsin determining biomass densities of common carp in New South Wales rivers. Cited in Gehrke. PC andHarris, JH. (eds.) Fish and Rivers in Stress: The NSW Rivers Survey, NSW Fisheries Office of Conservation andthe Cooperative Research Centre for Freshwater Ecology, Cronulla.
Harris, J.H. (1994) Carp in Australia: the role of research in C. Nannestad (ed.) Proceedings of the Forum onEuropean Carp, Wagga Wagga, NSW, 20 June 1994. Wagga Wagga, pp. 17-20
Harris J., Gehrke, P. and Hartley, S. (1998) NSW Rivers Survey shows declining fish and degraded streams,Water May/June 1998
Henry, G.W. and Lyle, J.M., (2003). The National Recreational and Indigenous Fishing Survey. Final Report tothe Fisheries Research & Development Corporation and the Fisheries Action Program. Project No.1999/158. NSW Fisheries Final Report Series No. 48. pp. 188
Gippsland Lakes and Catchment Action Group (1996) Drawing the Line on Carp. Proposal for the Control ofCarp in Gippsland Lake, Bairnsdale, Victoria.
Koehn, J.D., Brumley, A.R., and Gehrke, P.C. (2000), Managing the Impact of Carp, BRS, Canberra.
NSW Fisheries (2002) Survey of Recreational Fishing in New South Wales Interim Report, NSW Fisheries,December 2002
Possingham, H, Ryan, S, Baxter, J and Morton, S (2002) Setting Biodiversity Priorities: paper prepared as partof the activities of the working group producing the report Sustaining our Natural Systems and Biodiversityfor the Prime Minister’s Science, Engineering and Innovation Council in 2002
Wilson G. R (1998) Opportunities and Constraints Upon Commercial Use of Carp in NSW, IndustryDevelopment Study for NSW State And Regional Development, Port Macquarie
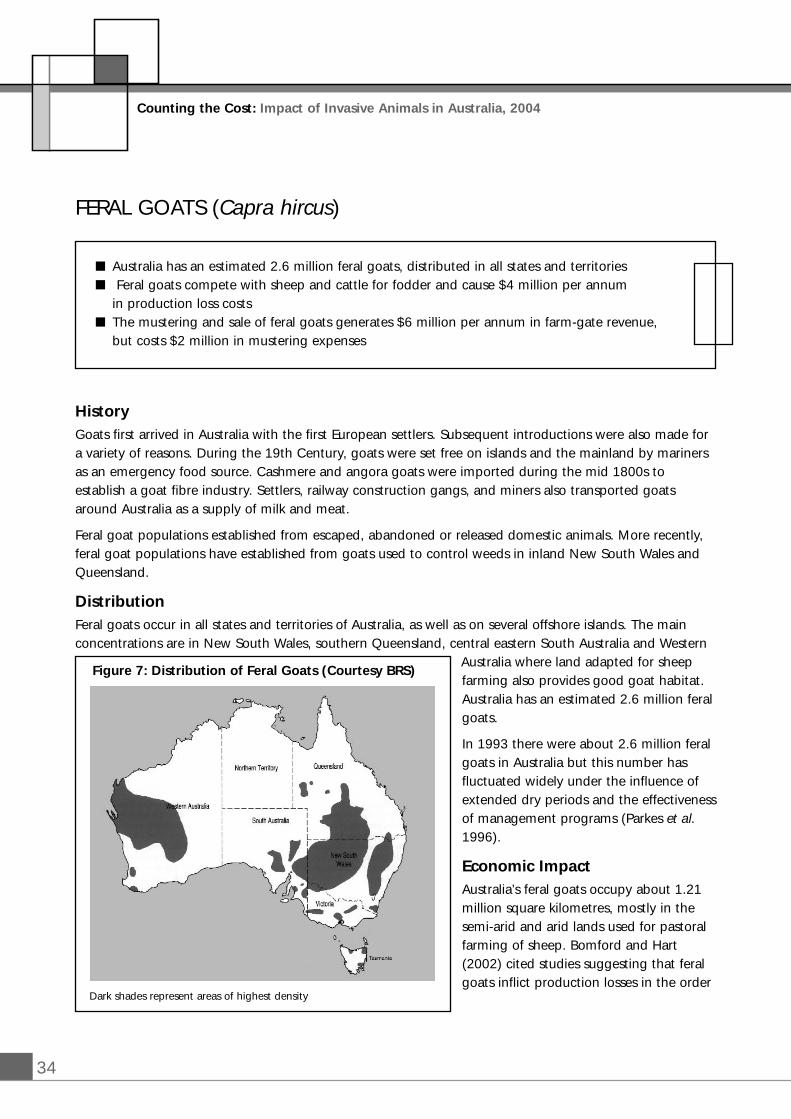
34
Counting the Cost: Impact of Invasive Animals in Australia, 2004
FERAL GOATS (Capra hircus)
Dark shades represent areas of highest density
� Australia has an estimated 2.6 million feral goats, distributed in all states and territories � Feral goats compete with sheep and cattle for fodder and cause $4 million per annum
in production loss costs� The mustering and sale of feral goats generates $6 million per annum in farm-gate revenue,
but costs $2 million in mustering expenses
HistoryGoats first arrived in Australia with the first European settlers. Subsequent introductions were also made fora variety of reasons. During the 19th Century, goats were set free on islands and the mainland by marinersas an emergency food source. Cashmere and angora goats were imported during the mid 1800s toestablish a goat fibre industry. Settlers, railway construction gangs, and miners also transported goatsaround Australia as a supply of milk and meat.
Feral goat populations established from escaped, abandoned or released domestic animals. More recently,feral goat populations have established from goats used to control weeds in inland New South Wales andQueensland.
DistributionFeral goats occur in all states and territories of Australia, as well as on several offshore islands. The mainconcentrations are in New South Wales, southern Queensland, central eastern South Australia and Western
Australia where land adapted for sheepfarming also provides good goat habitat.Australia has an estimated 2.6 million feralgoats.
In 1993 there were about 2.6 million feralgoats in Australia but this number hasfluctuated widely under the influence ofextended dry periods and the effectivenessof management programs (Parkes et al.1996).
Economic ImpactAustralia’s feral goats occupy about 1.21million square kilometres, mostly in thesemi-arid and arid lands used for pastoralfarming of sheep. Bomford and Hart(2002) cited studies suggesting that feralgoats inflict production losses in the order
Figure 7: Distribution of Feral Goats (Courtesy BRS)
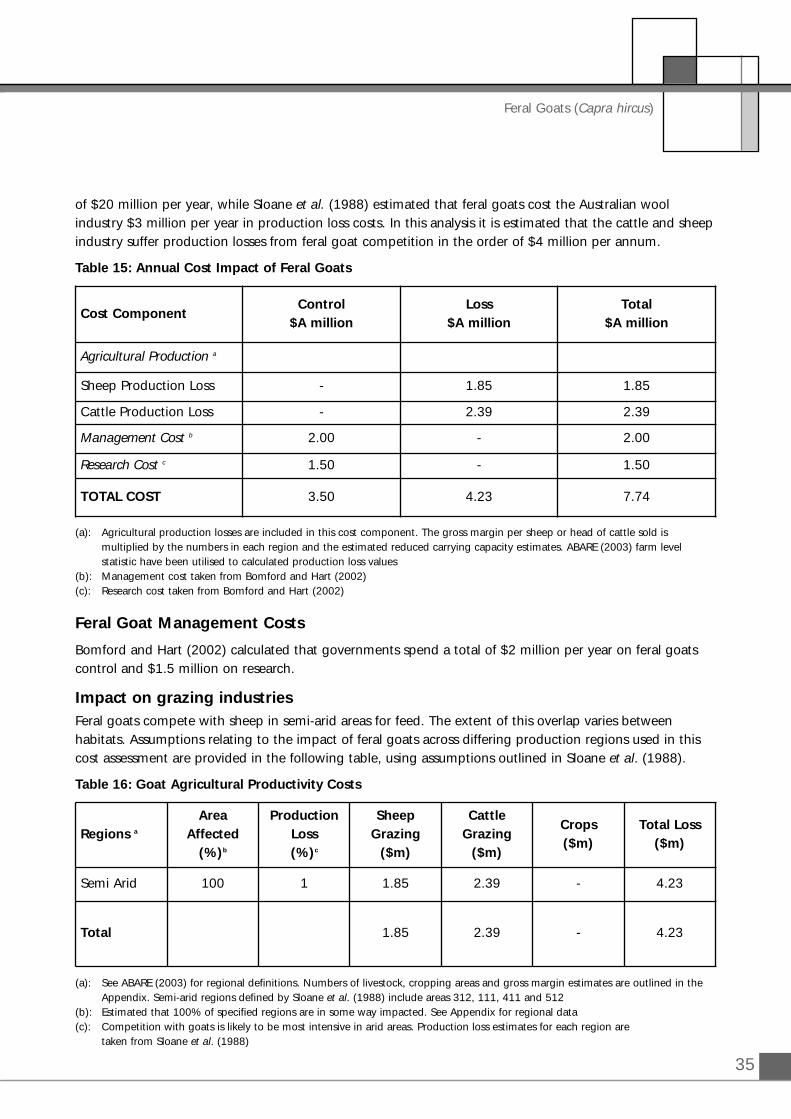
of $20 million per year, while Sloane et al. (1988) estimated that feral goats cost the Australian woolindustry $3 million per year in production loss costs. In this analysis it is estimated that the cattle and sheepindustry suffer production losses from feral goat competition in the order of $4 million per annum.
Table 15: Annual Cost Impact of Feral Goats
(a): Agricultural production losses are included in this cost component. The gross margin per sheep or head of cattle sold is multiplied by the numbers in each region and the estimated reduced carrying capacity estimates. ABARE (2003) farm level statistic have been utilised to calculated production loss values
(b): Management cost taken from Bomford and Hart (2002)(c): Research cost taken from Bomford and Hart (2002)
Feral Goat Management Costs
Bomford and Hart (2002) calculated that governments spend a total of $2 million per year on feral goatscontrol and $1.5 million on research.
Impact on grazing industriesFeral goats compete with sheep in semi-arid areas for feed. The extent of this overlap varies betweenhabitats. Assumptions relating to the impact of feral goats across differing production regions used in thiscost assessment are provided in the following table, using assumptions outlined in Sloane et al. (1988).
Table 16: Goat Agricultural Productivity Costs
(a): See ABARE (2003) for regional definitions. Numbers of livestock, cropping areas and gross margin estimates are outlined in the Appendix. Semi-arid regions defined by Sloane et al. (1988) include areas 312, 111, 411 and 512
(b): Estimated that 100% of specified regions are in some way impacted. See Appendix for regional data(c): Competition with goats is likely to be most intensive in arid areas. Production loss estimates for each region are
taken from Sloane et al. (1988)
35
Feral Goats (Capra hircus)
Cost ComponentControl
$A millionLoss
$A millionTotal
$A million
Agricultural Production a
Sheep Production Loss - 1.85 1.85
Cattle Production Loss - 2.39 2.39
Management Cost b 2.00 - 2.00
Research Cost c 1.50 - 1.50
TOTAL COST 3.50 4.23 7.74
Regions a
AreaAffected
(%)b
ProductionLoss(%)c
SheepGrazing
($m)
Cattle Grazing
($m)
Crops ($m)
Total Loss ($m)
Semi Arid 100 1 1.85 2.39 - 4.23
Total 1.85 2.39 - 4.23
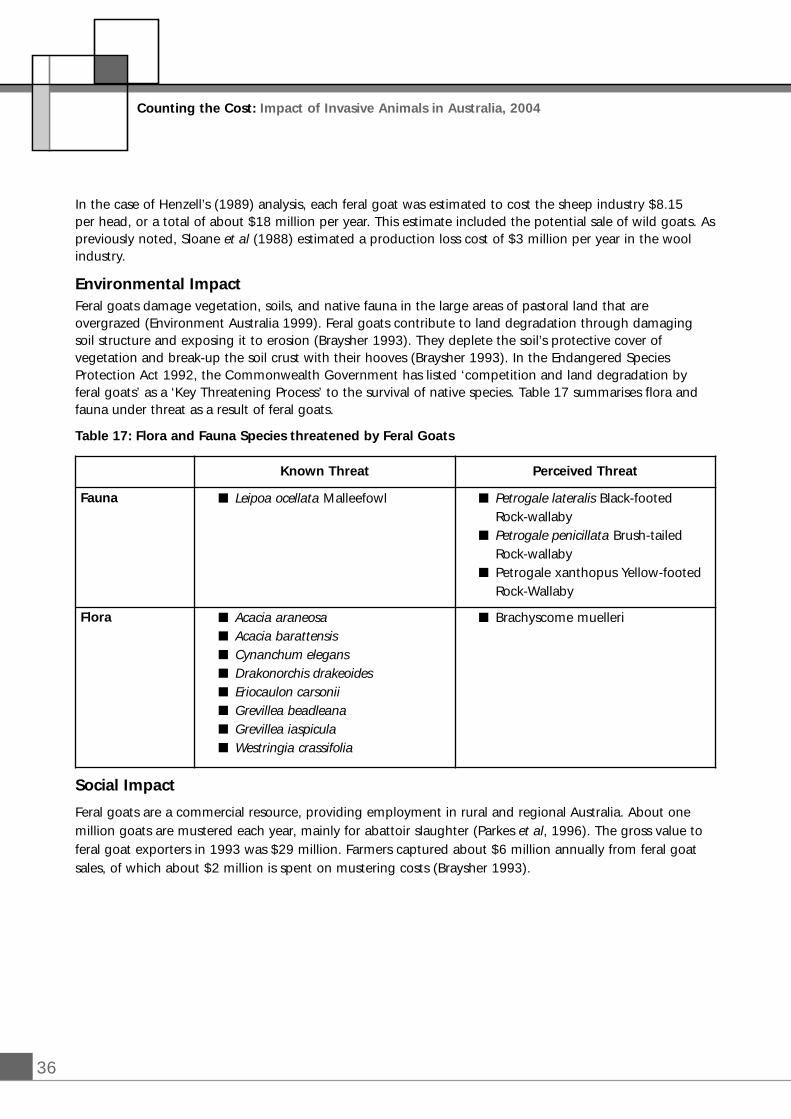
36
Counting the Cost: Impact of Invasive Animals in Australia, 2004
In the case of Henzell’s (1989) analysis, each feral goat was estimated to cost the sheep industry $8.15 per head, or a total of about $18 million per year. This estimate included the potential sale of wild goats. Aspreviously noted, Sloane et al (1988) estimated a production loss cost of $3 million per year in the woolindustry.
Environmental ImpactFeral goats damage vegetation, soils, and native fauna in the large areas of pastoral land that areovergrazed (Environment Australia 1999). Feral goats contribute to land degradation through damagingsoil structure and exposing it to erosion (Braysher 1993). They deplete the soil’s protective cover ofvegetation and break-up the soil crust with their hooves (Braysher 1993). In the Endangered SpeciesProtection Act 1992, the Commonwealth Government has listed ‘competition and land degradation byferal goats’ as a ‘Key Threatening Process’ to the survival of native species. Table 17 summarises flora andfauna under threat as a result of feral goats.
Table 17: Flora and Fauna Species threatened by Feral Goats
Social Impact
Feral goats are a commercial resource, providing employment in rural and regional Australia. About onemillion goats are mustered each year, mainly for abattoir slaughter (Parkes et al, 1996). The gross value toferal goat exporters in 1993 was $29 million. Farmers captured about $6 million annually from feral goatsales, of which about $2 million is spent on mustering costs (Braysher 1993).
Known Threat Perceived Threat
Fauna � Leipoa ocellata Malleefowl � Petrogale lateralis Black-footed Rock-wallaby
� Petrogale penicillata Brush-tailed Rock-wallaby
� Petrogale xanthopus Yellow-footed Rock-Wallaby
Flora � Acacia araneosa � Acacia barattensis � Cynanchum elegans � Drakonorchis drakeoides � Eriocaulon carsonii � Grevillea beadleana � Grevillea iaspicula � Westringia crassifolia
� Brachyscome muelleri
37
Feral Goats (Capra hircus)
ReferencesBraysher, M. (1993) Managing Vertebrate Pests: Principles and Strategies, Bureau of Resource Sciences.Australian Government Publishing Service, Canberra.
Environment Australia (1999) Threat Abatement Plan for Competition and Land Degradation by Feral Goats,Environment Australia, Canberra
Henzell, R.P. (1989) Proclaimed animal research in South Australia – cost-benefits, future directions and relatedissues, Animal and Plant Control Commission, South Australia.
Parkes, J., Henzell, R. and Pickles, G. (1996) Managing Vertebrate Pests: Feral Goats, Bureau of ResourceSciences, Australian Government Publishing Service, Canberra.

38
HistoryThe wild dog population of Australia comprises of native dingoes (Canis lupus dingo) and feral dogsintroduced since European settlement (C. l. familiaris), and hybrids of the two sub-species. Both dingoesand dogs are derived from wolves (Canis lupus). Dingoes were brought to Australia approximately 4000years ago by the Aboriginal people, who used them for food, companions, hunting-aids and bed-warmers.The dingo never reached Tasmania. Domestic dogs were brought into Australia by Europeans in 1788 andabandonment, neglect, loss or deliberate release has seen the continued establishment of wild populationssince.
Dingoes and other wild dogs are widely distributed throughout the country and are present in mostenvironments. Hybridisation between the subspecies over that time has resulted in a lesser proportion ofpure dingoes, especially in south-eastern Australia.
Despite their perceived threats to the livestock industry, there are growing efforts to preserve thepopulation of pure dingoes. Pure dingoes, smaller in size than their feral dogs counterpart, are comingunder threat because of their slower breeding patterns and through hybridisation. Under State and Territorylegislations, dingoes are in fact conserved and protected as a native species in areas where they pose nothreats to livestock. Some research suggests at current rate of hybridisation, pure dingoes may becomeextinct by 2100 (Fleming et al. 2001).
DistributionPrior to European settlement, dingoes occurred throughout the mainland. Human control since then haseffectively shaped the geographic distribution and concentration of wild dogs. Population managementprograms, including erection of barrier fences, mean they are largely excluded from agricultural regions inSouth-eastern Australia and areas surrounding Perth. Whilst pure dingoes populate throughout themainland, hybrid and wild-living domestic breeds dominate in the coastal regions (Fleming et al. 2001).
Wild dogs’ elusive and nocturnal habits make it difficult to precisely estimate the size of wild dog populations.Instead, researchers seek to identify the change in the population density and prevalence through measuringfrequency of visits to bait stations and aerial sightings. Estimates of population density in New South Wales, forexample, range from 0.1 to 0.3 wild dogs per square kilometre (Fleming et al. 2001)
Counting the Cost: Impact of Invasive Animals in Australia, 2004
DOGS (Canis lupus familiaris) AND DINGOES (Canis lupus dingo)
� Wild dog population of Australia comprises of native dingoes (Canis lupus dingo) and feral dogs introduced since European settlement (C. l. familiaris)
� Wild dogs cause substantial losses in the agricultural and grazing sectors through predation of young and adult livestock. Production losses are valued at $48.3 million per year
� Considerable resources are spent maintaining a dingo fence – estimated to cost $10 million per annum.
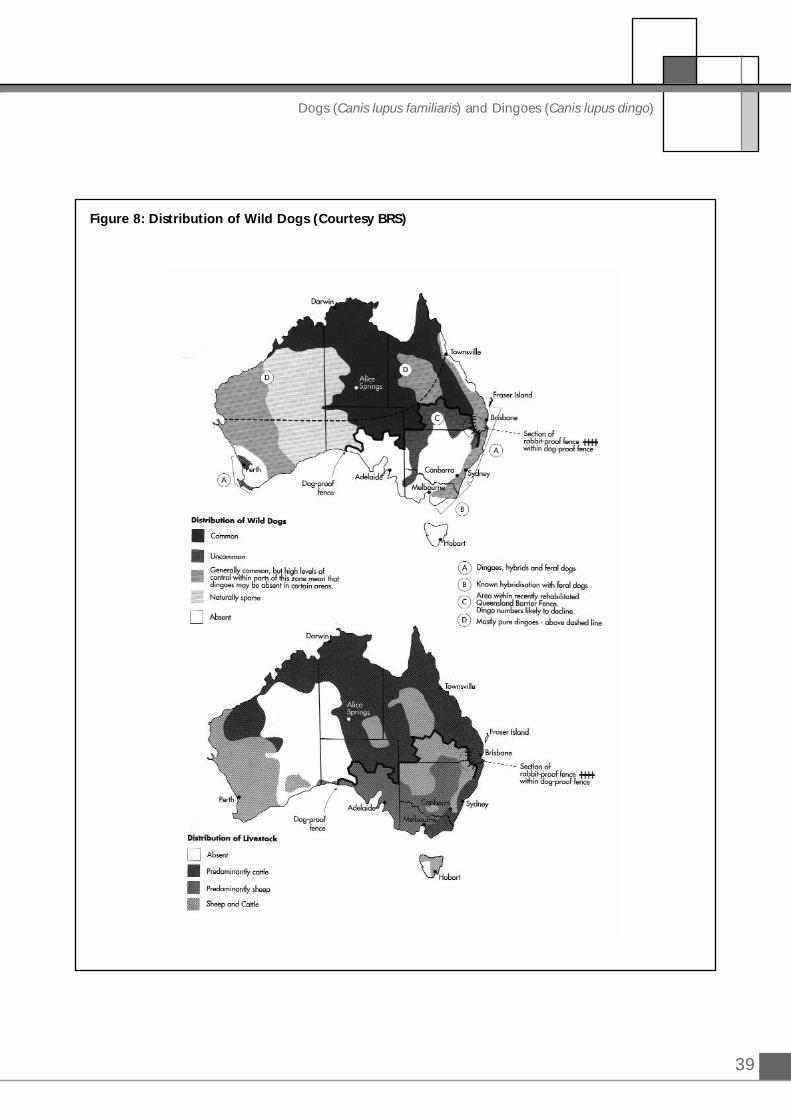
39
Dogs (Canis lupus familiaris) and Dingoes (Canis lupus dingo)
Figure 8: Distribution of Wild Dogs (Courtesy BRS)
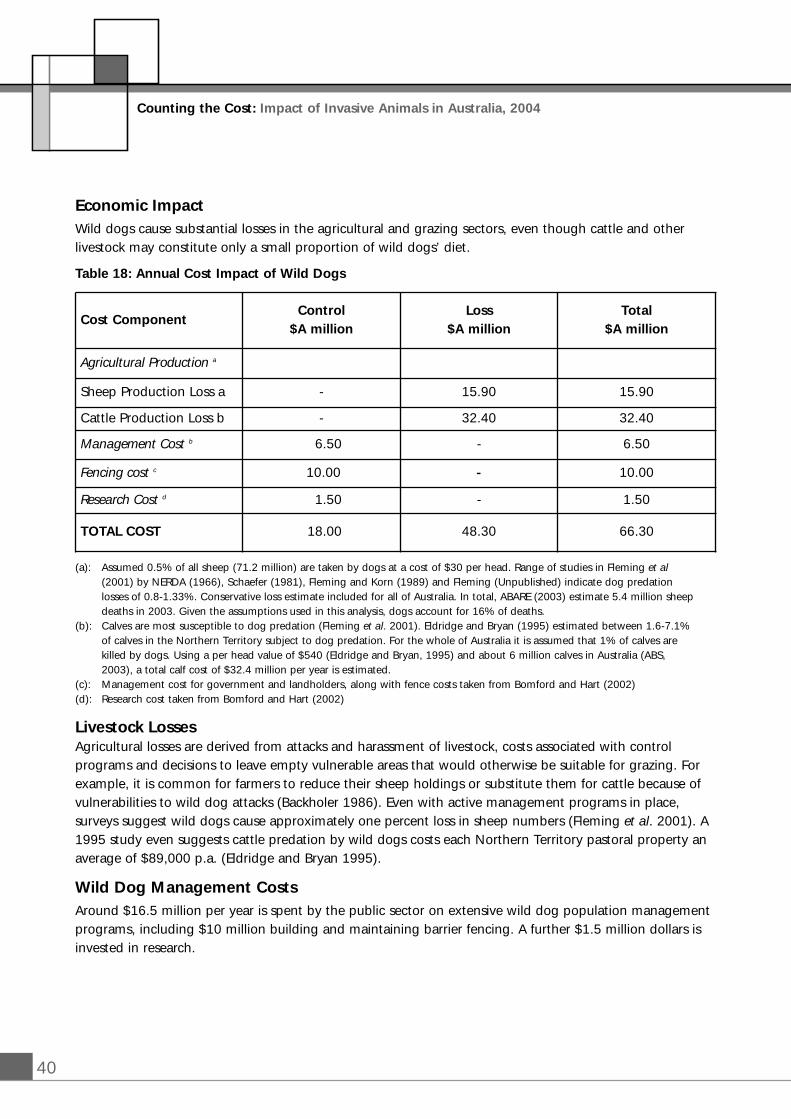
40
Counting the Cost: Impact of Invasive Animals in Australia, 2004
Economic ImpactWild dogs cause substantial losses in the agricultural and grazing sectors, even though cattle and otherlivestock may constitute only a small proportion of wild dogs’ diet.
Table 18: Annual Cost Impact of Wild Dogs
(a): Assumed 0.5% of all sheep (71.2 million) are taken by dogs at a cost of $30 per head. Range of studies in Fleming et al(2001) by NERDA (1966), Schaefer (1981), Fleming and Korn (1989) and Fleming (Unpublished) indicate dog predation losses of 0.8-1.33%. Conservative loss estimate included for all of Australia. In total, ABARE (2003) estimate 5.4 million sheep deaths in 2003. Given the assumptions used in this analysis, dogs account for 16% of deaths.
(b): Calves are most susceptible to dog predation (Fleming et al. 2001). Eldridge and Bryan (1995) estimated between 1.6-7.1% of calves in the Northern Territory subject to dog predation. For the whole of Australia it is assumed that 1% of calves are killed by dogs. Using a per head value of $540 (Eldridge and Bryan, 1995) and about 6 million calves in Australia (ABS, 2003), a total calf cost of $32.4 million per year is estimated.
(c): Management cost for government and landholders, along with fence costs taken from Bomford and Hart (2002)(d): Research cost taken from Bomford and Hart (2002)
Livestock LossesAgricultural losses are derived from attacks and harassment of livestock, costs associated with controlprograms and decisions to leave empty vulnerable areas that would otherwise be suitable for grazing. Forexample, it is common for farmers to reduce their sheep holdings or substitute them for cattle because ofvulnerabilities to wild dog attacks (Backholer 1986). Even with active management programs in place,surveys suggest wild dogs cause approximately one percent loss in sheep numbers (Fleming et al. 2001). A1995 study even suggests cattle predation by wild dogs costs each Northern Territory pastoral property anaverage of $89,000 p.a. (Eldridge and Bryan 1995).
Wild Dog Management CostsAround $16.5 million per year is spent by the public sector on extensive wild dog population managementprograms, including $10 million building and maintaining barrier fencing. A further $1.5 million dollars isinvested in research.
Cost ComponentControl
$A millionLoss
$A millionTotal
$A million
Agricultural Production a
Sheep Production Loss a - 15.90 15.90
Cattle Production Loss b - 32.40 32.40
Management Cost b 6.50 - 6.50
Fencing cost c 10.00 - 10.00
Research Cost d 1.50 - 1.50
TOTAL COST 18.00 48.30 66.30
41
Dogs (Canis lupus familiaris) and Dingoes (Canis lupus dingo)
Environmental ImpactThere appears to be no firm consensus view on the biodiversity and environmental impact of wild dogs.Unlike other introduced species of wild animals, dingoes have been integrated into established predator-prey relationships and may play a constructive ecological role of regulating the population of certain nativefaunas. The controlling influence of wild dogs on marsupials and emus numbers is demonstrated by thedifference in their prevalence across the two sides of the barrier fencing (Pople et al. 2000). Nevertheless,predation by wild dogs is believed to pose threats to remnant populations of endangered fauna, but likelyto have only limited effect on more established species (Robertshaw and Harden 1989).
The negative impact wild dogs have on native fauna may also be countered by their effects on otherintroduced species of predators; in particular foxes, feral cats and feral pigs. Some have argued the removalof wild dogs will increase the fox population size (Denny 1992, Burbidge and McKenzie 1989), althoughthere is little general evidence supporting this proposition. Instead, experience from the 1960 to 70’ssuggests the presence of wild dogs contributed to the demise of foxes and feral cats during droughtperiods. This is due to the latter species being starved of their usual diet of small marsupials and rats, whilstwild dogs monopolise the available cattle and kangaroo carcasses.
Apart from predation on native species, wild dogs may also be valuable in controlling the population ofintroduced pest species. There have been a number of studies confirming wild dogs’ effectiveness ineliminating significant numbers of wild goats, rabbits and rodents (Corbett and Newsome 1987). Theimpact on smaller pests such as rats is especially pronounced during drought periods as wild dogs switchtheir diets away from larger mammals.
Social ImpactUnlike some other species of wild animals, there are few established avenues of exploiting wild dogs as acommercial resource. Trade in skins and pelts are heavily restricted under State and Territory legislationwhilst the Commonwealth prohibits export of wildlife products. Instead, dingoes may be of indirect valueto the tourism industry both as a native wildlife symbol and targets of recreational hunters. Moreover, thereare some moves by certain breeding societies to treat and trade dingoes as pets. Dingoes’ potential statusas domestic pets have been recognised under NSW legislation. These developments add to the commonlyheld belief that dingoes carry intrinsic iconic value that is not susceptible to monetary measurements.
The 'Fraser Island' Dingo is believed to be the purest strain of dingo in Australia. They have becomeaccustomed to the presence of locals and tourists on this sand island. In recent years dingoes have attackeda German tourist and a young boy was attacked and killed in April 2001. The two dingoes responsible werepromptly killed, but tourism may have suffered as a result of these attacks. Dogs also vector rabies, andtherefore, have public health impacts.
42
ReferencesBackholer, J.R. (1986) A survey of landholders on the wild dog problem in eastern Victoria: a preliminaryanalysis, Unpublished report to Land Protection Service. Department of Conservation, Forest and Lands,Victoria.
Burbidge, A.A. and McKenzie, N.L. (1989) Patterns in the modern decline of Western Australia’s vertebratefauna: causes and conservation implications, Biological Conservation 50: 143-58
Corbett, L. and Newsome, A.E. (1987) The feeding ecology of the dingo III. Dietary relationships withfluctuating prey populations in arid Australia: an hypothesis of alternation of predation, Oecologia74: 215-27
Denny, M. (1992) Dorrigo Management Area Fauna Impact Statement of Proposed Forestry Operations,Forestry Commission of New South Wales, Sydney
Eldridge, S.R. and Bryan, R. (1995) Dingo questionnaire survey June-November 1995, Unpublished Report toParks and Wildlife Commission, Northern Territory, Darwin
Fleming, P.J.S. and Korn, T.J. (1989) Predation of livestock by wild dogs in eastern NSW, AustralianRangelands Journal 11: 61-66
Fleming, P., Corbett, L., Harden, R., and Thomson, P. (2001) Managing the Impacts of Dingoes and OtherWild Dogs, Bureau of Rural Science, Canberra
NERDA (1966) Dingoes in the New England, Community Development Pamphlet, No.7, UNE, Armidale.
Pople, A.R., Griggs, G.C., Cairns, S.C., Beard, L.A. and Alexander, P. (2000) Trends in the numbers of redkangaroos and emus on either side of the South Australian dingo fence: evidence of predator regulation?,Wildlife Research 27: 269-76
Robertshaw, J.D. and Harden, R. (1989) Predation in Macropodoidea: A Review in Grigg, G., Jarman, P., andHume, I. (eds.) Kangaroos, Wallabies and Rat-kangaroos. Surrey Beatty and Sones, Sydney
Schaefer, M.M. (1981) The feral dog: economic implications for graziers operating within the Armidale Pasturesand Protection Board, BAg ec. Thesis, UNE, Armidale
Counting the Cost: Impact of Invasive Animals in Australia, 2004
FERAL CAMELS (Camelus dromedaries)
43
Feral Camels (Camelus dromedaries)
HistoryOf the world’s 19 million camels (FAO 1998), the majority are found in the tropics and there are significantnumbers in sub-Saharan Africa. The Arabian camel (Dromedary) has one–hump and is generally found inPakistan, India, North Africa, the Middle East and some parts of Australia and Russia.
Camels were first introduced into Australia in the 1840’s to assist in the exploration of inland Australia.Between 1840 and 1907, between 10,000 and 20,000 camels were imported from India with an estimated50-65% landed in South Australia. It is not know when the first feral population established but someescaped during the Burke and Wills expedition in 1860. The feral animal population increased substantiallyafter the 1920’s when trucks became the widespread form of transport.
DistributionAustralia may now have the largest wild population of camels. They occupy most of Australia’s desertcountry including the Great Sandy, Gibson, Great Victoria and Simpson deserts, as well as much of thesemi-desert lands. There were approximately 200 000 camels in Australia in 1993 and the population of isexpanding rapidly (McCloy and Rowe 2000). In 2003 the Australian feral camel population was estimatedto be in the order of 300,000. Short et al. (1988) estimate the camel now ranges across 2.8 million km2, or 37% of the Australian mainland.
Camels in Australia are of the Dromedary (one–hump) species. Camels range in pastoral land in arid andsemi-arid Australia, with pastoral areas dominated by Acacia trees and shrubs are particularly well suited tocamel grazing.
Economic ImpactIn times of scare forage camels are likely to compete for herbage with sheep and cattle. This competitioninflicts a cost of Australian grazing industries. The species, does however, have commercial use value. Anindustry for meat production from central Australian camels began in the early 1990’s. Within the NorthernTerritory, minimal pastoral activity is observed in areas habited by feral camels (Edwards et al. 2001).
� There are approximately 200 000 camels in Australia – with 100 000 being in Western Australia� Most beef cattle producers in Central Australia regard camels as a pest species, principally
because bull camels damage fences during the rutting season and compete with livestock for forage
� Approximately 49 tonnes of camel meat with an average wholesale value of $250 000 is processed annually for the export market
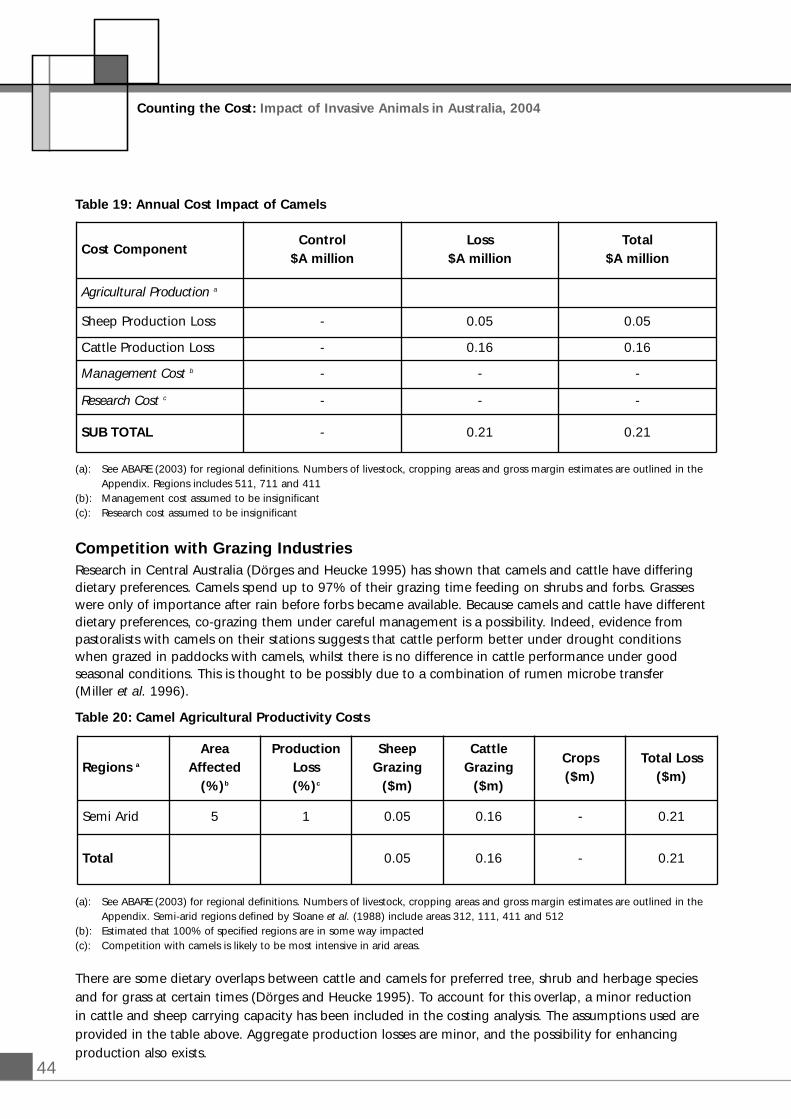
44
Table 19: Annual Cost Impact of Camels
(a): See ABARE (2003) for regional definitions. Numbers of livestock, cropping areas and gross margin estimates are outlined in the Appendix. Regions includes 511, 711 and 411
(b): Management cost assumed to be insignificant(c): Research cost assumed to be insignificant
Competition with Grazing IndustriesResearch in Central Australia (Dörges and Heucke 1995) has shown that camels and cattle have differingdietary preferences. Camels spend up to 97% of their grazing time feeding on shrubs and forbs. Grasseswere only of importance after rain before forbs became available. Because camels and cattle have differentdietary preferences, co-grazing them under careful management is a possibility. Indeed, evidence frompastoralists with camels on their stations suggests that cattle perform better under drought conditionswhen grazed in paddocks with camels, whilst there is no difference in cattle performance under goodseasonal conditions. This is thought to be possibly due to a combination of rumen microbe transfer (Miller et al. 1996).
Table 20: Camel Agricultural Productivity Costs
(a): See ABARE (2003) for regional definitions. Numbers of livestock, cropping areas and gross margin estimates are outlined in the Appendix. Semi-arid regions defined by Sloane et al. (1988) include areas 312, 111, 411 and 512
(b): Estimated that 100% of specified regions are in some way impacted(c): Competition with camels is likely to be most intensive in arid areas.
There are some dietary overlaps between cattle and camels for preferred tree, shrub and herbage speciesand for grass at certain times (Dörges and Heucke 1995). To account for this overlap, a minor reduction in cattle and sheep carrying capacity has been included in the costing analysis. The assumptions used areprovided in the table above. Aggregate production losses are minor, and the possibility for enhancingproduction also exists.
Counting the Cost: Impact of Invasive Animals in Australia, 2004
Cost ComponentControl
$A millionLoss
$A millionTotal
$A million
Agricultural Production a
Sheep Production Loss - 0.05 0.05
Cattle Production Loss - 0.16 0.16
Management Cost b - - -
Research Cost c - - -
SUB TOTAL - 0.21 0.21
Regions a
AreaAffected
(%)b
ProductionLoss(%)c
SheepGrazing
($m)
Cattle Grazing
($m)
Crops ($m)
Total Loss ($m)
Semi Arid 5 1 0.05 0.16 - 0.21
Total 0.05 0.16 - 0.21
45
Feral Camels (Camelus dromedaries)
Camel Management CostsNo information on the costs of camel management and research were found when compiling this report.
Commercial ResourceThe Australian camel industry has live export markets to Brunei and Malaysia. The Central Australian CamelIndustry Association (CACIA) conducts camel slaughtering and camel meat marketing. It has beenslaughtering around 300 camels per year since 1995, which represents approximately 49 tonnes of camelmeat with an average wholesale value of $250 000.
Environmental ImpactBomford and Hart (2002) indicated that browsing by camels may deplete shelter and refuge availability fordesert mammals. Camel grazing can also have deleterious effects on native vegetation, particularly somerare and threatened species (Dörges and Heucke 1995).
Social ImpactThe industry provides employment for small numbers of people in remote parts of WA, NT and SA, as cattle station employees trap and shoot camels. Limited numbers are also involved in meat processing and exporting.
ReferencesDörges, B. and Heucke, J. (1989) The impact of feral camels in Central Australia, Consultancy report to theConservation Commission, NT.
Dörges, B. and Heucke, J. (1995) Ecology, social organisation and behaviour of the feral dromedary in CentralAustralia, Translated conclusion of two PhD studies, University of Braunschweig, Germany
Dorges, B., and Heucke, J. (1996) Ecology, social organisation and behaviour of the feral dromedary Camelusdromedarius (L. 1758) in central Australia, Report to the Northern Territory Department of PrimaryIndustries and Fisheries.
Edward, G.P. Eldridge, S.R., Wurst, D., Berman, D.M. and Garbin, V. (2001) Movement patterns of femaleferal camels in central and northern Australia, Wildlife Research 28: 283-289
FAOSTAT., Statistics Database Internet at http://apps.fao.org/ (accessed October 1999)
McCloy, L. and Rowe, P. (2000) Assessing the Potential for a Commercial Camel Industry in Western Australia, Areport for RIRDC, RIRDC, Canberra
Miller, S.M., Brooker, J.D., Phillips, A.J. and Blackall, L.L. (1996) Streptococcus caprinus is ineffective as arumen inoculum to improve digestion of mulga (Acacia aneura) by sheep, Australian Journal of AgriculturalResources 47: 1323-31
Phillips, A., Heucke, J., Dorges, B. and O’Reilly, G. (2001) Co-grazing Cattle and Camels, A report for RIRDC,RIRDC, Canberra
Shalash, M.R. (1983) The Future Role of Camels in Overcoming World Meat Shortage, Egyption Journal ofVeterinary Science, Department of Animal Production and A. I., National Research Centre Dokki, Cairo.
Short, J., Caughley, G., Grice, D. and Brown, B. (1988) The distribution and relative abundance of camels inAustralia, Journal of the Arid Environment 15: 91-97.
Wurst, D. and Saalfeld, K. (1994) Aerial survey of camels and other large vertebrate species in the Alice Springsregion of the NT: 26 June 1993 . 17 September 1993, Australian Nature Conservation Agency.
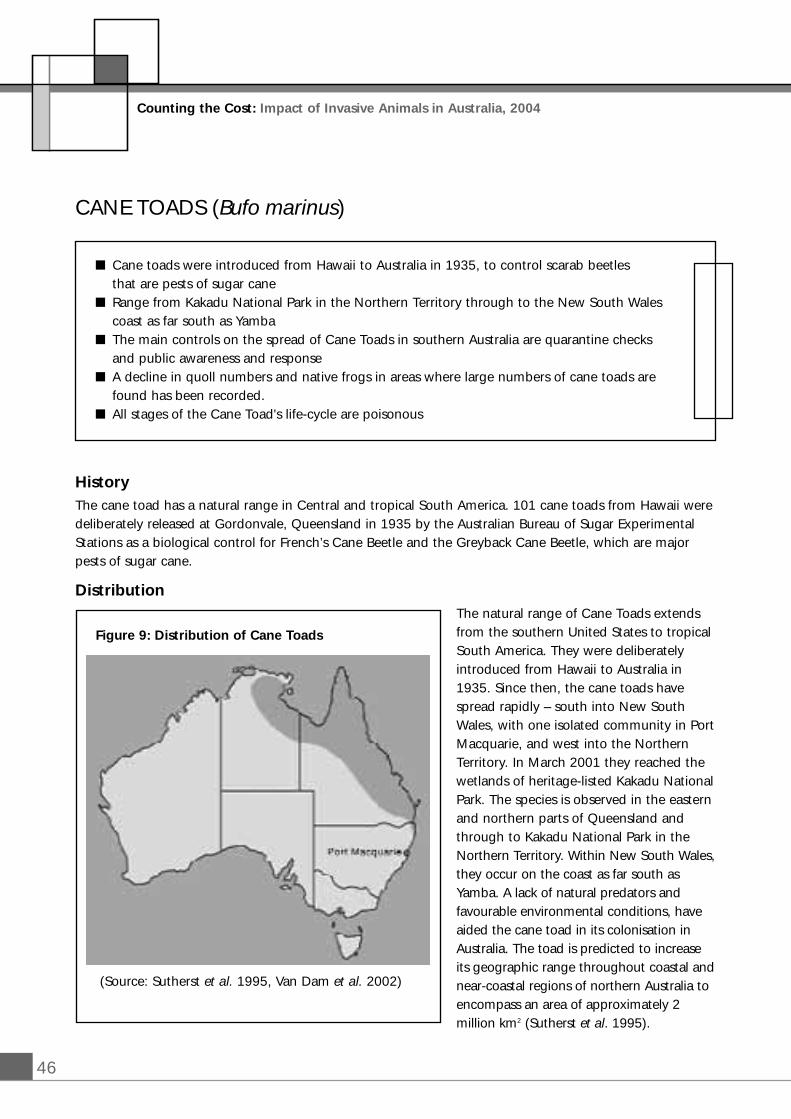
CANE TOADS (Bufo marinus)
46
HistoryThe cane toad has a natural range in Central and tropical South America. 101 cane toads from Hawaii weredeliberately released at Gordonvale, Queensland in 1935 by the Australian Bureau of Sugar ExperimentalStations as a biological control for French’s Cane Beetle and the Greyback Cane Beetle, which are majorpests of sugar cane.
DistributionThe natural range of Cane Toads extendsfrom the southern United States to tropicalSouth America. They were deliberatelyintroduced from Hawaii to Australia in1935. Since then, the cane toads havespread rapidly – south into New SouthWales, with one isolated community in PortMacquarie, and west into the NorthernTerritory. In March 2001 they reached thewetlands of heritage-listed Kakadu NationalPark. The species is observed in the easternand northern parts of Queensland andthrough to Kakadu National Park in theNorthern Territory. Within New South Wales,they occur on the coast as far south asYamba. A lack of natural predators andfavourable environmental conditions, haveaided the cane toad in its colonisation inAustralia. The toad is predicted to increaseits geographic range throughout coastal andnear-coastal regions of northern Australia toencompass an area of approximately 2million km2 (Sutherst et al. 1995).
Counting the Cost: Impact of Invasive Animals in Australia, 2004
� Cane toads were introduced from Hawaii to Australia in 1935, to control scarab beetles that are pests of sugar cane
� Range from Kakadu National Park in the Northern Territory through to the New South Wales coast as far south as Yamba
� The main controls on the spread of Cane Toads in southern Australia are quarantine checks and public awareness and response
� A decline in quoll numbers and native frogs in areas where large numbers of cane toads are found has been recorded.
� All stages of the Cane Toad's life-cycle are poisonous
(Source: Sutherst et al. 1995, Van Dam et al. 2002)
Figure 9: Distribution of Cane Toads
47
Cane Toads (Bufo marinus)
Economic ImpactCane toads have no direct impact on agriculture, but a considerable amount of resources are targeted atfinding biological controls. Scientists at CSIRO research bio control methods, while staff at the University ofAdelaide have isolated a sex pheromone that may be of value. Current cost impacts of the toad areoutlined below.
Table 21: Annual Cost Impact of Cane Toads
(a): Research cost taken from Bomford and Hart (2002)
Cane Toad Management CostsThe main controls on the spread of Cane Toads in southern Australia are quarantine checks and publicawareness and response. Research into cane toads costs around $0.5 million every year, however noestimates of the costs of management were found.
Environmental ImpactAustralian native fauna that have been killed by cane toads include Goannas, Freshwater Crocodiles, TigerSnakes, Red-bellied Black Snakes, Death Adders, Dingoes and Northern Quolls. There is some evidence ofthe environmental impacts of cane toads. Populations of Northern Quoll, D. hallucatus, have seriouslydeclined in Queensland following colonisation by cane toads (Burnett 1997). These quoll populations havenot recovered in the past 10 years, therefore cane toads impact on quolls is likely to be a long-termphenomena (Burnett 1997, in Glanznig, 2003).
Social ImpactAll stages of the cane toad's life-cycle are poisonous. The venom produced by the parotoid glands actsprincipally on the heart. No humans have died in Australia from Cane Toad poisoning. Cane Toads are alsopoisonous to pets and in Hawaii up to 50 dogs a year have died after mouthing Cane Toads. Theintroduction of cane toads into traditional Aboriginal areas, such as Kakadu, may result in the decline indingo, snake and crocodile numbers – threatening the nomadic hunter and gatherer lifestyle.
ReferencesBurnett, S. (1993) The conservation status of the tiger quoll Dasyurus hallucatus gracilis in north Queensland,Unpublished report to Queensland Department of Environment and Heritage, Brisbane.
Glanznig, A. (2003) Nomination for listing a threatening process as a key threatening process under theEnvironment Protection and Biodiversity Conservation Act 1999
Sutherst, R.W., Floyd, R.B. and Maywald, G.F. 1995. The potential geographical distribution of the canetoad, Bufo marinus L. in Australia, Conservation Biology 9:294–299
Van Dam, R., Walden, D. and Begg, G. (2002) A preliminary risk assessment of cane toads in Kakadu NationalPark, Supervising Scientist Report 164, Supervising Scientist, Darwin.
Cost ComponentControl
$A millionLoss
$A millionTotal
$A million
Research Cost a 0.50 - 0.50
TOTAL COST 0.50 - 0.50
48
Counting the Cost: Impact of Invasive Animals in Australia, 2004
HistoryHorses were introduced in Australia with European settlement. Over time, animals escaped and werereleased and were first recognised as pests in Australia in the 1860’s.
DistributionIn 1992 feral horse numbers in Australia were estimated at 300,000. Most feral horses occur in theextensive cattle production areas of the Northern Territory and Queensland, as well as in some areas ofWestern Australia and South Australia. Smaller, scattered populations occur in alpine and sub-alpine regionsof eastern Australia in New South Wales and Victoria.
Density of feral horses can vary greatly and is dependent on factors such as management programs,climate, and incidence of bush fires.
Economic ImpactResearch costs are the major cost associated with this species. Key economic impacts include:
Table 22: Annual Cost Impact of Wild Horses
(a): Research cost consultant estimate based on those for other species in Bomford and Hart (2002)
Wild Horse Management CostsThere are a range of control methods which include (English 2000):
� Immobilisation using drugs delivered by dart rifle – suitable only for small groups that can be closely approached, and not without risk to the horses.
� Mustering and trapping – feasible under some circumstances but not without animal welfare concerns, especially in the transport of the animals after capture.
� Ground shooting – appropriate in open country, but very difficult in rough terrain, especially in following up wounded horses.
� Australia has an estimated 300,000 feral horses, mainly in central and northern Australia� Feral horses have limited impact on agricultural industries� The brumby is a symbol of Australian identity� Public concerns over humane measures of control have arisen
WILD HORSES (Equus caballus)
Cost ComponentControl
$A millionLoss
$A millionTotal
$A million
Research Cost a 0.50 - 0.50
TOTAL COST 0.50 - 0.50
49
Wild Horses (Equus caballus)
� Shooting from helicopters – considered by the Senate Standing Committee on Agriculture ( Model Code of Practice for the destruction or capture, handling and marketing of feral livestock animals 1991) to be the only practical method for quick, large-scale and humane culling of large animals in inaccessible locations.
Although these management processes are well documented, no current estimates of annual expenditureon wild horse management were found.
Environmental ImpactScientists have found that feral horses can damage native environments by increasing soil erosion, killingvegetation, disturbing the soil and destroying native plants along frequently used routes, trampling andfouling waterholes, collapsing wildlife burrows, spreading weeds through their dung and hair, andcompeting with native animals for food and shelter (Berman and Jarman 1988, Dyring 1990).
Social ImpactWild horses are regarded as a national symbol by many Australians and the subject of bush folk lore.Inhumane management of wild horses has received wide media attention in Australia. Habitation of wildhorses in the highland areas of the NSW and Victorian border regions may be a source of eco tourism andemployment of people in these regional areas.
ReferencesBerman, D. and Jarman, P.J. (1988) Feral horses in the Northern Territory Vol. IV: Environmental impact of feralhorses in central Australia, Internal document, Conservation Commission of the Northern Territory
Bowman, A.J. (1987) Feral horses in the Northern Territory Vol. III: economic viability and producer preferencefor management strategies of feral horses, Internal document, Conservation Commission of the NorthernTerritory.
Dobbie, W.R., Berman, D. and Braysher, M.L. (1993) Managing Vertebrate Pests: Feral Horses, Department ofPrimary Industries and Energy, Bureau of Resource Sciences.
Dyring, J. (1990) The impact of feral horses on sub-alpine and montane environments in Australia, M.Sc Thesis,University of Canberra
English, A.W. (2000) Report on the Cull of Feral Horses in Guy Fawkes River National Park in October 2000,Report to National Parks and Wildlife Service, November
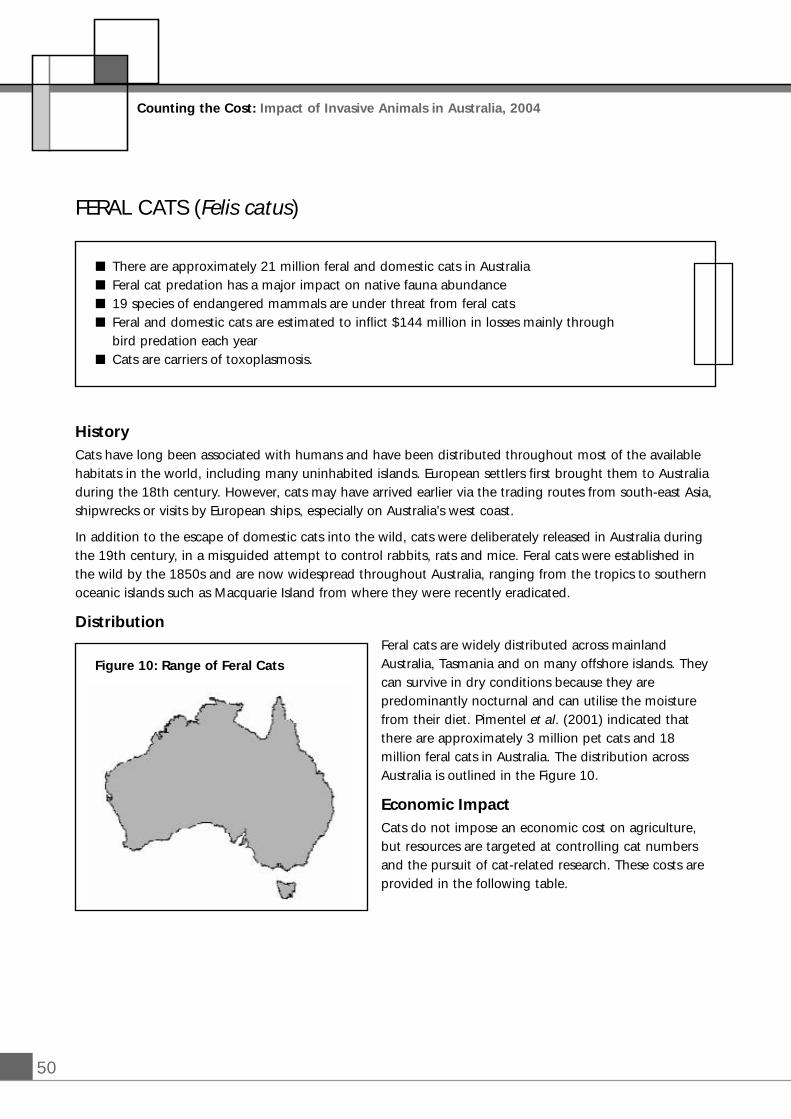
50
Counting the Cost: Impact of Invasive Animals in Australia, 2004
HistoryCats have long been associated with humans and have been distributed throughout most of the availablehabitats in the world, including many uninhabited islands. European settlers first brought them to Australiaduring the 18th century. However, cats may have arrived earlier via the trading routes from south-east Asia,shipwrecks or visits by European ships, especially on Australia’s west coast.
In addition to the escape of domestic cats into the wild, cats were deliberately released in Australia duringthe 19th century, in a misguided attempt to control rabbits, rats and mice. Feral cats were established inthe wild by the 1850s and are now widespread throughout Australia, ranging from the tropics to southernoceanic islands such as Macquarie Island from where they were recently eradicated.
DistributionFeral cats are widely distributed across mainlandAustralia, Tasmania and on many offshore islands. Theycan survive in dry conditions because they arepredominantly nocturnal and can utilise the moisturefrom their diet. Pimentel et al. (2001) indicated thatthere are approximately 3 million pet cats and 18million feral cats in Australia. The distribution acrossAustralia is outlined in the Figure 10.
Economic ImpactCats do not impose an economic cost on agriculture,but resources are targeted at controlling cat numbersand the pursuit of cat-related research. These costs areprovided in the following table.
� There are approximately 21 million feral and domestic cats in Australia� Feral cat predation has a major impact on native fauna abundance� 19 species of endangered mammals are under threat from feral cats� Feral and domestic cats are estimated to inflict $144 million in losses mainly through
bird predation each year� Cats are carriers of toxoplasmosis.
FERAL CATS (Felis catus)
Figure 10: Range of Feral Cats
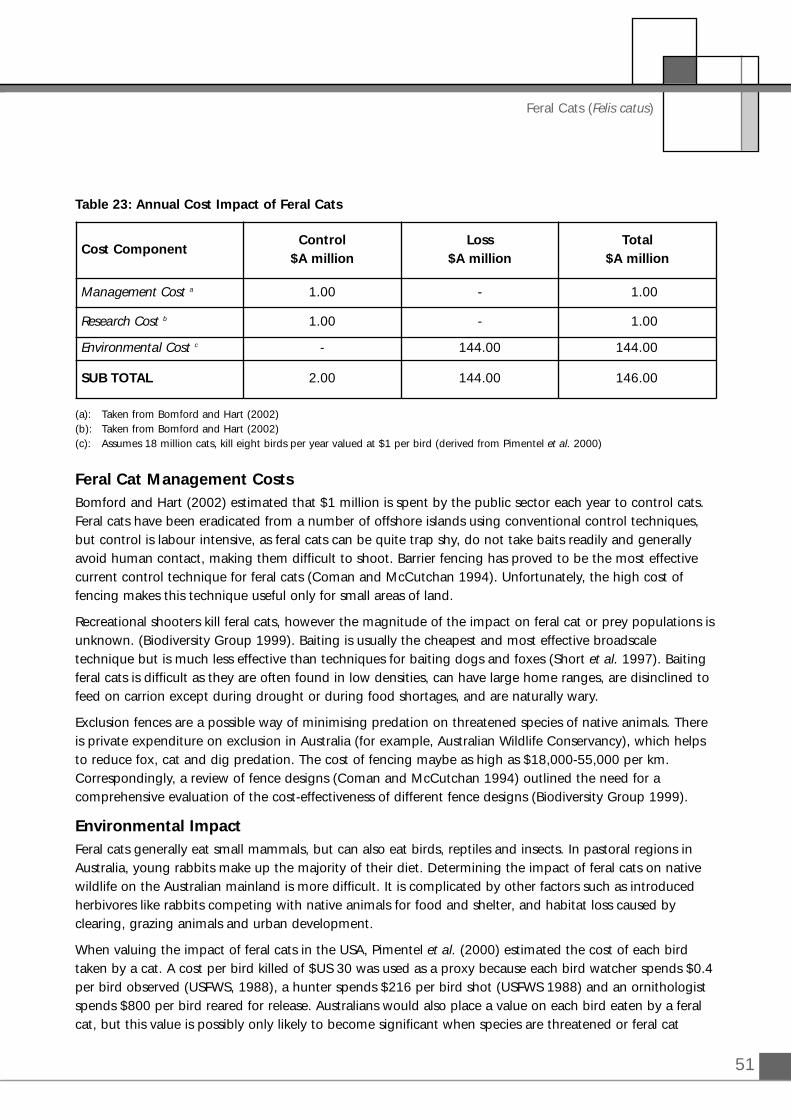
51
Feral Cats (Felis catus)
Table 23: Annual Cost Impact of Feral Cats
(a): Taken from Bomford and Hart (2002)(b): Taken from Bomford and Hart (2002)(c): Assumes 18 million cats, kill eight birds per year valued at $1 per bird (derived from Pimentel et al. 2000)
Feral Cat Management CostsBomford and Hart (2002) estimated that $1 million is spent by the public sector each year to control cats.Feral cats have been eradicated from a number of offshore islands using conventional control techniques,but control is labour intensive, as feral cats can be quite trap shy, do not take baits readily and generallyavoid human contact, making them difficult to shoot. Barrier fencing has proved to be the most effectivecurrent control technique for feral cats (Coman and McCutchan 1994). Unfortunately, the high cost offencing makes this technique useful only for small areas of land.
Recreational shooters kill feral cats, however the magnitude of the impact on feral cat or prey populations isunknown. (Biodiversity Group 1999). Baiting is usually the cheapest and most effective broadscaletechnique but is much less effective than techniques for baiting dogs and foxes (Short et al. 1997). Baitingferal cats is difficult as they are often found in low densities, can have large home ranges, are disinclined tofeed on carrion except during drought or during food shortages, and are naturally wary.
Exclusion fences are a possible way of minimising predation on threatened species of native animals. Thereis private expenditure on exclusion in Australia (for example, Australian Wildlife Conservancy), which helpsto reduce fox, cat and dig predation. The cost of fencing maybe as high as $18,000-55,000 per km.Correspondingly, a review of fence designs (Coman and McCutchan 1994) outlined the need for acomprehensive evaluation of the cost-effectiveness of different fence designs (Biodiversity Group 1999).
Environmental ImpactFeral cats generally eat small mammals, but can also eat birds, reptiles and insects. In pastoral regions inAustralia, young rabbits make up the majority of their diet. Determining the impact of feral cats on nativewildlife on the Australian mainland is more difficult. It is complicated by other factors such as introducedherbivores like rabbits competing with native animals for food and shelter, and habitat loss caused byclearing, grazing animals and urban development.
When valuing the impact of feral cats in the USA, Pimentel et al. (2000) estimated the cost of each birdtaken by a cat. A cost per bird killed of $US 30 was used as a proxy because each bird watcher spends $0.4per bird observed (USFWS, 1988), a hunter spends $216 per bird shot (USFWS 1988) and an ornithologistspends $800 per bird reared for release. Australians would also place a value on each bird eaten by a feralcat, but this value is possibly only likely to become significant when species are threatened or feral cat
Cost ComponentControl
$A millionLoss
$A millionTotal
$A million
Management Cost a 1.00 - 1.00
Research Cost b 1.00 - 1.00
Environmental Cost c - 144.00 144.00
SUB TOTAL 2.00 144.00 146.00
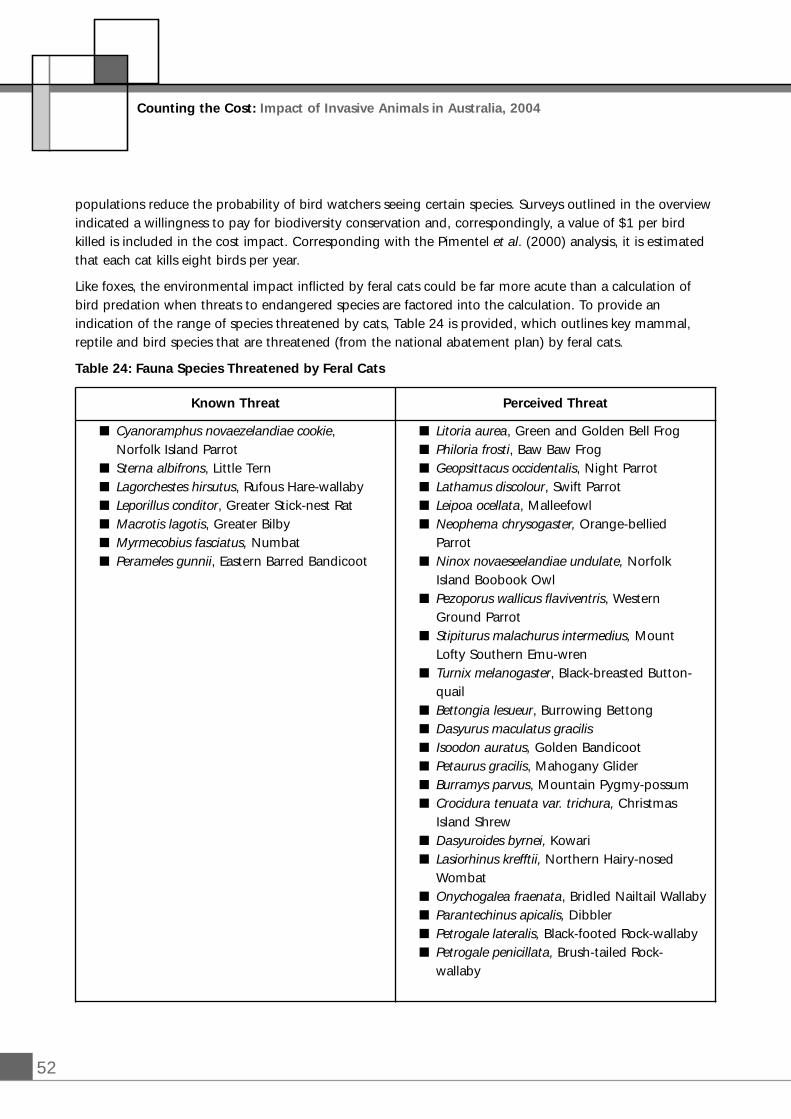
52
Counting the Cost: Impact of Invasive Animals in Australia, 2004
populations reduce the probability of bird watchers seeing certain species. Surveys outlined in the overviewindicated a willingness to pay for biodiversity conservation and, correspondingly, a value of $1 per birdkilled is included in the cost impact. Corresponding with the Pimentel et al. (2000) analysis, it is estimatedthat each cat kills eight birds per year.
Like foxes, the environmental impact inflicted by feral cats could be far more acute than a calculation ofbird predation when threats to endangered species are factored into the calculation. To provide anindication of the range of species threatened by cats, Table 24 is provided, which outlines key mammal,reptile and bird species that are threatened (from the national abatement plan) by feral cats.
Table 24: Fauna Species Threatened by Feral Cats
Known Threat Perceived Threat
� Cyanoramphus novaezelandiae cookie, Norfolk Island Parrot
� Sterna albifrons, Little Tern � Lagorchestes hirsutus, Rufous Hare-wallaby � Leporillus conditor, Greater Stick-nest Rat � Macrotis lagotis, Greater Bilby � Myrmecobius fasciatus, Numbat � Perameles gunnii, Eastern Barred Bandicoot
� Litoria aurea, Green and Golden Bell Frog � Philoria frosti, Baw Baw Frog � Geopsittacus occidentalis, Night Parrot � Lathamus discolour, Swift Parrot � Leipoa ocellata, Malleefowl � Neophema chrysogaster, Orange-bellied
Parrot � Ninox novaeseelandiae undulate, Norfolk
Island Boobook Owl � Pezoporus wallicus flaviventris, Western
Ground Parrot � Stipiturus malachurus intermedius, Mount
Lofty Southern Emu-wren � Turnix melanogaster, Black-breasted Button-
quail � Bettongia lesueur, Burrowing Bettong � Dasyurus maculatus gracilis� Isoodon auratus, Golden Bandicoot � Petaurus gracilis, Mahogany Glider � Burramys parvus, Mountain Pygmy-possum � Crocidura tenuata var. trichura, Christmas
Island Shrew � Dasyuroides byrnei, Kowari � Lasiorhinus krefftii, Northern Hairy-nosed
Wombat � Onychogalea fraenata, Bridled Nailtail Wallaby � Parantechinus apicalis, Dibbler � Petrogale lateralis, Black-footed Rock-wallaby � Petrogale penicillata, Brush-tailed Rock-
wallaby
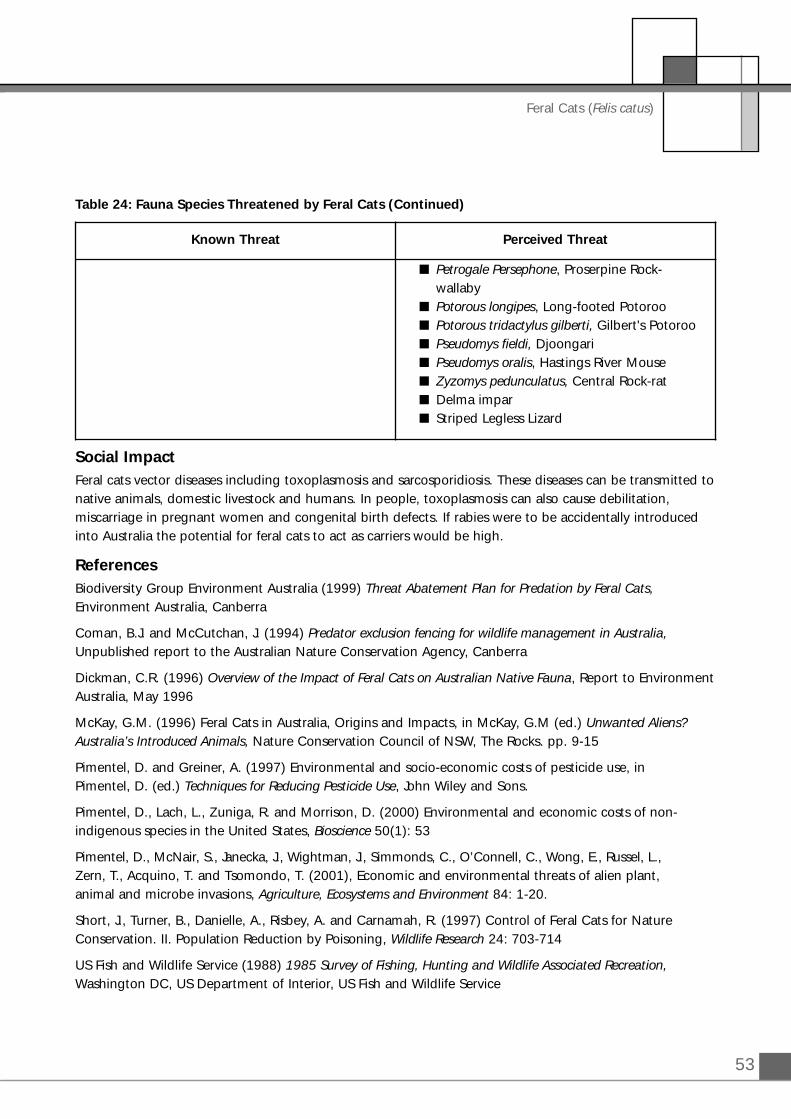
53
Feral Cats (Felis catus)
Table 24: Fauna Species Threatened by Feral Cats (Continued)
Social ImpactFeral cats vector diseases including toxoplasmosis and sarcosporidiosis. These diseases can be transmitted tonative animals, domestic livestock and humans. In people, toxoplasmosis can also cause debilitation,miscarriage in pregnant women and congenital birth defects. If rabies were to be accidentally introducedinto Australia the potential for feral cats to act as carriers would be high.
ReferencesBiodiversity Group Environment Australia (1999) Threat Abatement Plan for Predation by Feral Cats,Environment Australia, Canberra
Coman, B.J. and McCutchan, J. (1994) Predator exclusion fencing for wildlife management in Australia,Unpublished report to the Australian Nature Conservation Agency, Canberra
Dickman, C.R. (1996) Overview of the Impact of Feral Cats on Australian Native Fauna, Report to EnvironmentAustralia, May 1996
McKay, G.M. (1996) Feral Cats in Australia, Origins and Impacts, in McKay, G.M (ed.) Unwanted Aliens?Australia’s Introduced Animals, Nature Conservation Council of NSW, The Rocks. pp. 9-15
Pimentel, D. and Greiner, A. (1997) Environmental and socio-economic costs of pesticide use, in Pimentel, D. (ed.) Techniques for Reducing Pesticide Use, John Wiley and Sons.
Pimentel, D., Lach, L., Zuniga, R. and Morrison, D. (2000) Environmental and economic costs of non-indigenous species in the United States, Bioscience 50(1): 53
Pimentel, D., McNair, S., Janecka, J., Wightman, J., Simmonds, C., O’Connell, C., Wong, E., Russel, L., Zern, T., Acquino, T. and Tsomondo, T. (2001), Economic and environmental threats of alien plant, animal and microbe invasions, Agriculture, Ecosystems and Environment 84: 1-20.
Short, J., Turner, B., Danielle, A., Risbey, A. and Carnamah, R. (1997) Control of Feral Cats for NatureConservation. II. Population Reduction by Poisoning, Wildlife Research 24: 703-714
US Fish and Wildlife Service (1988) 1985 Survey of Fishing, Hunting and Wildlife Associated Recreation,Washington DC, US Department of Interior, US Fish and Wildlife Service
Known Threat Perceived Threat
� Petrogale Persephone, Proserpine Rock-wallaby
� Potorous longipes, Long-footed Potoroo � Potorous tridactylus gilberti, Gilbert's Potoroo � Pseudomys fieldi, Djoongari � Pseudomys oralis, Hastings River Mouse � Zyzomys pedunculatus, Central Rock-rat � Delma impar � Striped Legless Lizard
54
Counting the Cost: Impact of Invasive Animals in Australia, 2004
HistoryThere are 48 species of kangaroo found in Australia. The most abundant species include red and greykangaroos (Macorpus rufus, M. giganteus and M. fuliginosus) and Euros and Wallaroos (Macorpus robustus).These species are common in sheep and cattle grazing areas and are commercially harvested.
Whether the native kangaroo is indeed a pest or not is a hotly debated topic. Within grazing areaskangaroos compete with sheep and cattle for forage and damage crops and fences (Gibson and Young1987, Sloane et al. 1988). Given the need to manage rangelands sustainably, Kangaroo Management Planswere introduced on a state-by-state basis to regulate the commercial harvesting of these species.
DistributionEastern grey kangaroos are found down the east coast where annual rainfall is greater than 250 mm(Caughley et al. 1987). This distribution includes all of Queensland (except western Cape York), New SouthWales, Victoria and north-eastern Tasmania. The western grey kangaroo occurs across the south of thecontinent, with a distribution extending northwards through western New South Wales and into a smallarea of southern central Queensland (Pople and Grigg 1999). The highest densities of this species are incentral NSW around Cobar and Hillston.
In 2002 it was estimated that there were 58.6 million kangaroos of commercially harvested species. Thehighest densities were within the sheep pastoral zone, where approximately 15% of the national flock arefound. Densities of red kangaroos are lower outside the ‘Dingo fence’ because of the presence of dingoes.Red kangaroos occur across the continent west of the Great Dividing Range, but excluding Cape York,Arnhem Land, the Kimberley region, the south-west corner and Tasmania (Pople and Grigg 1999).
Economic ImpactKangaroos compete with sheep and cattle for fodder inflicting a cost on these industries. These economicimpacts are described in the following section.
� The kangaroo has substantial tourism, commercial resource use and national identity value, along with inflicting costs on rural industries and motorists
� Reduced livestock carrying capacity, fence maintenance, traffic accidents and crop damage estimated to be $76 million per year
� Commercial use of kangaroo skins and meat generates annual revenue of $200 million per year� Some kangaroo species may have increased in number as a result of changed land use –
displacing other native species
KANGAROO
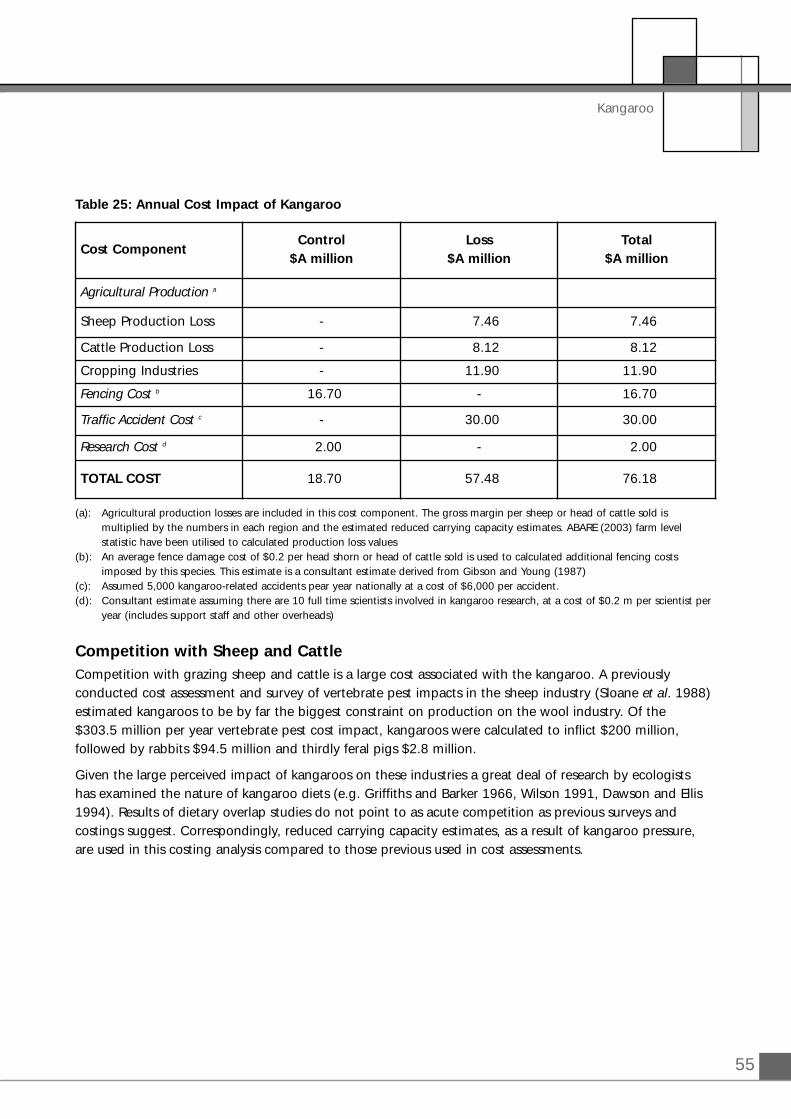
55
Kangaroo
Table 25: Annual Cost Impact of Kangaroo
(a): Agricultural production losses are included in this cost component. The gross margin per sheep or head of cattle sold is multiplied by the numbers in each region and the estimated reduced carrying capacity estimates. ABARE (2003) farm level statistic have been utilised to calculated production loss values
(b): An average fence damage cost of $0.2 per head shorn or head of cattle sold is used to calculated additional fencing costs imposed by this species. This estimate is a consultant estimate derived from Gibson and Young (1987)
(c): Assumed 5,000 kangaroo-related accidents pear year nationally at a cost of $6,000 per accident.(d): Consultant estimate assuming there are 10 full time scientists involved in kangaroo research, at a cost of $0.2 m per scientist per
year (includes support staff and other overheads)
Competition with Sheep and CattleCompetition with grazing sheep and cattle is a large cost associated with the kangaroo. A previouslyconducted cost assessment and survey of vertebrate pest impacts in the sheep industry (Sloane et al. 1988)estimated kangaroos to be by far the biggest constraint on production on the wool industry. Of the $303.5 million per year vertebrate pest cost impact, kangaroos were calculated to inflict $200 million,followed by rabbits $94.5 million and thirdly feral pigs $2.8 million.
Given the large perceived impact of kangaroos on these industries a great deal of research by ecologistshas examined the nature of kangaroo diets (e.g. Griffiths and Barker 1966, Wilson 1991, Dawson and Ellis1994). Results of dietary overlap studies do not point to as acute competition as previous surveys andcostings suggest. Correspondingly, reduced carrying capacity estimates, as a result of kangaroo pressure,are used in this costing analysis compared to those previous used in cost assessments.
Cost ComponentControl
$A millionLoss
$A millionTotal
$A million
Agricultural Production a
Sheep Production Loss - 7.46 7.46
Cattle Production Loss - 8.12 8.12
Cropping Industries - 11.90 11.90
Fencing Cost b 16.70 - 16.70
Traffic Accident Cost c - 30.00 30.00
Research Cost d 2.00 - 2.00
TOTAL COST 18.70 57.48 76.18
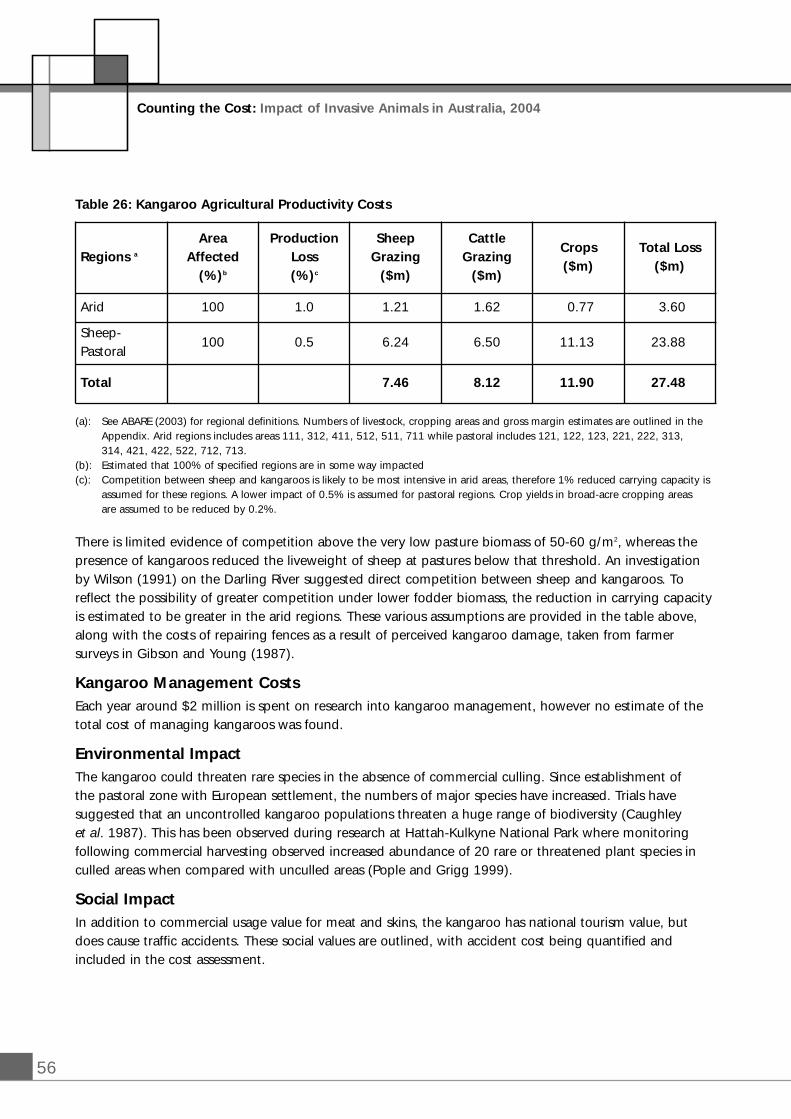
56
Table 26: Kangaroo Agricultural Productivity Costs
(a): See ABARE (2003) for regional definitions. Numbers of livestock, cropping areas and gross margin estimates are outlined in the Appendix. Arid regions includes areas 111, 312, 411, 512, 511, 711 while pastoral includes 121, 122, 123, 221, 222, 313, 314, 421, 422, 522, 712, 713.
(b): Estimated that 100% of specified regions are in some way impacted(c): Competition between sheep and kangaroos is likely to be most intensive in arid areas, therefore 1% reduced carrying capacity is
assumed for these regions. A lower impact of 0.5% is assumed for pastoral regions. Crop yields in broad-acre cropping areas are assumed to be reduced by 0.2%.
There is limited evidence of competition above the very low pasture biomass of 50-60 g/m2, whereas thepresence of kangaroos reduced the liveweight of sheep at pastures below that threshold. An investigationby Wilson (1991) on the Darling River suggested direct competition between sheep and kangaroos. Toreflect the possibility of greater competition under lower fodder biomass, the reduction in carrying capacityis estimated to be greater in the arid regions. These various assumptions are provided in the table above,along with the costs of repairing fences as a result of perceived kangaroo damage, taken from farmersurveys in Gibson and Young (1987).
Kangaroo Management CostsEach year around $2 million is spent on research into kangaroo management, however no estimate of thetotal cost of managing kangaroos was found.
Environmental ImpactThe kangaroo could threaten rare species in the absence of commercial culling. Since establishment of the pastoral zone with European settlement, the numbers of major species have increased. Trials havesuggested that an uncontrolled kangaroo populations threaten a huge range of biodiversity (Caughley et al. 1987). This has been observed during research at Hattah-Kulkyne National Park where monitoringfollowing commercial harvesting observed increased abundance of 20 rare or threatened plant species inculled areas when compared with unculled areas (Pople and Grigg 1999).
Social ImpactIn addition to commercial usage value for meat and skins, the kangaroo has national tourism value, butdoes cause traffic accidents. These social values are outlined, with accident cost being quantified andincluded in the cost assessment.
Counting the Cost: Impact of Invasive Animals in Australia, 2004
Regions a
AreaAffected
(%)b
ProductionLoss(%)c
SheepGrazing
($m)
Cattle Grazing
($m)
Crops ($m)
Total Loss ($m)
Arid 100 1.0 1.21 1.62 0.77 3.60
Sheep-Pastoral
100 0.5 6.24 6.50 11.13 23.88
Total 7.46 8.12 11.90 27.48
57
Kangaroo
National Tourist SymbolIt is very difficult to value kangaroos’ contribution to Australia's tourism industry. However, the value wouldbe very high. The economic value of inbound tourism to Australia was $16.1 billion in 1996 (14.5% of export earnings, Marsupial CRC 2000). Of these tourists, 22% were thought to travel to Australiabecause of unique wildlife and 11% indicated they would not visit this country without it. Thus, wildlifecontributes between $1.8 and $3.5 billion of inbound tourist expenditure, which amounts to employmentfor between 14,700 and 29,500 people (Marsupial CRC 2000).
Kangaroo IndustryThe use of kangaroos for skins and meat for pet food has been the focus of the commercial use ofkangaroos (Corrigan 1988). Kangaroos are commercially culled under approved management initiated sincethe 1970s. More than half of the kangaroos shot commercially in Australia each year are used for their hidesonly, so meat production could be increased without more kangaroos being killed (Pople and Grigg 1999).In the event that all meat was used Switala (1995) estimated the availability of 55,000 tonnes of meat.Using a price of $3–6 per kilogram, Switala (1995) calculated that this potential tonnage represented ameat industry with a potential value of $171–341 million. At present, the kangaroo industry generatesannual revenue of $200 million and employs some 4,000 people, primarily in remote and regional areas(equivalent to 6-7,000 jobs in cities). (Marsupial CRC 2000)
Road AccidentsKangaroos are a leading cause of animal-related traffic accidents and resulting repair, injury and absencefrom work related costs for those involved with incidents. There is limited information relating to themagnitude of kangaroo accident costs. The RACV in Victoria, receives about 1,000 claims/year and $2million in claims due to accidents involving motor vehicles and animals.
National road accident databases (see Australian Transport Safety Bureau (2000), Bureau of TransportEconomics (2000)) recorded 1392 crashes over an eight-year period resulting in hospitalisation afteranimals were hit. Nationally, this represents 1.0% of all hospitalisation crashes in this time period.
The NRMA. reported 11,000 claims nationally for animal-related accidents over the last 12 months (NRMA2003). Kangaroos, dogs and cows were the species involved in most incidents. Traffic accidents can entail awide range of costs which include vehicle repair, legal costs, medical expenses, insurance costs and longterm care, lost labour for carers and travel delay costs in the cases of serious accidents. The cost per crashwas estimated by the Bureau of Transport Economics (2000) to vary from $1.65 million in the case of afatality to $5,808 for a minor incident. Given the low number of animal-related accidents causing seriousinjury, an average per incident cost of $6,000 was assumed and 5,000 kangaroo-related accidents wereestimated to occur per year in the costing assessment. The aggregate cost of this item was estimated to be$30 million per year.
58
ReferencesAustralian Transport Safety Bureau (2000) Bull Bars and Road Trauma, Road Safety Research Report CR 200,December 2000.
Bureau of Transport Economics (2000) Road Crash Costs in Australia, Report 102, BTS, Canberra, May
Caughley, G., Grigg, G.C., Caughley, J. and Hill, G.J.E. (1980) Does dingo predation control the densities ofkangaroos and emus?, Australian Wildlife Research 7: 1-12.
Caughley, G., Shepherd, N. and Short, J. (1987). Kangaroos: Their Ecology and Management in the SheepRangelands of Australia, Cambridge University Press, Cambridge
Caughley, G., Short, J., Grigg, G.C. and Nix, H. (1987). Kangaroos and climate: an analysis of distribution,Journal of Animal Ecology 56, 751-61
Collins, D. and Menz, K. (1986) An Economic Perspective on the Population Management of CommerciallyHarvested Kangaroo, 30th Annual conference of the Australian Agricultural Economics Society, ANU,Canberra.
Corrigan, P. (1988) Export of kangaroo meat, Australian Zoologist 24: 179-80
Dawson, T. J. and Ellis, B. A. (1994) Diets of mammalian herbivores in Australian arid shrublands: seasonaleffects on overlap between red kangaroos, sheep and rabbits and on dietary niche breadths and electives.Journal of Arid Environments 26: 257-71
Gibson, L.M. and Young, M.D. (1987) Kangaroos: Counting the cost. Report to Australian National Parks andWildlife Service. Project Report No.4 CSIRO, Deniliquin.
Gomboso, J. (1987) The Impact of Alternative Kangaroo Management Levels on Agricultural Production andIncome in the Pastoral Zone of NSW, Thesis, University of Wollongong.
Griffiths, M. and Barker, R. (1966) The plants eaten by sheep and by kangaroos grazing together in apaddock in south-western Queensland, CSIRO Wildlife Research 11: 145-67
Marsupial CRC (2000) An Analysis of the Contribution that Marsupials and Marsupial Research Make to theAustralian Economy, Report to the Marsupial CRC by Michael Johnson and Associates, 26 April 2000.
McLeod, S. (1997) Is the concept of carrying capacity useful in variable environments?, Oikos 79: 529-42
Newsome, A. (1990) The control of vertebrate pests by vertebrate predators. Trends in Ecology and Evolution5: 187-91.
NRMA (2003) Animals on a Collision Course, Media Release, 1 August 2003, NRMA, Sydney.
O'Dea, K. (1984) Marked improvement in carbohydrate and lipid metabolism in diabetic AustralianAborigines after temporary reversion to traditional lifestyle, Diabetes 33: 596-603
O'Dea, K. (1988) Kangaroo meat – polyunsaturated and low in fat: ideal for cholesterol-lowering diets,Australian Zoologist 24: 140-143
O'Dea, K. and Sinclair, A. J. (1985) The effects of low fat diets rich in arachidonic acid on the compositionof plasma fatty acids and bleeding time in Australian Aborigines, Journal of Nutritional Science andVitaminology 31: 441-453
Counting the Cost: Impact of Invasive Animals in Australia, 2004
59
Kangaroo
Pople, T. and Grigg, G. (1999) Commercial Harvesting of Kangaroos in Australia, Report for EnvironmentAustralia, August 1999, www.deh.gov.au/biodiversity/trade-use/wild-harvest/kangaroo/harvesting/index.html
Sinclair, A.J. (1988) Nutritional properties of kangaroo meat, Australian Zoologist 24: 146-8
Sloane, Cook and King (1988) The Economic Impact of Pasture Weeds, Pests and Diseases on the AustralianWool Industry, consultant Report to the Australian Wool Corporation, December 1988
Switala, J. (1995) The potential supply and value of kangaroo meat, in Grigg, G. C., Hale, P.T. and Lunney,D. (eds.) Conservation Through Sustainable Use of Wildlife, Centre for Conservation Biology, The University ofQueensland: Brisbane, pp. 237-42
Wilson, A.D. (1991) Forage utilization by sheep and kangaroos in a semi-arid woodland. The RangelandJournal 13: 81-90
Wilson, A.D. and Macleod, N.D. (1988) The Effect of Kangaroos on the Productivity of Sheep in the MulgaWoodlands. Unpublished working paper discussed at the 5th Biennial Conference of the AustralianRangelands Society
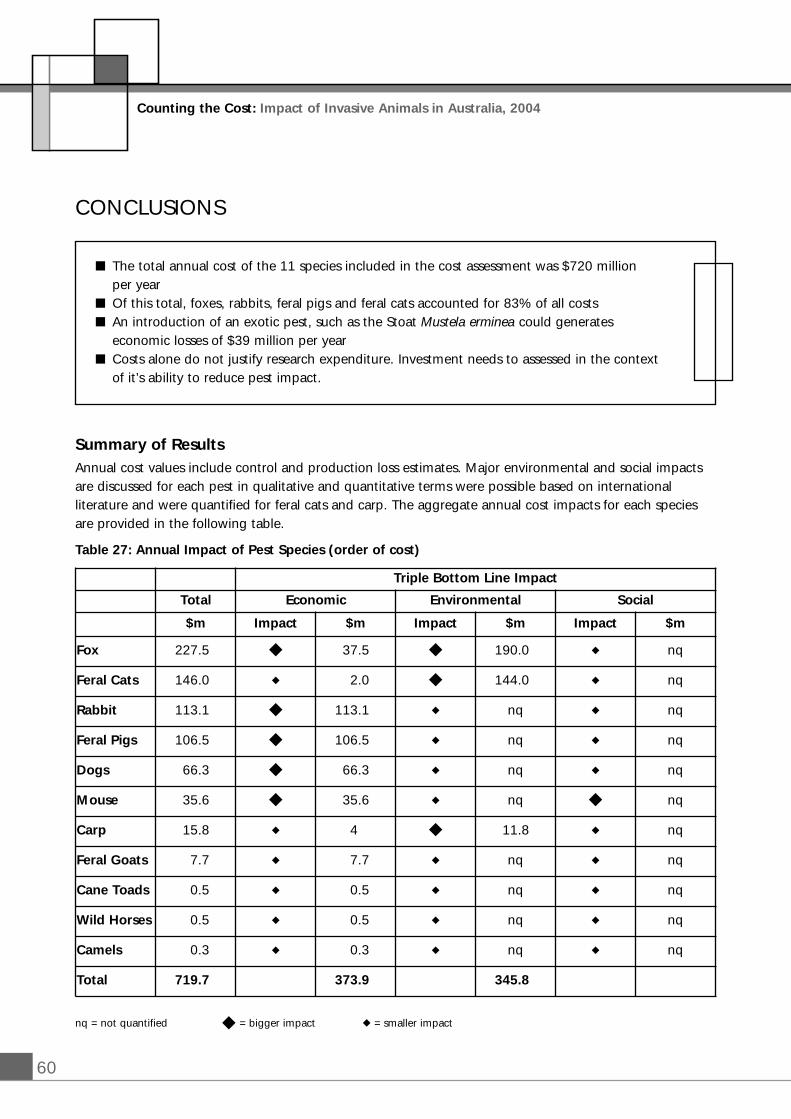
60
Counting the Cost: Impact of Invasive Animals in Australia, 2004
Summary of ResultsAnnual cost values include control and production loss estimates. Major environmental and social impactsare discussed for each pest in qualitative and quantitative terms were possible based on internationalliterature and were quantified for feral cats and carp. The aggregate annual cost impacts for each speciesare provided in the following table.
Table 27: Annual Impact of Pest Species (order of cost)
nq = not quantified � = bigger impact � = smaller impact
� The total annual cost of the 11 species included in the cost assessment was $720 million per year
� Of this total, foxes, rabbits, feral pigs and feral cats accounted for 83% of all costs� An introduction of an exotic pest, such as the Stoat Mustela erminea could generates
economic losses of $39 million per year� Costs alone do not justify research expenditure. Investment needs to assessed in the context
of it’s ability to reduce pest impact.
CONCLUSIONS
Triple Bottom Line Impact
Total Economic Environmental Social
$m Impact $m Impact $m Impact $m
Fox 227.5 � 37.5 � 190.0 � nq
Feral Cats 146.0 � 2.0 � 144.0 � nq
Rabbit 113.1 � 113.1 � nq � nq
Feral Pigs 106.5 � 106.5 � nq � nq
Dogs 66.3 � 66.3 � nq � nq
Mouse 35.6 � 35.6 � nq � nq
Carp 15.8 � 4 � 11.8 � nq
Feral Goats 7.7 � 7.7 � nq � nq
Cane Toads 0.5 � 0.5 � nq � nq
Wild Horses 0.5 � 0.5 � nq � nq
Camels 0.3 � 0.3 � nq � nq
Total 719.7 373.9 345.8
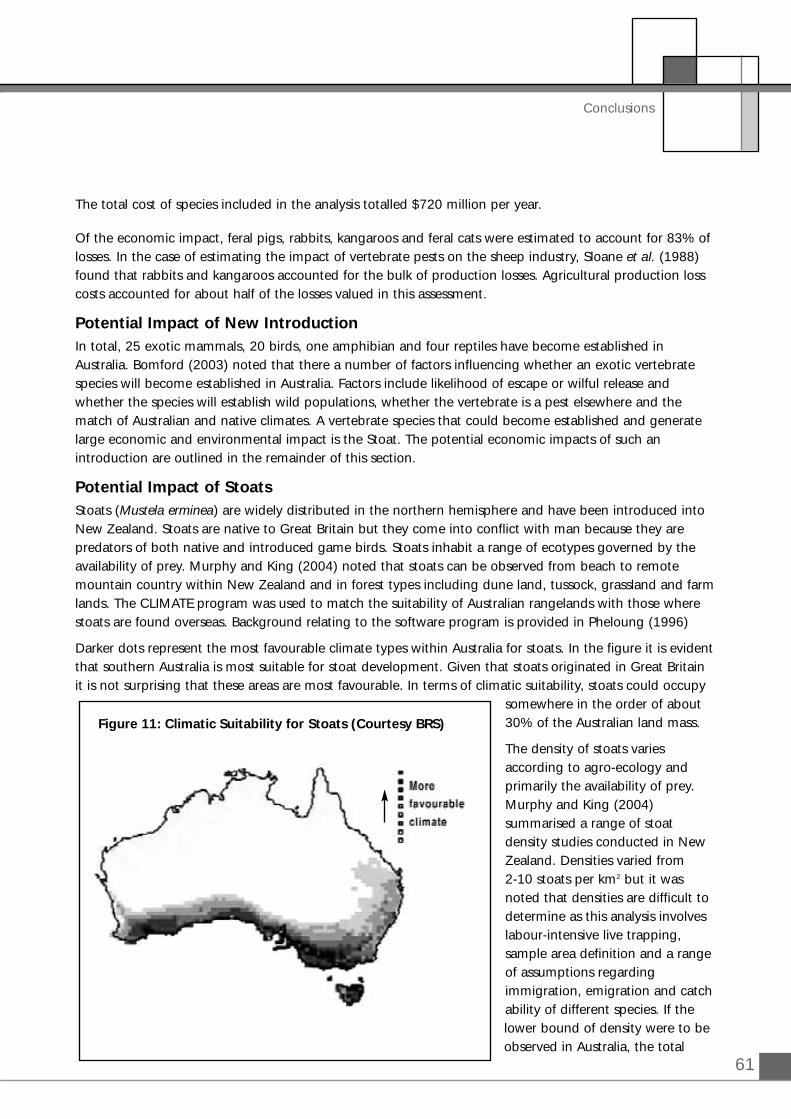
61
Conclusions
The total cost of species included in the analysis totalled $720 million per year.
Of the economic impact, feral pigs, rabbits, kangaroos and feral cats were estimated to account for 83% oflosses. In the case of estimating the impact of vertebrate pests on the sheep industry, Sloane et al. (1988)found that rabbits and kangaroos accounted for the bulk of production losses. Agricultural production losscosts accounted for about half of the losses valued in this assessment.
Potential Impact of New IntroductionIn total, 25 exotic mammals, 20 birds, one amphibian and four reptiles have become established inAustralia. Bomford (2003) noted that there a number of factors influencing whether an exotic vertebratespecies will become established in Australia. Factors include likelihood of escape or wilful release andwhether the species will establish wild populations, whether the vertebrate is a pest elsewhere and thematch of Australian and native climates. A vertebrate species that could become established and generatelarge economic and environmental impact is the Stoat. The potential economic impacts of such anintroduction are outlined in the remainder of this section.
Potential Impact of StoatsStoats (Mustela erminea) are widely distributed in the northern hemisphere and have been introduced intoNew Zealand. Stoats are native to Great Britain but they come into conflict with man because they arepredators of both native and introduced game birds. Stoats inhabit a range of ecotypes governed by theavailability of prey. Murphy and King (2004) noted that stoats can be observed from beach to remotemountain country within New Zealand and in forest types including dune land, tussock, grassland and farmlands. The CLIMATE program was used to match the suitability of Australian rangelands with those wherestoats are found overseas. Background relating to the software program is provided in Pheloung (1996)
Darker dots represent the most favourable climate types within Australia for stoats. In the figure it is evidentthat southern Australia is most suitable for stoat development. Given that stoats originated in Great Britainit is not surprising that these areas are most favourable. In terms of climatic suitability, stoats could occupy
somewhere in the order of about30% of the Australian land mass.
The density of stoats variesaccording to agro-ecology andprimarily the availability of prey.Murphy and King (2004)summarised a range of stoatdensity studies conducted in NewZealand. Densities varied from 2-10 stoats per km2 but it wasnoted that densities are difficult todetermine as this analysis involveslabour-intensive live trapping,sample area definition and a rangeof assumptions regardingimmigration, emigration and catchability of different species. If thelower bound of density were to beobserved in Australia, the total
Figure 11: Climatic Suitability for Stoats (Courtesy BRS)
62
stoat population could be in the order of 4.2 million stoats at saturation of maximum range.
Stoats are opportunist predators. In Britain stoat diet consists principally of rabbits, small rodents and birds.In New Zealand stoats prey mainly on birds, rats (Rattus spp.), feral house mice (Mus musculus), rabbits andinvertebrates, but diet varies greatly according to the habitat they occupy. The average daily meat intake ofstoats and a percentage contribution of live birds to the stoat diet in Australia is provided in the table toestimate the off-take of Australian birds as a result of stoat introduction
Table 28: Summary of Stoat Biodiversity Impact Assumptions
Based on yearly averages, an adult male requires about 60 g of meat per day. If it is assumed that 2% of perday stoat feed intake is birds, then stoats could account for about 1840 tonnes per year of live bird predation.Converting this volume of off-take by an average bird weight of 50 g, stoats are estimated to account for 37 million bird fatalities per year. This number of birds is converted to a cost value by assuming each bid isvalued by the community at $1 and the total value of stoat-bird predation is $37 million per year
Table 29: Potential Annual Impact of Stoats
(a): Assumptions above
Assumptions and value Source
Potential range – 2.1 million km2 From climatic mapping using CLIMATE program(see Pheloung 1996)
Stoat density – 2 per km2 Derived from a range of studies in New Zealandcited in Murphy and King (2004). Basse et al.(1999) suggested the normal range of stoatdensities to be 2-10 km2 in New Zealand
Total Australian potential stoat population – 4.2million
Derived from density and range assumptions
Food requirement for stoat per day – 50-90 g meat/stoat/day or 22 kg/year
Captive stoats are maintained on this intake per day(Murphy and King 2004)
Live bird off-take by stoats per year – 1.84 million kg Assumes 2% of feed requirement met by live birds(Consultant estimate).
Number of birds equivalent – 37 million per year Assumes each native bird weighs somewherearound 50 g
Value of bird predation – $A 37 million per year Each bird valued at $1 – derived from Pimentel et al. (2000) method and studies in Chapter 1
Counting the Cost: Impact of Invasive Animals in Australia, 2004
Cost ComponentControl
$A millionLoss
$A millionTotal
$A million
Environmental Cost a - 37.00 37.00
Management Cost b 1.00 - 1.00
Research Cost c 1.00 - 1.00
SUB TOTAL 2.00 37.00 39.00

63
Conclusions
(b): Consultant estimate.(c): Consultant estimate
Vertebrate Pest Management ResearchA range of potential R&D directions are currently, and could in the future, be pursued to reduce theeconomic, social and environmental costs of major vertebrate pests in Australia. These areas are summarisedin the following table.
Table 30: Summary of Key Areas for Future Pest R&D
In the field of pest impact assessment, there are also a number of priorities. For example, this study wascommissioned to focus on 12 vertebrate species. There are a number of other species which cause impactand include (Bomford, personal communications):
� Pest birds – at least 70 native and nine exotic bird species cause agricultural damage or cause other problems such as damage to aquaculture and fisheries or posing a risk to aircraft (Bomford 1992, 2003, Bomford and Sinclair 2002).
� Rodents – The introduced black rat (Rattus rattus) and at least four native species are considered crop pests (Caughley et al. 1998). The introduced brown rat (R. norvegicus) is not usually considered a significant pest.
� Deer – six species of deer have established exotic populations (Wilson et al. 1992). So far they are only minor agricultural pests but their range and abundance is increasing (Moriaty pers. comm.). Deer are also susceptible to a range of livestock diseases.
� Finfish – ten introduced fish species are considered pests and at least 13 additional species have the potential to become future pests (Bomford and Hart 2002).
Area R&D Direction
Bait and Toxin Development (canids, pigs, feral cats,pest birds)
New toxins; bait formulation; effectiveness anddelivery
Biocontrol Biocides (rabbits, carp); anti-viral vaccines; fertilitycontrol (large herbivores, feral cats)
Virally Vectored Immuno-contraception product delivery; product safety; VVIC in rats;species-specificity
Ecological Solutions Interactions between predators and prey;interactions between habitat disturbance andpredation; density surveys; evaluating alternativemanagement strategies; evaluating the threat posedby exotic fish species; population dynamics analysis;adaptive management practices
Other Products Molecular genetic tools; attractants
Economic Assessments Biodiversity & social costs; commercial harvesting(kangaroos, camels); economics management
Detection and Prevention Response Strategies; Decision Analysis; diseasedetection; ethical issues of using GMOs to manageinvasive animals
64
To estimate the complete cost of vertebrate pests in Australia, impact assessment for each of these speciesneed to be conducted.
Setting Research PrioritiesThe mere existence of a large social, economic and/or environmental impact does not automatically meanresearch designed to alleviate the cost imposed by a particular species should be pursued. Research shouldbe assessed in the context of its propensity to reduce the burden of the pest and in terms of the size of theinvestment. Cost-benefit analysis is a process that compares the benefits against the costs of undertakingresearch and development projects and can be used to set priorities. The estimation of project benefits isthe most critical component of cost-benefit analysis.
The size of the pest impact needs to be considered, scope for the research product to reduce the pestimpact assessed, potential industry adoption estimated, and the probability of the project generatingtangible industry benefits assessed. Initially, the target segment of the industry relevant to the researchtechnology needs to be defined. Key factors in the production system relevant to the success of researchdelivery and adoption need to be determined using survey techniques, consultation with industryparticipants, historical data, and documentation of previous research successes. PAC CRC needs to considerusing this approach, on a portfolio basis, to set R&D priorities.
ReferencesBomford, M. (2003) Risk Assessment for the Import and Keeping of Exotic Vertebrates in Australia, Bureau ofRural Sciences, Canberra
Bomford, M. (1992) Bird pest impact and research in Australia: a survey and bibliography, Bureau of RuralResources Working Paper 18
Bomford, M. and Hart, Q. (2002). Non-indigenous vertebrates in Australia. Pp 25-44 in Pimental, D. (ed.)Biological Invasions: Environmental and Economic Costs of Alien Plant, Animal, and Microbe Invasions, CRCPress, New York
Bomford, M. and Sinclair, R. (2002) Australian Research on Bird Pests: Impact, Management and FutureDirections, Emu 102: 1-17
Caughley, J., Bomford, M., Parker, B., Sinclair, R., Griffiths, J. and Kelly, D. (1998). Managing Vertebrate Pests:Rodents. BRS, Canberra.
Murphy, E. and King, C. (2004) Draft Stoat Chapter for Handbook of NZ Mammals.
Pheloung, P.C. (1996) CLIMATE, a system to predict the distribution of an organism based on climatepreference. Ag, WA. Perth
Pimentel, D., Lach, L., Zuniga, R. and Morrison, D. (2000) Environmental and economic costs of non-indigenous species in the United States, Bioscience 50(1): 53
Counting the Cost: Impact of Invasive Animals in Australia, 2004
65
Appendix A: Gross Margins
A range of gross margin studies are used to estimate the economic impact of vertebrate pest species.Average per hectare or per head of livestock estimates are used to generate national economic costs.
Broad acre CropsThe gross margin for wheat and barley in NSW and Queensland are demonstrated in the following table. It is evident that fertiliser is the major production cost, while insecticides are not generally used. With theadoption of minimum production systems, herbicides have become a higher cost over the last 20 years.The profitability of production is largely driven by the yield and price received by farmers.
Table 31: Gross Margin Budgets for Wheat and Barley
Source: NSW Agriculture, 2003 and QDPI (2002)
NSW Dry-land Wheat
(long fallow)
NSWDry-land Wheat (short fallow)
QLDDry-land Wheat
QLDDry-land
Barley
Income ($/ha) 612.50 437.50 692.00 554.00
Farm price ($/t) 175.00 175.00 289.5 210.00
Yield (t/ha) @3.5 t/ha @2.5 t/ha @2.5 t/ha @2.8 t/ha
Cultivation ($/ha) 6.19 12.38 20.00 13.50
Sowing ($/ha) 56.77 56.77 24.04 30.58
Fertiliser ($/ha) 103.24 88.75 52.71 52.71
Herbicide ($/ha) 53.31 31.12 21.25 30.18
Insecticide ($/ha) 0.00 0.00 0.00 0.00
Harvesting ($/ha) 54.22 38.72 45.00 45.00
Levies ($/ha) 6.22 4.44 7.10 5.68
Insurance ($/ha) 12.56 8.97 0.00 0.00
Gross Margin($/ha)
320.00 196.36 522.00 382.00
APPENDICES – APPENDIX A: GROSS MARGINS
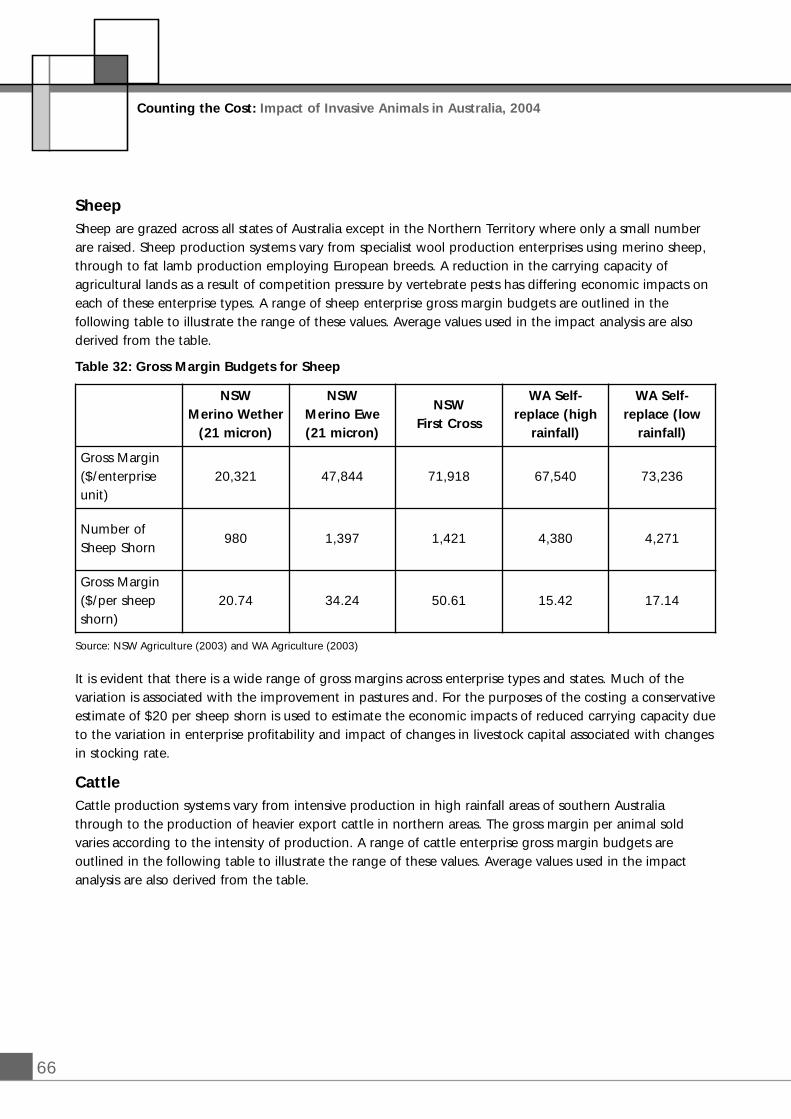
66
SheepSheep are grazed across all states of Australia except in the Northern Territory where only a small numberare raised. Sheep production systems vary from specialist wool production enterprises using merino sheep,through to fat lamb production employing European breeds. A reduction in the carrying capacity ofagricultural lands as a result of competition pressure by vertebrate pests has differing economic impacts oneach of these enterprise types. A range of sheep enterprise gross margin budgets are outlined in thefollowing table to illustrate the range of these values. Average values used in the impact analysis are alsoderived from the table.
Table 32: Gross Margin Budgets for Sheep
Source: NSW Agriculture (2003) and WA Agriculture (2003)
It is evident that there is a wide range of gross margins across enterprise types and states. Much of thevariation is associated with the improvement in pastures and. For the purposes of the costing a conservativeestimate of $20 per sheep shorn is used to estimate the economic impacts of reduced carrying capacity dueto the variation in enterprise profitability and impact of changes in livestock capital associated with changesin stocking rate.
CattleCattle production systems vary from intensive production in high rainfall areas of southern Australiathrough to the production of heavier export cattle in northern areas. The gross margin per animal soldvaries according to the intensity of production. A range of cattle enterprise gross margin budgets areoutlined in the following table to illustrate the range of these values. Average values used in the impactanalysis are also derived from the table.
NSW Merino Wether
(21 micron)
NSWMerino Ewe(21 micron)
NSWFirst Cross
WA Self-replace (high
rainfall)
WA Self-replace (low
rainfall)
Gross Margin($/enterpriseunit)
20,321 47,844 71,918 67,540 73,236
Number of Sheep Shorn
980 1,397 1,421 4,380 4,271
Gross Margin($/per sheepshorn)
20.74 34.24 50.61 15.42 17.14
Counting the Cost: Impact of Invasive Animals in Australia, 2004
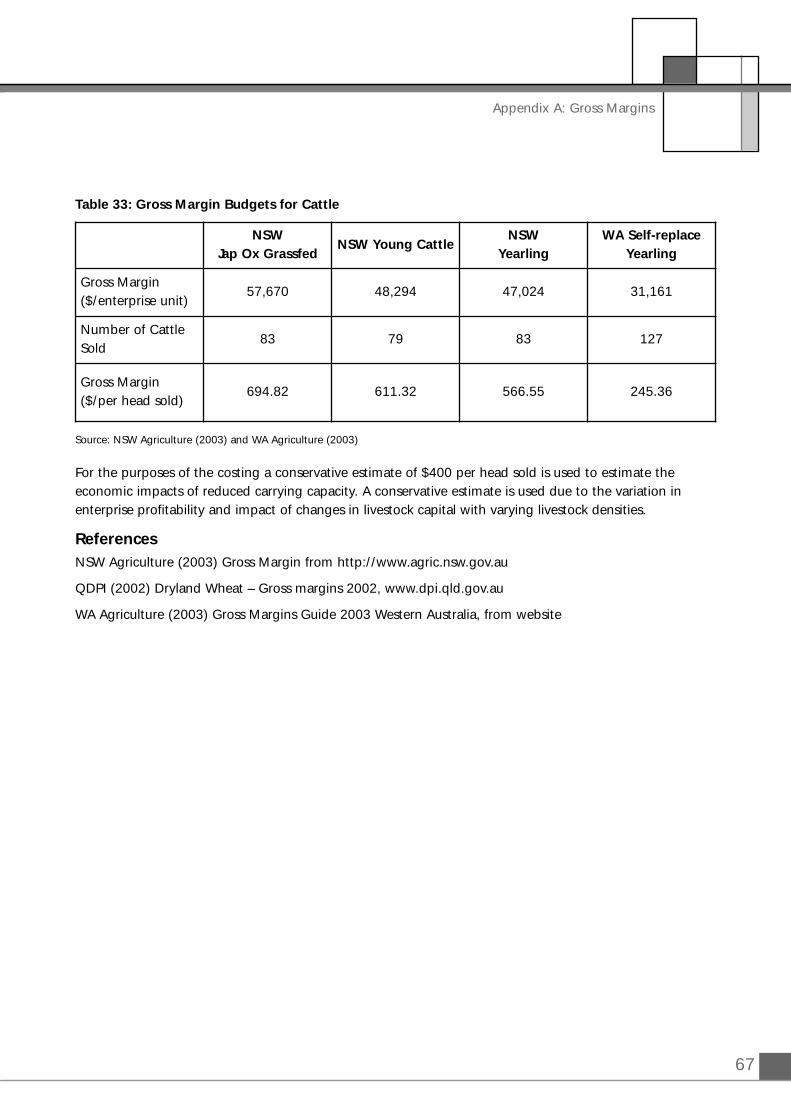
67
Appendix A: Gross Margins
Table 33: Gross Margin Budgets for Cattle
Source: NSW Agriculture (2003) and WA Agriculture (2003)
For the purposes of the costing a conservative estimate of $400 per head sold is used to estimate theeconomic impacts of reduced carrying capacity. A conservative estimate is used due to the variation inenterprise profitability and impact of changes in livestock capital with varying livestock densities.
ReferencesNSW Agriculture (2003) Gross Margin from http://www.agric.nsw.gov.au
QDPI (2002) Dryland Wheat – Gross margins 2002, www.dpi.qld.gov.au
WA Agriculture (2003) Gross Margins Guide 2003 Western Australia, from website
NSW Jap Ox Grassfed
NSW Young CattleNSW
Yearling WA Self-replace
Yearling
Gross Margin($/enterprise unit)
57,670 48,294 47,024 31,161
Number of CattleSold
83 79 83 127
Gross Margin($/per head sold)
694.82 611.32 566.55 245.36
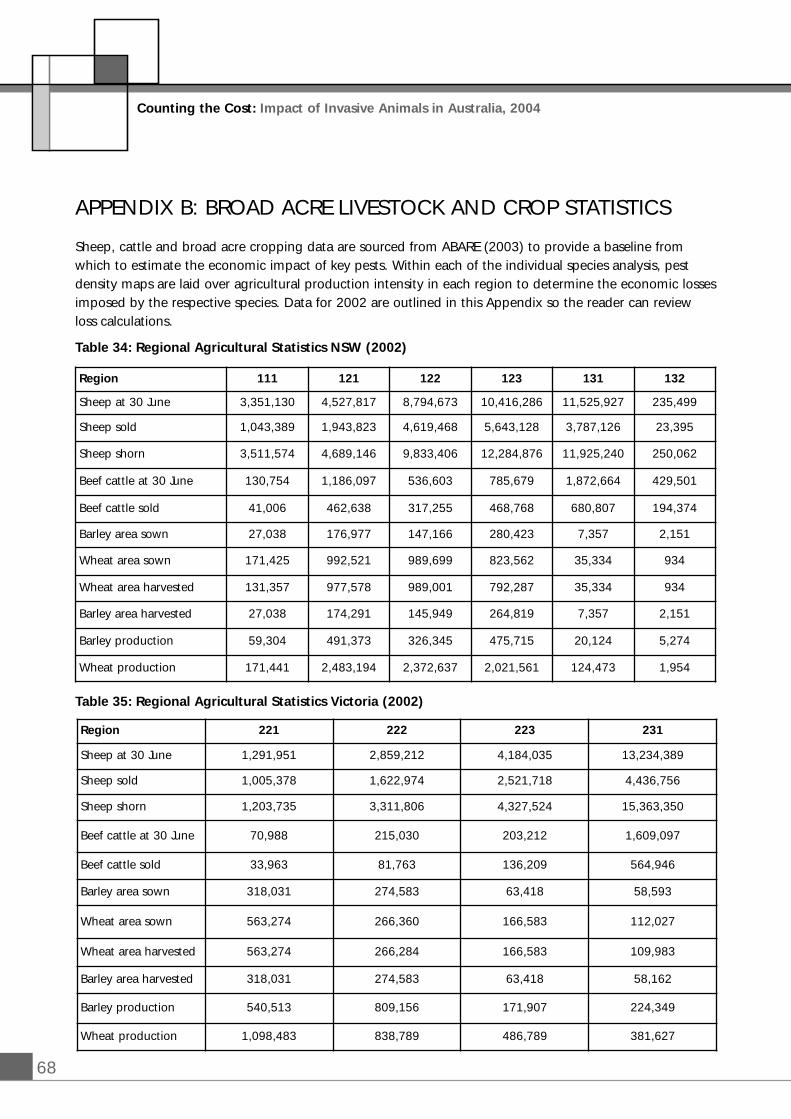
68
Counting the Cost: Impact of Invasive Animals in Australia, 2004
APPENDIX B: BROAD ACRE LIVESTOCK AND CROP STATISTICS
Sheep, cattle and broad acre cropping data are sourced from ABARE (2003) to provide a baseline fromwhich to estimate the economic impact of key pests. Within each of the individual species analysis, pestdensity maps are laid over agricultural production intensity in each region to determine the economic lossesimposed by the respective species. Data for 2002 are outlined in this Appendix so the reader can reviewloss calculations.
Table 34: Regional Agricultural Statistics NSW (2002)
Table 35: Regional Agricultural Statistics Victoria (2002)
Region 111 121 122 123 131 132
Sheep at 30 June 3,351,130 4,527,817 8,794,673 10,416,286 11,525,927 235,499
Sheep sold 1,043,389 1,943,823 4,619,468 5,643,128 3,787,126 23,395
Sheep shorn 3,511,574 4,689,146 9,833,406 12,284,876 11,925,240 250,062
Beef cattle at 30 June 130,754 1,186,097 536,603 785,679 1,872,664 429,501
Beef cattle sold 41,006 462,638 317,255 468,768 680,807 194,374
Barley area sown 27,038 176,977 147,166 280,423 7,357 2,151
Wheat area sown 171,425 992,521 989,699 823,562 35,334 934
Wheat area harvested 131,357 977,578 989,001 792,287 35,334 934
Barley area harvested 27,038 174,291 145,949 264,819 7,357 2,151
Barley production 59,304 491,373 326,345 475,715 20,124 5,274
Wheat production 171,441 2,483,194 2,372,637 2,021,561 124,473 1,954
Region 221 222 223 231
Sheep at 30 June 1,291,951 2,859,212 4,184,035 13,234,389
Sheep sold 1,005,378 1,622,974 2,521,718 4,436,756
Sheep shorn 1,203,735 3,311,806 4,327,524 15,363,350
Beef cattle at 30 June 70,988 215,030 203,212 1,609,097
Beef cattle sold 33,963 81,763 136,209 564,946
Barley area sown 318,031 274,583 63,418 58,593
Wheat area sown 563,274 266,360 166,583 112,027
Wheat area harvested 563,274 266,284 166,583 109,983
Barley area harvested 318,031 274,583 63,418 58,162
Barley production 540,513 809,156 171,907 224,349
Wheat production 1,098,483 838,789 486,789 381,627
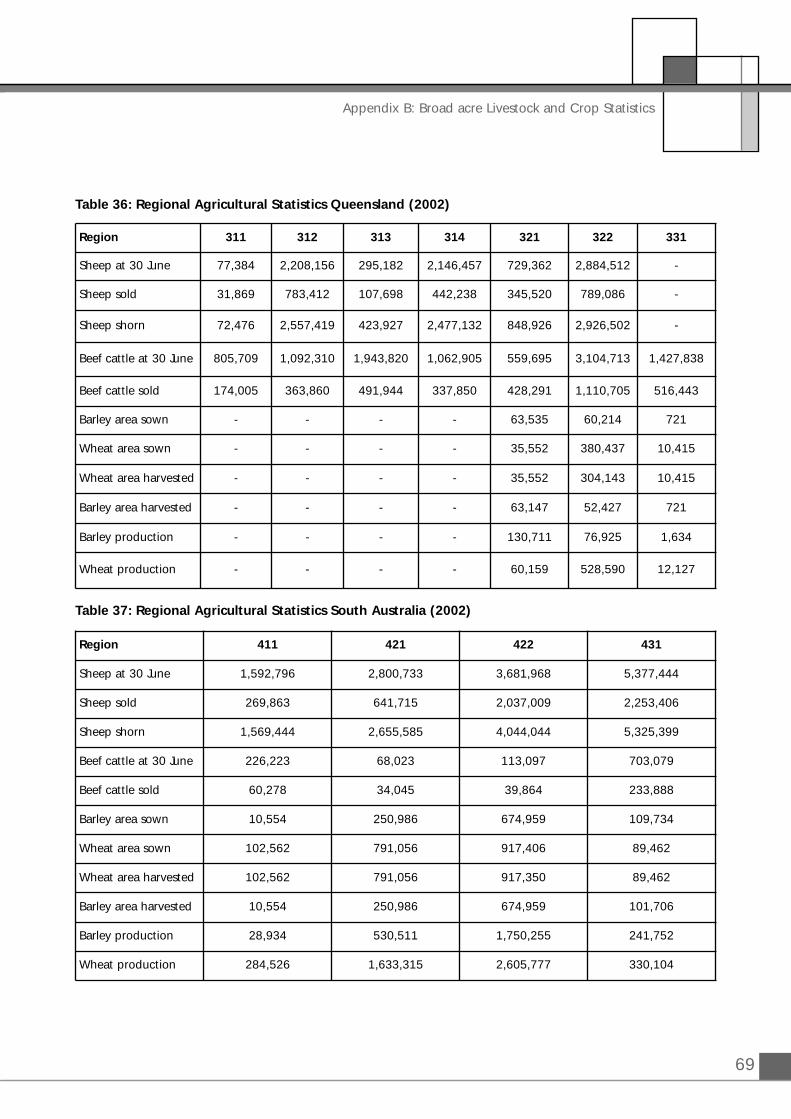
69
Appendix B: Broad acre Livestock and Crop Statistics
Table 36: Regional Agricultural Statistics Queensland (2002)
Table 37: Regional Agricultural Statistics South Australia (2002)
Region 311 312 313 314 321 322 331
Sheep at 30 June 77,384 2,208,156 295,182 2,146,457 729,362 2,884,512 -
Sheep sold 31,869 783,412 107,698 442,238 345,520 789,086 -
Sheep shorn 72,476 2,557,419 423,927 2,477,132 848,926 2,926,502 -
Beef cattle at 30 June 805,709 1,092,310 1,943,820 1,062,905 559,695 3,104,713 1,427,838
Beef cattle sold 174,005 363,860 491,944 337,850 428,291 1,110,705 516,443
Barley area sown - - - - 63,535 60,214 721
Wheat area sown - - - - 35,552 380,437 10,415
Wheat area harvested - - - - 35,552 304,143 10,415
Barley area harvested - - - - 63,147 52,427 721
Barley production - - - - 130,711 76,925 1,634
Wheat production - - - - 60,159 528,590 12,127
Region 411 421 422 431
Sheep at 30 June 1,592,796 2,800,733 3,681,968 5,377,444
Sheep sold 269,863 641,715 2,037,009 2,253,406
Sheep shorn 1,569,444 2,655,585 4,044,044 5,325,399
Beef cattle at 30 June 226,223 68,023 113,097 703,079
Beef cattle sold 60,278 34,045 39,864 233,888
Barley area sown 10,554 250,986 674,959 109,734
Wheat area sown 102,562 791,056 917,406 89,462
Wheat area harvested 102,562 791,056 917,350 89,462
Barley area harvested 10,554 250,986 674,959 101,706
Barley production 28,934 530,511 1,750,255 241,752
Wheat production 284,526 1,633,315 2,605,777 330,104
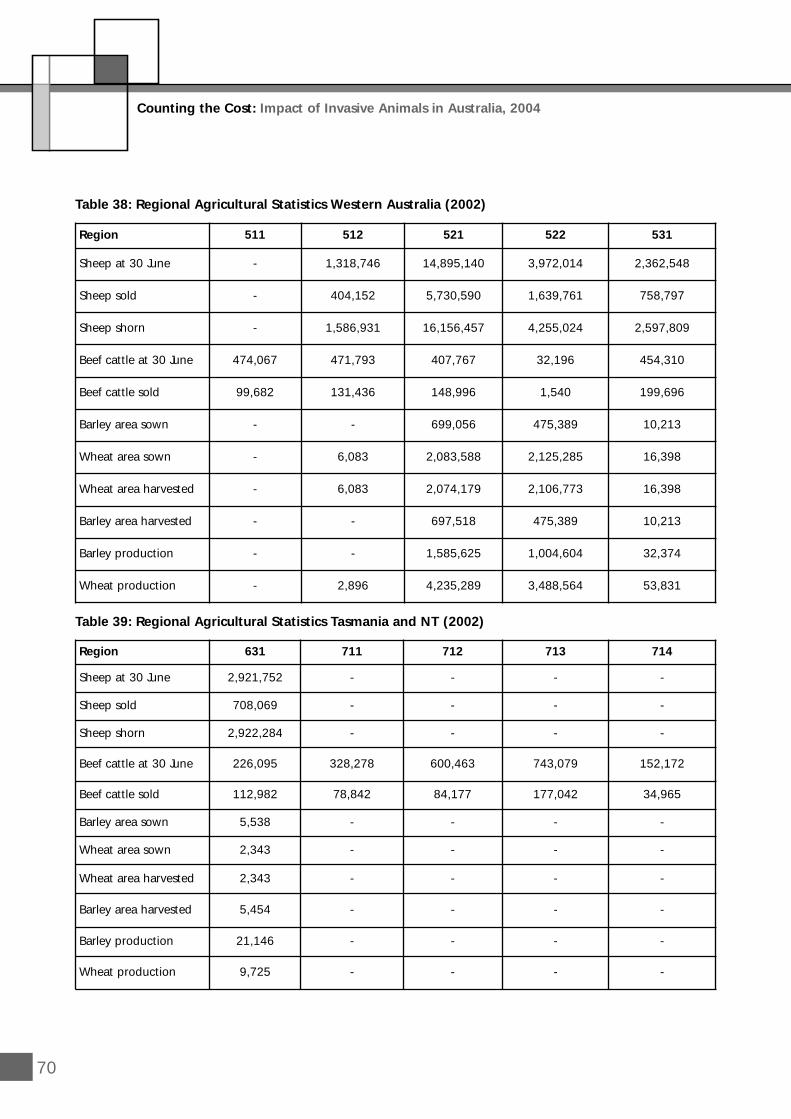
70
Table 38: Regional Agricultural Statistics Western Australia (2002)
Table 39: Regional Agricultural Statistics Tasmania and NT (2002)
Region 511 512 521 522 531
Sheep at 30 June - 1,318,746 14,895,140 3,972,014 2,362,548
Sheep sold - 404,152 5,730,590 1,639,761 758,797
Sheep shorn - 1,586,931 16,156,457 4,255,024 2,597,809
Beef cattle at 30 June 474,067 471,793 407,767 32,196 454,310
Beef cattle sold 99,682 131,436 148,996 1,540 199,696
Barley area sown - - 699,056 475,389 10,213
Wheat area sown - 6,083 2,083,588 2,125,285 16,398
Wheat area harvested - 6,083 2,074,179 2,106,773 16,398
Barley area harvested - - 697,518 475,389 10,213
Barley production - - 1,585,625 1,004,604 32,374
Wheat production - 2,896 4,235,289 3,488,564 53,831
Counting the Cost: Impact of Invasive Animals in Australia, 2004
Region 631 711 712 713 714
Sheep at 30 June 2,921,752 - - - -
Sheep sold 708,069 - - - -
Sheep shorn 2,922,284 - - - -
Beef cattle at 30 June 226,095 328,278 600,463 743,079 152,172
Beef cattle sold 112,982 78,842 84,177 177,042 34,965
Barley area sown 5,538 - - - -
Wheat area sown 2,343 - - - -
Wheat area harvested 2,343 - - - -
Barley area harvested 5,454 - - - -
Barley production 21,146 - - - -
Wheat production 9,725 - - - -
Counting the Cost: Impact ofInvasive Animals in Australia, 2004
Author – Ross McLeodEditor – Andrew Norris
Pest Animal Control Cooperative Research Centrec/ – CSIRO Sustainable EcosystemsBarton Highway Crace Canberra ACT AustraliaGPO Box 284 Canberra ACT 2601 AustraliaPhone: + 61 2 6242 1768Fax: + 61 2 6242 1511Email: office@pest animal.crc.org.auWeb: www pestanimal.crc.org.au
Co
un
ting
the C
ost: Im
pact of In
vasive An
imals in
Australia, 2004