counting bequest expectancies? -...
TRANSCRIPT

Counting Bequest Expectancies?
…Make Sure You Count on This…
Jeff Comfort
Scott Lumpkin

Where Are We Going
• Counting Guidelines in Retrospect
• A Historical Perspective: 2005-2015
• What About the Future?
• Counting Planned Gifts…Ten Years Later…and More…

The Counting Guidelines in Retrospect
• Overview - Reporting Fundraising Results
• CASE Reporting Standards (1st ed, 1979)
• Growth of Planned Giving Programs & Emergence of NCPG (1990’s)
• NCPG Planned Gift Valuation Standards (2004)
• NCPG Gift Counting Guidelines (2005)
• CASE Revised Reporting Stds (4th ed, 2009)

PPP’s Guidelines for Counting and Reporting Charitable Gifts
• Report gifts using three categories1. Outright
2. Future revocable
3. Future irrevocable
• Key Principles– Clarity, Transparency, Consistency, Accountability
– Count and report clearly all gifts and commitments
– Acknowledge the donor’s perspective
– Assist charities with setting fundraising goals & promoting gift opportunities

What Shaped the Counting Guidelines?
• Perspectives– Historic emphasis on cash gifts– Changing role of counting standards beyond
benchmarking– Pressure to increase fundraising results– Growing success of planned giving
• Issues– Are all gifts equal?– Counting, Accounting, Reporting & Recognition– Setting Fundraising Goals– Being Donor Centered

A Historical Perspective: 2005-2015
• PPP Counting Guidelines (1st ed., 2005)
• PPP Counting Guidelines (2nd ed., 2006)
• Revised CASE Reporting Standards (2009)
–A Word About: 1996, 2003

The Bottom Line
• Counting Revocable Gifts Is a Widely Accepted Development Practice
• Its NOT About Slapping Numbers on the Books
• It IS About Maximizing Total Philanthropy

Results and Impact of the Counting Guidelines
• Greater clarity and transparency with reporting planned gifts
• Greater recognition of the role and impact of planned giving
• Expanded donor conversations
• Increased fundraising goals and results
• Increased recognition of planned gift donors

What Are the Counted Parts in Bottom Line Gift Planning Productivity?
1. Estate Distributions from Deceased Donors
2. Irrevocable Life Income Gifts
3. Bequest Commitments
4. Outright Gifts,
– Most Typically Complex Assets

Gift Planning Productivity:the bottom line
• Estate Distributions from Deceased Donors
–Historically: The Mainstay for Gift Planning Programs
–Nationally Have Represented 70% to 90% of Bottom Line Gift Planning Productivity

Gift Planning Productivity:the bottom line
• Irrevocable Life Income Gifts
– Historically: With Some Exceptions, Generally Represent 10% to 20% of Bottom Line Gift Planning Productivity
– Life Income Gifts May Have the Same Impact as Counting Bequest Expectancies
– Some Life Income Gifts Are In Lieu of a Bequest; Some Are Not…
– For Clarity, Let’s Set These Aside for this Presentation

Gift Planning Productivity:the Bottom Line
• Bequest Commitments
• What EXACTLY Are We Talking About?
• Closed, Counted Bequest Commitments

Case Studies: Counting Planned Gifts in Two University Campaigns
• Oregon State University
–Campaign for OSU (2005-2014)
–Bequest Commitments counted at face value for donors age 70 and above by the end of the campaign
– Life income gifts counted at face value
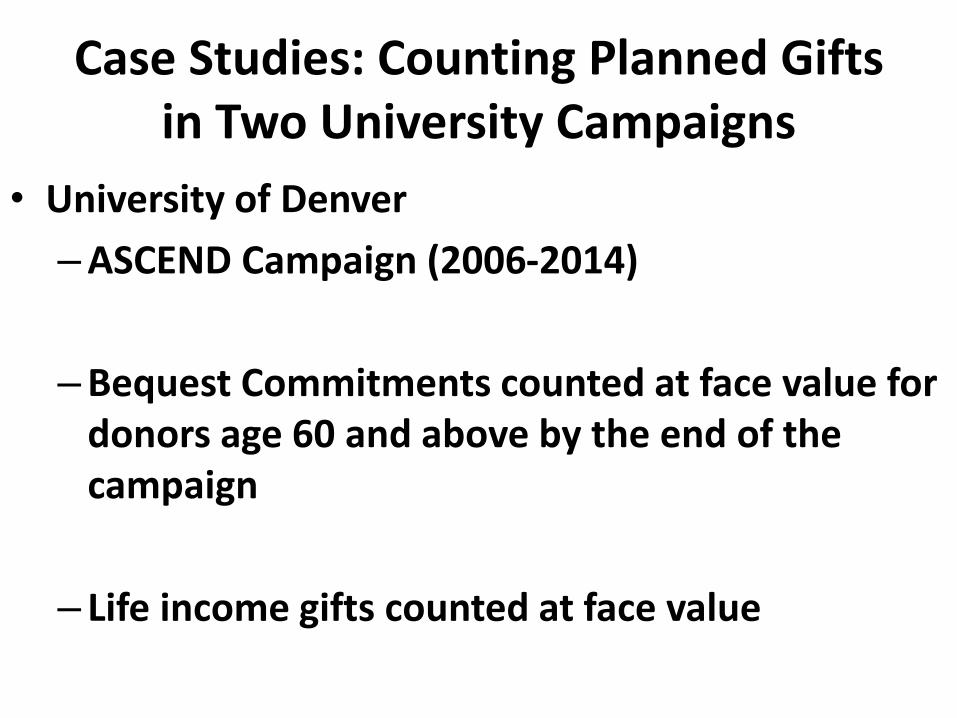
Case Studies: Counting Planned Gifts in Two University Campaigns
• University of Denver
–ASCEND Campaign (2006-2014)
–Bequest Commitments counted at face value for donors age 60 and above by the end of the campaign
– Life income gifts counted at face value

Case Study: Oregon State University
Campaign for OSU (2005-2014)
–Total Gifts & Commitments: $1.19 Billion
–Total Bequest Commitments: $123 million (10%)
–Total Bequest Commitment Donors: ~250
–Total Actual Realized Estate Distributions:
$103 million (8.5%)

Case Study: University of Denver
• ASCEND Campaign (2006-2014)
–Total Gifts & Commitments: $488 million
–Total Bequest Commitments: $112 million (25%)
–Total Bequest Commitment Donors: 288
–Total Actual Realized Estate Distributions:
~$40 million (~8%)

What Have We Learned?
• Counting planned gifts promotes conversations about planned gifts, which increases fundraising results
• It gives donors more options for achieving philanthropic objectives
• It gives major gift officers new tools
• It promotes collaboration between planned & major gift efforts

Transformational Results
• Donor-centered philanthropy
• More effective & meaningful gifts
• Fundraising efforts become more comprehensive
• Institutional views of fundraising become less short-sighted
• New opportunities for encouraging philanthropy
Expectations Realized
• More donors
• More dollars
• More planned gifts
• More meaningful gifts
• Greater donor satisfaction
• Increased attention on gift planning
• Diversified fundraising efforts

Unintended Consequences
• Enabling fundraisers to go for the easier gift
• Reducing donor motivation to make outright gifts
• Confusion about when the impact of planned gifts will be felt
• Conflating current and future gifts

OSU Estate Distributions
0
5
10
15
20
25
2004 2005 2006 2007 2008 2009 2010 2011 2012 2013 2014 2015
Tota
l In
com
e f
rom
Re
aliz
ed
Be
qu
est
sIn
Mill
ion
s $
Income from Realized Bequests during the Campaign
Total Amount of Realized Bequests
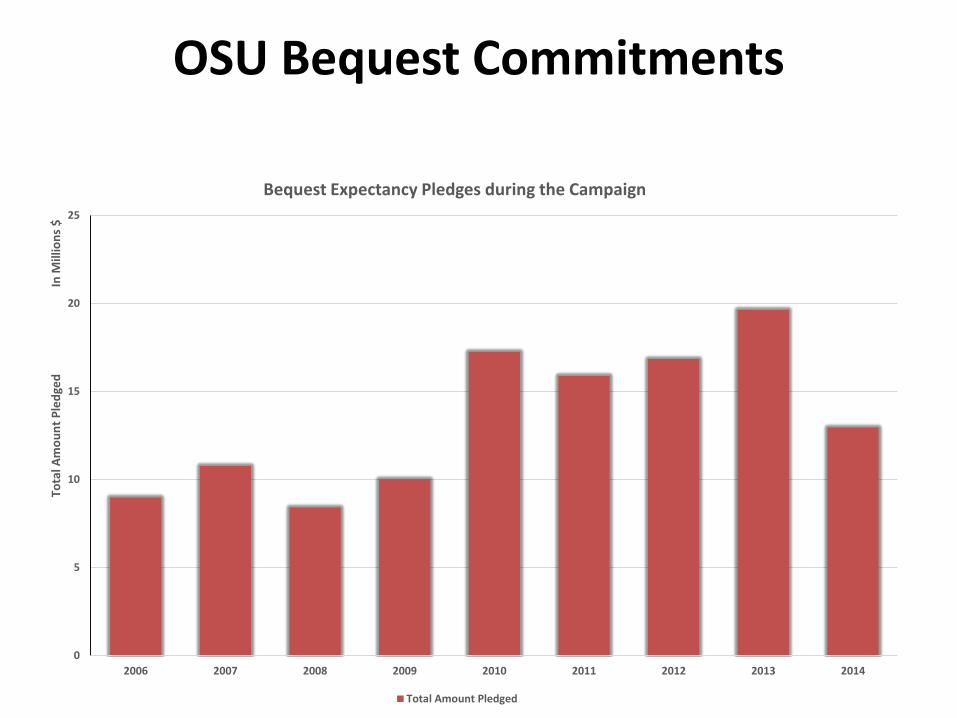
OSU Bequest Commitments
0
5
10
15
20
25
2006 2007 2008 2009 2010 2011 2012 2013 2014
Tota
l Am
ou
nt
Ple
dge
dIn
Mill
ion
s $
Bequest Expectancy Pledges during the Campaign
Total Amount Pledged

Estate Distributions from Campaign Commitments
0
1
2
3
4
5
6
7
8
9
2007 2008 2009 2010 2011 2012 2013 2014 2015
Tota
l In
com
e f
rom
Ple
dge
Pay
me
nts
In M
illio
ns
$
Income from Bequest Excpectancy Pledge Payments during the Campaign
Total Payments Amount

Estate Distributions AND Estate Distributions from Campaign
Commitments
0
5
10
15
20
25
2004 2005 2006 2007 2008 2009 2010 2011 2012 2013 2014 2015
Tota
l Co
mb
ine
d In
com
e (
BEP
an
d R
B)
In M
illio
ns
$
Combined Income: Bequest Pledge Payments + Realized Bequests
Total Combined Amount of Payments

Gift Planning Productivity:the bottom line
• Counting Bequest Expectancies?…Make Sure You Count on This
• No DOUBLE Counting
• Bequest receipts that fulfill bequest expectancies

Estate Distributions AND Estate Distributions from Campaign
Commitments
0
5
10
15
20
25
2004 2005 2006 2007 2008 2009 2010 2011 2012 2013 2014 2015
Tota
l Co
mb
ine
d In
com
e (
BEP
an
d R
B):
Bar
Dat
a
In M
illio
ns
$
Combined Income: Bequest Pledge Payments + Realized Bequests (Separated)
Total Amount of Realized Bequests Total Payments Amount
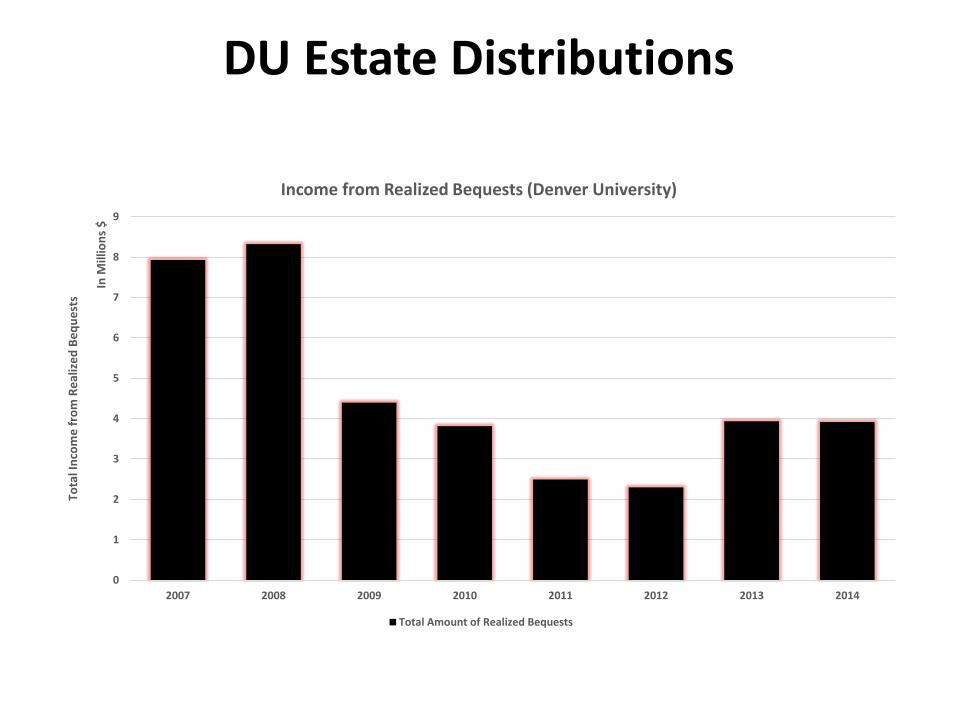
DU Estate Distributions
0
1
2
3
4
5
6
7
8
9
2007 2008 2009 2010 2011 2012 2013 2014
Tota
l In
com
e f
rom
Re
aliz
ed
Be
qu
est
s
In M
illio
ns
$
Income from Realized Bequests (Denver University)
Total Amount of Realized Bequests

DU Bequest Commitments
0
10
20
30
40
50
60
70
80
0
5
10
15
20
25
2007 2008 2009 2010 2011 2012 2013 2014
# o
f P
led
ges
Tota
l Am
ou
nt
Ple
dge
d
In M
illio
ns
$
Bequest Expectancy Pledges (Denver University)
Total Amount Pledged # of pledges

Estate Distributions from Campaign Commitments
0
4
8
12
16
20
0
1
2
3
4
5
6
7
8
2007 2008 2009 2010 2011 2012 2013 2014
# o
f P
led
ge P
aym
en
ts
Tota
l In
com
e f
rom
Ple
dge
Pay
me
nts
In M
illio
ns
$
Income from Bequest Excpectancy Pledge Payments (Denver University)
Total Payments Amount # of Pledge Payments

Estate Distributions AND Estate Distributions from Campaign
Commitments
0
10
20
30
40
50
60
70
80
0
2
4
6
8
10
12
2007 2008 2009 2010 2011 2012 2013 2014
Co
mb
ine
d n
um
be
r o
f P
aym
en
ts (
BEP
an
d R
B)
Tota
l Co
mb
ine
d In
com
e (
BEP
an
d R
B)
In M
illio
ns
$
Combined Income: Bequest Pledge Payments + Realized Bequests (Denver University)
Total Combined Amount of Payments Combined number of Payments

Gift Planning Productivity:the bottom line
• Counting Bequest Expectancies?…Make Sure You Count on This
• No DOUBLE Counting
• Bequest receipts that fulfill bequest expectancies

Estate Distributions AND Estate Distributions from Campaign
Commitments
0
20
40
60
80
100
120
0
2
4
6
8
10
12
14
16
18
20
2007 2008 2009 2010 2011 2012 2013 2014
Co
mb
ine
d n
um
be
r o
f P
aym
en
ts (
BEP
an
d R
B):
Lin
e D
ata
Tota
l Co
mb
ine
d In
com
e (
BEP
an
d R
B):
Bar
Dat
a In M
illio
ns
$
Combined Income: Bequest Pledge Payments + Realized Bequests (Separated) for Denver University
Total Amount of Realized Bequests Total Payments Amount # of Realized Bequests # of Pledge Payments

Gift Planning Productivity:the bottom line
• 10 year graph of bequest receipts AND a 3mm beq int in year 8
0
1
2
3
4
5
6
7
8
2006 2007 2008 2009 2010 2011 2012 2013 2014 2015
In M
illio
ns
$
Closing Conceptual Slide
Added Planned Bequests Realized Bequests Only

Case Study: Oregon State University
Campaign for OSU (2005-2014)
–Total Gifts & Commitments: $1.19 Billion
–Total Bequest Commitments: $123 million (10%)
–Total Bequest Commitment Donors: ~250
–Total Actual Realized Estate Distributions:
$103 million (8.5%)

Case Study: University of Denver
• ASCEND Campaign (2006-2014)
–Total Gifts & Commitments: $488 million
–Total Bequest Commitments: $112 million (25%)
–Total Bequest Commitment Donors: 288
–Total Actual Realized Estate Distributions:
~$40 million (~8%)

What About the Future?
• What does this mean for you… counting bequests and for what leadership needs to understand about counting bequests.
• The “See-Saw” Effect

Years 1 to 3

DU Bequest Commitments
0
10
20
30
40
50
60
70
80
0
5
10
15
20
25
2007 2008 2009 2010 2011 2012 2013 2014
# o
f P
led
ges
Tota
l Am
ou
nt
Ple
dge
d
In M
illio
ns
$
Bequest Expectancy Pledges (Denver University)
Total Amount Pledged # of pledges

DU: Year 1
11 $1 Million+ Bequest Commitments
2007 $1,000,000.00
2007 $2,040,000.00
2007 $3,500,000.00
2007 $1,073,500.00
2007 $3,000,000.00
2007 $3,000,000.00
2007 $2,000,000.00
2007 $1,500,000.00
2007 $1,450,000.00
2007 $1,450,000.00
2007 $1,000,000.00

DU: Year 4
1 $1 Million+ Bequest Commitments
0
10
20
30
40
50
60
70
80
0
5
10
15
20
25
2007 2008 2009 2010 2011 2012 2013 2014
# o
f P
led
ges
Tota
l Am
ou
nt
Ple
dge
d
In M
illio
ns
$
Bequest Expectancy Pledges (Denver University)
Total Amount Pledged # of pledges

MGO GPO Collaboration
0
10
20
30
40
50
60
70
80
0
5
10
15
20
25
2007 2008 2009 2010 2011 2012 2013 2014
# o
f P
led
ges
Tota
l Am
ou
nt
Ple
dge
d
In M
illio
ns
$
Bequest Expectancy Pledges (Denver University)
Total Amount Pledged # of pledges

See If This Sounds Familiar…
• Mike, a 50 year old alumnus, makes and estate commitment of $4 million…

Does This Sound Familiar…
• Impact of Different Counting Polices:
–Age 60 and Older
• Life Expectancy: 20+ Years
–Age 70 and Older
• Life Expectancy 10+ Years

Prospect Flow for Bequest Commitments
• Impact of Different Counting Polices:
–Age 60 or Older in the Life of The Campaign
• Fishing in a Pond
Prospect Flow for Bequest Commitments
• Impact of Different Counting Polices:
– Age 60 or Older in the Year of the Commitment
• Fishing in a Stream
Takeaways
• What Does This Mean?
• How Should We Communicate This?
• To Whom Should We Communicate This?

Takeaways
• What Does This Mean?
– Know Where You Are in “The Counting Cycle”
• Beginning: Choose Your Policies Wisely– Age
– By When
– Project Counted Gifts
• Intermediate– Headwinds and Tailwinds
• Mature

Takeaways
• How Should We Communicate This?
– Data
– Often
• To Whom Should We Communicate This?

Takeaways
• To Whom Should We Communicate This?
– Your Boss
– VP
– CFO
– MGO’s
– Faculty
– Board