counting and imaging bacteria on mineral surfaces …jenrob/4/files/cmsworkshopch2.pdf · bennett...
TRANSCRIPT

Philip C. Bennett, Annette Summers Engel, and Jennifer A. Roberts (2006) Counting and imaging bacteria on mineral surfaces: In Methods of Investigating Microbial-Mineral Interactions, CMS Workshop Lectures, Vol. 14, J. Patricia A. Maurice and Lesley A. Warren eds., The Clay Mineral Society, Chantilly, VA, 37-78.
COUNTING AND IMAGING BACTERIA ON MINERAL SURFACES
PHILIP C. BENNETT, ANNETTE SUMMERS ENGEL, AND JENNIFER A. ROBERTS
INTRODUCTION 38
SAMPLE COLLECTION AND PRESERVATION 39
Sterile Technique 39 Aerobic vs. Anaerobic Samples 40 In Situ Microcosms 42 Sample Preservation 43
BIOMASS DETERMINATION 45
Direct Counting 45 Procedure 1: DAPI Cell Count: Sandy Sediment 46 Rock MPN 47 SEM Surface Counts 48 Quantitative FISH 48 Procedure 2: Sample Collection and Preservation for FISH 50 Procedure 3: Slide Preparation and Cell Fixation for FISH 50 Procedure 4: Hybridization 51 Procedure 5: Post-hybridization 52 Procedure 6: Examination and Quantification 53 Chemical Biomass 53 Procedure 7: Lipid Phosphate Extraction and Measurement 54
CONVENTIONAL SCANNING ELECTRON MICROSCOPY 54
Sample Preparation 54 Procedure 8: Chemical Critical Point Drying 59 Artifacts 59
ENVIRONMENTAL SCANNING ELECTRON MICROSCOPY 61
Sample Preparation 61 Imaging 63 Pros and Cons 65
CASE STUDY: LOWER KANE CAVE 66 REFERENCES 73
Bennett et al.
38
COUNTING AND IMAGING BACTERIA ON MINERAL SURFACES
PHILIP C. BENNETT1, ANNETTE SUMMERS ENGEL2, AND JENNIFER A. ROBERTS3
1The University of Texas Dept of Geological Sciences 1 University Station, C1100
Austin, TX 78712
2Louisiana State University Dept of Geology and Geophysics
Baton Rouge, LA 70803
3University of Kansas Dept of Geology
1475 Jayhawk Blvd, 120 Lindley Hall Lawrence, KS 66045-7613
INTRODUCTION
The scientific literature is replete with reported observations of bacteria on rocks, in rocks, around rocks, precipitating rocks, and dissolving rocks in both ancient and modern systems, and this is an active and growing area of research. Many of these studies rely on scanning electron microscopy (SEM) to image mineral surfaces and to show a link between the presence of microorganisms and a particular geochemical process such as weathering or mineral precipitation. The ability of a researcher to show this link, however, will be governed by the quality and interpretation of the image, and the recognition of imaging artifacts and the shortcomings of using SEM as a sole method of investigation.
The purpose of this chapter is to provide basic guidelines and procedures for collecting, preserving and processing mineral samples for SEM imaging, and the use of biomass determination and fluorescence in situ hybridization (FISH) analysis of microorganisms attached to rocks to augment SEM image analysis. This is not a review of the existing literature, rather it is a report of the methods that we have found useful in characterizing microbes on rocks. For basic SEM technique, general texts are available (e.g. Goldstein et al., 1992). We have similarly not included a discussion of transmission electron microscopy (TEM) methods, which is another tool that can be used to examine microbe-mineral interactions at very high magnification.

Imaging bacteria on minerals
39
SAMPLE COLLECTION AND PRESERVATION
One of the most important questions to ask when collecting samples with the intent to demonstrate an interaction between microbes and minerals is… “What question am I asking”? The techniques used, starting with sample collection and ending with image publication are dictated by what research question is being asked. For example, SEM imaging of mineral surfaces is relatively insensitive to the use of sterile technique; the assumption is that the number of contaminating organisms is small compared to the native populations. The preservation and preparation method, however, is critical and minor missteps can result in a ruined sample and an erroneous interpretation. For an excellent review of sample preparation methods for scanning electron microscopy see Chapters 11 and 12 in Goldstein et al. (1992).
Sterile Technique
There is always a question about the use of sterile technique in field sampling. Using sterile technique sounds right, and seems like the right thing to do, but to be strictly sterile in the field is difficult and often of questionable usefulness. When is it necessary?
1. Samples collected for culturing: Here even the most trivial contact with a non-sterile instrument can result in positive cultures, particularly with the Most Probable Number methods (described below). Positive culturing results could be from skin flora, while the native organisms of interest remain uncultivable due to competitive stresses induced by fast-growing, highly competitive contaminating organisms.
2. Samples collected for molecular purposes: Depending on the abundance of the contaminating organisms compared to the native population, environmental DNA amplification using the polymerase chain reaction (PCR) could result in a relatively high, but false, abundance of contaminating DNA and contribute to misinterpretation of the actual community composition.
When could it be considered optional?
1. Samples collected for SEM examination: As long as the sample is preserved immediately (e.g. glutaraldehyde or freezing) with no opportunity for growth it is unlikely that contaminating organisms would be observable in an image.
2. Fluorescence in situ hybridization (FISH): The FISH technique is used to visualize selected microorganisms using genetic probes, and it is effective for those organisms at greater than ~103 - 105 cells per volume (e.g., per ml) Low abundance of contaminating organisms might be hybridized, but would be almost invisible against probe-targeted and fluorescing native organisms.

Bennett et al.
40
3. Biomass determination: Unless the sample is grossly contaminated or almost sterile to start with, the native biomass will be significantly greater than the contaminants, again assuming no opportunity for growth. Casual contact with non-sterile collection instruments will not present a significant source of measurable biomass.
However, no matter what the ultimate goal is for a particular sample that is collected, it is always a good idea to use basic sterile instruments and technique, particularly where it is consistent with best practice for other types of sampling. We use fresh gloves for each sample, but generally not sterile gloves. Sterile containers are always used for sample storage, e.g. Whirl-Pak bags or Falcon tubes, and these containers are cheap and convenient. For large sample volumes, cleaned and autoclave-sterilized Mason-style jars are acceptable even for long-term storage.
Aerobic vs. Anaerobic Samples
A microbial habitat can be grossly characterized as either oxygenated or not, resulting in the presence, absence, or inactivity of either aerobic or anaerobic microorganisms. Dry surface soils and many shallow aquifers are aerobic or oxygen restricted (microaerophilic), while fluid-saturated soils and organic-rich aquifers can be anaerobic (Chapelle, 2001; Ehrlich, 1996). This gross division in microbial habitat is an important consideration for sample collection. Aerobic Samples. Collecting samples from aerobic environments is easy, as long as the other important habitat conditions are maintained. For both imaging and culturing, it is important to maintain appropriate physicochemical conditions until final preservation and preparation, especially when imaging bacteria on minerals, or minerals on bacteria. Maintaining aerobic conditions is important for aerobic samples, and can be difficult if the sample is organic rich. Tightly sealing a sample container can quickly result in an anaerobic sample, as the respiring aerobic community quickly consumes the oxygen. The formally dormant and probably less abundant anaerobes rapidly grow and alter the community composition in the sample container. Moisture content, light level, salinity, and temperature are also potentially important parameters that can influence the viability, and even the shape, of both the imaged organism and the associated mineral phases. Anaerobic Samples. Maintaining anaerobic conditions is not just important for later culturing or biomass determination but also for SEM imaging. An anaerobic microbe exposed to oxygen will be stressed similar to one exposed to a non-ideal temperature, salinity, or moisture content. The sample chemistry can also change, as dissolved ferrous iron is easily oxidized and will precipitate ferrihydrite or similar solid phases that will obscure surface detail.
Oxygen contamination of an anaerobic sample is not a disaster, and

Imaging bacteria on minerals
41
depending on the nature of the planned analysis, it may be unimportant. Contaminating oxygen is rapidly consumed by facultative and obligate aerobes, usually present but previously inactive, as they metabolize reduced carbon, iron, and sulfur compounds. As long as the sample is sealed in a container that represents an effective barrier to oxygen diffusion, the sample usually returns to anaerobic conditions. The microbial community and the geochemical signature, however, will change, sometimes significantly.
Samples collected under anaerobic conditions must be maintained
under those conditions during transport. For some samples, this could be as easy as closing the lid on the jar, but for other samples the process is much more involved, particularly if methanogens (which are especially sensitive to contaminating oxygen) are the organisms of interest. For sectioned core segments, where there is usually sufficient organic material to ensure rapid consumption of contaminating oxygen, and it is generally sufficient to seal the ends of the core with tape, wrap the core segment in a thick freezer-style plastic bag, and seal the bag with additional tape. For loose material like sand, mason-style jars are effective, especially with a secondary container such as a plastic bag.
For material with low carbon abundance, or if methanogens are the target organism, an anaerobic jar is the method of choice (Willis, 1991). These manufactured containers (e.g., GasPak Jar Systems) are extremely airtight. Once the chamber is loaded with samples, a separately purchased reaction kit (e.g., GasPak Anaerobic System disposable H2 + CO2 generator envelope) is put inside the jars and the catalysts will react with contaminating oxygen to quickly bring the chamber back to anaerobic conditions. A word of caution: the gas generating envelopes contain a material considered hazardous (water reactive and producing H2) and in the prereacted state it is illegal to transport on a commercial passenger aircraft (US-DOT). Therefore, either have the gas generating envelopes shipped to the sampling location, or locate an alternative source of hydrogen gas to charge the chamber
While sampling aquifer sediments in Egypt we were confronted with the problem of not having the gas generating envelopes (it was nearly impossible to ship the envelopes through customs). Yet, we still needed to get H2 gas for our anaerobic chamber (for the targeted organisms) but were unable to find a cylinder of H2 with an appropriate regulator to bleed gas into the chamber. Our Egyptian host at Tanta University, however, had a unique solution to the problem. He placed a small beaker of hydrochloric acid in the chamber and added a few pieces of metallic zinc, which when combined reacts vigorously and evolves H2 gas. We allowed that to react for a few minutes, filling the chamber with H2, and then removed the beaker and sealed the lid. The chamber was absolutely anaerobic, and legal, for the trip home. Another even simpler technique is to burn a small candle in the sampling container (e.g., Mason jar) to scavenge oxygen; when the candle goes out, the container has a

Bennett et al.
42
much lower oxygen partial pressure.
In Situ Microcosms
In situ microcosms are a means to investigate microbial colonization of surfaces and associated mineral alteration under field conditions. This technique is similar to the standard buried slide technique used by microbiologists to sample native soil microbial populations using glass slides inserted into the soil (Parkinson et al., 1971). Others have used this technique to study mineral weathering in soils. For example, Nugent et al. (1998) used microcosms in acidic soil to examine weathering rates of feldspars.
The in situ microcosm experiments used in our studies were designed to target the planktonic fraction of a groundwater microbial community (Bennett et al., 1996; Hiebert and Bennett, 1992; Rogers and Bennett, 2004; Rogers et al., 1998). We have employed two different designs depending on the goal of the experiments. The first design consists of sterile polyethylene containers that are punctured to permit flow-through of water and suspended material, such as colloids and bacteria; we put fractured rock or glass chips (ranging in grain size from ~1 mm to 2 cm in diameter) in the containers to allow floating cells to attach to different exposed surfaces. Colonization and weathering features on the chips can be imaged using SEM, and chips can also be used to identify and quantify attached microbial communities (e.g., by FISH). In the second microcosm design, we use polished thin sections of rocks or minerals (Figure 1). This design eliminates surface roughness or microtopography as cell attachment variables, and the samples can be easily imaged using SEM, FISH, microprobe, and/or light microscopy. This allows for an investigator to more easily look for relationships between mineralogy, elemental composition, and microbial attachment.
Sterility is always a major concern in constructing these microcosms and a combination of several sterilization methods can be used during preparation. Heat-sterilization by autoclaving is the most commonly used method for general sterilization, and we autoclave stainless steel or plastic holders at 121°C with 1.1 kg/cm2 pressure for 20 minutes. Microcosms that are heat sensitive (PVC) should be cold sterilized using a disinfectant (e.g., bleach or soap followed by ethanol) to wash off and to kill surface-adhering cells. Any of the microcosms that are used should be thoroughly washed with soap and distilled water (DI-H2O), then soaked in ethanol, bleach, or hydrogen peroxide for at least 1 hour. Rocks and minerals should not be autoclaved because of the possibility that steam heating may dissolve a mineral phase or result in surface alteration. To sterilize mineral chips and thin sections, the material should be washed thoroughly with DI-H2O and sonicated at low power 3 x 30 seconds to remove fines and also adhering organisms or spores. The solution should be decanted and replaced with fresh DI-H2O between sonications. The minerals can then be dry sterilized (most autoclaves can be run dry without water added) at 125°C for at least 6 hours to kill any remaining organisms, or soaked in ethanol.

Imaging bacteria on minerals
43
Sterile minerals or sections and holders should be constructed in the lab, wrapped in sterile aluminum foil, and autoclaved before transport to the field.
Figure 1. : In situ microcosm lander
Once the microcosms are assembled, a 100 lb tuna-line can be used to suspend the microcosms into groundwater wells or surface water. Water samples should be collected at the time of emplacement and retrieval to bracket bulk solution geochemical conditions.
Sample Preservation
Probably the most important step, and the step with the greatest potential for producing surface artifact, happens immediately after the sample is collected, when the sample is preserved for later analysis or imaging. There are many ways of preserving earth materials for imaging microorganisms, ranging from doing nothing to the sample to putting the sample through complex chemical procedures. Each preservation step offers the possibility of better images, but there is a risk of either losing biomass or introducing artifacts. The choice of preservation method must be carefully matched to the planned analytical or imaging technique. Freezing: Freezing is the simplest, although not always the most convenient, method of preserving biomass and the biogeochemical status of the sample. Samples collected in split-spoon cores or loose samples in Falcon tubes can be quickly frozen in the field in a bath of dry ice and isopropanol, and kept on dry

Bennett et al.
44
ice for shipping (dry ice is not generally allowed on commercial passenger flights). Larger samples require more imagination to freeze… for one project we froze 6-foot cores at a local meat packer. For longer projects it may be cost-effective to simply purchase a small chest-freezer for the sample processing, and then give it to your motel at the end of the project.
Freezing is not a universal preservative method, however. It is excellent for preserving sample chemistry, particularly nutrients, and it will effectively halt most microbial activity. It is an acceptable method for preservation before performing phospholipid fatty acid (PLFA) profiling or for total lipid phosphate or carbon biomass estimates, although it can result in a loss of lipid phosphate compared to field extractions (Federle and White, 1983). It is acceptable for microscopy analysis with the nucleic acid stains DAPI or Acridine Orange, and for DNA extraction if the sample is frozen in a 50-100% glycerol solution. Freezing is not acceptable for any culture-based analysis, as it will damage cells. For imaging by SEM, freezing may also alter cellular surfaces when the sample thaws. Samples examined by low-vacuum cryo-stage methods, or prepared for conventional-SEM (C-SEM) by freeze-drying, should be frozen immediately in the field, as long as there is no possibility of the sample ever thawing. Chemical Preservatives: Chemical preservatives add a level of complexity to the preservation protocol, but offer distinct advantages for some procedures, and are required for some methods such as FISH. For SEM chemical preservatives will keep biological tissue in relatively pristine shape, but there is a risk of losing loosely attached microorganisms during rinse steps.
Glutaraldehyde is a commonly used preservative for biological tissues, and it is used in preparation for a wide variety of imaging procedures (Goldstein et al., 1992). Glutaraldehyde is an alkylating agent, killing organisms and producing a much tougher cell that will resist lysis for extended time periods. Glutaraldehyde is available as a 50% stock solution and can be mixed with DI-H2O to make a commonly used working solution of 2 - 2.5%. It can also be used to prepare a buffered solution to maintain pH and osmotic conditions.
Paraformaldehyde is an alkylating agent similar to glutaraldehyde, but more effective as a preservative. Using it will result in excellent cell preservation for DAPI point counts, and paraformaldehyde is used exclusively for preserving samples for FISH (described below). To remain effective, paraformaldehyde must be prepared fresh for each use, or kept frozen until use; it is difficult to prepare in the field because the stock material is flammable and it is not legal to carry paraformaldehyde solution on a commercial passenger aircraft, although it can be shipped by ground. Paraformaldehyde is typically used as a 3-8% solution; for FISH, 4% is used (refer to Recipes 1 and 2). Recipe 1: 3x PBS Solutions.
1. In a 1 liter volumetric flask with ~500 ml DI-H2O.

Imaging bacteria on minerals
45
2. Add 390 mM NaCl (22.776 g); mix to dissolve. 3. Add 1.008 g NaH2PO4 and 3.65g Na2HPO4; 4. Mix to dissolve. Dilute to 1 liter with DI-H2O and adjust to pH
7.2 with NaOH or HCl as needed. 5. Sterilize in an autoclave or by filtration (cold-sterilized).
Use reagent grade or HPLC grade salts. A 1x solution can be prepared using 1/3 the mass of salts, or by diluting the 3x solution with DI-H2O.
Recipe 2: Buffered 4% Paraformaldehyde Solution.
1) Heat 33 ml of DI-H2O in a 150 ml Erlenmeyer flask to 60-65 °C. 2) Add 2g of paraformaldehyde and stir until dissolved. Do not
overheat. 3) Add one drop of 10N NaOH until paraformaldehyde dissolves
completely. 4) Add 16.5 ml of 3x PBS buffer. 5) Cool solution on ice to 20oC and adjust pH to 7.2-7.4. 6) Filter through a 0.45-µm filter. 7) Store at -20 oC. When thawed, use immediately.
BIOMASS DETERMINATION
Direct Counting
Standard direct counting involves three general steps: 1) quantitative removal and suspension of cells from the sediment surface; 2) staining or hybridizing individual cells with a fluorescent dye or probe to distinguish the cells from inorganic material; 3) imaging of a representative field of cells for counting. An alternative is to count the cells on the original surface, but this is more difficult and subject to error. There are many methods published for this approach, and several different probes with fluorescent dyes are available to highlight different types of cells (Fredrickson and Balkwill, 1998; Litchfield and Seyfried, 1979). DAPI Counts: Direct counts of organisms in laboratory microcosms can be done using the fluorescent stain 4’,6-diamido-2-phenylindole (DAPI). DAPI binds specifically with double-stranded DNA, particularly A-T complexes, probably in the minor groove of the double helix. Once DAPI binds to DNA, the fluorescence increases, and cells fluoresce bright blue under UV against an opaque background (Balkwill et al., 1988; Gough and Stahl, 2003; Griebler et al., 2001).
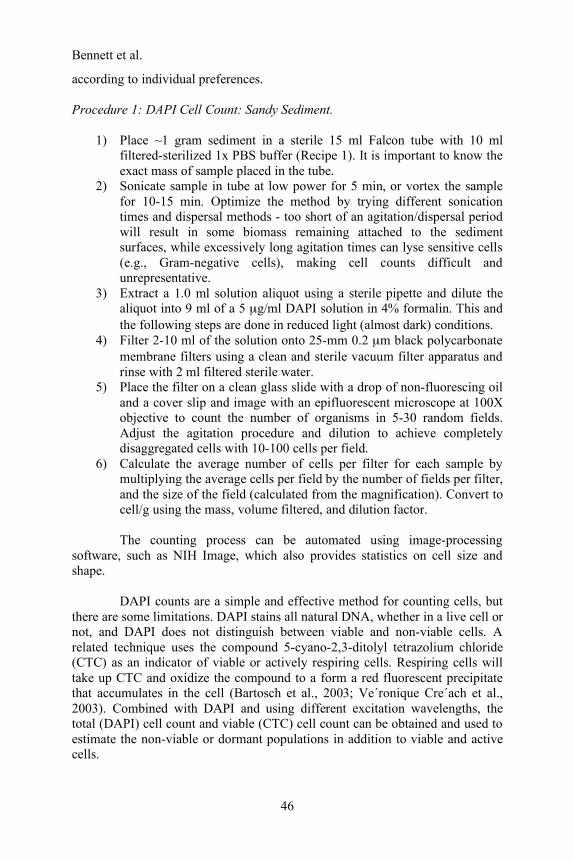
Procedure 1 is a simple method for estimating biomass on coarse sediments by DAPI point counting. Typically, aquifer sands and gravels have low biomass compared to fine-grained material, and little dilution is required. Sterile technique is important. Volumes and concentrations can be adjusted
Bennett et al.
46
according to individual preferences. Procedure 1: DAPI Cell Count: Sandy Sediment.
1) Place ~1 gram sediment in a sterile 15 ml Falcon tube with 10 ml filtered-sterilized 1x PBS buffer (Recipe 1). It is important to know the exact mass of sample placed in the tube.
2) Sonicate sample in tube at low power for 5 min, or vortex the sample for 10-15 min. Optimize the method by trying different sonication times and dispersal methods - too short of an agitation/dispersal period will result in some biomass remaining attached to the sediment surfaces, while excessively long agitation times can lyse sensitive cells (e.g., Gram-negative cells), making cell counts difficult and unrepresentative.
3) Extract a 1.0 ml solution aliquot using a sterile pipette and dilute the aliquot into 9 ml of a 5 µg/ml DAPI solution in 4% formalin. This and the following steps are done in reduced light (almost dark) conditions.
4) Filter 2-10 ml of the solution onto 25-mm 0.2 µm black polycarbonate membrane filters using a clean and sterile vacuum filter apparatus and rinse with 2 ml filtered sterile water.
5) Place the filter on a clean glass slide with a drop of non-fluorescing oil and a cover slip and image with an epifluorescent microscope at 100X objective to count the number of organisms in 5-30 random fields. Adjust the agitation procedure and dilution to achieve completely disaggregated cells with 10-100 cells per field.
6) Calculate the average number of cells per filter for each sample by multiplying the average cells per field by the number of fields per filter, and the size of the field (calculated from the magnification). Convert to cell/g using the mass, volume filtered, and dilution factor.
The counting process can be automated using image-processing
software, such as NIH Image, which also provides statistics on cell size and shape.
DAPI counts are a simple and effective method for counting cells, but
there are some limitations. DAPI stains all natural DNA, whether in a live cell or not, and DAPI does not distinguish between viable and non-viable cells. A related technique uses the compound 5-cyano-2,3-ditolyl tetrazolium chloride (CTC) as an indicator of viable or actively respiring cells. Respiring cells will take up CTC and oxidize the compound to a form a red fluorescent precipitate that accumulates in the cell (Bartosch et al., 2003; Ve´ronique Cre´ach et al., 2003). Combined with DAPI and using different excitation wavelengths, the total (DAPI) cell count and viable (CTC) cell count can be obtained and used to estimate the non-viable or dormant populations in addition to viable and active cells.

Imaging bacteria on minerals
47
Rock MPN
Sediment samples and in situ microcosm experiments can be coupled with the Most Probable Number (MPN) determination (Bekins et al., 1999a; Bekins et al., 2002; Bekins et al., 1999b; Benner et al., 2000; Stichburg et al., 1999; Umar et al., 2001) to quantify biomass adhered to mineral or rock surfaces and to differentiate physiologic types of cells on those surfaces. The MPN method for solids starts with the removal of biomass from the surface followed by serial dilution into type-specific media until no evidence of growth is detected (dilution to zero organisms). This can be done as either aerobic liquid media, or anaerobic preparations using pre-reduced and sterilized (PRAS) preparation methods and media, and while it is a culture-dependent method, it offers a very sensitive method to characterize the abundance of specific metabolic guilds (Holdeman et al., 1977). Different containers are used for MPN estimates; for anaerobic cultures we typically use 20 or 60 ml glass serum bottles (Wheaton) with butyl rubber caps and aluminum seals. MPN estimates are also done with glass test tubes, for example to quantify aerobic heterotrophs or sulfur-oxidizing bacteria. To facilitate dislodging the cells from mineral surfaces, 10 mg/l Tween80, a nonionic surfactant, can be added to the media. A note: some organisms metabolize Tween80 and this may influence growth of specific populations.
The general MPN method involves the transfer of a known mass of
solids (sediment or mineral chips), typically 1 gram, into 10 ml of type (physiologic)-specific media with Tween80 (10mg/l). Biomass is dislodged from the solids by a vortex mixer or general vigorous agitation (manual shaking or using a wrist-action shaker). One ml of this media-solid-cell suspension is then withdrawn using a sterile syringe and injected or transferred into the next serum bottle or test tube, respectively, in the series containing 9.0 ml of the same media (i.e. a 1:10 dilution), followed by additional agitation. This is repeated typically over ten 10-fold dilutions, in either 4 or 5 replicate series, to produce one or more bottles in which the sample is diluted to the point where there are no viable organisms. The resulting replicate dilution series is then evaluated to produce a starting abundance of that type of organism. For anaerobic material, samples can be processed using either the argon-purged roll tube technique (Holdeman et al., 1977) or an anaerobic glove bag, and aseptic technique is used throughout the procedure.
After serial dilution and cell growth, the bottles are scored for positive growth using a scoring method appropriate for the metabolic guild, media formulation and length of incubation. For some guilds, such as facultative heterotrophic aerobes, turbidity compared to the clear sterile medium distinguishes positive and negative growth, respectively. For some guilds, the evolution of gas is used to score positive growth; for example, methane gas production over background is measured from MPN bottles using gas chromatography to score positive growth of methanogens. The mineral solids in the initial bottle should be removed, dried, and weighed, and if possible the
Bennett et al.
48
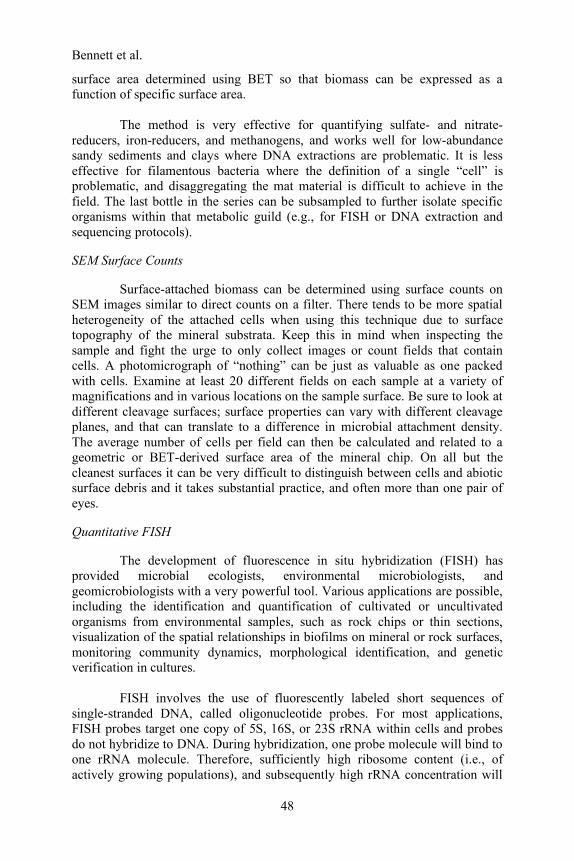
surface area determined using BET so that biomass can be expressed as a function of specific surface area.
The method is very effective for quantifying sulfate- and nitrate-reducers, iron-reducers, and methanogens, and works well for low-abundance sandy sediments and clays where DNA extractions are problematic. It is less effective for filamentous bacteria where the definition of a single “cell” is problematic, and disaggregating the mat material is difficult to achieve in the field. The last bottle in the series can be subsampled to further isolate specific organisms within that metabolic guild (e.g., for FISH or DNA extraction and sequencing protocols).
SEM Surface Counts
Surface-attached biomass can be determined using surface counts on SEM images similar to direct counts on a filter. There tends to be more spatial heterogeneity of the attached cells when using this technique due to surface topography of the mineral substrata. Keep this in mind when inspecting the sample and fight the urge to only collect images or count fields that contain cells. A photomicrograph of “nothing” can be just as valuable as one packed with cells. Examine at least 20 different fields on each sample at a variety of magnifications and in various locations on the sample surface. Be sure to look at different cleavage surfaces; surface properties can vary with different cleavage planes, and that can translate to a difference in microbial attachment density. The average number of cells per field can then be calculated and related to a geometric or BET-derived surface area of the mineral chip. On all but the cleanest surfaces it can be very difficult to distinguish between cells and abiotic surface debris and it takes substantial practice, and often more than one pair of eyes.
Quantitative FISH
The development of fluorescence in situ hybridization (FISH) has provided microbial ecologists, environmental microbiologists, and geomicrobiologists with a very powerful tool. Various applications are possible, including the identification and quantification of cultivated or uncultivated organisms from environmental samples, such as rock chips or thin sections, visualization of the spatial relationships in biofilms on mineral or rock surfaces, monitoring community dynamics, morphological identification, and genetic verification in cultures.
FISH involves the use of fluorescently labeled short sequences of single-stranded DNA, called oligonucleotide probes. For most applications, FISH probes target one copy of 5S, 16S, or 23S rRNA within cells and probes do not hybridize to DNA. During hybridization, one probe molecule will bind to one rRNA molecule. Therefore, sufficiently high ribosome content (i.e., of actively growing populations), and subsequently high rRNA concentration will

Imaging bacteria on minerals
49
yield a strong fluorescent signal detectable with FISH. rRNA probes target a range of taxonomic classifications, from the kingdom level to species or strain level. Probes are typically purchased from companies that produce the oligonucleotide sequences with fluorescent dyes to order, which will have known concentrations of the genetic sequence and appropriate fluorescent label. Web resources for probe information, including design and evaluation, can be found at the Ribosomal Database Project (http://rdp.cme.msu.edu/html/), GenBank (http://www.ncbi.nlm.nih.gov/Genbank/index.html), or the ARB Ribosomal Database (http://www.arb-home.de/).
As with any microbiological technique, the effectiveness of FISH can be compromised by many factors, including physiological cell status, rRNA molecule structure, phylogenetic affiliation, systematic differences in ecosystem type, methodological variations, and sample geochemistry (Bouvier and del Giorgio, 2003). If cells in a community are metabolically inactive or quiescent, there will be decreased rRNA. Cellular rRNA content can vary during growth, and this should also be considered if there are observed variations in cells detected by FISH with the same probes. During probe design, knowledge of the rRNA molecule structure is important because some parts of the molecule may not be optimal for probe hybridization. Depending on the phylogenetic affiliation of microbes, some groups may have detection thresholds or there can also be difficulty promoting probes to penetrate tough cell walls, such as in the case for Gram positive cells or some Archaea. This problem can be overcome by pretreating samples with a buffer of lysozyme and EDTA or increasing the percentage of SDS in the hybridization buffer. Sample geochemistry, such as redox sensitivity, can also compromise visualization and sample preparation steps, such as adding metal-complexing agents (e.g., EDTA) to the sample prior to dehydration, are required. In mineral-rich samples, background autofluorescence can be high; a high abundance of pigmented cells, such as cyanobacteria, can also cause confusion due to pigment autofluorescence.
Earlier studies using FISH encountered some difficulties in enumerating microbial groups within mixed assemblages, specifically in aquatic habitats, and one of the biggest obstacles presently is the effectiveness of detecting targeted cells. However, important advances to the optimization of probe binding through stringency experiments (i.e., probe saturation concentrations, optimization of washing conditions, buffer concentrations, hybridization temperatures, etc.), better fluorescent dyes, quality instrumentation (e.g., confocal laser scanning microscopy or flow cytometry), and quantification protocols have made FISH one of the most reliable techniques to enumerate microbes in aquatic samples or attached to solid surfaces. Using confocal laser scanning microscopy (CLSM) with semi-automated digital image analysis, quantification of fluorescently labeled cells without time-consuming direct counts can be done. Several computer programs are available that measure the areas of stained cells in randomly acquired CLSM images (sections) and that also differentiates between labeled cells and unlabeled (black) background. The

Bennett et al.
50
difficulty in this biovolume quantification comes with small single cells whose shape and size are similar to auto-fluorescing background particles.
Result reproducibility can vary according to which of the various protocols are used, as there is no standardized protocol in the published literature. We provide here the procedures that we have found to be effective and reproducible, including the solution recipes and hybridization temperatures, which we keep constant from sample preparation to sample preparation. Concentrations of any of the components in the following recipes can be adjusted to suite the needs of the researcher. However, in many cases, changing the concentration of one compound will result in needing to adjust the concentration of another. Also, hybridization temperatures may also be varied, but it will be necessary to adjust solution concentrations. Procedure 2: Sample Collection and Preservation for FISH.
1) Wash sample pellets (produced through centrifugation) with 1x PBS buffer (Recipe 2). Mix well to resuspend, then centrifuge, and remove supernatant. Resuspend in equal volume with fresh 1x PBS buffer before preservation. If using mineral chips, cells should be washed from the in situ microcosms and cell suspensions are used. If mineral or rock thin sections are used, each slide should be rinsed gently with 1x PBS buffer prior to fixation with paraformaldehyde (Manz et al., 1992) or ice-cold ethanol (Roller et al., 1994).
2) To general samples, add 3 volumes 4% paraformaldehyde solution (Recipe 1) to 1 volume of sample for 3 hr at 4oC (1-24 hr depending on the sample and biomass density).
3) For cell suspensions, spin cells down to pellet sample (5 min) and remove supernatant. Wash pellet in DI-H2O or 1x PBS; pellet again, and remove supernatant. Resuspend in fresh 1x PBS buffer and 1 volume 95% ethanol; store -20oC. If slides are used, rinse slide carefully with 1x PBS buffer or DI-H2O to remove residual paraformaldehyde. Slides can be stored in 1x PBS with 95% ethanol and stored on ice for a short time. However, long term storage may wash cells off of surfaces, and therefore slides should be rinsed with 95% ethanol and dried prior to long term storage at -20oC.
4) For Gram positive populations, wash cell suspension pellets with 1x PBS buffer, pellet, resuspend with equal volume 1x PBS, and add equal volume 95% ice-cold ethanol only.
Procedure 3: Slide Preparation and Cell Fixation for FISH.
1) For cell suspensions, attach approximately 5 - 10 µl preserved cell suspension to Teflon-coated non-fluorescence slides or gelatin-coated slides with 10-20 mm diameter sample wells. To determine if a good

Imaging bacteria on minerals
51
quantity of cells are used in environmental samples, a 10-fold serial dilution should be done initially.
2) Air dry slides from several hours to overnight at 37oC to ensure that cells are attached to slide.
3) Dehydrate attached cells in a sequential wash series using 50, 80, and 100% (v/v) ethanol for 3 min each. Slides are placed in the ethanol such that the all surfaces are covered; care should be taken not to wash cells off of the surfaces. Air dry slides.
4) If using thin sections, air dry these sections slides, and proceed through the ethanol washes, then air dry.
Procedure 4: Hybridization.
1) After preservation, FISH involves two main steps: hybridization and post-hybridization washing. For 2.0 ml master mix of hybridization solution, combine 360µl 5 M NaCl, 40 µl 1 M Tris/HCl (pH 8.0), and 2 µl 10% [wt/vol] SDS, and sufficient formamide (CAS# 75-12-7) for the each of the probes of interest (e.g., for 2.0 ml hybridization mix, µl formamide = 20 x % desired, e.g. a 45% formamide solution requires 900 µl). Add enough DI-H2O to make 2.0 ml. Formamide is used to help soften RNA structure and the amount of formamide to be added varies and is specific for each probe that is used. Each percentage of formamide decreases the melting temperature of a probe by 0.4 oC, enabling hybridization to occur at lower temperatures while keeping probes specific. Optimal formamide concentrations should be determined each time a new probe is designed and employed.
2) Prepare a hybridization chamber for each slide. Chambers are used to maintain moisture, and should seal well; chambers can be constructed with anything from Tupperware containers to 50 ml screw-top centrifuge tubes. A piece of absorbent paper (e.g., toilet paper) is also used in the chamber to hold the hybridization buffer (see later steps).
3) Make a master mix of the hybridization solution and probes to be applied for the number of samples to be analyzed. Apply 8 µl of hybridization buffer and 1 µl of 30 ng/µl probe per slide well. Apply probes by either a) mixing with hybridization buffer master mix or b) directly applying to the appropriate wells with hybridization solution. If using multiple probes with varying formamide stringency, use similar probes with the same formamide requirements on the same slide. If using thin sections with larger surfaces (compared to glass slides), multiply the amount of hybridization solution and probes to be applied appropriately.
4) Pour remaining hybridization buffer onto absorbent paper folded and placed in the hybridization chamber. Only one sample slide should be used per chamber. Place slide on top of soaked paper. Seal chamber.
5) Incubate chamber and sample slide at 46oC in incubator oven for exactly 90 min. The incubation temperature can vary, but the

Bennett et al.
52
appropriate formamide concentration, amount of SDS, and other solution components should be adjusted. If more than one slide is being prepared, it is imperative to keep all conditions, such as the hybridization and washing (see below) temperatures, constant.
6) During hybridization, prepare washing buffer in a 50 ml centrifuge tube by combining 1.0 ml 1M Tris/HCl (pH 8) and 50 µl 10% SDS, and adding volumes of 5 M NaCl and 0.5 M EDTA (pH 8) according to the % formamide in the hybridization solution (Table 1). Preheat to 48oC. This temperature can vary, as well, but the concentrations of each of the components should also be adjusted accordingly.
Procedure 5: Post-hybridization.
1) Remove hybridization chamber from 46oC drying oven. 2) In fume hood, wash slide quickly with pre-warmed (48oC) washing
buffer by dipping it several times into the tube. Be careful not to wash sample off slide.
3) Insert slide into the washing buffer (can insert two slides back-to-back if the formamide concentrations for the probes are equal).
4) Place in 48 oC water bath for 10-15 min. If quantification is desired, use the same washing time (e.g., 10 min) for all slides.
5) Remove slide(s) and place in clean beaker of ice cold DI-H2O water to wash remaining formamide and probes off of the surfaces. Move slide(s) a couple of times gently up and down in the beaker, but be careful not to loose samples.
6) Gently but quickly air dry by pressure. Keep in the dark. Sample should not remain wet.
Imaging bacteria on minerals
53
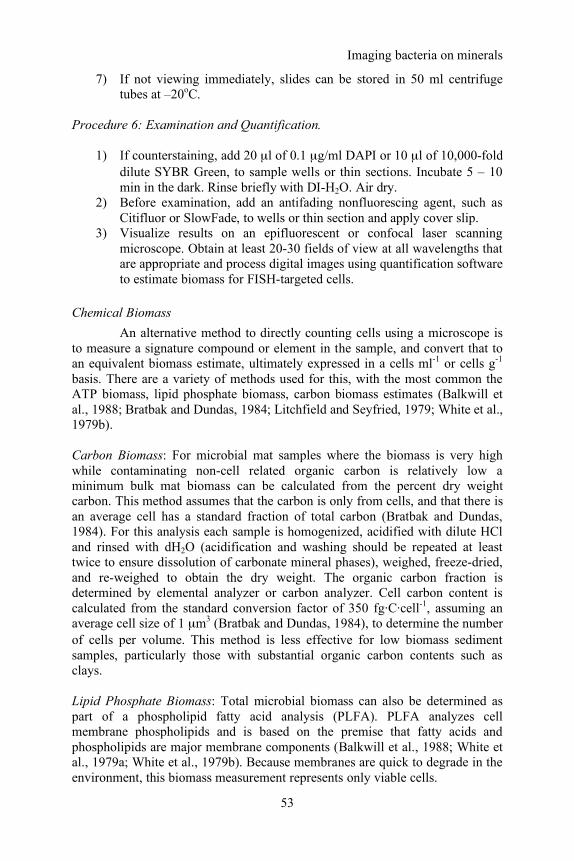
7) If not viewing immediately, slides can be stored in 50 ml centrifuge tubes at –20oC.
Procedure 6: Examination and Quantification.
1) If counterstaining, add 20 µl of 0.1 µg/ml DAPI or 10 µl of 10,000-fold dilute SYBR Green, to sample wells or thin sections. Incubate 5 – 10 min in the dark. Rinse briefly with DI-H2O. Air dry.
2) Before examination, add an antifading nonfluorescing agent, such as Citifluor or SlowFade, to wells or thin section and apply cover slip.
3) Visualize results on an epifluorescent or confocal laser scanning microscope. Obtain at least 20-30 fields of view at all wavelengths that are appropriate and process digital images using quantification software to estimate biomass for FISH-targeted cells.
Chemical Biomass
An alternative method to directly counting cells using a microscope is to measure a signature compound or element in the sample, and convert that to an equivalent biomass estimate, ultimately expressed in a cells ml-1 or cells g-1 basis. There are a variety of methods used for this, with the most common the ATP biomass, lipid phosphate biomass, carbon biomass estimates (Balkwill et al., 1988; Bratbak and Dundas, 1984; Litchfield and Seyfried, 1979; White et al., 1979b). Carbon Biomass: For microbial mat samples where the biomass is very high while contaminating non-cell related organic carbon is relatively low a minimum bulk mat biomass can be calculated from the percent dry weight carbon. This method assumes that the carbon is only from cells, and that there is an average cell has a standard fraction of total carbon (Bratbak and Dundas, 1984). For this analysis each sample is homogenized, acidified with dilute HCl and rinsed with dH2O (acidification and washing should be repeated at least twice to ensure dissolution of carbonate mineral phases), weighed, freeze-dried, and re-weighed to obtain the dry weight. The organic carbon fraction is determined by elemental analyzer or carbon analyzer. Cell carbon content is calculated from the standard conversion factor of 350 fg·C·cell-1, assuming an average cell size of 1 µm3 (Bratbak and Dundas, 1984), to determine the number of cells per volume. This method is less effective for low biomass sediment samples, particularly those with substantial organic carbon contents such as clays. Lipid Phosphate Biomass: Total microbial biomass can also be determined as part of a phospholipid fatty acid analysis (PLFA). PLFA analyzes cell membrane phospholipids and is based on the premise that fatty acids and phospholipids are major membrane components (Balkwill et al., 1988; White et al., 1979a; White et al., 1979b). Because membranes are quick to degrade in the environment, this biomass measurement represents only viable cells.
Bennett et al.
54
Procedure 7: Lipid Phosphate Extraction and Measurement.
1) All glassware used in this procedure should be organic free and reagents should be pesticide grade.
2) Lipids are extracted from sediment (5-10 g) using a methanol:chloroform:50 mM phosphate solution {in the ratio 1.5:3:1; procedure modified from methods described by White et al., 1979 and improved upon by Findlay et al., (1985)}. This is a single-phase solution, but depending on the volume of pore water additional methanol should be added to maintain a single phase, or the sample can be freeze-dried before extraction.
3) The sediment slurry is shaken and incubated for 24 hours at 4 °C in the dark.
4) Distilled water and chloroform are added in equal volumes and the solution is incubated for another 24 hours at 4 °C in the dark. This will break the single phase supernatant and the organic phase (which contains the lipids) will collect at the bottom of the tube. The boundary can be clarified using centrifugation if necessary.
5) The organic phase should be volumetrically transferred to a glass ampoule and dried under N2 at 35 °C.
6) Add 450 µl of a saturated potassium persulfate solution to the ampoule then seal the ampoule and incubate at 100 °C for 12 hours to oxidize the organic carbon and release phosphate from the lipid structure.
7) After the solutions are cooled, the phosphate concentration is measured colorimetrically using a spectrophotometer, and converted into a number of cells using 3.5 x 10⁸ cells nmol-1
phosphate (Bott and Kaplan, 1985). The number can also be converted to carbon biomass using a conversion factor specific to your study area, but there is a considerable range of factors that are dependent on physiologic type, cultivation, etc. (Dobbs and Findlay, 1993).
CONVENTIONAL SCANNING ELECTRON MICROSCOPY
Conventional scanning electron microscopy (C-SEM) is a well established technique for examining mineral surfaces and microorganisms, and it is beyond the scope of this guide to review the details of this instrument and basic imaging techniques. Rather we will focus on specific aspects of the sample preparation that can enhance or impede the successful imaging of microorganisms on rock surfaces. For a general overview of SEM theory and technique the reader is directed to Goldstein et al (1992).
Sample Preparation
Sample preparation is the step or series of steps required to transform the sample from the preserved condition required for transport and storage to the desiccated state necessary for imaging. Samples viewed in a C-SEM must be

Imaging bacteria on minerals
55
completely desiccated to prevent uncontrolled out-gassing in the high-vacuum environment. In contrast to the environmental SEM, sample preparation with the C-SEM is a critical step for imaging microbes on minerals, and it is the most important potential source of artifact. The choice of sample preparation method will invariably involve a compromise between the preservation of microbial biomass and cell morphology and the preservation of the mineral composition and surface texture (Goldstein et al., 1992; Lohnes and Demirel, 1978).
Cleanliness is important for all preparation methods, while sterility is not. Small dust particles and suspended microorganisms in the typical laboratory environment can easily settle on the sample before coating with a conductive layer, providing a ready supply of interesting micron-sized particles. Preparation should be done in a laminar flow hood, glove bag, or if these are not available, then the procedure should be done quickly to limit contamination.
For C-SEM imaging of a non-conductive surface a metallic coating is required to prevent uncontrolled charging and sample damage (Goldstein et al., 1992). Typically this is applied in a low-vacuum sputter coater apparatus, and the procedure is deceptively simple, and a common source of artifact. Prepared samples, either by air drying, freeze drying, or chemical preservation (see below), are coated with a thin layer of a conductive material, which can be any number of materials; the most commonly used are gold or carbon. Generally, sputter-coating is done for less than 30 sec to minimize the production of artificial topography (small blobs of coating material) on a sample. Once the sample is coated, it needs to be kept dry, but contaminating dust that is not coated will not be effectively imaged. Air Dry: Air drying is the simplest, and worst, method for preparing a sample for C-SEM to image biomass. The uncontrolled evaporation of water disrupts the cell wall of the microorganism, resulting in a deflated appearance of the cell, and often cell lysis. The degree of drying in air or even a desiccator is also less than that developed in the carbon or gold coating apparatus, and there will be additional damaging desiccation of the sample during those steps. There are, however, some advantages to air drying a sample. One is the preservation of total cell numbers for SEM surface counts, although the resulting cell morphologies can be so severely disrupted that the cells are no longer recognizable, and the lack of surface rinsing leaves obscuring mineral detritus. Another advantage is the preservation of the mineral composition of the surface of interest, although not necessarily the clay mineral morphology. Virtually every method of drying a sample that involves solvent replacement has the potential to react with the mineralogy, sometimes dramatically. Both dissolution and precipitation reactions are possible, and at the high magnifications possible with contemporary instruments, even a few minutes in a reactive solution can result in surface alteration that can be inadvertently associated with the attached microbial populations.

Bennett et al.
56
There are several variations on the basic method of air drying, including the use of variable humidity and temperature chambers to control the rate of desiccation (Goldstein et al., 1992; Lohnes and Demirel, 1978). It is also possible to replace the aqueous fluids with high vapor pressure solvents (such as ethanol or acetone) to accelerate the drying process. This will produce a drier sample but at the cost of the loss of lipids from the microbial cell walls, the loss of biomass from the sample surface due to disruption of exopolysaccharides (EPS) layers, and possibly even greater damage to the cell integrity and biofilm morphology. Freeze Dry: Freeze drying is probably one of the best general methods for preparing an unknown sample for imaging by C-SEM. Freezing is an excellent preservative that is easily arranged for in the field, and the sample can be stored for years even at -20oC, although -80oC or greater is better. The freeze-dry process desiccates the sample by slow sublimation while maintaining the integrity of the biomass and producing an excellent sample ready for coating (Goldstein et al., 1992; Lohnes and Demirel, 1978). A related and very useful technique for microbial mats is freeze-fracturing, where the frozen sample is split with a sterile scalpel or razor blade before freeze drying. The final desiccated sample is stub mounted and coated, without further processing (Figure 2).
Figure 2. CSEM image of Kane Cave microbial mat. The sample was prepared by freezing fresh mat in liquid nitrogen, fracturing the frozen sample with a razor blade, then freeze drying the final sample before gold sputter coating and imaging. Scale bar is 60 mm.

Imaging bacteria on minerals
57
The artifacts associated with the freeze-dry method are few but important. The advantage of the method is that the sample can be frozen in the field and then prepared directly without the use of solvents or rinses. The problem is that the dissolved salts in the aqueous phase will precipitate as the sample dries, potentially contaminating the sample surface with small mineral crystals. Depending on the water content and solute concentration of a sample, these crystals could be a nuisance, or could obscure important detail and confuse the X-ray analysis of elemental composition. This is an example of the essential compromise inherent in imaging microbes on rocks – in general, the best method for preserving cell morphology is the worst method for preserving mineral morphology or composition, and visa versa. Critical Point Drying: Critical point drying (CPD) is a fairly old method for removing the water from biological material while maintaining the sample morphology (Anderson, 1951). The method is complex, and the details are accessible in the literature (e.g. Bartlett and Burstyn, 1975; Cohen, 1979), and involves multiple replacement solutions to exchange the water for either pure ethanol or amyl acetate, solvents appropriate for the CPD process. The final step is to place the sample in a steel “bomb” and flood it with liquid carbon dioxide, transitioning the chamber interior environment past the “critical point” of CO2 (73 atm @31.6oC). At this point the anhydrous solvent (ethanol or amyl acetate) is replaced by supercritical CO2, and as the pressure is slowly released the supercritical fluid is removed without a liquid-vapor phase boundary and associated surface tension effects on the biomass. This method is complex, but will preserve biologic tissue without significantly altering mineral surface morphology (Figure 3).
The disadvantage of this method is subtle, and it took us several years to recognize it. The procedure uses solvents that dissolve components of the cell wall, and the multiple solvent replacement steps followed by the venting of the CPD bomb results in significant dislodgement of the attached microbial population. We estimate that up to 90% of the individual cells (microbes not associated with an established biofilm) are lost during the CPD process, and virtually all of the loosely attached mobile population, particularly the iron-reducing bacteria. The method is effective for well-attached biofilms, however, although we prefer the chemical CPD method described below. Chemical CPD: Chemical critical point drying is an alternative preservation method that is significantly less disruptive to the surface, and maintains morphology of surface-adherent cells (Figure 4). It does not use high pressure CO2 and the solutions can be transported to the field and are ideal for preserving in situ microcosm samples and labile samples immediately after retrieval.

Bennett et al.
58
Figure 3. Quartz prepared by carbon dioxide critical point drying method. CSEM image of quartz surface from an in situ microcosm experiment in an oil contaminated aquifer. Sample was preserved in the field by buffered glutaraldehyde (2.5%) and then prepared by progressive dehydration and carbon dioxide critical point drying in the laboratory and gold sputter coating. Scale bar is 2 mm.
Figure 4. Chemical CPD example. A. Quartz surface from microcosm experiment in an oil contaminated aquifer prepared by chemical CPD. Solutions A-C were applied in the field, with the final steps done in the laboratory. Sample was stub mounted and gold coated and imaged by CSEM. Scale bar is 6 mm B. CSEM image of anorthoclase surface with similar preparation method. Scale bar is 2 mm.

Imaging bacteria on minerals
59
Recipe 3. Chemical CPD Solutions
Solution A: Cacodylate Buffer, 0.05M, pH 7.4: 8.16g/l cacodylic acid, sodium salt (Sigma C0250) titrated to pH 7.4 with ~20 ml of 0.1M H2SO4: this kills live bacteria (Caution: contains As).
Solution B: Lysine/Glutaraldehyde Fixative: 2.5% glutaraldehyde (from 25% aqueous solution, Sigma G5852) and 50mM Lysine (0.73g in 100 ml) in solution A. Make immediately before use. Lysine discolors with age keep refrigerated and in solution.
Solution C: Glutaraldehyde Fixative: 2.5% glutaraldehyde in 100 ml of solution
Procedure 8: Chemical Critical Point Drying.
1) Place sand and clay samples in a porous plastic mesh “tea bag” to prevent loss of fine materials during the rinsing steps.
2) Gently immerse the samples briefly 3 times in solution A. 3) Immediately transfer samples to Solution B (Recipe 3), and let soak
undisturbed for 90 min. 4) Transfer samples to Solution C (Recipe 3), for at least 24 hr or up to 7
days. The samples are now stable for transport, but should be rinsed in fresh Solution A (Recipe 3)just prior to the dehydration protocol.
5) In the lab, sequentially dehydrate samples using stepwise concentrations of ethanol, beginning with the lowest concentration. At each concentration, the sample is left for 20 min. Discard solutions after 5 samples to prevent cross contamination between samples. The final soak in 100% ethanol is 40 min.
6) Soak samples twice in pure hexamethyldisilazane for 20 min each, and then allow the samples to air dry loosely covered (to prevent airborne contamination) in a fume hood for at least 2 hours.
These methods are modified from those described by Nation (1983) and Vandevivere and Bevaye (1993). While this method gives excellent preservation of firmly attached cells for both E-SEM and C-SEM imaging, unattached cells are still rinsed off. This method results in excellent preservation of cell morphologies and attachment filaments, but biofilm structures will collapse to some extent as the EPS desiccates, highlighting the cells, usually to good effect (Figure 4).
Artifacts
Dehydration Artifact: The primary dehydration artifacts are cell collapse and lysis in air-dried or chemical dried samples, and the precipitation of inorganic phases (e.g., minerals) as water evaporates. A related artifact occurs when an anaerobic sample with high dissolved iron is exposed to oxygen during air-drying and the oxidized iron precipitates as ferrihydrite and related phases. This results in surfaces with abundant small spheroids that could be (and have been)
Bennett et al.
60
mistaken for ultra-micro bacteria. Sputter Coating Artifact: Coating a sample is a common source of artifact. One form is “gold decoration artifact”, which typically takes the form of small balls of gold that form on sharp points, resembling very small microbes. This most often occurs from excessively long sputter coating sessions. Long sputter coating periods will also result in heat damage of biological materials or the mounting media.
To prevent gold decoration artifact the simple solution is to apply a thinner coating of gold, but this is problematic with fine sands and silts. Light sputter coating will have poor continuity of the metal coating and excessive charging at high accelerating voltage. Another possibility is to use high vacuum evaporated carbon coating, which does not produce artifacts and is superior for use with elemental analysis, but is inferior for high resolution high magnification imaging. We have found that a superior coating of fine grained material results from first coating with carbon in a high-vacuum evaporator, followed by a short thin coating of gold. The gold spreads better on the carbon, and this combination has excellent charge conduction properties with superior preservation of fine detail, even at the nanometer scale. “Nannobacteria”: Nannobacteria is the unofficial name given to very small (25-100 nm) spherical objects observed on or in some minerals (Folk, 1993; Folk, 1994; Folk, 1997; Folk, 1999). Based on observational evidence from high resolution SEM images, these features are interpreted by a few researchers to be ultra-micro “life”, potentially representing a new microbial domain. This is a fascinating idea, and if true it would be a tremendous expansion of our understanding of the microbial world. These very small objects are also hypothesized to form a substantial fraction of the subsurface biomass and organic carbon reservoir, and be a significant factor in subsurface geological processes such as mineral weathering and precipitation. Every organism that fits the definition of life (e.g., Madigan et al., 2002) requires a common set of structures, including a cytoplasmic membrane (with or without a cell wall), ribosomes to manufacture proteins, enzymes for either substrate-level glycolysis or for generating a chemiosmotic potential, DNA for storing genetic information, and a cytoplasm with a constant internal pH and osmotic pressure. Even the simplest cell, such as a mycoplasm, has a minimum cell size required to hold these structures and maintain biomolecules at the required concentration as well as internal pH homeostasis, and this size is commonly recognized to be greater than 100 nm diameter for active viable cells. While there are other biomaterials that are very small (e.g. viruses, prions, endospores, blebs, and exoenzymes) these are not “alive”, i.e. actively metabolizing, dividing, evolving, and perturbing the surrounding environment. A living organism that is contained in, for example, a 50 nm sphere would require an entirely new set of biochemical processes for metabolism and growth,
Imaging bacteria on minerals
61
and therefore an entirely new process for transcribing genetic information, processes presently unknown to science.
There is, however, almost no evidence that these very small features are “life” as we presently define it, and substantial evidence that they are not, including that “nannobacteria” represent a misinterpretation of surface artifact, amorphous organic and inorganic precipitates, and desiccation artifact (Kirkland et al., 1999), or extracellular biomaterials that do not have the capacity for independent metabolism. Similar features have been obtained by precipitating amorphous iron or manganese, or by degrading proteinaceous tissue (Schieber and Arnott, 2003). A few examples could also be desiccated dwarf-form (stressed) bacteria that are not vegetative, or endospores, that when vegetative are normal sized cells (>200 nm). While the idea of “nannobacteria” is intriguing, the authors have personally examined many hundreds of SEM images, and evidence that “nannobacteria” are the result of imaging artifact and misinterpretation of small, non-living objects is overwhelming.
ENVIRONMENTAL SCANNING ELECTRON MICROSCOPY
Environmental-SEM (E-SEM) is a powerful tool that allows for imaging of biological material without desiccation or coating, and the artifacts that accompany sample-processing procedures are significantly diminished. The technology is complex, and knowledge of the advantages and limitations of the microscopic technology are critical to use the instrument effectively; the details are outside the scope of this guide. Readers are directed to published review articles on the technology and use of high pressure SEM (Collins et al., 1993; Danilatos, 1993; Danilatos and Robinson, 1979; Farley and Shah, 1990a; Farley and Shah, 1990b; Hopfe and Futing, 1995; Mathieu, 1996; Mathieu, 1999; Meredith et al., 1996; Timofeeff et al., 2000).
The guidelines provided below are specific to an FEI XL30 TMP capable of 100% relative humidity at ambient temperature, with chamber pressures greater than 6 torr H2O vapor. The techniques used include low vacuum (1 torr) and environmental conditions (6-10 torr), with secondary electron (SE), backscatter (BSE) and energy dispersive analysis of X-ray (EDS) under both modes. We provide protocols specific for imaging microorganisms on mineral surfaces, and any associated weathering features due to microbial colonization.
Sample Preparation
Sample preparation is simple, and often the mechanics of mounting an oddly shaped mineral sample securely to the conductive stub is the most involved (and important) step. The goal of the preparation, however, is to obtain a representative and useable image of the sample, and sometimes unusual steps must be taken in the quest to obtain that image. These steps are not standard

Bennett et al.
62
procedures for C-SEM, and it is not always straightforward to transition to the environmental instrument.
Cleanliness is critical for E-SEM examination. For C-SEM, once the
sample is coated, accumulation of surface contaminants is less important since the uncoated particles will not effectively image. For the E-SEM, every particle of contamination becomes part of the sample, and it is impossible to distinguish contaminating detritus from the original sample. All sample preparation should be done in a laminar flow hood or similar, and samples should be stored carefully to minimize contamination.
The use of buffered preservative or suspension solutions is problematic. During the imaging session, it is likely that the mineral surface will dry out, sometimes excessively, and as the water evaporates in the chamber, the buffer salts remain on the mineral surface. While buffered solutions help to preserve the microbe morphology, it is common to see even published images with small crystals of halite or other mineral salts on surfaces that are almost entirely the result of buffer evaporation. While rinsing with distilled water before imaging can reduce this artifact, it can also result in osmotic shock and lysis of Gram negative organisms, and will rinse off a fraction, sometimes a significant fraction, of the biomass. Direct Examination: Large mineral chips (>2 mm) are examined directly with minimal sample preparation, although obtaining a useable image may not be simple. While the E-SEM does not require a conductive coating, this does not eliminate the requirement for grounding of the sample and the elimination of charge buildup (Danilatos, 1993; Hopfe and Futing, 1995; Mathieu, 1996; Mathieu, 1999; Meredith et al., 1996). The sample must also be held firmly on the stub, either by conductive carbon double-stick tape, wire, or with screw clamps. If the sample is to be imaged at high relative humidity, subambient temperatures (e.g., on a peltier stage) are generally required. A sample must also be small enough to fit on a stub, and small enough to be in thermal equilibrium with the stage to achieve the desired temperature. For such a sample, it is a good idea to pre-chill the sample (e.g., to the stage temperature) before mounting, and to mount and image the sample quickly.
Most oxides, carbonates, and silicates are semiconductors or insulators, and the lack of conductive coating results in significant charge buildup on the surface, even at high relative humidity, and the greater the non-conductive surface area of the sample, the worse the problem. With some minerals, such as calcite, the charging can damage the sample, or even fracture it, sometimes with spectacular results. Charging is reduced by increasing the area of contact to the conductive stub, or the area of carbon paint around the base of the sample or even up and around the imaging area. Sand and Clay Mounts: For sand, the sample can be sprinkled and placed

Imaging bacteria on minerals
63
directly on a stub if very wet, or better, attached to carbon tape. Avoid the use of carbon paint, as it tends to creep up the sand grains and can cover and potentially obscure images.
The use of the E-SEM in imaging clays under variable humidity is becoming more common (Baker et al., 1995; Baker et al., 1993; Jullien et al., 2002; Montes et al., 2003; Nix and Feist-Burkhardt, 2003; Rodriguez-Navarro, 1998). Imaging microorganisms associated with clays, however, is more challenging. A simple smear of clay will have a large amount of associated water, and the hydration state will change during the imaging session, accompanied by physical shifting of the sample on the stub. One useful technique is to suspend clays and microbes in a dilute buffer solution and then to filter the suspension onto a membrane, followed by a brief rinse with distilled water through the filter. The membrane can be cut to fit a stub and should be mounted firmly onto carbon tape with the edges painted with carbon. Both microbial cells and clays can be imaged, although their original positions (with respect to cells on mineral surfaces) are not preserved. Imaging Imaging microorganisms on mineral surface using the E-SEM differs substantially from the C-SEM (Danilatos, 1993; Hopfe and Futing, 1995; Mathieu, 1996). The lack of a uniform metallic coating results in a heterogeneous surface with variable imaging, and charging, behavior. For a practiced C-SEM operator this results in a non-intuitive relationship between accelerating voltage, working distance, resolution, and contrast. Standard operating procedure on a C-SEM transferred to the E-SEM can result in low-quality images at best, and at worst, a beam-damaged surface or even a fractured sample. With the E-SEM there is the added variable of the chamber gas pressure (usually water vapor, and expressed in torr), and on some instruments, the sample temperature can also be adjusted to yield an equivalent relative humidity.
Even when a successful image is obtained, the operator must also accept the fundamental differences between the E-SEM and C-SEM image process. The physics of the E-SEM gaseous secondary electron (SE) detector means that there is little or no topographic shadow, i.e. the effect of surface relief shadowing the emitted secondary electrons from the SE detector (e.g. Farley and Shah, 1990a; Meredith et al., 1996). In the E-SEM the amplification effect of the chamber gas means that secondary electrons from all areas interacting with the primary electron beam have a more or less equal chance of reaching the detector, resulting in less shadowing that enhances relief (this depends somewhat on the detector, and the detectors sensitivity to primary and the various types of secondary electrons). This produces a very flat image appearance that at first looks to have low contrast or poor detail (Figure 5). Another difference in E-SEM images compared to C-SEM images is that different materials will have different interactions with the primary beam,
Bennett et al.
64
making thin carbonaceous material on a mineral surface, for example, almost transparent at high accelerating voltages. Humidity: The effect of relative humidity in the E-SEM chamber is complex, and will impact image contrast and brightness, charging, and the morphology of surface features. It is one of the most difficult variables to balance, but also a powerful tool to obtain diagnostic images of mineral-microbe interactions. For clean mineral or glass surfaces with attached microorganisms, we typically start with a chamber pressure and sample temperature combination that will yield a relative humidity of 80%, with the actual chamber pressure dependent on the choice of imaging detector. This pressure is usually well past the point of maximum signal amplitude (maximum contrast) and into the area of general brightening, and the brightness may be down to 10%. These conditions will maintain hydrated microorganisms, EPS layers, and clays, but without any liquid water. These conditions, however, can also result in a surface image with virtually no detail if there is a biofilm present with significant EPS accumulation. For large mineral chips, the actual surface temperature will also be higher, perhaps substantially higher during imaging, than the stage and stub, so using a higher chamber pressure than initially calculated may be necessary to prevent desiccation. This action however can result in the chilled stub reaching a point where water condenses and fills the well on the stub around the sample, while the sample surface remains dry.
For clays and microbes on larger sample chips (e.g., a weathered feldspar surface), it is often difficult to distinguish what is biological and what is mineral; a common complaint of novice E-SEM users is that the surface is a jumble of ‘slime’. This is particularly a problem where a biofilm is established and attached to a surface, obscuring fine mineral-cell surface detail in a layer of EPS. A useful technique is to initiate imaging at high relative humidity to preserve the clay and microbe morphology, and follow that with an imaging session at very low relative humidity (<15%). This will desiccate both the clay and the microbe, but will substantially decrease the thickness and opacity of the EPS layer, and will bring out mineral surface details. Even when a microorganism desiccates, there is generally sufficient internal structure to maintain a recognizable shape while the EPS layers tend to completely collapse and becomes indistinguishable from the mineral substratum. A note: fine clays associated with a microbe surface will also collapse on the cell wall, and can be misinterpreted as a biologic structure. Detectors and Accelerating Voltage: The choice of detector and accelerating voltage in the E-SEM is a peculiar balance between the desired resolution, charging potential on the uncoated surface, spot size, chamber pressure, and the working distance. It is beyond the scope of this paper to review the physics of a gaseous SE detector (Farley and Shah, 1990a; Mathieu, 1996; Meredith et al., 1996), but it is possible to give a few guidelines.

Imaging bacteria on minerals
65
For a first look at an unknown surface that does not need to be kept wet (e.g., one that has been processed by CPD) we typically use a large field detector at ~0.7 torr chamber pressure and ambient temperature, producing a relative humidity of <20%. We start with 7.5 keV accelerating voltage, spot 4, at a working distance of 10mm (all imaging guidelines given here use a working distance of 10mm). While imaging an unimportant area, the chamber pressure is then adjusted to the point of maximum contrast amplitude, and the surface is scanned at 1500X magnification for features of interest. This set of conditions results in minimal charging or beam damage, and a stable if low-resolution image. There is little penetration of EPS layers but there will be rapid desiccation of clays and hydrous polysaccharides, and the surface will appear rough textured. Microbes are generally easy to find if the correct preservation technique was used, and mineral surface details will be sharp. The maximum magnification, however, is probably only 5000X. Higher accelerating voltage can result in higher resolution and contrast, but will require higher chamber pressures to account for charging, and beam damage can be substantial. Under these conditions, we will rarely go above 12keV on a semi-conducting surface.
For wet samples, there are a variety of detectors that can be used which have different ranges of acceptable chamber pressures. We will generally start with 6 torr chamber pressure at 6oC stage temperature, and 10 keV, but the choice of accelerating voltage for this combination is wide, and we will go as high as 20 keV. At low accelerating voltage there are few backscatter electrons (BSE) and the image is entirely SE with little penetration, and only the uppermost surface details will be imaged. The surface can appear almost featureless, with hydrated EPS layers obscuring the mineral surface. As the accelerating voltage is increased (with an increase in chamber pressure) there will be greater production of BSE and penetration of the surface, and underlying details will become visible. At high accelerating voltage, particularly when SE and BSE detection is combined, thin biofilms are almost transparent revealing the mineral surface, but at the risk of substantial and permanent beam damage to the biofilm.
Pros and Cons
The E-SEM offers several critical advantages over the C-SEM in reducing sample preparation and coating artifact, and in maintaining mineral surface biofilm structure. The E-SEM can also be used to image internal structures such as colloidal sulfur particles (Cox et al., 2000; Douglas and Doutlas, 2000), and characterize the composition of fluid inclusions using X-ray EDS (Timofeeff et al., 2000), capabilities that are significantly more difficult with coated samples. Another technique uses the slight differences in the charging behavior of uncoated mineral surfaces to image compositional zoning, similar to cathodoluminescence (Watt et al., 2000).
The disadvantages of the E-SEM are just as important. While the

Bennett et al.
66
theoretical resolution capabilities are the same for C-SEM and E-SEM for a conductive sample, the resolution with an uncoated semiconductor with a surface biofilm will always be inferior under environmental chamber conditions. The technique is also more complicated than C-SEM, and much more sensitive to user technique, and it is far easier to obtain a useless or misleading image than to obtain a quality representative image.
CASE STUDY: LOWER KANE CAVE
This case study demonstrates several sampling and imaging methods used to describe, characterize, and quantify microorganisms and microbe-mineral interactions on environmental samples. Lower Kane Cave is a sulfidic cave forming in the Madison Limestone in the Bighorn Basin, WY, and is undergoing active sulfuric acid speleogenesis whereby the limestone is being replaced with gypsum. Sulfidic water discharges in the cave, and thick, white filamentous microbial mats colonize the spring pools and outflow stream channels. The research question that guided this part of our investigations was, “Does the microbial community influence cave development, and which organisms are important?” Results are summarized in Engel et al. (2004b).
Figure 5. Flat low contrast ESEM image. ESEM image of microcosm calcite after cleaning with calcite and pH buffered 1x PBS with tween80 to remove biofilm. The etched track is probably the result of microbial sulfide oxidation to sulfuric acid by an attached filamentous organism.
Microbial mat samples were collected and placed into sampling containers with different preservative methods depending on the imaging or analytical techniques. For C-SEM, the mats were processed using the chemical

Imaging bacteria on minerals
67
CPD method or freeze drying and freeze-fracturing, then stub mounted, gold sputter-coated, and examined using a JEOL JSM-T330A SEM. The chemical CPD method worked well on limestone samples, but the aqueous solutions reacted with gypsum samples, and only unpreserved samples of some surfaces with gypsum were effectively imaged in the FEI XL30 E-SEM at the University of Texas at Austin. C-SEM examination of several mat samples revealed complex organic and inorganic structures as part of the overall mat structure. White filamentous material revealed a tight filament network (Figure 5) with branching and non-branching filaments averaging 1 µm wide (Figure 6). Some thin filaments (~0.5 µm wide) were twisted and associated with long rods. In comparison, sediment with a high percentage of clay had few filaments, cells, but abundant Fe-S framboids (Figure 7).
Figure 6. Closeup of freeze fracture filaments.
The biomass of the microbial mats was estimated from the carbon content of the samples. Generally, biomass estimates were high at ~1010 cells/ml, with less than an order of magnitude difference between samples. However, these biomass values may underestimate the actual biomass in the microbial mats because cell-carbon conversion factors are for rod-shaped cells, and these samples are dominated by filamentous morphotypes.
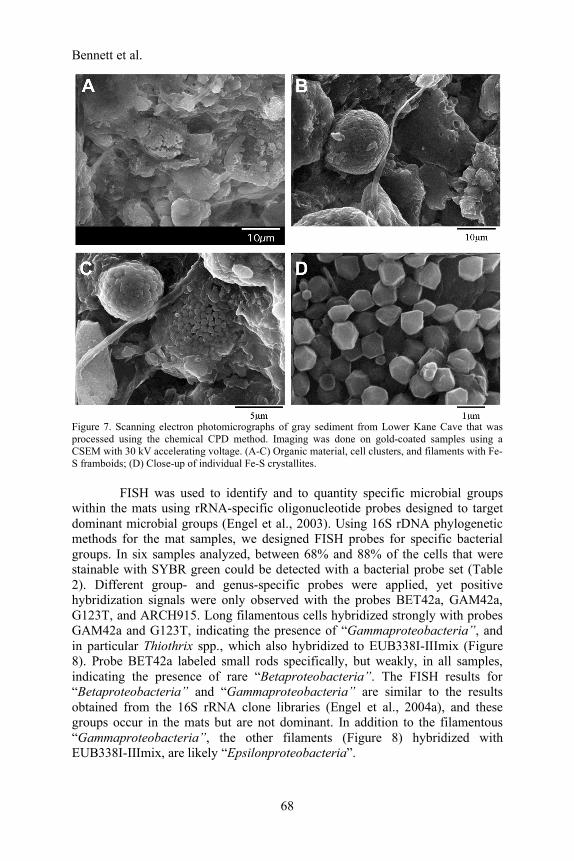
Bennett et al.
68
Figure 7. Scanning electron photomicrographs of gray sediment from Lower Kane Cave that was processed using the chemical CPD method. Imaging was done on gold-coated samples using a CSEM with 30 kV accelerating voltage. (A-C) Organic material, cell clusters, and filaments with Fe-S framboids; (D) Close-up of individual Fe-S crystallites.
FISH was used to identify and to quantity specific microbial groups within the mats using rRNA-specific oligonucleotide probes designed to target dominant microbial groups (Engel et al., 2003). Using 16S rDNA phylogenetic methods for the mat samples, we designed FISH probes for specific bacterial groups. In six samples analyzed, between 68% and 88% of the cells that were stainable with SYBR green could be detected with a bacterial probe set (Table 2). Different group- and genus-specific probes were applied, yet positive hybridization signals were only observed with the probes BET42a, GAM42a, G123T, and ARCH915. Long filamentous cells hybridized strongly with probes GAM42a and G123T, indicating the presence of “Gammaproteobacteria”, and in particular Thiothrix spp., which also hybridized to EUB338I-IIImix (Figure 8). Probe BET42a labeled small rods specifically, but weakly, in all samples, indicating the presence of rare “Betaproteobacteria”. The FISH results for “Betaproteobacteria” and “Gammaproteobacteria” are similar to the results obtained from the 16S rRNA clone libraries (Engel et al., 2004a), and these groups occur in the mats but are not dominant. In addition to the filamentous “Gammaproteobacteria”, the other filaments (Figure 8) hybridized with EUB338I-IIImix, are likely “Epsilonproteobacteria”.

Imaging bacteria on minerals
69
Figure 8. FISH results from white filamentous microbial mats from Lower Kane Cave. (A) Overlapping FISH probes; gray, EUB338I-III mix for all Bacteria; white, GAM42a for Gammaproteobacteria (e.g., Thiothrix spp.); arrows, BET42a for Betaproteobacteria (e.g., Thiobacillus spp.). (B) EUB338I-III probes mix; (C) GAM42a probe only; (D) BET42a probe only. Scale bar is 20 µm.

Bennett et al.
70
All “Epsilonproteobacteria” FISH probes exclusively hybridized to
filamentous microbes, and conferred very bright signals to their target cells, indicating activity and high rRNA contents (Amann et al., 1995). Filaments detected by probe the newly designed probe LKC59 (Engel et al., 2003) had an average diameter of 1 µm and appeared kinked or twisted, similar to the twisted filaments observed C-SEM (Figure 1), while straighter, longer, and slightly thicker filaments were detected by LKC1006..Quantitative FISH revealed that LKC group II filaments dominated five of six samples analyzed by biovolume, and represented 50% to 70% of the community bacterial biovolume.
In situ microcosms were used in the cave to determine if the attached population dissolves the limestone (Engel et al., 2004b). Microcosms contained chips (0.5 to 1 cm3) of Iceland Spar calcite (Wards Scientific) and native limestone, with sterile controls (microcosms with 0.1-µm filters on either end). C-SEM examination of the calcite from the in situ microcosms revealed etching localized where microbial filaments or biofilms were attached to the mineral surfaces (Figure 9). In contrast, sterile microcosms exposed to the stream water show no microbial colonization and no apparent dissolution. Two filament types were observed on nonsterile calcite chips with E-SEM, one containing sulfur globules and another without (Figure 10). Comparison with light microscopy and FISH results suggests that the sulfur-containing filament is a “Gammaproteobacteria” (Thiothrix spp. Based on phylogenic association), while the non-sulfur containing filament is probably “Epsilonproteobacteria”. By decreasing the humidity in the E-SEM chamber briefly to desiccate and collapse the filaments we were able to image the region under the filaments and show the presence of dissolution localized to the metabolizing microorganism (Figure 11).
Figure 9. C-SEM of filaments on in situ microcosm calcite. Scale Bar is 20µm.

Imaging bacteria on minerals
71
Figure 10. ESEM of sulfur and non-sulfur filaments.
Figure 11. Collapsed filaments
Bennett et al.
72
By combining culture methods, molecular methods, and C/E-SEM observations, we are able to deduce metabolic function, phylogenetic affiliation, 3-D mat structure, and the geochemical interaction of the attached microbial population at the mineral surface. The whole data package was used to propose a model for the microbial mediation of sulfuric acid speleogenesis (Engel et al., 2004b), where filamentous sulfur-oxidizing bacteria produce sulfuric acid, creating a zone of calcite undersaturation localized to the region of attachment. The buffering capacity of the calcite, in turn, maintains a neutral pH habitat beneficial to the neutrophilic organisms. The microbial population substantially accelerates the oxidation of hydrogen sulfide over the abiotic rate, resulting in rapid karst development.

Imaging bacteria on minerals
73
REFERENCES Amann, R. I., Ludwig, W., and Schleifer, K. H. (1995). Phylogenetic
identification and in situ detection of individual microbial cells without cultivation. Microbiol. Rev. 59, 143-169.
Anderson, T. F. (1951). Techniques for the preservation of three-dimensional structure in preparing specimens for the electron microscope. Trans. NY Acad. Sci Ser. II 13, 130-151.
Baker, J. C., Grabowska-Olszewska, B., and Uwins, P. J. R. (1995). ESEM study of osmotic swelling of bentonite from Radzionkow (Poland). Applied Clay Science 9, 465-.
Baker, J. C., Uwins, P. J. R., and Mackinnon, I. D. R. (1993). ESEM study of authigenic chlorite acid sensitivity in sandstone reservoirs. Journal of Petroleum Science & Engineering 8, 269.
Balkwill, D. L., Leach, F. R., Wilson, J. T., McNabb, J. F., and White, D. C. (1988). Equivalence of microbial biomass measures based on membrane lipid and cell wall components, adenosine triphosphate, and direct counts in subsurface aquifer sediments. Microbial Ecology 16, 73-84.
Bartlett, A. A., and Burstyn, H. P. (1975). A review of the physics of critical point drying. Proceedings of the 8th Annual scanning electron microscope symposium. Part I. J.J.T. Research Institute, Chicago, IL, 305-316.
Bartosch, S., Mansch, R., Knötzsch, K., and Bock, E. (2003). CTC staining and counting of actively respiring bacteria in natural stone using confocal laser scanning microscopy. J. Microbiological Methods 52, 75-84.
Bekins, B. A., Cozzarelli, I. M., Godsy, E. M., Warren, E., and Tucillo, M. E. (1999a). Chemical and physical controls on shifts of microbial populations in a n aquifer contaminated with crude oil. In "International Symposium on Subsurface Microbiology." pp. 25-26, Vail, CO.
Bekins, B. A., Cozzarelli, I. M., Warren, E., and Godsy, E. M. (2002). Microbial ecology of a crude oil contaminated aquifer. Hydrogeology J. 275, 57-.
Bekins, B. A., Godsy, E. M., and Warren, E. (1999b). Distribution of microbial physiologic types in an aquifer contaminated by crude oil. Microbial Ecology 37, 263-275.
Benner, S. G., Gould, W. D., and Blowes, D. W. (2000). Microbial populations associated with the generation and treatment of acid mine drainage. Chemical Geology 169, 435-.
Bennett, P. C., Hiebert, F. K., and Choi, W. J. (1996). Microbial colonization and weathering of silicates in a petroleum-contaminated groundwater. Chemical Geology 132, 45-53.
Bott, T. L., and Kaplan, L. A. (1985). Bacterial biomass, metabolic state, and activity in stream sediments: Relation to environmental variables and multiple assay comparisons. Appl Environ Microbiol. 50, 508-522.
Bennett et al.
74
Bouvier, T., and del Giorgio, P. A. (2003). Factors influencing the detection of bacterial cells using FISH. FEMS Microbiol. Ecol. 44, 3-15.
Bratbak, G., and Dundas, I. (1984). Bacterial dry matter content and biomass estimations. Appl. Environ. Microbiol. 48, 755.
Chapelle, F. H. (2001). Ground-water microbiology and geochemistry. John Wiley and Sons : New York, NY, United States, United States.
Cohen, A. L. (1979). Critical point drying principles and procedures. Scanning Electron Microscopy 2, 303.
Collins, S. P., Pope, R. K., Scheetz, R. W., Ray, R. I., and Wagner, P. A. (1993). Advantages of Environmental Scanning Electron Microscopy in Studies of Micro organisms. Microscopy Research and Technique 25, 398-405.
Cox, B. L., Popa, R., Bazylinski, D. A., Douglas, S., and Nealson, K. H. (2000). Identification and distribution of Fe-, P-, and S-containing intracellular structures in magnetotactic cocci using environmental scanning electron microscopy (ESEM). In "Abstracts with Programs - Geological Society of America." pp. 258.
Danilatos, G. D. (1993). Introduction to the ESEM instrument. Microscopy Research and Technique 25, 354-361.
Danilatos, G. D., and Robinson, V. N. E. (1979). Principle of scanning electron microscopy at high specimen chamber pressure. Scanning 2, 72-82.
Dobbs, F. C., and Findlay, R. H. (1993). Analysis of microbial lipids to determine biomass and detect the response of sedimentary microorganisms to disturbance. In "Handbook of methods in aquatic microbial ecology." (P. F. Kemp, Ed.), pp. 347-358. Lewis Publisher, Boca Raton, Florida.
Douglas, S., and Doutlas, D. D. (2000). Environmental Scanning Electron Microscopy Studies of Colloidal Sulfur Deposition in a Natural Microbial Community from a Cold Sulfide Spring near Ancaster, Ontario, Canada. Geomicrobiology J. 17, 275-289.
Ehrlich, H. L. (1996). "Geomicrobiology." Marcel Dekker, New York. Engel, A. S., Lee, N., Porter, M. L., Stern, L. A., Bennett, P. C., and Wagner, M.
(2003). Filamentous "Epsilonproteobacteria" dominate microbial mats from sulfidic cave springs. Appl. Environ. Microbiol. 69, 5503-5511.
Engel, A. S., Porter, M. L., Stern, L. A., Quinlin, S., and Bennett, P. C. (2004a). Bacterial diversity and ecosystem functionality of filamentous microbial mats dominated by "Epsilonproteobacteria" associated with aphotic (cave) sulfidic springs. FEMS Microbiology Ecology.
Engel, A. S., Stern, L. A., and Bennett, P. C. (2004b). Microbial contributions to cave formation: new insight into sulfuric acid speleogenesis. Geology. 32, 369-372
Farley, A. N., and Shah, J. S. (1990a). Primary considerations for image enhancement in high pressure scanning electron microscopy. Part 1. J. Microscopy 158, 379-389.
Imaging bacteria on minerals
75
Farley, A. N., and Shah, J. S. (1990b). Primary considerations for image enhancement in high pressure scanning electron microscopy. Part 2. J. Microscopy 158, 390-401.
Federle, T. W., and White, D. C. (1983). Preservation of Estuarine Sediments for Lipid Analysis of Biomass and Community Structure of Microbiota. Appl Environ Microbiol. 44, 1166-1169.
Findlay, R. H., Pollard, P. C., Moriarty, D. J. W., and White, D. C. (1985). Quantitative determination of microbial activity and community nutritional status in estuarine sediments: evidence for a disturbance artifact. Canadian J. Microbiology 31, 493-498.
Folk, R. L. (1993). SEM imaging of bacteria and nannobacteria in carbonate sediments and rocks. Jour. Sed. Pet. 63, 990-999.
Folk, R. L. (1994). Nannobacteria; major participants in the precipitation of carbonates and other minerals. In "Special Publication - Karst Waters Institute." pp. 17. Karst Waters Institute : Charles Town, WV, United States, United States.
Folk, R. L. and Lynch, L.R. (1997). The possible role of nannobacteria (dwarf bacteria) in clay-mineral diagenesis and the importance of careful sample preparation in high-magnification SEM study. J. Sed. Res. 67 583-590.
Folk, R. L. (1999). Nannobacteria and the precipitation of carbonate in unusual environments. Sedimentary Geology. 126, 47-55.
Fredrickson, J. K., and Balkwill, D. L. (1998). Sampling and Enumeration Techniques. In "Techniques in Microbial Ecology." (R. S. Burlage, R. Atlas, D. A. Stahl, G. Geesey, and G. S. Sayler., Eds.), pp. 239-254. Oxford Press, New York.
Goldstein, J. I., Newbury, D. E., Echlin, P., Joy, D. C., Fiori, C., and Lifshin, E. (1992). "Scanning electron microscopy and X-ray microanalysis; a text for biologists, materials scientists, and geologists." Plenum Press, New York.
Gough, H. L., and Stahl, D. A. (2003). Optimization of direct cell counting in sediments. J Microbiol. Methods 52, 39-56.
Griebler, C., Mindl, B., and Slezak, D. (2001). Combining DAPI and SYBR Green II for the numeration of Total Bacterial Numbers in Aquatic Sediments. Internat. Rev. Hydrobiol. 86, 453-465.
Hiebert, F. K., and Bennett, P. C. (1992). Microbial control of silicate weathering in organic-rich ground water. Science 258, 278-281.
Holdeman, L. V., Cato, E. P., and Moore, W. E. C. (1977). Anaerobe laboratory manual. Virginia Polytechnic Institute and State University, Blacksburg, VA.
Hopfe, J., and Futing, M. (1995). Fundamentals and applications of environmental scanning electron microscopy. In "In Situ Scanning Electron Microscopy in Materials Research." (K. Wetzig, and D. Schulze, Eds.), pp. 219-240. Akademie Verlag, Berlin.
Bennett et al.
76
Jullien, A., Proust, C., Le Forestier, L., and Baillif, P. (2002). Hydro-chemio-mechanical coupling effects on permeability and swelling behaviour of a Ca smectite soaked by Cu solutions. Applied Clay Science 21, 143.
Kirkland, B. L., Lynch, F. L., Rahnis, M. A., Folk, R. L., Molineux, I. J., and McLean, R. J. C. (1999). Alternative origins for nannobacteria-like objects in calcite. Geology 27, 347.
Litchfield, C. D., and Seyfried, P. L. (1979). Methodology for Biomass Determinations and Microbial Activities in Sediments, pp. 199. American Society for Testing and Materials, Philadelphia.
Lohnes, R. A., and Demirel, T. (1978). SEM applications in soil mechanics. Scanning Electron Microscopy 1, 643-654.
Madigan, M., T., Martinko, J. M., and Parker, J. (2002). "Brock Biology of Microorganisms." Prentice-Hall, Englewood Cliffs.
Manz, W., Amann, R., Ludwig, W., Wagner, M., and Schleifer, K.-H. (1992). Phylogenetic oligodeoxynucleotide probes for the major subclasses of proteobacteria: problems and solutions. Syst. Appl. Microbiol. 15, 593-600.
Mathieu, C. (1996). Principle and application of the variable pressure SEM. Microsc. Anal. 43, 13-14.
Mathieu, C. (1999). The beam-gas and signal-gas interactions in the variable pressure scanning electron microscope. Scanning Microscopy 13, 23-41.
Meredith, P., Donald, A. M., and Thiel, B. (1996). Electron-gas interactions in the environmental scanning electron microscopes gaseous detector. Scanning 18, 467-473.
Montes, H., G., Duplay, J., Martinez, L., and Mendoza, C. (2003). Swelling-shrinkage kinetics of MX80 bentonite. Applied Clay Science 22, 279.
Nation, J. L. (1983). A new method using hexamethyldisilazane for preparation of insect soft tissues for scanning electron microscopy. Stain Technology 58, 347-351.
Nix, T., and Feist-Burkhardt, S. (2003). New methods applied to the microstructure analysis of Messel oil shale; confocal laser scanning microscopy (CLSM) and environmental scanning electron microscopy (ESEM). Geological Magazine 140, 469.
Nugent, M. A., Brantley, S. L., Pantano, C. G., and Maurice, P. A. (1998). The influence of natural mineral coatings on feldspar weathering. Nature 395, 588-591.
Parkinson, D., Gray, T. R. G., and Williams, S. T. (1971). "Methods for Studying the Ecology of Soil Micro-organisms." Blackwell Scientific Publications, Oxford.
Rodriguez-Navarro, C., Sebastian, E., Doehne, E., and Ginell, W. S. (1998). The role of sepiolite-palygorskite in the decay of ancient Egyptian limestone sculptures. Clays and Clay Minerals 46, 414.
Rogers, J. R., and Bennett, P. C. (2004). Stimulation of subsurface microorganisms by release of limiting nutrients from silicates. Chemical Geology 203, 91-108.

Imaging bacteria on minerals
77
Rogers, J. R., Bennett, P. C., and Choi, W. J. (1998). Feldspars as a source of nutrients for microorganisms. American Mineralogist 83, 1532-1540.
Roller, C., Wagner, M., Amann, R., Ludwig, W., and Schleifer, K.-H. (1994). In situ probing of gram-positive bacteria with high DNA G+C content using 23S rRNA-targeted oligonucleotides. Microbiology 140, 2849-2858.
Schieber, J., and Arnott, H. J. (2003). Nannobacteria as a by-product of enzyme-driven tissue decay. Geology 31, 717.
Stichburg, M., Gould, W. D., McDFrancis, M., Lortie, L., Benner, S., and Blowes, D. W. (1999). An MPN method for enumeration of iron reducing bacteria. In "14th International Symposium on Environmental Biogeochemistry." Huntsville, Ontario, Canada.
Timofeeff, M. N., Lowenstein, T. K., and Blackburn, W. H. (2000). ESEM-EDS: an improved technique for major element chemical analysis of fluid inclusions. Chemical Geology 164, 171-182.
Umar, R., Umar, A., Khurshid, S., and Ahmad, I. (2001). Microbial contamination in the groundwater of Aligarh City. J. Geological Society of India 58, 157.
Vandevivere, P., and Bevaye, P. (1993). Improved preservation of bacterial exopolymers for scanning electron microscopy. J. Microscopy 167, 323-330.
Ve´ronique Cre´ach, Anne-Claire Baudoux, Georges Bertru, and Rouzic, B. L. (2003). Direct estimate of active bacteria: CTC use and limitations. J. Microbiological Methods 52, 19-28.
Watt, G. R., Griffin, B. J., and Kinny, P. D. (2000). Charge contrast imaging of geological materials in the environmental scanning electron microscope. American Mineralogist 85, 1784-1794.
White, D. C., Bobbie, R. J., King, J. D., Nickels, J. S., and Amoe, P. (1979a). Lipid analysis of sediments for microbial biomass and community structure. In "Methodology for microbial determination and microbial activities in sediments." (C. D. Litchfield, and P. L. Seyfried, Eds.), pp. 87-103. American Society for Testing and Materials, Philadelphia.
White, D. C., Davis, W. M., Nickels, J. S., King, J. D., and Bobbie, R. J. (1979b). Determination of the sedimentary microbial biomass by extractable lipid phosphate. Oecologia 40, 51-62.
Willis, A. T. (1991). Anaerobic culture methods. In "Anaerobic Microbiology." (P. N. Levett, Ed.), pp. 1-12. The Practical Approach Series. Oxford Press, New York.

Bennett et al.
78