counselling for children and young people, 2017/18 · source: counselling for children and young...
TRANSCRIPT

Statistician: Steve Hughes ~ 0300 025 5060 ~ [email protected]
Enquiries from the press: 0300 025 8099 Public enquiries : 0300 025 5050 Twitter: @statisticswales
Counselling for Children and Young People, 2017/18 28 March 2019
SFR 18/2019
Local authorities in Wales are required to make reasonable provision of
independent counselling services for children and young people aged between
11 and 18 on the site of each secondary school that it maintains and for pupils
in Year 6 of primary school. A local authority may in addition offer counselling
services at other locations, e.g. at independent schools, further education
colleges or at other community facilities.
Local authorities are required to provide anonymised information about their
counselling services to the Welsh Government. This data informs the
development of counselling services for children and young people in Wales.
Chart 1: Number of children and young people who received counselling in Wales, by gender, 2017/18
Males4,24737%
Females7,11863%
11,365 in
2017/18
• 85 per cent of all children and young people who received counselling were
between the Year 7 and Year 11 age groups in 2017/18.
• The most common form of referral was by school-based and other education
staff, accounting for nearly half of all referrals.
• Family issues were the most common form of presenting issue and
predominant issue.
About this release
This release covers the
counselling services
provided by local
authorities for children
and young people.
Data are shown for
Wales and at local
authority level.
YP Core scores have
been reintroduced as all
local authorities have
submitted comparable
data.
In this release
Gender, local authority,
form of referral, age
group and ethnicity 3
Presenting and
predominant issues 10
Average YP Core
scores 14
Onward referrals 16
Counselling sessions
attended 17
Key quality
information 18

2
Contents
Page
Section 1 Children and young people receiving counselling by gender, local authority,
form of referral, age group and ethnicity 3
Chart 2 Number of children and young people who received counselling in Wales 3
Chart 3 Number of children and young people (per 100 of resident 10-18 year olds) who
received counselling in Wales by local authority, 2017/18 4
Table 1 Number of children and young people who received counselling (excluding online
counselling) in Wales, by local authority, 2017/18 5
Chart 4 Number of children and young people who received counselling in Wales by form
of referral 6
Chart 5 Form of referral of children and young people who received counselling by gender
in 2017/18 7
Chart 6 Number of children and young people who received counselling in Wales by
school year age group 8
Chart 7 Number of children and young people who received counselling in Wales by
gender and school year age group in 2017/18 9
Table 2 Number and percentage of children and young people who received counselling
in Wales, by ethnic background 9
Section 2 Presenting and predominant issues 10
Chart 8 Main presenting issues for children and young people who received counselling in
Wales in 2017/18 10
Table 3 All presenting issues for children and young people who received counselling in
Wales in 2017/18 11
Chart 9 Main predominant issues for children and young people who received counselling
in Wales in 2017/18 12
Table 4 All predominant issues of children and young people who received counselling in
Wales in 2017/18 13
Section 3 Average YP Core scores 14
Chart 10 Average improvement in YP Core score for children and young people who
received counselling in Wales by local authority in 2017/18 14
Table 5 Average YP Core score for children and young people who received counselling
in Wales by local authority in 2017/18 15
Section 4 Onward referrals 16
Chart 11 Onward referrals of children and young people who received counselling in Wales
in 2017/18 16
Table 6 Onward referrals of children and young people who received counselling in Wales
in 2017/18 16
Section 5 Counselling sessions attended 17
Chart 12 Average number of counselling sessions attended by children and young people
in Wales who received counselling 17
Chart 13 Average number of counselling sessions attended by children and young people
in Wales who received counselling in Wales by local authority in 2017/18 17
Key quality information 18

3
Counselling in this context gives children and young people the opportunity to talk face to face with
a counsellor about their worries and concerns, to work through difficult feelings so that they can
learn to manage them. Where appropriate counselling may lead to a referral to another service
(e.g. Child and Adolescent Mental Health Services (CAMHS), child protection services).
All charts and tables below relate to face to face counselling only.
Section 1: Children and young people receiving counselling by gender, local authority, form of referral, age group and ethnicity
Chart 2: Number of children and young people who received counselling in Wales
11,337 11,558 11,365
0
2,000
4,000
6,000
8,000
10,000
12,000
14,000
2015/16 2016/17 2017/18
Source: Counselling for children and young people, Welsh Government
11,365 children or young people received counselling services in 2017/18, similar to the
previous two years.
Females accounted for 63 per cent or 7,118 of the 11,365 children and young people who
received counselling in 2017/18, compared to 37 per cent or 4,247 males (Chart 1).
The gender split of 63 per cent female, 37 per cent male is similar to the previous two
years.

4
Chart 3: Number of children and young people (per 100 of resident 10-18 year olds) who received counselling in Wales by local authority, 2017/18 (a)
1.32.12.2
2.52.9
3.03.0
3.23.2
3.33.43.5
3.74.2
4.44.4
5.45.45.45.55.5
6.0
0.0 1.0 2.0 3.0 4.0 5.0 6.0 7.0
CaerphillyPowys
FlintshireCardiff
BridgendIsle of Anglesey/Gwynedd
Vale of GlamorganNeath Port Talbot
NewportConwy
WrexhamDenbighshire
WalesBlaenau Gwent
CeredigionMonmouthshire
Rhondda Cynon TafPembrokeshire
Merthyr TydfilSwansea
CarmarthenshireTorfaen
Source: Counselling for children and young people, Welsh Government
(a) Population estimates obtained from 2017 Mid-year population estimates produced by the Office for National Statistics.
3.7 children and young people per 100 of resident 10-18 year olds received counselling in
Wales in 2017/18.
Torfaen had the highest rate of children and young people per 100 of resident 10-18 year
olds who received counselling (6.0 in 2017/18, Chart 3).
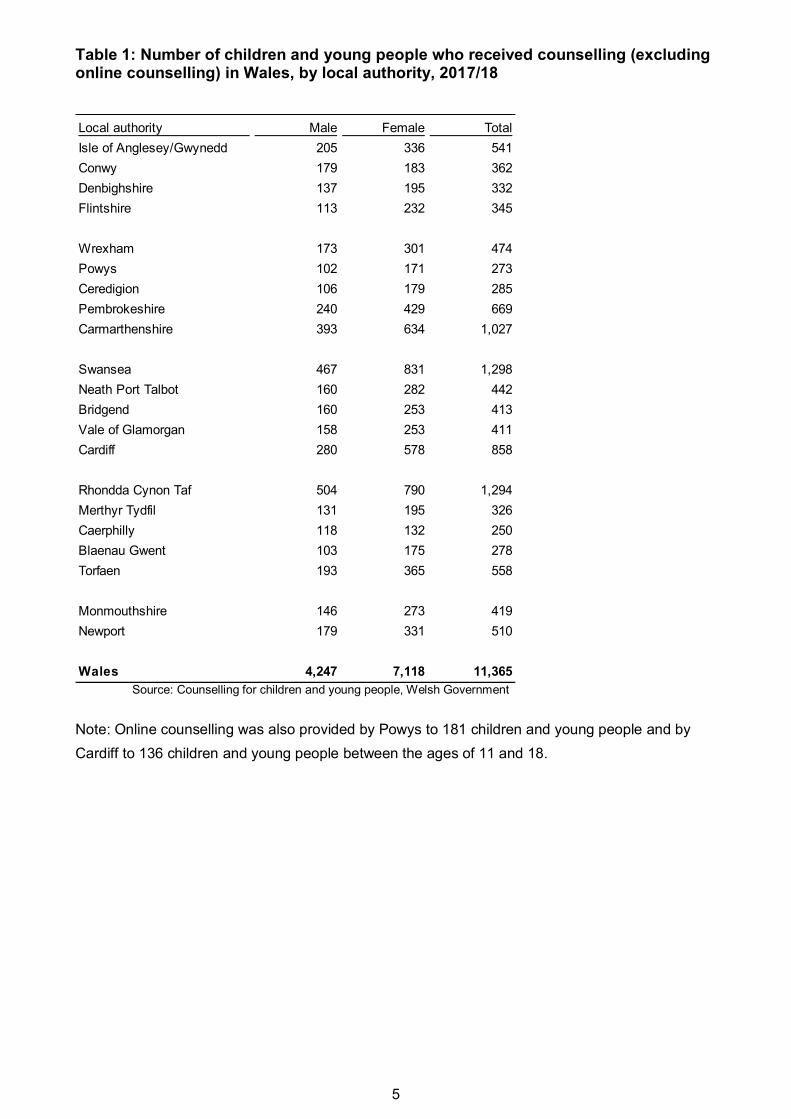
Swansea had the most children and young people who received counselling (1,298 in
2017/18, Table 1).
Caerphilly had the lowest rate of children and young people per 100 of resident 10-18 year
olds who received counselling (1.3 in 2017/18, Chart 3).
Caerphilly had the fewest children and young people who received counselling (250 in
2017/18, Table 1).
5
Table 1: Number of children and young people who received counselling (excluding online counselling) in Wales, by local authority, 2017/18
Local authority Male Female Total
Isle of Anglesey/Gwynedd 205 336 541
Conwy 179 183 362
Denbighshire 137 195 332
Flintshire 113 232 345
Wrexham 173 301 474
Powys 102 171 273
Ceredigion 106 179 285
Pembrokeshire 240 429 669
Carmarthenshire 393 634 1,027
Swansea 467 831 1,298
Neath Port Talbot 160 282 442
Bridgend 160 253 413
Vale of Glamorgan 158 253 411
Cardiff 280 578 858
Rhondda Cynon Taf 504 790 1,294
Merthyr Tydfil 131 195 326
Caerphilly 118 132 250
Blaenau Gwent 103 175 278
Torfaen 193 365 558
Monmouthshire 146 273 419
Newport 179 331 510
Wales 4,247 7,118 11,365 Source: Counselling for children and young people, Welsh Government
Note: Online counselling was also provided by Powys to 181 children and young people and by
Cardiff to 136 children and young people between the ages of 11 and 18.
6
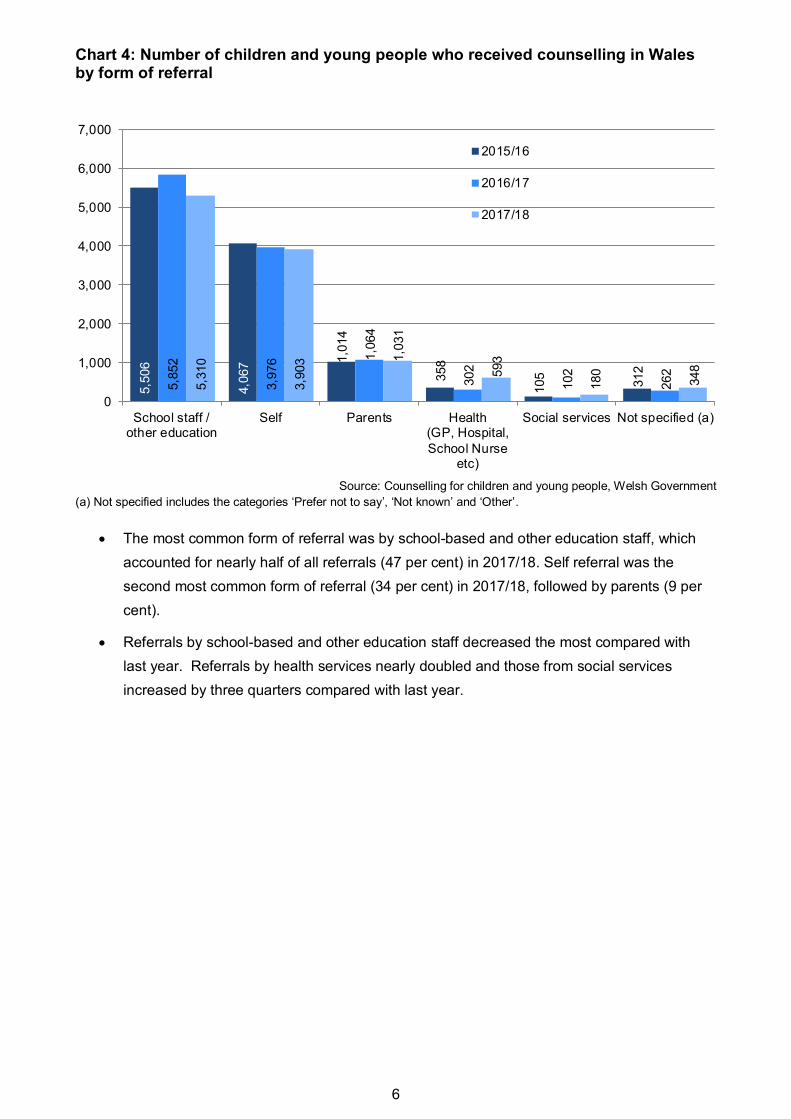
Chart 4: Number of children and young people who received counselling in Wales by form of referral
5,5
06
4,0
67
1,0
14
358
105
312
5,8
52
3,9
76 1,0
64
302
102
262
5,3
10
3,9
03 1,0
31
593
180
348
0
1,000
2,000
3,000
4,000
5,000
6,000
7,000
School staff /other education
Self Parents Health(GP, Hospital,
School Nurseetc)
Social services Not specified (a)
2015/16
2016/17
2017/18
Source: Counselling for children and young people, Welsh Government
(a) Not specified includes the categories ‘Prefer not to say’, ‘Not known’ and ‘Other’.
The most common form of referral was by school-based and other education staff, which
accounted for nearly half of all referrals (47 per cent) in 2017/18. Self referral was the
second most common form of referral (34 per cent) in 2017/18, followed by parents (9 per
cent).
Referrals by school-based and other education staff decreased the most compared with
last year. Referrals by health services nearly doubled and those from social services
increased by three quarters compared with last year.

7
Chart 5: Form of referral of children and young people who received counselling by gender in 2017/18
2,1
73
1,2
30
443 197
61
143
3,1
37
2,6
73
588
396 119
205
0
500
1,000
1,500
2,000
2,500
3,000
3,500
School staff /other education
Self Parents Health(GP, Hospital,
School Nurseetc)
Social services Not specified (a)
Males Females
Source: Counselling for children and young people, Welsh Government
(a) Not specified includes the categories ‘Prefer not to say’, ‘Not known’ and ‘Other’.
Males and females attending counselling displayed a similar trend in their form of referral,
with referral by school-based and other education staff the most common, followed by self
referral for both males and females.
However, males were more likely to have been referred by school-based and other
education staff (51 per cent of all male referrals) compared to their female counterparts (44
per cent of all female referrals).
Conversely, females were more likely to refer themselves (38 per cent of all female
referrals) compared to their male counterparts (29 per cent of all male referrals).

8
Chart 6: Number of children and young people who received counselling in Wales by school year age group
547
1,6
77
2,0
83
2,2
31
2,1
82
1,8
17
472
369
180
566
1,6
13
2,0
41
2,2
00
2,1
36
1,7
20
519
359
211
0
500
1,000
1,500
2,000
2,500
Year 6 Year 7 Year 8 Year 9 Year 10 Year 11 Year 12 Year 13 Not known
2016/17 2017/18
Source: Counselling for children and young people, Welsh Government
The Year 9 age group (for the most part, these are children aged 13-14 who are assessed
for Key Stage 3) had the highest number of children and young people who received
counselling, followed by the Year 10 age group in 2017/18. The Year 13 age group (that is,
those young people in sixth form or having left school) had the lowest number.
The Year 9 age group accounted for 19 per cent of all children and young people who
received counselling in 2017/18.
85 per cent of all children and young people who received counselling were between the
Year 7 and Year 11 age groups in 2017/18, although this is primarily driven by trends
across age in counselling for females as illustrated in the following section.
The number of children and young people who received counselling increased slightly
compared with last year for Year 6 and Year 12. The number who received counselling
decreased slightly in all other year groups.

9
Chart 7: Number of children and young people who received counselling in Wales by gender and school year age group in 2017/18
317
743
826
696
704
610 1
50
108
93
249
870
1,2
15
1,5
04
1,4
32
1,1
10
369
251 118
0
200
400
600
800
1,000
1,200
1,400
1,600
Year 6 Year 7 Year 8 Year 9 Year 10 Year 11 Year 12 Year 13 Not known
Males Females
Source: Counselling for children and young people, Welsh Government
There were more females than males who received counselling in all year groups, with the
exception of the Year 6 age group.
From Year 7 to Year 11 the number of males who attended counselling remained relatively
steady, between 600 and 850 in each year group. However, the number of females
increased considerably from Year 7 to Year 9 compared to their male counterparts, to a
peak in Year 9 of 1,504 females.
Table 2: Number and percentage of children and young people who received counselling in Wales, by ethnic background
Ethnic Background Number Per cent Number Per cent Number Per cent
White 10,827 95.5 10,999 95.2 10,838 95.4
Mixed Race 217 1.9 222 1.9 231 2.0
Asian or Asian British 94 0.8 122 1.1 128 1.1
Black or Black British 47 0.4 44 0.4 45 0.4
Chinese or Chinese British 13 0.1 12 0.1 17 0.1
Any other ethnic background 71 0.6 68 0.6 60 0.5
Not known 68 0.6 91 0.8 46 0.4
Total 11,337 100.0 11,558 100.0 11,365 100.0
2017/182015/16 2016/17
Source: Counselling for children and young people, Welsh Government
The majority (95 per cent) of children and young people who received counselling classified
themselves as white in 2017/18. The distribution seen in Table 2 is broadly representative
of the distribution of young people in the wider school population.
10
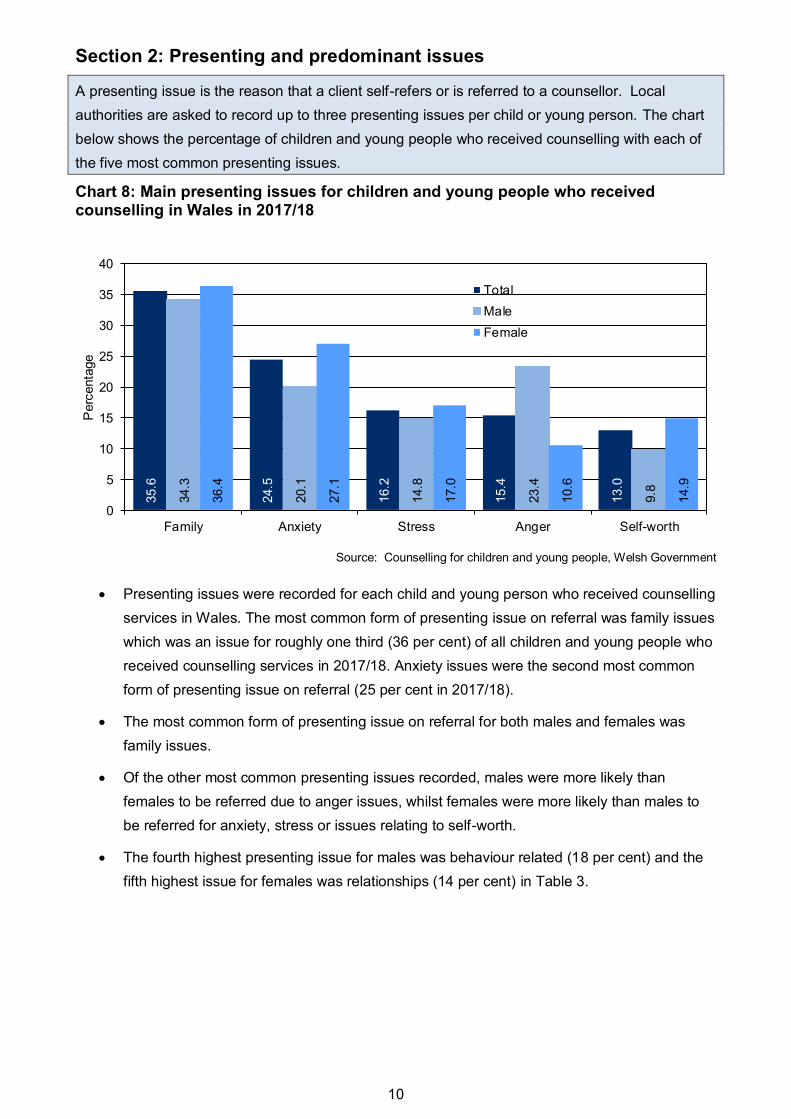
Section 2: Presenting and predominant issues
A presenting issue is the reason that a client self-refers or is referred to a counsellor. Local
authorities are asked to record up to three presenting issues per child or young person. The chart
below shows the percentage of children and young people who received counselling with each of
the five most common presenting issues.
Chart 8: Main presenting issues for children and young people who received counselling in Wales in 2017/18
35.6
24.5
16.2
15.4
13.0
34.3
20.1
14.8
23.4
9.8
36.4
27.1
17.0
10.6
14.9
0
5
10
15
20
25
30
35
40
Family Anxiety Stress Anger Self-worth
Perc
enta
ge
Total
Male
Female
Source: Counselling for children and young people, Welsh Government
Presenting issues were recorded for each child and young person who received counselling
services in Wales. The most common form of presenting issue on referral was family issues
which was an issue for roughly one third (36 per cent) of all children and young people who
received counselling services in 2017/18. Anxiety issues were the second most common
form of presenting issue on referral (25 per cent in 2017/18).
The most common form of presenting issue on referral for both males and females was
family issues.
Of the other most common presenting issues recorded, males were more likely than
females to be referred due to anger issues, whilst females were more likely than males to
be referred for anxiety, stress or issues relating to self-worth.
The fourth highest presenting issue for males was behaviour related (18 per cent) and the
fifth highest issue for females was relationships (14 per cent) in Table 3.

11
Table 3: All presenting issues for children and young people who received counselling in Wales in 2017/18 (a)
Number Per cent Number Per cent Number Per cent
Family 1,456 34.3 2,588 36.4 4,044 35.6
Anxiety 854 20.1 1,931 27.1 2,785 24.5
Stress 630 14.8 1,210 17.0 1,840 16.2
Anger 994 23.4 753 10.6 1,747 15.4
Self-worth 416 9.8 1,064 14.9 1,480 13.0
Behaviour related 782 18.4 585 8.2 1,367 12.0
Relationships other 392 9.2 967 13.6 1,359 12.0
Depression 351 8.3 765 10.7 1,116 9.8
Bereavement 425 10.0 675 9.5 1,100 9.7
Bullying 321 7.6 490 6.9 811 7.1
Self-harm 151 3.6 652 9.2 803 7.1
Academic 181 4.3 261 3.7 442 3.9
Suicide 179 4.2 244 3.4 423 3.7
Other 140 3.3 273 3.8 413 3.6
Abuse (including sexual) 108 2.5 229 3.2 337 3.0
Relationship with boyfriend/girlfriend 69 1.6 178 2.5 247 2.2
Illness 81 1.9 140 2.0 221 1.9
Relationships with teachers 104 2.4 115 1.6 219 1.9
Domestic abuse 49 1.2 99 1.4 148 1.3
Eating disorders 22 0.5 112 1.6 134 1.2
Sexual (including orientation) 46 1.1 70 1.0 116 1.0
Not known 44 1.0 55 0.8 99 0.9
Caring responsibility 19 0.4 74 1.0 93 0.8
Transgender issues 25 0.6 44 0.6 69 0.6
Substance misuse 28 0.7 34 0.5 62 0.5
Financial concerns/poverty 18 0.4 25 0.4 43 0.4
Other (a) 7 0.2 23 0.3 30 0.3
Not known 9 0.2 3 0.0 12 0.1
Presenting issues on referral
Male Female Total
Source: Counselling for children and young people, Welsh Government
(a) Local authorities can record up to three presenting issues per child or young person. This table shows the number
and percentage of children and young people with each issue. Therefore the percentages do not add up to 100.

12
A predominant issue is the underlying issue(s) that is identified during the counselling process. For
example, a young person’s presenting issue may be anger, but through the counselling process,
he/she may come to realise that the predominant issue is family relationships. Local authorities are
asked to record up to three predominant issues per child or young person. The chart below shows
the percentage of children and young people who received counselling with each of the five most
common predominant issues.
Chart 9: Main predominant issues for children and young people who received counselling in Wales in 2017/18
39.4
24.6
16.9
14.8
13.8
37.3
20.7
12.6
13.4
21.0
40.7
26.8
19.5
15.7
9.6
0
5
10
15
20
25
30
35
40
45
Family Anxiety Self-worth Stress Anger
Perc
enta
ge
Total
Male
Female
Source: Counselling for children and young people, Welsh Government
The most common form of predominant issue was family issues which was an issue for
nearly four in ten (39 per cent) of all children and young people who received counselling
services in 2017/18. Anxiety (25 per cent) and self-worth (17 per cent) issues were the next
most common forms of predominant issue in 2017/18.
Similarly to presenting issues, the most common form of predominant issue for both males
and females was family issues.
Of the other most common predominant issues recorded, males were more likely than
females to be referred due to anger issues, whilst females were more likely than males to
be referred for anxiety, stress or issues relating to self-worth.
The fourth highest predominant issue for males was behaviour related (16 per cent) and the
fifth highest issue for females was relationships (15 per cent) in Table 4.

13
Table 4: All predominant issues of children and young people who received counselling in Wales in 2017/18(a)
Number Per cent Number Per cent Number Per cent
Family 1,584 37.3 2,897 40.7 4,481 39.4
Anxiety 880 20.7 1,911 26.8 2,791 24.6
Self-worth 534 12.6 1,387 19.5 1,921 16.9
Stress 567 13.4 1,117 15.7 1,684 14.8
Anger 893 21.0 681 9.6 1,574 13.8
Relationships other 476 11.2 1,035 14.5 1,511 13.3
Behaviour related 684 16.1 434 6.1 1,118 9.8
Bereavement 403 9.5 660 9.3 1,063 9.4
Depression 298 7.0 615 8.6 913 8.0
Bullying 331 7.8 462 6.5 793 7.0
Self-harm 132 3.1 561 7.9 693 6.1
Other 170 4.0 306 4.3 476 4.2
Academic 167 3.9 270 3.8 437 3.8
Suicide 105 2.5 204 2.9 309 2.7
Abuse (including sexual) 81 1.9 226 3.2 307 2.7
Relationships with teachers 143 3.4 141 2.0 284 2.5
Relationship with boyfriend/girlfriend 80 1.9 186 2.6 266 2.3
Illness 83 2.0 141 2.0 224 2.0
Not Known 85 2.0 131 1.8 216 1.9
Eating disorders 31 0.7 109 1.5 140 1.2
Domestic abuse 38 0.9 88 1.2 126 1.1
Sexual (including orientation) 42 1.0 81 1.1 123 1.1
Caring responsibility 26 0.6 65 0.9 91 0.8
Transgender issues 27 0.6 53 0.7 80 0.7
Finanical concerns/poverty 20 0.5 43 0.6 63 0.6
Substance misuse 21 0.5 26 0.4 47 0.4
Other 7 0.2 24 0.3 31 0.3
Not Known * * * * 8 0.1
Predominant issues in counselling
Male Female Total
Source: Counselling for children and young people, Welsh Government
(a) Local authorities can record up to three predominant issues per child or young person. This table shows the number
and percentage of children and young people with each issue. Therefore the percentages do not add up to 100.
* The data item is suppressed due to disclosure.

14
Section 3: Average YP Core scores
YP Core is a measure of psychological distress reported by young people, both before and after
counselling. For further information on the form completed by young people please refer to the
following link: Form
Chart 10: Average improvement in YP Core score for children and young people who received counselling in Wales by local authority in 2017/18
4.04.7
5.15.3
5.66.2
6.47.07.07.0
7.88.08.1
8.48.4
8.89.29.39.39.4
9.7
0.0 2.0 4.0 6.0 8.0 10.0 12.0
Isle of Anglesey/GwyneddCardiff
CaerphillyVale of Glamorgan
BridgendNeath Port Talbot
PembrokeshireCeredigion
WrexhamTorfaen
CarmarthenshireConwy
DenbighshireSwansea
Rhondda Cynon TafPowys
Merthyr TydfilMonmouthshireBlaenau Gwent
NewportFlintshire
Source: Counselling for children and young people, Welsh Government
Flintshire had the largest average improvement in YP Core score amongst children and
young people who received counselling in 2017/18 (an improvement in YP Core score of
9.7, Chart 10).
Isle of Anglesey/Gwynedd had the smallest average improvement in YP Core score
amongst children and young people who received counselling in 2017/18 (an improvement
in average YP Core score of 4.0, Chart 10).

15
Table 5: Average YP Core score for children and young people who received counselling in Wales by local authority in 2017/18
Local authority Average score at start Average score at end
Average improvement
in score
Isle of Anglesey/Gwynedd 16.5 12.5 4.0
Conwy 17.9 9.9 8.0
Denbighshire 18.3 10.3 8.1
Flintshire 18.2 8.5 9.7
Wrexham 19.0 12.0 7.0
Powys 18.9 10.1 8.8
Ceredigion 20.0 13.1 7.0
Pembrokeshire 18.7 12.3 6.4
Carmarthenshire 19.7 11.8 7.8
Swansea 20.9 12.5 8.4
Neath Port Talbot 19.3 13.1 6.2
Bridgend 17.7 12.0 5.6
Vale of Glamorgan 18.3 13.0 5.3
Cardiff 19.6 14.9 4.7
Rhondda Cynon Taf 19.4 11.0 8.4
Merthyr Tydfil 20.0 10.8 9.2
Caerphilly 16.1 11.0 5.1
Blaenau Gwent 18.1 8.8 9.3
Torfaen 21.5 14.5 7.0
Monmouthshire 23.0 13.8 9.3
Newport 22.8 13.4 9.4 Source: Counselling for children and young people, Welsh Government
16
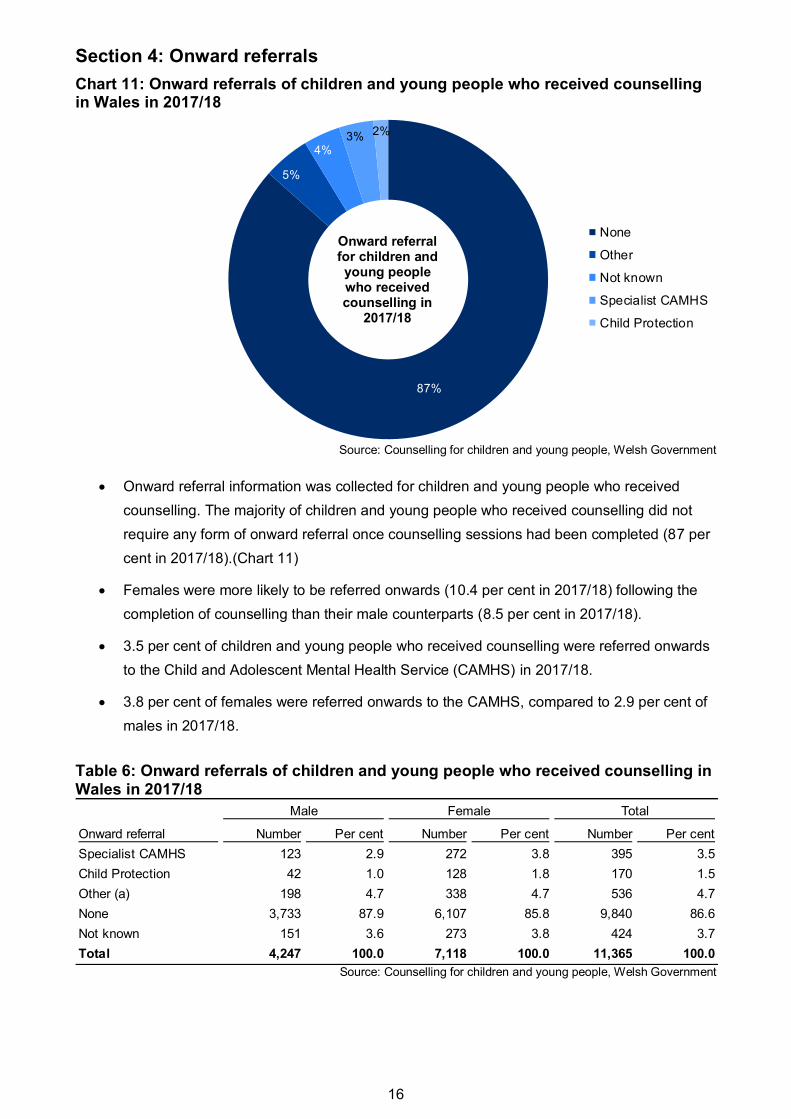
Section 4: Onward referrals
Chart 11: Onward referrals of children and young people who received counselling in Wales in 2017/18
87%
5%
4%3% 2%
None
Other
Not known
Specialist CAMHS
Child Protection
Source: Counselling for children and young people, Welsh Government
Onward referral information was collected for children and young people who received
counselling. The majority of children and young people who received counselling did not
require any form of onward referral once counselling sessions had been completed (87 per
cent in 2017/18).(Chart 11)
Females were more likely to be referred onwards (10.4 per cent in 2017/18) following the
completion of counselling than their male counterparts (8.5 per cent in 2017/18).
3.5 per cent of children and young people who received counselling were referred onwards
to the Child and Adolescent Mental Health Service (CAMHS) in 2017/18.
3.8 per cent of females were referred onwards to the CAMHS, compared to 2.9 per cent of
males in 2017/18.
Table 6: Onward referrals of children and young people who received counselling in Wales in 2017/18
Number Per cent Number Per cent Number Per cent
Specialist CAMHS 123 2.9 272 3.8 395 3.5
Child Protection 42 1.0 128 1.8 170 1.5
Other (a) 198 4.7 338 4.7 536 4.7
None 3,733 87.9 6,107 85.8 9,840 86.6
Not known 151 3.6 273 3.8 424 3.7
Total 4,247 100.0 7,118 100.0 11,365 100.0
Onward referral
Male Female Total
Source: Counselling for children and young people, Welsh Government
Onward referral for children and young people who received counselling in
2017/18

17
Section 5: Counselling sessions attended
Chart 12: Average number of counselling sessions attended by children and young people in Wales who received counselling
5.15.4 5.3
5.2 5.2
0
1
2
3
4
5
6
2013/14 2014/15 2015/16 2016/17 2017/18
Source: Counselling for children and young people, Welsh Government
In 2017/18 the average number of counselling sessions attended by children and young
people who received counselling in Wales was 5.2, the same as in 2016/17.
Chart 13: Average number of counselling sessions attended by children and young people in Wales who received counselling in Wales by local authority in 2017/18
3.73.8
4.24.4
4.64.74.74.74.74.7
5.05.2
5.45.4
5.65.7
5.96.0
6.66.7
6.98.4
0.0 1.0 2.0 3.0 4.0 5.0 6.0 7.0 8.0 9.0
Blaenau GwentConwy
Rhondda Cynon TafMonmouthshire
TorfaenNeath Port Talbot
FlintshireMerthyr Tydfil
PembrokeshireSwansea
Vale of GlamorganWalesCardiff
Isle of Anglesey/GwyneddCarmarthenshire
NewportDenbighshire
BridgendCeredigionCaerphilly
PowysWrexham
Source: Counselling for children and young people, Welsh Government
There was considerable variation in the average number of counselling sessions per child
or young person, from 3.7 sessions in Blaenau Gwent to 8.4 in Wrexham.

18
Key Quality Information
Policy and operational context
Counselling in this context gives children and young people the opportunity to talk face to face with
a counsellor about their worries and concerns, to work through difficult feelings so that they can
learn to manage them. Where appropriate counselling may lead to a referral to another service
(e.g. CAMHS, child protection).
The School Standards and Organisation (Wales) Act 2013 requires a Local Authority to provide an
independent counselling service on the site of each secondary school that it maintains. A Local
Authority may in addition offer counselling services at other locations, e.g. at independent schools
or at a local community centre, youth centre or other community facility for young persons who are
not in school and/or wish to access counselling outside of a formal education setting.
School Standards and Organisation (Wales) Act 2013
The School Standards and Organisation (Wales) Act 2013 became law in Wales on 4 March 2013.
The purpose of the Act sets out proposals to strengthen school standards, enhance local
determination and reduce complexity. Under Section 92 of the School Standards and Organisation
(Wales) Act 2013, local authorities are required to make reasonable provision of independent
counselling services for children and young people aged between 11 and 18 and pupils in Year 6
of primary school. Under Section 93 local authorities are required to provide anonymised
information about these counselling services to the Welsh Government, in compliance with a
direction issued by the Welsh Ministers under Section 93 of the 2013 Act.
Where a local authority has arranged for a person to provide an independent counselling service
on its behalf, the authority must give the person a copy of the Welsh Ministers’ direction and that
person must compile the information necessary for compliance with the direction and submit it to
the local authority.
Further information on the School Standards and Organisation (Wales) Act 2013 is available by
following the link below:
School Standards and Organisation (Wales) Act 2013
Data source and coverage
This is an annual collection that Local Authorities are required to provide to the Welsh
Government.
The local authorities Isle of Anglesey and Gwynedd provide a joint data collection return, therefore
the data for these local authorities cannot be shown separately.
Figures are based on the numbers of children and young people who have received face to face
counselling and have finished their episode(s) of counselling during the period.
The age group of those children and young people who received counselling is based on their
school year rather than actual age. Please note not all the children and young people who receive
19
counselling are school pupils. Where this occurs these children and young people are included in
the school year age group they would typically attend if they were in school.
Due to the sensitivity of the data it must be transferred to the Welsh Government via a secure
medium and also held in a secure environment. The secure medium for transferring the data is
AFON.
The local authority, or the person who provides the counselling service, must not provide
information about an identified individual or provide information in such a way (either by itself or
combined with other information) that it identifies an individual or enables an individual to be
identified.
Further information on the data requirements is available in ‘Statutory guidance to Welsh local
authorities on the provision of independent counselling services’.
Who are the key users of this data?
These statistics are used widely both within and outside the Welsh Government. Some of the key
users are:
ministers and the Members Research Service in the National Assembly for Wales;
other government departments;
local authorities;
local Health Boards including Child and Adolescent Mental Health Services (CAMHS)
the Department for Education and Skills in the Welsh Government;
other areas of the Welsh Government;
the research community;
students, academics and universities;
individual citizens and private companies.
What are the data used for?
These statistics are used in a variety of ways. Some examples of these are:
advice to Ministers;
to inform the education policy decision-making process in Wales;
to assist in research in counselling for children and young people.
to monitor and evaluate counselling services in Wales, at a local level and at a national
level. Local authorities can use the data they collect to monitor and evaluate the counselling
services provided in their area, in order to drive service improvement.
to identify key issues and concerns for children and young people which can impinge on
their mental health.

20
Quality
Our statistics are produced to high professional standards set out in the Code of Practice for
Official Statistics. They undergo regular quality assurance reviews to ensure that they meet
customer needs. They are produced free from any political interference.
This Release is no longer labelled Experimental Statistics as there is a settled data collection,
identical in approach for the past 3 years. This has enabled year on year comparisons and allowed
any outliers in the data to be followed up. There has been engagement with the sector where data
and data collection have been discussed. In addition guidance has been further developed with
input from Local Authorities and those contracted to undertake the work.
Timeliness and punctuality
Local authorities, and their counselling providers where applicable, compile aggregated data on
children and young people accessing counselling and submit that data to the Welsh Government.
Information compiled for each academic school year is required to be provided by 31 October
following the end of the academic school year. The returns are then validated by the Welsh
Government and published in a statistical release in March.
Accessibility and clarity
This Statistical First Release is pre-announced and then published on the Statistics and Research
section of the Welsh Government website. It is accompanied by more detailed tables on
StatsWales, a free to use service that allows visitors to view, manipulate, create and download
data.
Comparability and coherence
Since 2014 there has been considerable work on guidance and definitions to ensure consistency
between authorities, to clarify some known issues, and reflect current policy. For this reason
comparisons with data prior to 2015/16 should be treated with considerable caution.
There are no official statistics published by other UK countries on counselling for children and
young people.
Well-being of Future Generations Act (WFG)
The Well-being of Future Generations Act 2015 is about improving the social, economic,
environmental and cultural well-being of Wales. The Act puts in place seven well-being goals for
Wales. These are for a more equal, prosperous, resilient, healthier and globally responsible Wales,
with cohesive communities and a vibrant culture and thriving Welsh language. Under section
(10)(1) of the Act, the Welsh Ministers must (a) publish indicators (“national indicators”) that must
be applied for the purpose of measuring progress towards the achievement of the Well-being
goals, and (b) lay a copy of the national indicators before the National Assembly. The 46 national
indicators were laid in March 2016.

21
Information on the indicators, along with narratives for each of the well-being goals and associated
technical information is available in the Well-being of Wales report.
Further information on the Well-being of Future Generations (Wales) Act 2015.
The statistics included in this release could also provide supporting narrative to the national
indicators and be used by public services boards in relation to their local well-being assessments
and local well-being plans.
Further details
The document is available at:
https://gov.wales/counselling-children-and-young-people-september-2017-august-2018
Next update
March 2020 (provisional)
We want your feedback
This is the fourth edition of this release; we would therefore welcome comments from users of our
publication on the content and presentation of this publication. If you have any comments or
require further information, please contact us.
We welcome any feedback on any aspect of these statistics which can be provided by email to
Open Government Licence
All content is available under the Open Government Licence v3.0, except where otherwise stated.