council meeting 11 june 2013 annual community survey · 11 june 2013 annual community survey...
TRANSCRIPT

Council Meeting
11 June 2013
Annual Community Survey
Attachment A p3 Attachment B p10 Attachment C p15 Attachment D p98 Attachment E p127
1

2

8531 Burnside Annual Community Survey QUEST V2 Page 1 of 7
8531 CITY OF BURNSIDE ANNUAL COMMUNITY SURVEY FEBRUARY 2013 ALLFILE Q99STRT "PHONE: _[Q0PH]_ Previously contacted [Q0DAT2] [Q0TIM2] [Q0HIS] [Q0DAT] [Q0TIM] [Q0COM] ATTEMPT: [Q0CAL]" Q88DUM =0 Q77P PREAMBLE "Good afternoon/evening, my name is _[Q0IV]_ from Harrison Research. We are conducting a survey on behalf of Burnside City Council about the four strategic directions which Council will implement over the next 13 years. In the process, we are speaking with people who reside in the City of Burnside and would like to provide their perceptions of Council’s service delivery performance. _ IF NECESSARY, SAY:_ This is genuine research and I guarantee we are not trying to sell you anything. _IF NECESSARY, SAY:_ If you like you can confirm this by calling the Customer Service Desk at Council on 83664200 and I can call back later. _SCREEN 1:_ Do you live in the Burnside Council area? _IF NO, THANK AND TERMINATE_ _SCREEN 2:_ Does anyone in this household work in market research or for the City of Burnside either as a staff member or an Elected Member? _IF YES, THANK AND NOTE_ Is there anyone living in this household aged 18-24? _IF YES, ASK TO SPEAK WITH THEM OR ARRANGE CALLBACK - IF MORE THAN ONE, ASK FOR ONE WITH LAST BIRTHDAY - RE-INTRODUCE AS REQUIRED - USE UNTIL THIS AGE QUOTA IS FULL_ _IF NO, OR IF 18-24 QUOTA FULL:_ Please may I speak to the person in the household, aged 18 and over, who was the last to have a birthday? _REINTRODUCE OR CALLBACK AS NECESSARY_" PAUSE "The survey will take about 18 minutes to go through, depending on your answers. _IF THEY'RE HESITATING BECAUSE OF TIME_ We do need to get opinions from as wide a cross-section as possible; I could call back later if it would be more convenient. _ARRANGE CALLBACK IF REQUIRED OR CONTINUE_
3

8531 Burnside Annual Community Survey QUEST V2 Page 2 of 7
_IF CONCERNED ABOUT PRIVACY_ I assure you that any information you give will remain confidential. Any identifying information, such as this phone number, is removed before we analyse the results. No one's individual answers can be passed on to our clients or anyone else. And before we start, I just need to let you know that this call may be monitored by my supervisor for training and coaching purposes. May we begin? Thank you." START Q1. URBAN FORM AND LIVING SPACES
"Q1 Thinking first about planning and infrastructure in the council area, please rate how satisfied you are that Council has performed each of the following services or facilities, using a 0 to 10 scale where 0 means extremely dissatisfied and 10 means extremely satisfied. How would you rate ……………?”
READ OUT 1-11, RND 1. The overall planning of the City 2. Protecting the built and natural heritage 3. Providing passive recreation opportunities, such as walking, picnic locations or pursuing hobbies 4. Providing active recreation opportunities, such as playing organised sport or outdoor games 5. Providing and maintaining parks and reserves 6. Providing and maintaining playgrounds 7. Providing and maintaining local roads 8. Providing and maintaining footpaths 9. Providing and maintaining street trees 10. Providing and maintaining cycle paths and walking trails 11. Provision and management of traffic and parking in the City NUM, 0-10, DK FOR EACH Q2 IMPROVEMENTS TO URBAN FORM & LIVING SPACES “Q2 Are there any ways in which these areas of Council business could be improved?” 1. Suggestion made (Q201 SPECIFY) 2. Nothing further to add 3. Don’t know / can’t say Q201 IMPROVEMENTS TO URBAN FORM & LIVING SPACES Q3. PROTECTED AND VALUED ENVIRONMENT “Q3. Thinking now about the environment, how satisfied are you with the way Council has performed each of the following services or facilities. Using the same 0 to 10 scale where 0 means extremely dissatisfied and 10 means extremely satisfied, how would you rate ……………?” READ OUT 1-6, RND 1. Preparation for and support of residents for bushfire management 2. Restoring and protecting the City’s biodiversity 3. Water Management initiatives 4. Garbage and green waste management 5. Hard waste and Electronic waste management 6. After hours and hazard response management NUM, 0-10, DK FOR EACH Q4. IMPROVEMENTS TO OUR PROTECTED AND VALUED ENVIRONMENT “Q4 Are there any ways in which these areas of Council business could be improved?” 1. Suggestion made (Q401 SPECIFY)
4

8531 Burnside Annual Community Survey QUEST V2 Page 3 of 7
2. Nothing further to add 3. Don’t know / can’t say Q401 IMPROVEMENTS TO PROTECTED AND VALUED ENVIRONMENT Q5. DIVERSE, SUPPORTIVE, HAPPY AND HEALTHY PEOPLE “Q5. Thinking now about supporting the community, how satisfied are you with the way Council has performed each of the following services or facilities. Using the same 0 to 10 scale where 0 means extremely dissatisfied and 10 means extremely satisfied, how would you rate ……………?” READ OUT 1-10, RND 1. Support for local businesses 2. Community and cultural activities 3. Providing public and environmental health services 4. Providing services for older residents 5. Providing services for younger residents 6. Providing services for families 7. Presentation and cleanliness of the City 8. Providing animal and pest management services 9. Providing a community bus service 10. Providing library services NUM, 0-10, DK FOR EACH Q6. IMPROVEMENTS TO DIVERSITY, SUPPORT, HAPPY & HEALTHY PEOPLE “Q6 Are there any ways in which these areas of Council business could be improved?” 1. Suggestion made (Q601 SPECIFY) 2. Nothing further to add 3. Don’t know / can’t say Q601 IMPROVEMENTS TO DIVERSITY, SUPPORT, HAPPY & HEALTHY PEOPLE Q7. LEADING, INCLUSIVE AND CONNECTED COUNCIL “Q7. Thinking now about how satisfied are you with the way Council has performed in each of the following services or facilities. Using the same 0 to 10 scale where 0 means extremely dissatisfied and 10 means extremely satisfied, how would you rate ……………?” READ OUT 1-6, RND 1. Consultation with and informing the community 2. The performance of current Elected Members in being transparent, ethical and reflecting the best interests and values of the community. 3. The interactions you have with Council Staff 4. Providing leadership in the community 5. Financial management 6. The balance between Council rates and the services and standard of infrastructure provided NUM, 0-10, DK FOR EACH Q8. IMPROVEMENTS TO LEADING, INCLUSIVE AND CONNECTED COUNCIL “Q8 Are there any ways in which these areas of Council business could be improved?” 1. Suggestion made (Q801 SPECIFY) 2. Nothing further to add 3. Don’t know / can’t say Q801 SUGGESTION FOR IMPROVEMENTS TO LEADING, INCLUSIVE & CONNECTED COUNCIL
5

8531 Burnside Annual Community Survey QUEST V2 Page 4 of 7
Q9. ADDITIONAL SERVICES NOT PROVIDED NOW “Q9 Is there any service that you would like Council to provide that it currently does not?” 1. Suggestion made (Q901 SPECIFY) 2. Nothing further to add 3. Don’t know / can’t say Q901 SUGGESTION FOR ADDITIONAL SERVICES NOT PROVIDED NOW Q10. CURRENT SERVICES SHOULD NOT BE PROVIDED “Q10 Is there any service that Council currently provides that you consider it should not?” 1. Suggestion made (Q1001 SPECIFY) 2. Nothing further to add 3. Don’t know / can’t say Q1001 SUGGESTION FOR CURRENT SERVICES SHOULD NOT BE PROVIDED Q11 OVERALL SATISFACTION WITH COUNCIL’S PERFORMANCE “Q11 How satisfied or dissatisfied are you with Council’s overall performance over the past 12 months. Please use a 0 to 10 scale, where 0 means extremely dissatisfied and 10 means extremely satisfied?” NUM 0-10, Q12 CAT MANAGEMENT “Q12. I'd now like you to rate how strongly you agree or disagree with the following statement, using a 0 to 10 scale with 0 meaning strongly disagree and 10 meaning strongly agree. To what extent do you agree or disagree that “the City of Burnside should have a cat management approach similar to the way Council manages dogs. By this we mean registration, microchipping, desexing and limit on numbers per household?” NUM 0-10,
Q13 PARKING ON DRIVEWAY CROSSOVER OF OWN PROPERTY “Q14 The City of Unley is seeking support from neighbouring Councils to lobby the State Government to change the Australian Road Rules to allow residents to park on the driveway crossover in front of their own properties using a permit system. Using the same 0 to 10 scale, to what extent do you agree or disagree that the City of Burnside should support this change? NUM 0-10, CLASSIFICATIONS: Q14 gender. “Q15 We are coming to the end of the survey. I would just like you to answer a few questions about yourself so we can better understand you. This information will be kept confidential and the answers you provide are aggregated into groups _RECORD GENDER - DO NOT ASK UNLESS CAN'T TELL_" 1. Male 2. Female Q15 YOB “Q16 What year were you born? _RECORD NUMBER, D IF REFUSED_" WIDTH=4 NUM 1900-1995, D
6

8531 Burnside Annual Community Survey QUEST V2 Page 5 of 7
Q16 HOUSEHOLD “Q16 Which of the following best describes your household? _READ OUT 1-8_" 1. Lone person household 2. Group household of related or unrelated adults 3. Young couple, no children 4. Older couple, no children at home 5. Couple or single parent with mainly pre-school children 6. Couple or single parent with mainly primary-school children 7. Couple or single parent with mainly teenage children 8. Couple or single parent with mainly adult children still living at home 9. Refused Q17. EMPLOYMENT “Q17 What is your current employment status?" 1. Part-time employment 2. Full-time employment 3. Unemployed 4. Home duties 5. Pensioner (non-age pension) 6. Retired / age pensioner 7. Student 8. Refused IF 3-8 IN Q17 GO Q19 Q18 HOW DO YOU DESCRIBE YOUR OCCUPATION? “Q19 How do you describe your occupation? _IF NECESSARY, MAKE A NOTE AND CHECK LIST FOR CORRECT CODE_" 1. Manager / administrator 2. Professional 3. Associate professional 4. Tradesperson / related worker 5. Advanced clerical, sales & service worker 6. Intermediate clerical, sales & service worker 7. Intermediate production and transport worker 8. Elementary clerical, sales & service worker 9. Labourer / related worker Q19 SUBURB “Q19 What suburb do you live in? UNPROMPTED 1. AULDANA 2. BEAUMONT 3. BEULAH PARK 4. BURNSIDE 5. DULWICH 6. EASTWOOD 7. ERINDALE 8. FREWVILLE 9. GLENSIDE 10. GLEN OSMOND 11. GLENUNGA 12. HAZELWOOD PARK
7

8531 Burnside Annual Community Survey QUEST V2 Page 6 of 7
13. KENSINGTON GARDENS 14. KENSINGTON PARK 15. LEABROOK 16. LEAWOOD GARDENS 17. LINDEN PARK 18. MAGILL 19. MOUNT OSMOND 20. ROSE PARK 21. ROSSLYN PARK 22. SKYE 23. ST GEORGES 24. STONYFELL 25. TOORAK GARDENS 26. TUSMORE 27. WATERFALL GULLY 28. WATTLE PARK Q20 TENANCY “Q20 Is this house owner-occupied or rented?" 1. Owner-occupied 2. Rented/tenanted Q21 HOUSEHOLD GROSS INCOME “Q21 Which of the following ranges best describes your household's gross annual income? _READ OUT 1-7_" 1. Less than $25,000 per annum 2. $25,000 to less than $50,000 3. $50,000 to less than $75,000 4. $75,000 to less than $100,000 5. $100,000 to less than $150,000 6. $150,000 to less than $200,000 7. $200,000 or more 8. Don't know 9. Refused Q22 BUSINESS OWNER “Q22 Do you, or anyone else in this household, own a business? If so, would it be ….._READ OUT 1-4_" 1. A home-based business 2. Based in business premises within Burnside Council area 3. In business premises outside of Burnside Council area 4. At various locations / clients’ premises (e.g. builder, contract work, driver etc.) 5. Something else (SPECIFY Q2301) 6. No, do not own business Q2301 BUSINESS OWNER OTHER Q23 CLOSE
8

8531 Burnside Annual Community Survey QUEST V2 Page 7 of 7
“Q23 That concludes the survey. On behalf of Burnside City Council and Harrison Research, thank you for your time. Q25 ISO 20252 “Q24 By pressing enter at this screen, I certify that this is a true, accurate and complete interview, conducted in accordance with the ISO 20252 standards and the AMSRS Code of Professional Behaviour (ICC/ESOMAR). I will not disclose to any other person the content of this questionnaire or any other information relating to this project." BLANK Q0QUO TOTAL=800
9

Elected Members’ Information Document
To Elected Members From Paul Deb, Chief Executive Officer and
Louise Miller Frost – General Manager, Community and Development Services Date 14 March 2013 Contact Leonie Scriven, Principal Strategy Officer
(8366 4140; [email protected]) Subject OUTCOMES OF THE ANNUAL COMMUNITY SURVEY 2012-2013 Attachments Nil
Members The purpose of this Information Document is to provide a summary of the key outcomes of the Annual Community Survey undertaken between 11 and 17 February 2013. The points presented here are sourced from a draft consultant report titled ‘Draft Preliminary Annual Community Survey Report’. The contents of the consultant report will be presented to Council in more detail in an Elected Member workshop on 21 March 2013 by the consultants. A final consultant report presenting and interpreting the results of the Annual Community Survey will be submitted to Council as an attachment to a Council Report scheduled for a June 2013 meeting. This Council Report will also include a review of the project and recommendations for the future of the survey. Key Results The Annual Community Survey research revealed that the respondents to the survey representing the residents of the City of Burnside generally have a reasonably high level of satisfaction with the services provided by Council. Some services have a lower level of satisfaction, but all services can be deemed to be considered average to good. Methodology 1. A random 800 resident computer aided telephone interview survey, conducted by
Harrison Research using Interviewer Quality Control Australia (IQCA) accredited interviewers, in accordance with the Market and Social Research Privacy Principles.
2. All respondents were confirmed living in Burnside. 3. Interview duration averaged 17.5 minutes. 4. Raw data was weighted to correspond with the population distributions of age and
gender (ABS 2011 Census Data) and also by Wards. 5. 75% of respondents did not own a business. 9% had a home based business and 3%
owned a business in the Burnside Council area. What is a Good Score? When respondents answered the survey question, they gave a score from 0 to 10, where 0 was least satisfied up to 10 which was most satisfied. Respondents could also answer “don’t know”.
10

- 2 - When interpreting organisational performance/ service quality results, the following generalisation are usually applied for interpretation of the score. A score of: 1. Above 8 is ‘excellent or very satisfied’; 2. Between 6 and 8 is ‘good or quite satisfied’; 3. Between 5 and 6 is considered ‘average or satisfied’; 4. 5 generally means undecided, or neither satisfied or dissatisfied; and 5. Below 5 is ‘poor or dissatisfied’ and signifies potential room for improvement. Other studies have shown Councils generally score higher on service-related areas (generally above 7) than governance or communications areas (generally below 7). Strategic Directions Scores The total scores for each service are listed in their Strategic Plan Directions section. Effectively, the higher the score the better the result or the higher the perceived satisfaction of the respondents. Total Score
Integrate Urban Form and Living Spaces
7.6 Providing and maintaining parks and reserves 7.4 Providing and maintaining playgrounds 7.2 Providing passive recreation opportunities, such as walking and picnic
locations 6.7 Providing and maintaining street trees 6.6 Providing active recreation opportunities, such as playing organised
sport 6.5 Overall planning of the City 6.5 Protecting the built and natural heritage 6.4 Providing and maintaining local roads 6.3 Providing and maintaining cycle paths and walking trails 6.2 Provision and management of traffic and parking in the City 6.0 Providing and maintaining footpaths Total Score
Protected and Valued Environment
7.7 Garbage and green waste management 6.7 Hard waste and electronic waste management 6.6 Restoring and protecting the City's biodiversity 6.6 After hours and hazard response management 6.4 Water management initiatives 6.3 Preparation for and support of residents for bushfire management Total Score
Diverse, Supportive, Happy and Healthy People
8.3 Providing library services 8.0 Presentation and cleanliness of the City 7.6 Providing services for older residents 7.6 Providing a community bus 7.0 Providing services for families 6.9 Providing public and health services 6.8 Community and cultural activities 6.7 Providing animal and pest management services 6.2 Support for local businesses 6.2 Providing services for younger residents
11

- 3 - Total Score
Leading, Inclusive and Connected Council
6.9 The interactions you have with Council staff 6.2 Consultation with and informing the community 6.2 The balance between Council rates and the services and standard of
infrastructure provided 5.6 Performance of current Elected Members being transparent, ethical and
reflecting the best interest and values of the community 5.6 Providing leadership in the community 5.6 Financial management
The following bar graph shows the relative scores of all of the services.
Total Scores for Services
0.0 1.0 2.0 3.0 4.0 5.0 6.0 7.0 8.0 9.0 10.0
Performance of current Elected Members being transparent, ethical andreflecting the best interest and values of the community
Providing leadership in the community
Financial management
Providing and maintaining footpaths
Provision and management of traffic and parking in the City
Support for local businesses
Providing services for younger residents
Consultation with and informing the community
The balance between Council rates and the services and standard ofinfrastructure provided
Providing and maintaining cycle paths and walking trails
Preparation for and support of residents for bushfire management
Providing and maintaining local roads
Water management initiatives
Overall planning of the City
Protecting the built and natural heritage
Providing active recreation opportunities,
Restoring and protecting the City's biodiversity
After hours and hazard response management
Providing and maintaining street trees
Hard waste and electronic waste management
Overall PERFORMANCE
Providing animal and pest management services
Community and cultural activities
Providing public and health services
The interactions you have with Council staff
Providing services for families
Providing passive recreation opportunities
Providing and maintaining playgrounds
Providing and maintaining parks and reserves
Providing services for older residents
Providing a community bus
Garbage and green waste management
Presentation and cleanliness of the City
Providing library services
12

- 4 - Respondent Suggestions for Areas to Consider for Improvement 1. Footpaths need repair / more footpaths (16% of respondents suggested this theme). 2. Maintain / preserve heritage trees / verges (15% of respondents suggested this
theme). 3. More hard rubbish collection (15% of respondents suggested this theme). 4. Council should be in touch with residents / listen and consult / better communication /
notify of works projects (11% of respondents suggested this theme). 5. More rubbish collection-waste green (9% of respondents suggested this theme). Suggestions for New Services Three in four respondents had nothing further to add in that they could not suggest any new services. Themes that were suggested included more: 1. Collection of hard, electronic, hazardous and green waste. Provision of a dump
location within Council area for these waste products; 2. Emphasis on maintenance of trees, footpaths, roads, gutters and general
maintenance of Council parks; 3. Recreation facilities i.e. walking/ cycling trails, dog park, BMX and skateboard areas; 4. Transport / home help / facilities for elderly and people with disabilities; and 5. Engagement with community / more information / phone service / face to face contact
with members. Suggestions for Stopping a Service Only 3% of respondents provided a suggestion about a service that is currently being delivered that they perceived could be stopped. Of these comments, community meals was the most prominent service some respondents thought could be cut. Council’s Overall Performance One in three said they were very satisfied with Council’s overall performance in the last 12 month and rated 8 out of 10 or higher satisfaction. 77% of respondents stated they were satisfied with the overall performance of Council. Score = 6.7 A score between 6 and 8 is considered ‘good or quite satisfied’. 77% responded they were satisfied with the overall performance of council. 34% responded they were very satisfied (score of 8 out of 10 and higher) with Councils overall performance in the last 12 months. Cat Management The question asked of respondents was “How strongly do you agree or disagree that the City of Burnside should have a cat management approach similar to the way Council manages dogs?” Score = 7.7 A score between 6 and 8 is considered ‘good or quite satisfied’. The majority of respondents, 79%, agree with this suggestion, 11% of respondents disagreed.
13

- 5 - Change to Road Rules The question asked of respondents was “The City of Unley is seeking support to lobby State Government to change Australian Road Rules to allow parking on resident’s driveway crossover, using a permit system. To what extend do you agree or disagree that Burnside Council should support this change? “ Score = 5.9 A score between 5 and 6 is considered ‘average or satisfied’. Of the responses 43% strongly agreed with supporting the change, 14% agreed, 26% disagreed and 13% strongly disagreed with supporting the change, giving a rating score of 0. I hope this summary was helpful and if you have any further questions please do not hesitate to contact Leonie. Regards Louise
14

Annual Community Survey Preliminary Draft Report
Prepared for: Leonie Scriven, Principal Strategy Officer, and Louise Miller Frost, General Manager, Community and
Development Services, City of Burnside
Project #: 8531
Principal Consultants: Helen Fischer
Report Date: March 2013
15

8531 City of Burnside Annual Community Survey 2013 Page 2
CONTENTS
1. SETTING THE SCENE........................................................................................ 5
1.1 Background ........................................................................................................................ 6
1.2 The project ......................................................................................................................... 6
1.3 Report ................................................................................................................................. 7
2. EXECUTIVE ASSESSMENT ............................................................................... 9
2.1 Key Outcomes ................................................................................................................. 10
2.1.1 Integrated Urban Form and Living Spaces ...................................................... 10
2.1.2 Protected and Valued Environment.................................................................. 10
2.1.3 Diverse, Supportive, Happy and Healthy People ............................................ 10
2.1.4 Leading, Inclusive and Connected Council ...................................................... 11
2.2 Implications ...................................................................................................................... 11
3. PRINCIPAL FINDINGS ..................................................................................... 12
3.1 Overview of Service Indicators ..................................................................................... 13
3.2 Integrated Urban Form and Living Spaces .................................................................. 16
3.2.1 Planning and Infrastructure Elements .............................................................. 17
3.2.2 Improvements to Urban Form and Living Spaces ........................................... 28
3.3 Protected and Valued Environment.............................................................................. 30
3.3.1 Environmental Services .................................................................................... 31
3.3.2 Improvements to Protected and Valued Environment ..................................... 37
3.4 Diverse, Supportive, Happy and Healthy People ........................................................ 39
3.4.1 Elements of Diverse, Supportive, Happy and Healthy People ........................ 40
3.4.2 Improvements to Diverse, Supportive, Happy and Healthy People ................................................................................................................ 51
3.5 Leading, Inclusive and Connected Council ................................................................ 53
3.5.1 Individual Elements of Leading, Inclusive and Connected Council ................ 54
3.5.2 Suggested improvements to Leading, Inclusive and Connected Council ............................................................................................................... 60
3.6 Services Not Currently Provided by Council .............................................................. 62
3.7 Current services which should not be provided by Council .................................... 64
16

8531 City of Burnside Annual Community Survey 2013 Page 3
3.8 Council’s Overall Performance ..................................................................................... 65
3.9 Cat Management .............................................................................................................. 66
3.10 Change to Road Rules .................................................................................................... 67
APPENDIX A1: METHODOLOGY ........................................................................ 69
APPENDIX A2: QUESTIONNAIRE ....................................................................... 74
APPENDIX A3: MARGIN FOR ERROR ................................................................ 81
TABLE OF FIGURES Fig 1: Overall satisfaction across all performance indicators .............................................................................................. 14 Fig 2: Urban form and living spaces overall ........................................................................................................................ 16
Fig 3: Satisfaction with overall planning .............................................................................................................................. 17
Fig 4: Protecting the built and natural heritage ................................................................................................................... 18 Fig 5: Providing passive recreation opportunities, such as walking, picnic locations etc. ................................................... 19
Fig 6: Providing active recreation opportunities, such as organised sport or outdoor games ............................................. 20
Fig 7: Providing and maintaining parks and reserves ......................................................................................................... 21 Fig 8: Providing and maintaining playgrounds .................................................................................................................... 22
Fig 9: Providing and maintaining local roads ...................................................................................................................... 23
Fig 10: Providing and maintaining footpaths ....................................................................................................................... 24
Fig 11: Providing and maintaining street trees .................................................................................................................... 25
Fig 12: Providing and maintaining cycle paths and walking trails ....................................................................................... 26 Fig 13: Provision and management of traffic and parking in the City .................................................................................. 27
Fig 14: Improvements to Urban Form and Living Spaces elements ................................................................................... 28
Fig 15: Protected and valued environment overall ............................................................................................................. 30 Fig 16: Bushfire management ............................................................................................................................................. 31
Fig 17: Restoring and protecting City’s biodiversity ............................................................................................................ 32
Fig 18: Water management initiatives ................................................................................................................................. 33
Fig 19 Garbage and green waste management ................................................................................................................. 34
Fig 20: Hard and electronic waste management ................................................................................................................ 35 Fig 21: After hours, hazard response management ............................................................................................................ 36
Fig 22 :Improvements to environmental planning ............................................................................................................... 37
Fig 23: Social Capital overall .............................................................................................................................................. 39 Fig 24: Support for local businesses by business ownership ............................................................................................. 40
Fig 25: Support for local businesses ................................................................................................................................... 41
Fig 26: Community and cultural activities ........................................................................................................................... 42
Fig 27: Providing public and environmental health services ............................................................................................... 43
17

8531 City of Burnside Annual Community Survey 2013 Page 4
Fig 28: Providing services for older residents ..................................................................................................................... 44
Fig 29: Providing services for younger residents ................................................................................................................ 45
Fig 30: Providing services for families ................................................................................................................................ 46 Fig 31: Presentation and cleanliness of the City ................................................................................................................. 47
Fig 32: Providing animal and pest management services .................................................................................................. 48
Fig 33: Providing a community bus service ........................................................................................................................ 49
Fig 34: Providing library services ........................................................................................................................................ 50
Fig 35: Suggested improvements ....................................................................................................................................... 51 Fig. 36: Leading, inclusive and connected Council overall ................................................................................................. 53
Fig 37: Consultation with and informing the community ..................................................................................................... 54
Fig. 38: Performance of current Elected Members ............................................................................................................. 55 Fig. 39: Interactions with Council staff ................................................................................................................................ 56
Fig. 40: Providing leadership in the community .................................................................................................................. 57
Fig. 41: Financial management ........................................................................................................................................... 58
Fig. 42: Balance between rates and services / infrastructure ............................................................................................. 59
Fig. 43: Suggestions for improvement ................................................................................................................................ 60 Fig. 44: Services not currently provided by Council ............................................................................................................ 62
Fig 45: Current services which should not be provided ...................................................................................................... 64
Fig. 46: Overall performance of Council ............................................................................................................................. 65 Fig. 47: Cat management approach ................................................................................................................................... 66
Fig. 48: Support for change to Road Rules ......................................................................................................................... 68
Please note: While the organisation or person for whom this report was prepared (the Client) owns the research data and findings in this report, if any findings from this report are to be published in any way, the Client has a responsibility to ensure that such publications are not misleading. The Researcher should be consulted and agree in advance the form and content of publication and must take action to correct any misleading statements about the research. Therefore, Harrison Research Pty Ltd reserves the right to vet potential publications which reproduce, summarise or cite any part of this document.
Please refer to the market and social research industry's Code of Professional Behaviour for further details on Clients' and Researchers' rights and responsibilities. This Code is available in the Professional Standards section on the Australian Market & Social Research Society's website at http://www.amsrs.com.au
18

8531 City of Burnside Annual Community Survey 2013 Page 5
1. SETTING THE SCENE
19

8531 City of Burnside Annual Community Survey 2013 Page 6
1.1 Background
The City of Burnside wished to undertake a benchmark Annual Community Survey to inform further development of the Draft Strategic Plan and to explore in more detail community perceptions of specific elements within each of the four Key Directions.
The current research project focuses on the Key Directions in more detail rather than as an overview and in principle community support.
The primary objective of the research was to provide benchmark data of residents’ perceptions of the Key Directions and individual elements and to allow feedback in the form of suggestions for implementation of the Key Directions.
1.2 The project
The questionnaire for the survey was designed by Burnside Council staff, with support with the initial design from Harrison Research.
The topics covered aspects around the following broad areas of enquiry: ~ Residents’ perceptions of performance across the four key Strategic Directions. ~ Satisfaction with the performance of specific elements within the Key Directions. ~ Residents suggestions for implementation or improvement of services.
The source for the database of residents was the most recent (compiled November 2011) commercially-available list of South Australian residential phone numbers (Australia on Disc). From this list, all residential numbers within the City of Burnside area were drawn, based on their postcode. The numbers were randomised and telephone interviews completed with n=800 residents. Prior to interviewing, the database of residents’ phone numbers was checked against the telephone numbers of residents who had participated in the CATI component of the three most recent projects: Burnside Swimming Centre Community Engagement, Glenunga Reserve Community Engagement and the Sport and Recreation Activity Survey. The purposes in doing this was not just to ensure that respondents do not become fatigued with undertaking surveys for Council but also to ensure opportunity is provided for participation across as wide a cross-section of the local community as possible.
All potential respondents were also screened to ensure they still reside within the Burnside Council area.
The sample was randomised (using the ‘birthday last’ technique to ensure that we do not always speak with the first person to answer the telephone, thereby skewing the sample in favour of older females).
Raw data was weighted by Age and Gender (ABS 2011 Census Data) and also by Ward to ensure even representation across the geographic boundaries of the City of Burnside. Details of the raw and weighted samples is contained in Appendix 1 of this report.
20

8531 City of Burnside Annual Community Survey 2013 Page 7
1.3 Report
The Preliminary Draft Report to follow incorporates ….. ~ full details of the methodology employed ~ results for the aggregate sample, alongside results for key sub-groups ~ commentary highlighting the results and comparisons with sub-groups where statistically
significant differences are noted (although these will be expanded upon in the final report).
~ graphs to support the commentary and results. ~ full tabulations and collated comments will be supplied as an Addendum to the final
report.
21

8531 City of Burnside Annual Community Survey 2013 Page 8
22

8531 City of Burnside Annual Community Survey 2013 Page 9
2. EXECUTIVE ASSESSMENT
23

8531 City of Burnside Annual Community Survey 2013 Page 10
2.1 Key Outcomes
2.1.1 Integrated Urban Form and Living Spaces
Satisfaction with the provision of most of the attributes around integrated urban form and living spaces was strong, ranging from 85% satisfied with the provision and maintenance of parks and reserves down to 54% satisfied with the provision of active recreation opportunities, such as playing organised sport and outdoor games (25% could not respond to this element).
Actual dissatisfaction ranged from 2% for providing and maintaining parks and reserves up to 20% for providing and maintaining footpaths (although the majority of 65% were still satisfied with the latter element).
Having said this, the most common suggestion put forward to improve the elements of Integrated Urban Form and Living Spaces was for better maintenance / repair to footpaths needed (16% raised suggestions to improve this aspect) Maintenance / preservation of street trees was also a prominent theme in suggestions for improvement (15% of respondents).
2.1.2 Protected and Valued Environment
The element of environment which recorded the highest satisfaction with performance was garbage and green waste management (87% satisfied with this element versus 9% dissatisfied).
Showing least satisfaction scores was after hours and hazard response management (32% satisfied), however more than half (55%) of respondents were unable to rate this element (presumably because they had not had need of this service).
Attracting the highest dissatisfaction was hard waste and electronic waste management (16% dissatisfied with this element), although they were still clearly outweighed by the proportion satisfied with hard and electronic waste management (68%).
Supporting this finding, the most common suggestion put forward to improve this Key Direction was for more hard rubbish collection (15% of all suggestions), followed by more waste / green waste rubbish collection (9% of all suggestions). However, 48% of respondents had no suggestions for improvement and a further 11% could not say (don’t know).
2.1.3 Diverse, Supportive, Happy and Healthy People
Both the presentation and cleanliness of the City and also the provision of library services attracted satisfaction from the overwhelming majority of residents (96% and 92% respectively).
Whilst support for local businesses gained the lowest level of satisfaction (33%), most (51%) could not rate this element, presumably due to not having experienced support for local businesses. Just 5% indicated dissatisfaction with this element.
Providing services for younger residents gained a significantly lower satisfaction than services for older residents (42% versus 65% satisfied). Almost one in ten (9%) residents were dissatisfied with provision of services for younger residents compared with just 2% not satisfied with provision of services to older residents.
24

8531 City of Burnside Annual Community Survey 2013 Page 11
Having noted these figures, the most often raised theme when asked what could be improved regarding the Direction of Diverse, Supportive, Happy and Healthy People was comments along the lines of “more transparency, clarity of explanations, more cooperation” (raised by only 6% of respondents).
The majority (61%), however, had nothing to add to improve this Key Direction of Council.
2.1.4 Leading, Inclusive and Connected Council
When read out statements concerning the Key Direction of a Leading, Inclusive and Connected Council, the aspect which attracted the highest level of satisfaction was for performance of “consultation with and informing the community (64% satisfied versus 14% dissatisfied). Just 10% of residents felt unable to rate this aspect (suggesting that the recent engagement conducted throughout the City of Burnside has been recognised by the vast majority of residents).
At the other end of the scale, several aspects fell short of 50% satisfaction levels: • Financial management – 35% satisfied, 14% dissatisfied and 39% unable to rate • Performance of Elected Members – 39% satisfied, 17% dissatisfied and 30% unable to rate • Providing leadership in the community – 40% satisfied, 17% dissatisfied and 27% unable to
rate.
Showing consistently lower satisfaction across all aspects of Leading, Inclusive and Connected Council were residents living in the Rose Park / Toorak Gardens Ward and also residents within the middle to mature family life-stage (45. to 54 year olds). This was a pattern noted across the whole survey but was particularly evident in the findings for this Key Direction.
2.2 Implications
The research revealed a reasonably high level of satisfaction that each of the Key Directions are being performed (at the total sample level), although the research also revealed that some individual aspects attracted dissatisfaction among between 1 in 10 and 1 in 4 residents.
These aspects / services included the following (based on aspects where dissatisfaction was highest, rather than where satisfaction was lowest):
• Providing and maintaining footpaths (20% dissatisfied), with Eastwood / Glenunga and also Burnside Wards showing the lowest satisfaction with this service.
• Hard Waste and Electronic Waste management (16% dissatisfied), also lower among residents of Eastwood / Glenunga and Burnside Wards.
• Providing services for younger residents (9% dissatisfied), however dissatisfaction increased significantly among respondents in the 45 to 54 cohort (25%).
• Performance of Elected Members (17% dissatisfied) and higher dissatisfaction among residents in the Rose Park / Toorak Gardens Ward (24% dissatisfied).
• Providing leadership in the Community (17% dissatisfied) and again higher dissatisfaction was noted among residents in the Rose Park / Toorak Gardens Ward (25% dissatisfied) and among residents on the 45 to 54 cohort (37% dissatisfied with this element).
25

8531 City of Burnside Annual Community Survey 2013 Page 12
3. PRINCIPAL FINDINGS
26

8531 City of Burnside Annual Community Survey 2013 Page 13
3.1 Overview of Service Indicators
All respondents were read out statements regarding various services and were asked to rate their level of satisfaction with each statement, using a 0 to 10 scale where 0 meant strongly dissatisfied and 10 indicated they were strongly satisfied. Respondents also had the option to indicate they did not know, if there was a service they had never accessed or were unaware of the service.
It is important to be able to put the mean scores into perspective in terms of a general interpretation of the relative organisational performance and/or service quality results. The following generalisations are usually applied:
• Above 8 = excellent or strongly (highly) satisfied; • Between 6 and 8 = good or quite satisfied; • Between 5 and 6 = average or satisfied; • 5 = undecided, neutral or neither satisfied nor dissatisfied; and • Below 5 = poor or dissatisfied and signifies potential room for improvement
The statements referred to different services provided by Council across the four Key Directions, that is: • Urban Form and Living Spaces. • Protected and Valued Environment • Diverse, Supportive, Happy and Healthy People • Leading, Inclusive and Connected Council
Across all of the service performance indicators tested, regardless of which Key Direction they fall within, the services which attracted the overall highest satisfaction level among residents was for “providing library services” (8.3 mean score), followed by the “presentation and cleanliness of the City” (8.0 mean score).
At the other end of the satisfied spectrum, three aspects of performance rated at 5.6 mean score, these being: “financial management”, “performance of current Elected Members being transparent, ethical and reflecting the best interests and values of the community” and “providing leadership in the community”.
The graph overleaf demonstrates that between these two levels of the service continuum, most other performance indicator scores are between the good or quite satisfied level (i.e. rated between 6.0 and 8.0 out of 10.0).
In addition to the analysis across all performance indicators, statistical analysis was undertaken to uncover any relationships between performance of services and overall satisfaction with Council. Multiple regression and correlation analysis provides a measure of revealed importance of key attributes of service, or the hidden drivers of satisfaction. It is based on determining the association between the performance rating for a service attribute (Q’s 1, 3, 5, and 7) and the broader overall satisfaction with all services provided by Council (Q11).
This analysis identified six service aspects which were critical drivers of resident satisfaction across all services provided by Council. All other aspects of service were also revealed as important in driving satisfaction among residents, but slightly less so than the six highlighted services. These less important aspects may be considered “hygiene factors”, or services expected by residents which are only notable if they are not present or not performed as well as residents expect
The table on page 15 demonstrates all of these aspects of service and the correlation to overall satisfaction with Council, highlighting the critical service areas. Of note is the fact that 3 of these aspects of service also were rated lowest for satisfaction, meaning there is significant disparity between residents’ expectations and their satisfaction with the actual performance.
27

8531
City
of B
urns
ide A
nnua
l Com
munit
y Sur
vey 2
013
Page
14
Fig
1: O
vera
ll sati
sfacti
on ac
ross
all p
erfor
man
ce in
dicato
rs
8.3
8.0
7.7
7.6
7.6
7.6
7.4
7.2
7.0
6.9
6.9
6.8
6.7
6.7
6.7
6.6
6.6
6.6
6.5
6.5
6.4
6.4
6.3
6.3
6.2
6.2
6.2
6.2
6.2
6.0
5.6
5.6
5.6
012345678910
Perf
orm
ance
Indi
cato
rs O
verv
iew
Mea
n sc
ores
: 0-1
0 sc
ale
28

8531 City of Burnside Annual Community Survey 2013 Page 15
Table 1: Correlations (Pearson) across all services The remainder of the key findings to follow, breaks down the performance indicators into the Four Key Directions as determined in the Strategic Plan, to make information dissemination more manageable.
29

8531 City of Burnside Annual Community Survey 2013 Page 16
3.2 Integrated Urban Form and Living Spaces
All respondents were read out statements regarding various elements of Urban Form and Living Spaces. They were asked to rate their level of satisfaction with each statement, using a 0 to 10 scale where 0 meant strongly dissatisfied and 10 indicated they were strongly satisfied.
Note that when using a 0 to 10 scale, it is commonly accepted that respondents rating 6.0 out of 10.0 or higher for a statement represents “satisfaction”, with 5.0 being neither satisfied nor dissatisfied and 4.0 or less out of 10.0 representing “dissatisfaction”.
The statements and proportions for satisfied, neutral or dissatisfied responses with each element of Urban Form and Living Spaces, were as shown in the graph below.
Fig 2: Urban form and living spaces overall
As the graph demonstrates, there is a very high level of satisfaction with the provision and maintenance of parks and reserves (85% satisfied) and a subsequent low level of dissatisfaction (2%).
Highest dissatisfaction was for the provision and maintenance of footpaths (20%) compared with a satisfaction proportion of 65%.
54
58
65
66
68
71
71
72
74
79
85
11
14
14
12
13
13
7
13
13
8
9
10
13
20
12
14
11
5
15
13
6
2
25
15
1
10
5
5
18
1
1
7
3
0% 20% 40% 60% 80% 100%
Providing active recreation opportunities, suchas playing organised sport or outdoor games etc.
Providing and maintaining cycle paths andwalking trails
Providing and maintaining footpaths
Protecting the built and natural heritage
Provision and management of traffic and parkingin the City
The overall planning of the City
Providing and maintaining playgrounds
Providing and maintaining local roads
Providing and maintaining street trees
Providing passive recreation opportunities, suchas walking, picnic locations etc.
Providing and maintaining parks and reserves
URBAN FORM AND LIVING SPACES OVERALL (0-10 Scale)
Satisfied Neither Dissatisfied Don’t' know
30

8531 City of Burnside Annual Community Survey 2013 Page 17
One in four respondents could not respond with a rating for providing active recreation opportunities (25% don’t know response), and this element attracted the lowest satisfied rating (54%).
3.2.1 Planning and Infrastructure Services
At an individual element level of Urban Form and Living Spaces, the following graphs demonstrate the actual mean score recorded for each element as well as socio-demographic and geographic variations at sub-group level. This provides a top-line only, as the differences may not be statistically significant. Further detail will be reported in the final report.
7 out of 10 (71%) were satisfied with the overall planning of the City, scoring at 6.5 mean.
6.4
6.6
6.8
6.4
6.0
6.2
6.7
7.1
7.4
6.6
6.7
6.4
6.9
6.5
6.2
6.5
7.2
6.5
0 1 2 3 4 5 6 7 8 9 10
Male
Female
Under 35's
35 - 44 yrs
45 - 54 yrs
55-64 yrs
65-74 yrs
75-84 yrs
85+ yrs
Beaumont
Burnside
Eastwood/Glenunga
Kensingtn Gdn/Magill
Kensington Pk
Rose Pk/Toorak Gdn
Owner/Purchaser - Occupied
Rented / Tenanted
n=794
GEN
DER
AGE
COHO
RTW
ARD
TEN
ANCY
TOTA L
Q1 Thinking about planning and infrastructure in the Council area, how satisfied are you that Council has performed each of the following
services or facilities. (0 to 10 scale).Q1a The overall planning of the City
Fig 3: Satisfaction with overall planning
31

8531 City of Burnside Annual Community Survey 2013 Page 18
2 out of 3 (66%) were satisfied with protection of the built and natural heritage (6.5 mean score), with relatively small variations across geographic and socio-demographic sub-groups.
Fig 4: Protecting the built and natural heritage
6.6
6.5
7.2
6.6
6.0
6.1
6.3
6.6
6.9
6.5
6.7
6.6
6.6
6.8
6.0
6.5
6.3
6.5
0 1 2 3 4 5 6 7 8 9 10
Male
Female
Under 35's
35 - 44 yrs
45 - 54 yrs
55-64 yrs
65-74 yrs
75-84 yrs
85+ yrs
Beaumont
Burnside
Eastwood/Glenunga
Kensingtn Gdn/Magill
Kensington Pk
Rose Pk/Toorak Gdn
Owner/Purchaser - Occupied
Rented / Tenanted
n=794
GEN
DER
AGE
COHO
RTW
ARD
TEN
ANCY
TOTA L
Q1 Thinking about planning and infrastructure in the Council area, how satisfied are you that Council has performed each of the following services
or facilities. (0 to 10 scale).Q1b Protecting the built and natural heritage
32

8531 City of Burnside Annual Community Survey 2013 Page 19
Nearly 8 out of 10 (79%) were satisfied with the provision of passive recreation opportunities (7.2 mean score), again with relatively small variations across sub-groups (as shown in graph overleaf).
Fig 5: Providing passive recreation opportunities, such as walking, picnic locations etc.
7.1
7.3
7.5
7.3
6.6
7.1
7.3
7.5
7.7
7.3
7.5
7.0
7.7
7.3
6.6
7.2
7.6
7.2
0 1 2 3 4 5 6 7 8 9 10
Male
Female
Under 35's
35 - 44 yrs
45 - 54 yrs
55-64 yrs
65-74 yrs
75-84 yrs
85+ yrs
Beaumont
Burnside
Eastwood/Glenunga
Kensingtn Gdn/Magill
Kensington Pk
Rose Pk/Toorak Gdn
Owner/Purchaser - Occupied
Rented / Tenanted
n=794
GEN
DER
AGE
COHO
RTW
ARD
TEN
ANCY
TOTA L
Q1 Thinking about planning and infrastructure in the Council area, how satisfied are you that Council has performed each of the following services or
facilities. (0 to 10 scale)Q1c Providing passive recreation opportunities, such as walking,
picnic locati
33

8531 City of Burnside Annual Community Survey 2013 Page 20
Just over half (54% of respondents were satisfied with the provision of active recreation opportunities, although some significant differences were noted by Ward (particularly high satisfaction among residents of Kensington Gardens/Magill Ward compared with those from Rose Park / Toorak Gardens (5.9 mean) and also Eastwood / Glenunga (6.4 mean). These differences were statistically significant.
There was also a pattern of lower satisfaction among younger cohorts (under 55 years) compared with those 55 years and older. The differences between 45 to 54 year olds, possibly in the mature family life-stage with young adults / teens at home (6.1 mean score), scored significantly lower than 75 to 84 year olds.
Fig 6: Providing active recreation opportunities, such as organised sport or outdoor games
6.4
6.8
6.6
6.3
6.1
6.7
6.9
7.3
7.4
6.7
6.5
6.4
7.2
6.9
5.9
6.5
7.4
6.6
0 1 2 3 4 5 6 7 8 9 10
Male
Female
Under 35's
35 - 44 yrs
45 - 54 yrs
55-64 yrs
65-74 yrs
75-84 yrs
85+ yrs
Beaumont
Burnside
Eastwood/Glenunga
Kensingtn Gdn/Magill
Kensington Pk
Rose Pk/Toorak Gdn
Owner/Purchaser - Occupied
Rented / Tenanted
n=794
GEN
DER
AGE
COHO
RTW
ARD
TEN
ANCY
TOTA L
Q1 Thinking about planning and infrastructure in the Council area, how satisfied are you that Council has performed each of the following services or facilities. (0
to 10 scale)Q1d Providing active recreation opportunities, such as playing
organised sport
34

8531 City of Burnside Annual Community Survey 2013 Page 21
The provision and maintenance of parks and reserves scored highly at the total sample level and showed only minor variations across socio-demographic sub-groups.
Fig 7: Providing and maintaining parks and reserves
7.4
7.7
7.7
7.5
7.1
7.6
7.6
7.9
8.2
7.8
7.8
7.2
7.7
7.6
7.2
7.5
7.9
7.6
0 1 2 3 4 5 6 7 8 9 10
Male
Female
Under 35's
35 - 44 yrs
45 - 54 yrs
55-64 yrs
65-74 yrs
75-84 yrs
85+ yrs
Beaumont
Burnside
Eastwood/Glenunga
Kensingtn Gdn/Magill
Kensington Pk
Rose Pk/Toorak Gdn
Owner/Purchaser - Occupied
Rented / Tenanted
n=794
GEN
DER
AGE
COHO
RTW
ARD
TEN
ANCY
TOTA L
Q1 Thinking about planning and infrastructure in the Council area, how satisfied are you that Council has performed each of the following services or
facilities. (0 to 10 scale)Q1e Providing and maintaining parks and reserves
35

8531 City of Burnside Annual Community Survey 2013 Page 22
Whilst overall the provision and maintenance of playgrounds rated highly (71% satisfied), significant differences were noted among Eastwood / Glenunga residents compared with those living in Kensington Gardens / Magill (6.9 mean versus 7.9 mean).
Fig 8: Providing and maintaining playgrounds
7.2
7.6
7.4
7.5
7.0
7.4
7.6
7.6
7.8
7.1
7.7
6.9
7.9
7.5
7.2
7.4
7.1
7.4
0 1 2 3 4 5 6 7 8 9 10
Male
Female
Under 35's
35 - 44 yrs
45 - 54 yrs
55-64 yrs
65-74 yrs
75-84 yrs
85+ yrs
Beaumont
Burnside
Eastwood/Glenunga
Kensingtn Gdn/Magill
Kensington Pk
Rose Pk/Toorak Gdn
Owner/Purchaser - Occupied
Rented / Tenanted
n=794
GEN
DER
AGE
COHO
RTW
ARD
TEN
ANCY
TOTA L
Q1 Thinking about planning and infrastructure in the Council area, how satisfied are you that Council has performed each of the following services or facilities. (0
to 10 scale)Q1f Providing and maintaining playgrounds
36

8531 City of Burnside Annual Community Survey 2013 Page 23
7 out of 10 (71%) respondents were satisfied with the provision and maintenance of local roads, although again we see a dip in satisfaction levels among residents of Eastwood / Glenunga Ward and also among 45 to 54 year olds, as the graph below demonstrates.
Fig 9: Providing and maintaining local roads
6.5
6.4
6.7
6.6
5.9
6.2
6.2
6.7
6.9
6.4
6.4
6.1
6.4
6.5
6.8
6.4
6.4
6.4
0 1 2 3 4 5 6 7 8 9 10
Male
Female
Under 35's
35 - 44 yrs
45 - 54 yrs
55-64 yrs
65-74 yrs
75-84 yrs
85+ yrs
Beaumont
Burnside
Eastwood/Glenunga
Kensingtn Gdn/Magill
Kensington Pk
Rose Pk/Toorak Gdn
Owner/Purchaser - Occupied
Rented / Tenanted
n=800
GEN
DER
AGE
COHO
RTW
ARD
TEN
ANCY
TOTA L
Q1 Thinking about planning and infrastructure in the Council area, how satisfied are you that Council has performed each of the following services or
facilities. (0 to 10 scale)Q1g Providing and maintaining local roads
37

8531 City of Burnside Annual Community Survey 2013 Page 24
Provision and maintenance of footpaths gained satisfaction among two thirds of the sample (65%), and was relatively even across the Wards, but again 45 to 54 year olds were the least satisfied with this element.
Fig 10: Providing and maintaining footpaths
6.1
6.0
6.7
6.2
5.4
5.6
5.9
6.3
6.0
6.2
5.9
5.8
6.3
6.1
6.0
6
6.2
6.0
0 1 2 3 4 5 6 7 8 9 10
Male
Female
Under 35's
35 - 44 yrs
45 - 54 yrs
55-64 yrs
65-74 yrs
75-84 yrs
85+ yrs
Beaumont
Burnside
Eastwood/Glenunga
Kensingtn Gdn/Magill
Kensington Pk
Rose Pk/Toorak Gdn
Owner/Purchaser - Occupied
Rented / Tenanted
n=794
GEN
DER
AGE
COHO
RTW
ARD
TEN
ANCY
TOTA L
Q1 Thinking about planning and infrastructure in the Council area, how satisfied are you that Council has performed each of the following services or facilities.
(0 to 10 scale)Q1h Providing and maintaining footpaths
38

8531 City of Burnside Annual Community Survey 2013 Page 25
Nearly 3 out of 4 (74%) respondents were satisfied with the provision and maintenance of street trees (6.7 mean score.
Renters, 85 plus year olds, the youngest cohort and residents across Kensington Park, Kensington Gardens / Magill and Eastwood / Glenunga Wards were most satisfied with this aspect.
Fig 11: Providing and maintaining street trees
6.7
6.6
7.2
6.4
6.4
6.2
6.5
6.9
7.2
6.6
6.4
6.9
6.8
6.9
6.3
6.6
7.0
6.7
0 1 2 3 4 5 6 7 8 9 10
Male
Female
Under 35's
35 - 44 yrs
45 - 54 yrs
55-64 yrs
65-74 yrs
75-84 yrs
85+ yrs
Beaumont
Burnside
Eastwood/Glenunga
Kensingtn Gdn/Magill
Kensington Pk
Rose Pk/Toorak Gdn
Owner/Purchaser - Occupied
Rented / Tenanted
n=794
GEN
DER
AGE
COHO
RTW
ARD
TEN
ANCY
TOTA L
Q1 Thinking about planning and infrastructure in the Council area, how satisfied are you that Council has performed each of the following services or facilities.
(0 to 10 scale)Q1i Providing and maintaining street trees
39

8531 City of Burnside Annual Community Survey 2013 Page 26
There was lower satisfaction with the provision and maintenance of cycle paths and walking trails (58% satisfied), with an overall mean score of 6.3 and considerable variation in satisfaction across age cohorts and also Wards.
Fig 12: Providing and maintaining cycle paths and walking trails
6.3
6.4
6.5
6.7
5.7
6.2
6.3
6.8
7.3
6.3
6.4
5.9
6.9
6.5
6.0
6.3
7.1
6.3
0 1 2 3 4 5 6 7 8 9 10
Male
Female
Under 35's
35 - 44 yrs
45 - 54 yrs
55-64 yrs
65-74 yrs
75-84 yrs
85+ yrs
Beaumont
Burnside
Eastwood/Glenunga
Kensingtn Gdn/Magill
Kensington Pk
Rose Pk/Toorak Gdn
Owner/Purchaser - Occupied
Rented / Tenanted
n=794
GEN
DER
AGE
COHO
RTW
ARD
TEN
ANCY
TOTA
L
Q1 Thinking about planning and infrastructure in the Council area, how satisfied are you that Council has performed each of the following services or facilities.
(0 to 10 scale).Q1j Providing and maintaining cycle paths and walking trails
40

8531 City of Burnside Annual Community Survey 2013 Page 27
More than two thirds (68%) of respondents were satisfied with Council provision and management of traffic and parking in the City (6.2 mean score), with only minor variations across geographic and demographic sub-groups.
Fig 13: Provision and management of traffic and parking in the City
6.2
6.3
6.4
6.0
6.1
6.1
6.1
6.4
7.0
6.4
6.2
6.1
6.1
6.5
6.0
6.2
6.5
6.2
0 1 2 3 4 5 6 7 8 9 10
Male
Female
Under 35's
35 - 44 yrs
45 - 54 yrs
55-64 yrs
65-74 yrs
75-84 yrs
85+ yrs
Beaumont
Burnside
Eastwood/Glenunga
Kensingtn Gdn/Magill
Kensington Pk
Rose Pk/Toorak Gdn
Owner/Purchaser - Occupied
Rented / Tenanted
n=794
GEN
DER
AGE
COHO
RTW
ARD
TEN
ANCY
TOTA L
Q1 Thinking about planning and infrastructure in the Council area, how satisfied are you that Council has performed each of the following services or
facilities. (0 to 10 scale)Q1k Provision and management of traffic and parking in the City
41

8531 City of Burnside Annual Community Survey 2013 Page 28
3.2.2 Improvements to Urban Form and Living Spaces
When it came to offering suggestions for improvement across these aspects of Council services, a third (32%) of all respondents said there was nothing they could suggest and a further 12% could not say.
The most often mentioned areas for improvement were: • Footpaths in need of repair, more footpaths needed or comments about footpaths needed on both
sides of the road (16% of mentions). This aspect was more likely to be raised by females (19%) and by older residents (25% of 85 plus year olds).
• Maintain and preserve heritage trees, street trees and verges comments (15% of suggestions), with residents of Kensington Gardens / Magill (23%), females (17%) and the oldest cohort (23% of 85 plus year olds) were most likely to suggest improvement in this area.
Fig 14: Improvements to Urban Form and Living Spaces elements
5
3
3
3
5
6
6
7
8
12
15
16
32
0 10 20 30 40 50 60 70 80 90 100
Other suggestions
Traffic control management issues
Maintaining/preserving heritage listed buildings
More information/communication with…
No high rise/don't change building regulations
Car parking issues/monitor car parking
More exercise/play equipment/improve…
More bike paths/walking trails
Road maintenance/resurfacing comments
Don't know / can't say
Maintain/preserve heritage trees/…
Footpaths need repair/more footpaths
No, nothing further to add
% of responses (incl. multiple response)
Q2 Are there any ways in which these areas of Council business could be improved? BASE: Total sample, n=794
42

8531 City of Burnside Annual Community Survey 2013 Page 29
The following diagram is a “Word Cloud” which is used to demonstrate key themes by using the size of specific words as an indicator of the frequency with which the word is mentioned.
The key themes across all suggestions made to improve Urban Form and Living Spaces (excluding common words such as Council) were: trees, footpaths, street, road and parking.
43

8531 City of Burnside Annual Community Survey 2013 Page 30
3.3 Protected and Valued Environment
All respondents were read out statements regarding various elements of Protected and Valued Environment. They were asked to rate their level of satisfaction with each statement, using a 0 to 10 scale where 0 meant strongly dissatisfied and 10 indicated they were strongly satisfied.
The statements and proportions for satisfied, neutral or dissatisfied responses with each element of Protected and Valued Environment, were as shown in the graph below.
Garbage and green waste management was the element showing the highest level of satisfaction (87%) with Protected and Valued Environment.
At the other end of the scale, after hours and hazard response management rated lowest (32% satisfied) although this was not due to dissatisfaction but rather than more than half (55%) of the sample had no experience of this service and therefore could not rate it.
A similar finding was noted for preparation for and support of residents for bushfire management (47% said don’t know).
Fig 15: Protected and valued environment overall
More detailed sub-group analysis (in final report) will reveal any patterns in satisfaction with these services (e.g. by age cohort, Ward and so on).
32
35
50
56
68
87
10
8
12
14
10
3
4
10
9
6
16
9
55
47
29
24
5
1
0% 20% 40% 60% 80% 100%
After hours and hazard response management
Preparation for and support of residents forbushfire management
Water Management initiatives
Restoring and protecting the City's biodiversity
Hard waste and Electronic waste management
Garbage and green waste management
PROTECTED AND VALUED ENVIRONMENT OVERALL (0-10 Scale)
Satisfied Neither Dissatisfied Don’t' know
44

8531 City of Burnside Annual Community Survey 2013 Page 31
3.3.1 Environmental Services
In terms of preparation for, and support of residents for bushfire management, a 6.2 mean score demonstrates a moderate level of satisfaction with this element of the environment (note: mean score does not include don’t know responses in the calculation, in this instance 47% of respondents).
Also noted was significant variation across age cohorts (both older residents and the youngest showed higher satisfaction than those between 35 and 74 years. Also noted was a higher mean score among residents who are tenants compared with owner/occupiers (although renters represent only 8% of the sample so differences are indicative).
Fig 16: Bushfire management
6.2
6.4
7.0
6.1
5.8
5.7
6.0
6.6
6.8
6.4
5.9
6.3
6.2
6.5
6.8
6.3
6.9
6.3
0 1 2 3 4 5 6 7 8 9 10
Male
Female
Under 35's
35 - 44 yrs
45 - 54 yrs
55-64 yrs
65-74 yrs
75-84 yrs
85+ yrs
Beaumont
Burnside
Eastwood/Glenunga
Kensingtn Gdn/Magill
Kensington Pk
Rose Pk/Toorak Gdn
Owner/Purchaser - Occupied
Rented / Tenanted
n=794
GEN
DER
AGE
COHO
RTW
ARD
TEN
ANCY
TOTA L
Mean (0-10 scale)
Q3 Thinking now about the environment, how satisfied are you that Council has performed each of the following services or facilities.
Q3a Preparation for and support of residents for bushfire management.
Extremely dissatisfied
Extremely satisfied
45

8531 City of Burnside Annual Community Survey 2013 Page 32
Restoring and protecting the City’s biodiversity attracted a mean score of 6.6 for satisfaction, with relatively minor differences across sub-groups.
Fig 17: Restoring and protecting City’s biodiversity
6.5
6.8
6.9
6.5
6.1
6.5
6.8
7.1
7
6.8
6.6
6.7
6.9
6.6
6.2
6.6
7.1
6.6
0 1 2 3 4 5 6 7 8 9 10
Male
Female
Under 35's
35 - 44 yrs
45 - 54 yrs
55-64 yrs
65-74 yrs
75-84 yrs
85+ yrs
Beaumont
Burnside
Eastwood/Glenunga
Kensingtn Gdn/Magill
Kensington Pk
Rose Pk/Toorak Gdn
Owner/Purchaser - Occupied
Rented / Tenanted
n=794
GEN
DER
AGE
COHO
RTW
ARD
TEN
ANCY
TOTA L
Mean (0-10 scale)
Q3 Thinking now about the environment, how satisfied are you that Council has performed each of the following services or facilities.
Q3b Restoring and protecting the City's biodiversity.
Extremely dissatisfied
Extremely satisfied
46

8531 City of Burnside Annual Community Survey 2013 Page 33
In terms of water management initiatives, half (50%) of all respondents were satisfied with this aspect (versus 29% indicating they did not know and 9% dissatisfied).
Fig 18: Water management initiatives
6.4
6.3
7
6.5
5.3
6.1
6.2
6.9
7
6.4
6.2
6.7
6.5
6.4
6
6.3
6.7
6.4
0 1 2 3 4 5 6 7 8 9 10
Male
Female
Under 35's
35 - 44 yrs
45 - 54 yrs
55-64 yrs
65-74 yrs
75-84 yrs
85+ yrs
Beaumont
Burnside
Eastwood/Glenunga
Kensingtn Gdn/Magill
Kensington Pk
Rose Pk/Toorak Gdn
Owner/Purchaser - Occupied
Rented / Tenanted
n=794
GEN
DER
AGE
COHO
RTW
ARD
TEN
ANCY
TOTA L
Mean (0-10 scale)
Q3 Thinking now about the environment, how satisfied are you that Council has performed each of the following services or facilities.
Q3c Water Management initiatives.
Extremely dissatisfied
Extremely satisfied
47

8531 City of Burnside Annual Community Survey 2013 Page 34
Garbage and green waste management scored highly for satisfaction (7.7 mean, 87% satisfied), with higher satisfaction levels revealed among residents who rent / tenants (8.4 mean)85 plus year olds (8.4 mean) and residents of Kensington Gardens / Magill Ward (8.1 mean).
Fig 19 Garbage and green waste management
7.6
7.8
7.8
7.4
7.5
7.5
7.9
8
8.4
7.9
7.5
7.7
8.1
7.5
7.5
7.7
8.4
7.7
0 1 2 3 4 5 6 7 8 9 10
Male
Female
Under 35's
35 - 44 yrs
45 - 54 yrs
55-64 yrs
65-74 yrs
75-84 yrs
85+ yrs
Beaumont
Burnside
Eastwood/Glenunga
Kensingtn Gdn/Magill
Kensington Pk
Rose Pk/Toorak Gdn
Owner/Purchaser - Occupied
Rented / Tenanted
n=794
GEN
DER
AGE
COHO
RTW
ARD
TEN
ANCY
TOTA L
Mean (0-10 scale)
Q3 Thinking now about the environment, how satisfied are you that Council has performed each of the following services or facilities.
Q3d Garbage and green waste management.
Extremely dissatisfied
Extremely satisfied
48

8531 City of Burnside Annual Community Survey 2013 Page 35
Hard waste and electronic waste management did not score as highly (6.7 mean, 68% satisfied), and this aspect attracted the highest level of dissatisfaction (16%). Least likely to be satisfied with this aspect of environmental management were residents aged 45 to 54 years (6.1 mean, particularly low compared with under 35 year olds at 7.1 mean) and also male residents (6.5 mean versus 7.0 mean among females).- both of these differences were statistically significant at 95% confidence level.
Fig 20: Hard and electronic waste management
6.5
7
7.1
7
6.1
6.5
6.7
7.1
7.5
6.8
6.5
6.6
7.1
6.8
6.6
6.7
7.2
6.7
0 1 2 3 4 5 6 7 8 9 10
Male
Female
Under 35's
35 - 44 yrs
45 - 54 yrs
55-64 yrs
65-74 yrs
75-84 yrs
85+ yrs
Beaumont
Burnside
Eastwood/Glenunga
Kensingtn Gdn/Magill
Kensington Pk
Rose Pk/Toorak Gdn
Owner/Purchaser - Occupied
Rented / Tenanted
n=794
GEN
DER
AGE
COHO
RTW
ARD
TEN
ANCY
TOTA L
Mean (0-10 scale)
Q3 Thinking now about the environment, how satisfied are you that Council has performed each of the following services or facilities.
Q3e Hard waste and Electronic waste management.
Extremely dissatisfied
Extremely satisfied
49

8531 City of Burnside Annual Community Survey 2013 Page 36
After hours and hazard response management, among those who were able to rate this element, was a moderate 6.6 mean score. The most notable variation in response was among renters versus owner / occupiers (5.8 mean versus 6.6 mean respectively), a statistically significant difference. Tenants were significantly more likely to indicate they do not know about after hours and hazard response management (73% versus 53% of residents).
(Note that not having used the service generally resulted in a “don’t know” response and these are not calculated in the mean scores).
Fig 21: After hours, hazard response management
6.6
6.6
6.8
6.7
6
6.5
6.5
6.7
6.9
6.2
6.8
6.7
6.4
6.8
6.7
6.6
5.8
6.6
0 1 2 3 4 5 6 7 8 9 10
Male
Female
Under 35's
35 - 44 yrs
45 - 54 yrs
55-64 yrs
65-74 yrs
75-84 yrs
85+ yrs
Beaumont
Burnside
Eastwood/Glenunga
Kensingtn Gdn/Magill
Kensington Pk
Rose Pk/Toorak Gdn
Owner/Purchaser - Occupied
Rented / Tenanted
n=794
GEN
DER
AGE
COHO
RTW
ARD
TEN
ANCY
TOTA L
Mean (0-10 scale)
Q3 Thinking now about the environment, how satisfied are you that Council has performed each of the following services or facilities.
Q3f After hours and hazard response management.
Extremely dissatisfied
Extremely satisfied
50

8531 City of Burnside Annual Community Survey 2013 Page 37
3.3.2 Improvements to Protected and Valued Environment
When asked for their suggestions to improve Protection and Valuing the Environment, nearly half (48%) had nothing further to suggest.
The top response was for more hard rubbish collections (mentioned by 15% of all respondents), followed by more general waste and green waste collections (9%) and more recycling of electronic waste (6%).
Fig 22 :Improvements to environmental planning
These findings are also reflected in the “Word Cloud” overleaf.
48
15
11
9
6
5
4
4
3
2
1
3
0 10 20 30 40 50 60 70 80 90 100
Nothing further to add
More hard rubbish collections
Don't know / can't say
More rubbish collection - waste/green
More electronic waste collections/morerecycling planr for electronic waste
More information/communication betweencouncil and residents.
Maintenance oftrees/parks/verges/footpaths/roads/lighting
Better water mangement/maintenance ofwater catchemnets/retaining storm…
More information about bushfiremanagement for residents.
Recycling plant/dropp off forbottles/hazardous waste (paint, chemicals,…
Nothing wrong with the old wastage (bin)system
Other
% of responses (incl. multiple response)
Q4 Are there any ways in which these areas of Council business could be improved? BASE: Total sample, n=794
51

8531 City of Burnside Annual Community Survey 2013 Page 38
52

8531 City of Burnside Annual Community Survey 2013 Page 39
3.4 Diverse, Supportive, Happy and Healthy People
All respondents were read out statements regarding various elements of the key direction Diverse, Supportive, Happy and Healthy People. They were asked to rate their level of satisfaction with each statement, using a 0 to 10 scale where 0 meant strongly dissatisfied and 10 indicated they were strongly satisfied.
The statements and proportions for satisfied, neutral or dissatisfied responses with each element of Diverse, Supportive, Happy and Healthy People, were as shown in the graph below.
At the top level, the presentation and cleanliness of the City drew the highest level of satisfaction (96%), followed closely by the provision of library services (92%).
At the other end of the scale satisfaction with support for local businesses gained the lowest level of satisfaction (33% across all respondents), although a higher proportion (51%) could not put forward a rating for this element.
Noted also was a relatively low level of satisfaction with providing services for younger residents (42%) against the comparatively high 9% indicating they were dissatisfied with this aspect.
Fig 23: Social Capital overall
33
42
49
51
55
61
63
65
92
96
10
11
11
7
6
5
10
5
3
3
5
9
5
3
3
1
6
2
0
1
51
38
35
40
36
33
21
28
5
0
0% 20% 40% 60% 80% 100%
Support for local businesses
Providing services for younger residents
Providing animal and pest management services
Providing public and environmental healthservices
Providing services for families
Providing a community bus service
Community and cultural activities
Providing services for older residents
Providing library services
Presentation and cleanliness of the City
DIVERSE, SUPPORTIVE, HAPPY & HEALTHY PEOPLE OVERALL (0-10 Scale)
Satisfied Neither Dissatisfied Don’t' know
53

8531 City of Burnside Annual Community Survey 2013 Page 40
3.4.1 Elements of Diverse, Supportive, Happy and Healthy People
When support for local businesses was analysed by those who actually owned a business (either within the City or outside, home based or on the road), there were slightly higher levels of agreement, in particular among those with a business within the City or a home-based business (39% and 44% respectively were satisfied and the proportion who said they don’t know fell to 30% among these two groups).
Fig 24: Support for local businesses by business ownership
44
39
33
42
31
12
22
12
20
8
13
9
4
11
4
30
30
51
27
56
0% 20% 40% 60% 80% 100%
Home-based business (n=68)
Business within Council area (n=23)
Business outside Council area (n=83)
Various locations/clients' premises (n=19)
Do not own a business (n=595)
Q5a Support for local businesses by business ownership/location of business
(0-10 Scale)
Satisfied Neither Dissatisfied Don’t' know
54

8531 City of Burnside Annual Community Survey 2013 Page 41
As noted, support for local businesses was rated fairly low for satisfaction across all respondents (6.2 mean score) and dropped below the average among residents 45 to 54 year old (5.7 mean) and among
Fig 25: Support for local businesses
6.2
6.3
6.4
6.6
5.7
6.0
6.1
6.5
6.6
6.3
6.2
6.0
6.4
6.7
5.9
6.2
6.5
6.2
0 1 2 3 4 5 6 7 8 9 10
Male
Female
Under 35's
35 - 44 yrs
45 - 54 yrs
55-64 yrs
65-74 yrs
75-84 yrs
85+ yrs
Beaumont
Burnside
Eastwood/Glenunga
Kensingtn Gdn/Magill
Kensington Pk
Rose Pk/Toorak Gdn
Owner/Purchaser - Occupied
Rented / Tenanted
n=800
GEN
DER
AGE
COHO
RTW
ARD
TEN
ANCY
TOTA L
Q5. Thinking now about supporting the community, how satisfied are you with the way Council has performed each of the following services or
facilities.
Q5a Support for local businesses
55

8531 City of Burnside Annual Community Survey 2013 Page 42
Community and cultural activities attracted a mean score of 6.8 overall, with the oldest cohorts being most satisfied with these two elements (75 plus year olds 7.9 and 7.8 respectively).
Fig 26: Community and cultural activities
6.7
7.0
6.7
6.5
6.3
6.9
7.1
7.9
7.8
6.9
6.6
7.0
7.1
6.7
6.6
6.8
7.2
6.8
0 1 2 3 4 5 6 7 8 9 10
Male
Female
Under 35's
35 - 44 yrs
45 - 54 yrs
55-64 yrs
65-74 yrs
75-84 yrs
85+ yrs
Beaumont
Burnside
Eastwood/Glenunga
Kensingtn Gdn/Magill
Kensington Pk
Rose Pk/Toorak Gdn
Owner/Purchaser - Occupied
Rented / Tenanted
n=800
GEN
DER
AGE
COHO
RTW
ARD
TEN
ANCY
TOTA L
Q5. Thinking now about supporting the community, how satisfied are you with the way Council has performed each of the following services or
facilities.
Q5b Community and cultural activities
56

8531 City of Burnside Annual Community Survey 2013 Page 43
Provision of public and environmental health services rated at a satisfactory level (6.9 mean) although 40% of residents could not provide a response (51% satisfied versus 40% don’t know). The proportion dissatisfied was low (3%).
As has been noted regarding some of these other social indicators, the oldest residents showed higher rates of satisfaction (as shown in the graph below).
Fig 27: Providing public and environmental health services
6.8
7.1
7.2
6.4
6.9
6.7
6.8
7.4
7.6
6.9
6.9
6.9
7.1
7.2
6.7
6.9
6.9
6.9
0 1 2 3 4 5 6 7 8 9 10
Male
Female
Under 35's
35 - 44 yrs
45 - 54 yrs
55-64 yrs
65-74 yrs
75-84 yrs
85+ yrs
Beaumont
Burnside
Eastwood/Glenunga
Kensingtn Gdn/Magill
Kensington Pk
Rose Pk/Toorak Gdn
Owner/Purchaser - Occupied
Rented / Tenanted
n=800
GEN
DER
AGE
COHO
RTW
ARD
TEN
ANCY
TOT
AL
Q5. Thinking now about supporting the community, how satisfied are you with the way Council has performed each of the following services or
facilities.
Q5c Providing public and environmental health services
57

8531 City of Burnside Annual Community Survey 2013 Page 44
Provision of services for older residents rated highly (7.6 mean score, 65% satisfied versus 2% dissatisfied). As may be expected, older residents showed higher satisfaction levels although most residents regardless of whether they may be users of these services or not rated this element highly.
Fig 28: Providing services for older residents
7.4
7.7
7.7
7.5
7.3
7.4
7.4
8.0
8.3
7.6
7.5
7.6
7.5
7.6
7.7
7.6
7.4
7.6
0 1 2 3 4 5 6 7 8 9 10
Male
Female
Under 35's
35 - 44 yrs
45 - 54 yrs
55-64 yrs
65-74 yrs
75-84 yrs
85+ yrs
Beaumont
Burnside
Eastwood/Glenunga
Kensingtn Gdn/Magill
Kensington Pk
Rose Pk/Toorak Gdn
Owner/Purchaser - Occupied
Rented / Tenanted
n=800
GEN
DER
AGE
COHO
RTW
ARD
TEN
ANCY
TOTA L
Q5. Thinking now about supporting the community, how satisfied are you with the way Council has performed each of the following services or
facilities.
Q5d Providing services for older residents
58

8531 City of Burnside Annual Community Survey 2013 Page 45
Provision of services for younger residents did not rate as highly as those provided to older residents (6.2 mean overall, 42% satisfied versus 9% dissatisfied with this element).
Most notable among the socio-demographic analysis was the finding that residents in the 45 to 54 year cohort (most likely middle family life-stage) showed a relatively low level of satisfaction with this element (25% of this cohort were dissatisfied versus 35% satisfied).
Fig 29: Providing services for younger residents
6.1
6.3
6.5
6.2
5.4
6.3
6.4
7.0
6.3
6.0
6.2
6.4
6.3
6.4
6.2
6.2
6.7
6.2
0 1 2 3 4 5 6 7 8 9 10
Male
Female
Under 35's
35 - 44 yrs
45 - 54 yrs
55-64 yrs
65-74 yrs
75-84 yrs
85+ yrs
Beaumont
Burnside
Eastwood/Glenunga
Kensingtn Gdn/Magill
Kensington Pk
Rose Pk/Toorak Gdn
Owner/Purchaser - Occupied
Rented / Tenanted
n=800
GEN
DER
AGE
COHO
RTW
ARD
TEN
ANCY
TOTA L
Q5. Thinking now about supporting the community, how satisfied are you with the way Council has performed each of the following services or
facilities.Q5e Providing services for younger residents
59
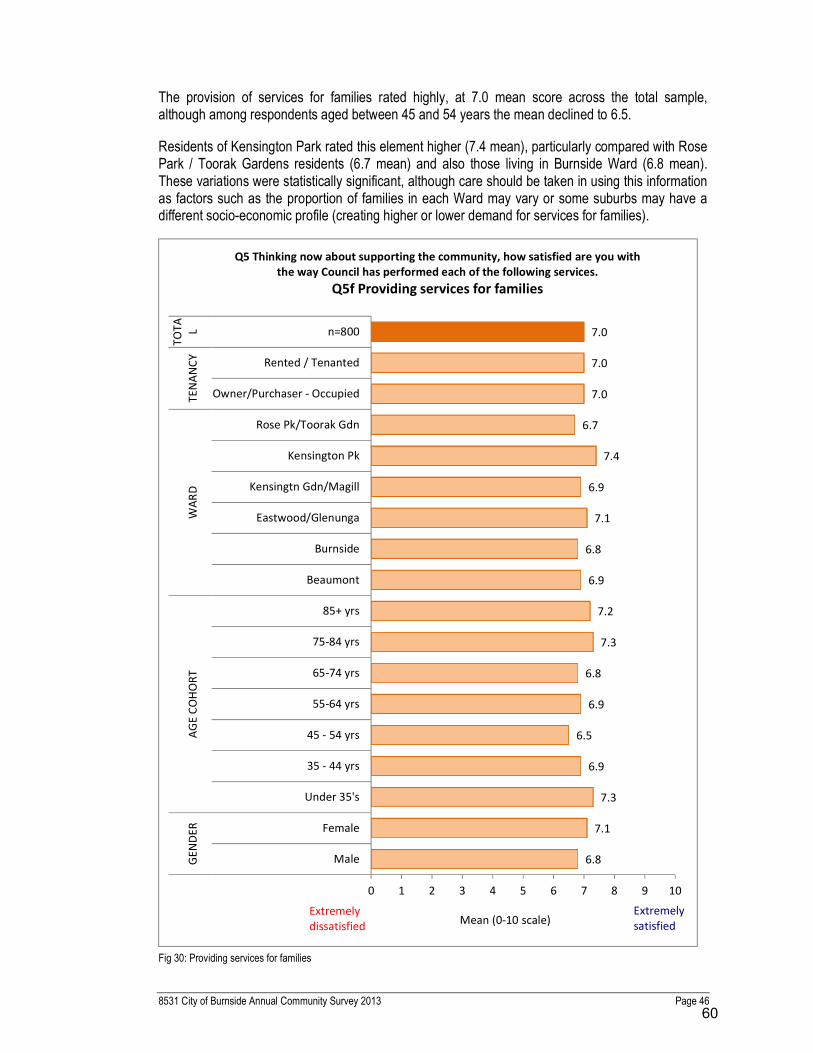
8531 City of Burnside Annual Community Survey 2013 Page 46
The provision of services for families rated highly, at 7.0 mean score across the total sample, although among respondents aged between 45 and 54 years the mean declined to 6.5.
Residents of Kensington Park rated this element higher (7.4 mean), particularly compared with Rose Park / Toorak Gardens residents (6.7 mean) and also those living in Burnside Ward (6.8 mean). These variations were statistically significant, although care should be taken in using this information as factors such as the proportion of families in each Ward may vary or some suburbs may have a different socio-economic profile (creating higher or lower demand for services for families).
Fig 30: Providing services for families
6.8
7.1
7.3
6.9
6.5
6.9
6.8
7.3
7.2
6.9
6.8
7.1
6.9
7.4
6.7
7.0
7.0
7.0
0 1 2 3 4 5 6 7 8 9 10
Male
Female
Under 35's
35 - 44 yrs
45 - 54 yrs
55-64 yrs
65-74 yrs
75-84 yrs
85+ yrs
Beaumont
Burnside
Eastwood/Glenunga
Kensingtn Gdn/Magill
Kensington Pk
Rose Pk/Toorak Gdn
Owner/Purchaser - Occupied
Rented / Tenanted
n=800
GEN
DER
AGE
COHO
RTW
ARD
TEN
ANCY
TOTA L
Mean (0-10 scale)
Q5 Thinking now about supporting the community, how satisfied are you with the way Council has performed each of the following services.
Q5f Providing services for families
Extremely dissatisfied
Extremely satisfied
60

8531 City of Burnside Annual Community Survey 2013 Page 47
As noted earlier, presentation and cleanliness of the City is rated highly in terms of satisfaction (8.0 mean across the total sample) and showed little significant variation across socio-demographic and geographic sub-groups.
Fig 31: Presentation and cleanliness of the City
8.0
8.0
8.2
7.9
7.6
7.9
7.8
8.1
8.3
8.2
7.9
8.1
8.2
7.8
7.8
7.9
8.3
8.0
0.0 1.0 2.0 3.0 4.0 5.0 6.0 7.0 8.0 9.0 10.0
Male
Female
Under 35's
35 - 44 yrs
45 - 54 yrs
55-64 yrs
65-74 yrs
75-84 yrs
85+ yrs
Beaumont
Burnside
Eastwood/Glenunga
Kensingtn Gdn/Magill
Kensington Pk
Rose Pk/Toorak Gdn
Owner/Purchaser - Occupied
Rented / Tenanted
n=800
GEN
DER
AGE
COHO
RTW
ARD
TEN
ANCY
TOTA L
Mean (0-10 scale)
Q5 Thinking now about supporting the community, how satisfied are you with the way Council has performed each of the following services.
Q5g Presentation and cleanliness of the City
Extremely dissatisfied
Extremely satisfied
61

8531 City of Burnside Annual Community Survey 2013 Page 48
Just under half (49%) of all respondents said they were satisfied with the provision of animal and pest management services (6.7 mean), compared with 5% dissatisfaction with provision of this service.
Satisfaction was slightly lower among residents of Eastwood / Glenunga (6.4 mean) but the difference was not statistically significant.
Among respondents in the 45 to 54 cohort, satisfaction was also relatively low (6.2 mean) particularly compared with under 35 year olds (7.1 mean score).
Fig 32: Providing animal and pest management services
6.6
6.8
7.1
6.8
6.2
6.4
6.6
6.8
6.9
6.5
6.7
6.4
6.9
7
6.7
6.7
6.6
6.7
0 1 2 3 4 5 6 7 8 9 10
Male
Female
Under 35's
35 - 44 yrs
45 - 54 yrs
55-64 yrs
65-74 yrs
75-84 yrs
85+ yrs
Beaumont
Burnside
Eastwood/Glenunga
Kensingtn Gdn/Magill
Kensington Pk
Rose Pk/Toorak Gdn
Owner/Purchaser - Occupied
Rented / Tenanted
n=800
GEN
DER
AGE
COHO
RTW
ARD
TEN
ANCY
TOTA L
Mean (0-10 scale)
Q5 Thinking now about supporting the community, how satisfied are you with the way Council has performed each of the following services.
Q5h Providing animal and pest management services
Extremely dissatisfied
Extremely satisfied
62

8531 City of Burnside Annual Community Survey 2013 Page 49
Provision of a community bus service rated highly (7.6 mean), particularly among the oldest cohort (8.3 mean).
Fig 33: Providing a community bus service
7.5
7.6
7.4
7.2
7.5
7.5
7.7
8.1
8.3
7.6
7.4
7.7
7.6
7.6
7.4
7.5
7.7
7.6
0 1 2 3 4 5 6 7 8 9 10
Male
Female
Under 35's
35 - 44 yrs
45 - 54 yrs
55-64 yrs
65-74 yrs
75-84 yrs
85+ yrs
Beaumont
Burnside
Eastwood/Glenunga
Kensingtn Gdn/Magill
Kensington Pk
Rose Pk/Toorak Gdn
Owner/Purchaser - Occupied
Rented / Tenanted
n=800
GEN
DER
AGE
COHO
RTW
ARD
TEN
ANCY
TOTA L
Mean (0-10 scale)
Q5 Thinking now about supporting the community, how satisfied are you with the way Council has performed each of the following services.
Q5i Providing a community bus service
Extremely dissatisfied
Extremely satisfied
63

8531 City of Burnside Annual Community Survey 2013 Page 50
The library services also attracted high levels of satisfaction (8.3 mean) with few variations across sub-groups.
Fig 34: Providing library services
8.2
8.5
8.4
8.2
7.9
8.4
8.5
8.7
9.0
8.5
8.2
8.4
8.4
8.5
8.0
8.3
8.6
8.3
0 1 2 3 4 5 6 7 8 9 10
Male
Female
Under 35's
35 - 44 yrs
45 - 54 yrs
55-64 yrs
65-74 yrs
75-84 yrs
85+ yrs
Beaumont
Burnside
Eastwood/Glenunga
Kensingtn Gdn/Magill
Kensington Pk
Rose Pk/Toorak Gdn
Owner/Purchaser - Occupied
Rented / Tenanted
n=800
GEN
DER
AGE
COHO
RTW
ARD
TEN
ANCY
TOTA L
Mean (0-10 scale)
Q5 Thinking now about supporting the community, how satisfied are you with the way Council has performed each of the following services.
Q5j Providing library services
Extremely dissatisfied
Extremely satisfied
64

8531 City of Burnside Annual Community Survey 2013 Page 51
3.4.2 Improvements to Diverse, Supportive, Happy and Healthy People
Six out of ten (61%) respondents had nothing further to add towards this Key Direction and an additional 12% could not put forward any suggestions.
The most common theme was comments along the lines that “councillors should be more transparent / clarity around intentions and for greater communication/information and/ or cooperation (6% or n=46 respondents).
The word cloud overleaf demonstrates the prominence of the general themes of council services and people, library and community. More detailed analysis will be provided in the final report.
Fig 35: Suggested improvements
61
12
6
4
4
4
3
2
1
1
1
4
0 10 20 30 40 50 60 70 80 90 100
Nothing further to add
Don't know / can't say
More transparency with councillors/ clearexplanations of intentions/more
cooperation/communication/information about…
More facilities/activities for younger people and theyounger disabled/counselling for young people
Library - more child friendly staff/more funding/moreand better books, DVD's (documentaries/science).Combine services with state wide libraries/more…
Maintenance of roads/trees/walking tracks/vergesand rubbish removal/public toilets/footpaths/graffiti
More aged care services/subsidised exerciseclasses/gym/home help/meals at council/bus service
More cultural and community/family events andservices
Management of possums and feral animals/Europeanwasps
Dog and cat management - cat registration/barkingdogs
More community bus services
Other suggestions
% of responses (incl. multiple response)
Q6 Are there any ways in which these areas of Council business could be improved? BASE: Total sample, n=794
65

8531 City of Burnside Annual Community Survey 2013 Page 52
66
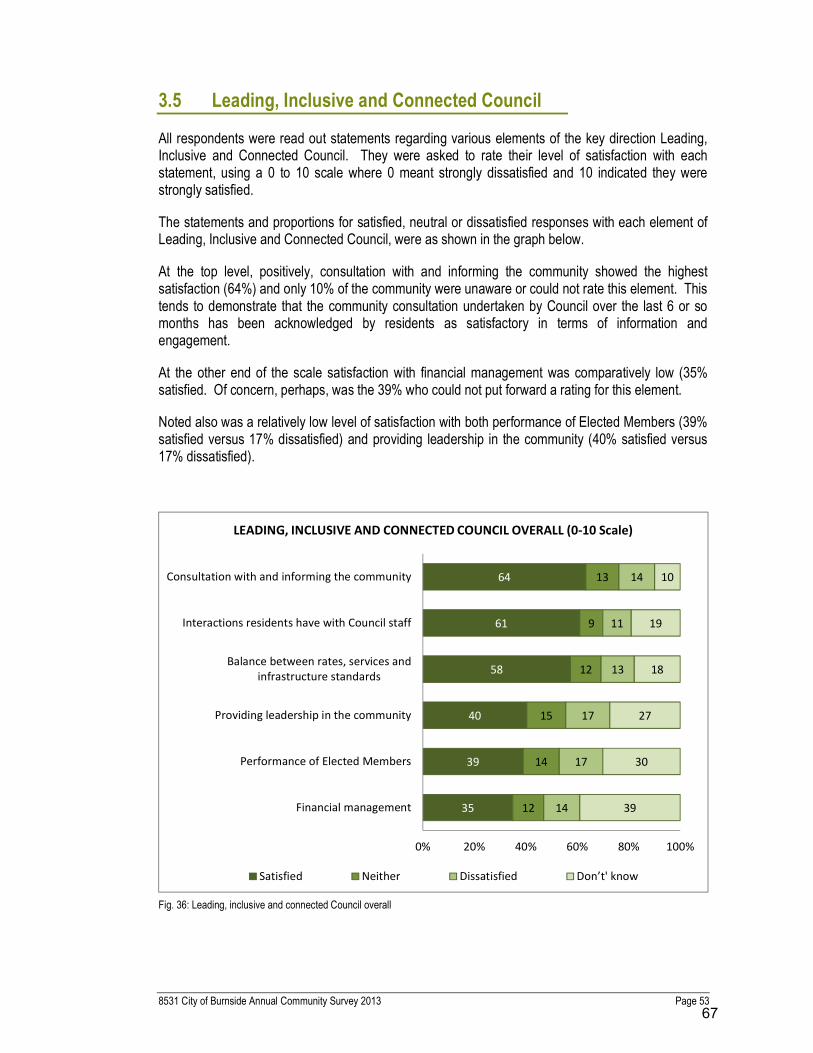
8531 City of Burnside Annual Community Survey 2013 Page 53
3.5 Leading, Inclusive and Connected Council
All respondents were read out statements regarding various elements of the key direction Leading, Inclusive and Connected Council. They were asked to rate their level of satisfaction with each statement, using a 0 to 10 scale where 0 meant strongly dissatisfied and 10 indicated they were strongly satisfied.
The statements and proportions for satisfied, neutral or dissatisfied responses with each element of Leading, Inclusive and Connected Council, were as shown in the graph below.
At the top level, positively, consultation with and informing the community showed the highest satisfaction (64%) and only 10% of the community were unaware or could not rate this element. This tends to demonstrate that the community consultation undertaken by Council over the last 6 or so months has been acknowledged by residents as satisfactory in terms of information and engagement.
At the other end of the scale satisfaction with financial management was comparatively low (35% satisfied. Of concern, perhaps, was the 39% who could not put forward a rating for this element.
Noted also was a relatively low level of satisfaction with both performance of Elected Members (39% satisfied versus 17% dissatisfied) and providing leadership in the community (40% satisfied versus 17% dissatisfied).
Fig. 36: Leading, inclusive and connected Council overall
35
39
40
58
61
64
12
14
15
12
9
13
14
17
17
13
11
14
39
30
27
18
19
10
0% 20% 40% 60% 80% 100%
Financial management
Performance of Elected Members
Providing leadership in the community
Balance between rates, services andinfrastructure standards
Interactions residents have with Council staff
Consultation with and informing the community
LEADING, INCLUSIVE AND CONNECTED COUNCIL OVERALL (0-10 Scale)
Satisfied Neither Dissatisfied Don’t' know
67

8531 City of Burnside Annual Community Survey 2013 Page 54
3.5.1 Individual Elements of Leading, Inclusive and Connected Council
At a socio-demographic and geographic level, one significant variation was the 5.6 mean score afforded to consultation with and information the community among residents of Rose Park / Toorak Gardens Ward and also the 5.7 mean among residents 45 to 54 years.
Fig 37: Consultation with and informing the community
6.0
6.5
6.0
6.6
5.7
6.1
6.4
6.9
6.7
6.0
6.4
6.5
6.1
6.7
5.6
6.2
6.4
6.2
0.0 1.0 2.0 3.0 4.0 5.0 6.0 7.0 8.0 9.0 10.0
Male
Female
Under 35's
35 - 44 yrs
45 - 54 yrs
55-64 yrs
65-74 yrs
75-84 yrs
85+ yrs
Beaumont
Burnside
Eastwood/Glenunga
Kensingtn Gdn/Magill
Kensington Pk
Rose Pk/Toorak Gdn
Owner/Purchaser - Occupied
Rented / Tenanted
n=800
GEN
DER
AGE
COHO
RTW
ARD
TEN
ANCY
TOTA L
Mean (0-10 scale)
Q7. Thinking now about how satisfied are you with the way Council has performed in each of the following services or facilities.
Q7a Consultation with and informing the community
Extremely dissatisfied
Extremely satisfied
68

8531 City of Burnside Annual Community Survey 2013 Page 55
In terms of performance of current elected members being transparent, ethical and reflecting best interests and values of the community, a mean score of 5.6 reflects a relatively low satisfaction with this aspect of services. As noted previously with consultation, residents of Rose Park / Toorak Gardens Ward and also residents 45 to 54 year showed the lowest satisfaction with this element (4.7 mean and 4.9 mean respectively).
Fig. 38: Performance of current Elected Members
5.4
5.8
5.8
5.4
4.9
5.6
5.5
6.4
6.2
5.5
5.7
5.8
5.6
6.2
4.7
5.5
6.2
5.6
0 1 2 3 4 5 6 7 8 9 10
Male
Female
Under 35's
35 - 44 yrs
45 - 54 yrs
55-64 yrs
65-74 yrs
75-84 yrs
85+ yrs
Beaumont
Burnside
Eastwood/Glenunga
Kensingtn Gdn/Magill
Kensington Pk
Rose Pk/Toorak Gdn
Owner/Purchaser - Occupied
Rented / Tenanted
n=800
GEN
DER
AGE
COHO
RTW
ARD
Mean (0-10 scale)
Q7. Thinking now about how satisfied are you with the way Council has performed in each of the following services or facilities.
Q7b Performance of current Elected Members being transparent, ethical and reflecting best interests and values of community
Extremely dissatisfied
Extremely satisfied
69

8531 City of Burnside Annual Community Survey 2013 Page 56
Interactions residents have with Council staff were rated as satisfactory, with a mean score of 6.9 and increasing further among renters (7.9 mean) and residents over 75 years of age (7.8 and 8.0 mean scores respectively).
Females also showed significantly higher satisfaction with staff interactions compared with males.
Fig. 39: Interactions with Council staff
6.6
7.2
6.7
6.9
6.3
6.8
7.1
7.8
8
6.9
6.7
7.0
7.1
6.9
6.7
6.8
7.9
6.9
0 1 2 3 4 5 6 7 8 9 10
Male
Female
Under 35's
35 - 44 yrs
45 - 54 yrs
55-64 yrs
65-74 yrs
75-84 yrs
85+ yrs
Beaumont
Burnside
Eastwood/Glenunga
Kensingtn Gdn/Magill
Kensington Pk
Rose Pk/Toorak Gdn
Owner/Purchaser - Occupied
Rented / Tenanted
n=800
GEN
DER
AGE
COHO
RTW
ARD
TEN
ANCY
TOTA L
Mean (0-10 scale)
Q7 Thinking about how satisfied you are with the way Council had performed in each of the following services or facilities.
Q7c The interactions you have with Council Staff.
Extremely dissatisfied
Extremely satisfied
70

8531 City of Burnside Annual Community Survey 2013 Page 57
As mentioned earlier, providing leadership in the community was quite low in satisfaction (5.6 mean score, 40% satisfied) and feel even further among residents of Rose Park / Toorak Gardens (4.7 mean score) and those in the middle-mature family life-stage (4.6 mean).
Fig. 40: Providing leadership in the community
5.7
5.5
6.0
5.7
4.6
5.4
5.7
6.4
6.5
5.7
5.8
5.6
6
5.8
4.7
5.6
5.3
5.6
0 1 2 3 4 5 6 7 8 9 10
Male
Female
Under 35's
35 - 44 yrs
45 - 54 yrs
55-64 yrs
65-74 yrs
75-84 yrs
85+ yrs
Beaumont
Burnside
Eastwood/Glenunga
Kensingtn Gdn/Magill
Kensington Pk
Rose Pk/Toorak Gdn
Owner/Purchaser - Occupied
Rented / Tenanted
n=800
GEN
DER
AGE
COHO
RTW
ARD
TEN
ANCY
TOTA L
Mean (0-10 scale)
Q7. Thinking now about how satisfied are you with the way Council has performed in each of the following services or facilities.
Q7d Providing leadership in the community
Extremely dissatisfied
Extremely satisfied
71

8531 City of Burnside Annual Community Survey 2013 Page 58
The aspect of financial management was also rated quite low in terms of performance (5.6 mean score), with 35% of respondents stating they were satisfied with this aspect of service. Among Rose Park / Toorak Gardens Ward residents (5.0 mean) and those in the 45 to 54 cohort (4.8 mean) satisfaction declined further. Also noted was a significant variation in the proportion of females stating they did not know about Council’s financial management (48% versus 30% of males).
On the other hand, residents in the 75 plus cohorts showed higher levels of satisfaction with financial management (6.6 and 6.3 mean scores respectively).
Fig. 41: Financial management
5.7
5.5
5.9
5.2
4.8
5.5
5.9
6.6
6.3
5.4
5.7
5.7
5.9
5.9
5.0
5.6
5.7
5.6
0 1 2 3 4 5 6 7 8 9 10
Male
Female
Under 35's
35 - 44 yrs
45 - 54 yrs
55-64 yrs
65-74 yrs
75-84 yrs
85+ yrs
Beaumont
Burnside
Eastwood/Glenunga
Kensingtn Gdn/Magill
Kensington Pk
Rose Pk/Toorak Gdn
Owner/Purchaser - Occupied
Rented / Tenanted
n=800
GEN
DER
AGE
COHO
RTW
ARD
TEN
ANCY
TOTA L
Mean (0-10 scale)
Q7. Thinking now about how satisfied are you with the way Council has performed in each of the following services or facilities.
Q7e Financial management
Extremely dissatisfied
Extremely satisfied
72

8531 City of Burnside Annual Community Survey 2013 Page 59
Positively, the balance between Council rates, services and the standard of infrastructure provided was satisfactory for more than half of all respondents (6.2 mean score, 58% satisfied), with relatively minor variations except that the oldest respondents were more favourable towards this element than those in the middle / mature family life-stage (as has been noted across many aspects of the range of services provided by Council).
Fig. 42: Balance between rates and services / infrastructure
6.2
6.2
6.3
6.1
5.6
6.2
6.3
7.0
7.2
6.1
6.3
6.4
6.2
6.5
5.9
6.2
6.7
6.2
0 1 2 3 4 5 6 7 8 9 10
Male
Female
Under 35's
35 - 44 yrs
45 - 54 yrs
55-64 yrs
65-74 yrs
75-84 yrs
85+ yrs
Beaumont
Burnside
Eastwood/Glenunga
Kensingtn Gdn/Magill
Kensington Pk
Rose Pk/Toorak Gdn
Owner/Purchaser - Occupied
Rented / Tenanted
n=800
GEN
DER
AGE
COHO
RTW
ARD
TEN
ANCY
TOTA L
Mean (0-10 scale)
Q7. Thinking now about how satisfied are you with the way Council has performed in each of the following services or facilities.
Q7f The balance between Council rates and the services and standard of infrastructure provided
Extremely dissatisfied
Extremely satisfied
73

8531 City of Burnside Annual Community Survey 2013 Page 60
3.5.2 Suggested improvements to Leading, Inclusive and Connected Council
Despite rating some of the elements of a Leading, Inclusive and Connected Council relatively low in terms of satisfaction with the performance, more than two thirds of all respondents either had nothing further to say on the topic (54%) or could not put forward any suggestions (13%).
The most common theme among the suggestions put forward was along the lines that Council should keep in touch/listen and consult and better communicate with residents, mentioned by around one in ten (11%).
Fig. 43: Suggestions for improvement
54
13
11
7
4
3
3
2
2
1
6
0 10 20 30 40 50 60 70 80 90 100
Nothing further to add
Don't know / can't say
Council should be in touch with residents/listenand consult/better communication/notify of
works projects.
More honesty, transparency and open abouttheir dealings, financial or any with any other
council business
Elected members should contact residents, getto know them/not seen or heard from an
elected member
Better budgeting/notifying residents of whereand how their money is being spent/forward
planning
Reduce rates/greater concessions/ rates notbased soley on property value, based on how
many people live in house, size of block.
Stop the in-house fighting
Staff can be rude/need to be morefriendly/helpful
When will we get to see the release of report
Other suggestion
% of responses (incl. multiple response)
Q8 Are there any ways in which these areas of Council business could be improved? BASE: Total sample, n=794
74

8531 City of Burnside Annual Community Survey 2013 Page 61
Without taking into account common words and the word Council, the word cloud below demonstrates communication as a key theme across all of the comments and suggestions around Leading, Inclusive and Connected Council.
75

8531 City of Burnside Annual Community Survey 2013 Page 62
3.6 Services Not Currently Provided by Council
When asked if there is any service they would like Council to provide that it currently does not, three in every four residents either had nothing further to add (61%) or could not put forward any suggestions (16%).
Among the suggestions, the two most common themes, each nominated by 5% of respondents, were:
• More waste collections (hard, electronic, green, hazardous mentioned specifically) and local location for collection of these waste products, and
• Policy review for maintenance works, including trees, roads, footpaths etc.
Fig. 44: Services not currently provided by Council
61
16
5
5
3
2
2
6
0 10 20 30 40 50 60 70 80 90 100
Nothing further to add
Don't know / can't say
Collection of hard, electronic, hazardous andgreen waste more frequently. Dumpinglocation within council for these wastes.
More maintenance oftrees/footpaths/roads/gutters/general
maintenance of council parks.
More recreation facilities/open areas/walking,cycling trails/dog park/BMX/skateboard
Transport/home help/facilities for elderly andpeople with disabilities eg: shopping,
gardening exercising, support
Engagement with community/moreinformation/phone service/face to face
contact with members
Other suggestion
% of responses (incl. multiple response)
Q9 Is there any service that you would like Council to provide that it currently does not? BASE: Total sample, n=794
76

8531 City of Burnside Annual Community Survey 2013 Page 63
As the word cloud demonstrates waste, hard and rubbish were key themes.
Whilst only 2% of respondents overall mentioned additional services for the elderly, it was still mentioned frequently enough in the open ended quotes to be fairly prominent in the diagram.
77

8531 City of Burnside Annual Community Survey 2013 Page 64
3.7 Current services which should not be provided by Council
Only 3% of respondents perceived that there were services currently provided by Council that they considered should not be provided.
Fig 45: Current services which should not be provided
Among the quotes to explain which services they thought should be cut, community meals was the most prominent service some respondents thought could be cut due to perceived misuse of the service. However, this was a very small minority viewpoint.
73 24 3
0% 10% 20% 30% 40% 50% 60% 70% 80% 90% 100%
% of responses (incl. multiple response)
Q10 Is there any service that Council currently provides that you consider it should not? BASE: Total sample, n=794
Nothing further to add Don't know / can't say Other suggestion
78

8531 City of Burnside Annual Community Survey 2013 Page 65
3.8 Council’s Overall Performance
When respondents were asked about Council’s overall performance, satisfaction was moderate (6.7 mean score), with the majority (77%) stating they were satisfied with the overall performance. One in three (34%) said they were very satisfied with Council’s overall performance in the last 12 months (i.e. rated 8 out of 10 or higher).
As has been noted across other performance indicators, residents of Rose Park / Toorak Gardens Ward and also those in the 45 to 54 cohort showed lower satisfaction rates than other sub-groups (6.4 and 6.1 mean scores respectively).
Fig. 46: Overall performance of Council
6.6
6.8
7
6.5
6.1
6.5
6.8
7.3
7.3
6.6
6.6
6.7
6.8
7
6.4
6.7
7.1
6.7
0 1 2 3 4 5 6 7 8 9 10
Male
Female
<35
35-44
45-54
55-64
65-74
75-84
85+
Beaumont
Burnside
Eastwood / Glenunga
Kensington Gdns / Magill
Kensington Pk
Rose Park/Toorak Gdns
Owner-occupied
Rented/tenanted
TOTAL
GEN
DER
AGE
WAR
DTE
NAN
CYTO
TA L
Q11 How satisfied or dissatisfied are you with Council's overall performance over the past 12 months. (0 to 10 scale)
BASE: Total sample, n=794
79

8531 City of Burnside Annual Community Survey 2013 Page 66
3.9 Cat Management
There was strong agreement among respondents that the City should have a cat management approach similar to the way Council manages dogs, with a mean score of 7.7 overall. The vast majority (79%) of respondents support this policy (compared with 11% disagreeing).
Support was fairly even across socio-demographic sub-groups and when analysed by Ward, although Burnside residents were slightly less supportive of the proposed policy.
Fig. 47: Cat management approach
7.7
7.7
7.5
7.8
7.8
7.7
7.8
8.1
7.6
7.6
7.4
7.7
8.0
8.0
7.6
7.7
7.7
7.7
0 1 2 3 4 5 6 7 8 9 10
Male
Female
<35
35-44
45-54
55-64
65-74
75-84
85+
Beaumont
Burnside
Eastwood / Glenunga
Kensington Gdns / Magill
Kensington Pk
Rose Park/Toorak Gdns
Owner-occupied
Rented/tenanted
TOTAL
GEN
DER
AGE
WAR
DTE
NAN
CYTO
TA L
Q11 How strongly do you agree or disagree that "The City of Burnside should have a cat management approach similar to the
way Council manages dogs". (0 to 10 scale) BASE: Total sample, n=794
80

8531 City of Burnside Annual Community Survey 2013 Page 67
3.10 Change to Road Rules
Respondents were also asked to indicate the extent they agree or disagree with Council supporting Unley Council in lobbying State Government to change the road rules to allow parking on residents’ driveway crossover using a permit system.
A mean score of 5.9 indicates that this potential change would have moderate support (57% rated their agreement at 6 out of 10 or higher), whilst 43% of these strongly agreed with support for this change to the road rules. On the other hand, one in four (26%) residents disagreed with support for this change (13% of whom rated their agreement at zero).
Among 45 to 54 year olds, the mean score declined to 4.9 (same as for renters), whilst residents of Eastwood / Glenunga Ward also showed lower levels of agreement than most (5.3 mean score). A similar finding was noted among residents of Rose Park / Toorak Gardens Ward (5.4 mean score), particularly in comparison to residents of Burnside (6.6 mean score).
81

8531 City of Burnside Annual Community Survey 2013 Page 68
Fig. 48: Support for change to Road Rules
5.9
6.0
6.4
6.1
4.9
6.0
6.0
5.7
6.4
6.1
6.6
5.3
6.1
6.0
5.4
6.0
4.9
5.9
0 1 2 3 4 5 6 7 8 9 10
Male
Female
<35
35-44
45-54
55-64
65-74
75-84
85+
Beaumont
Burnside
Eastwood / Glenunga
Kensington Gdns / Magill
Kensington Pk
Rose Park/Toorak Gdns
Owner-occupied
Rented/tenanted
TOTALGE
NDE
RAG
EW
ARD
TEN
ANCY
TOT
AL
Mean score (0-10 scale)
Q13 City of Unley seeking support to lobby State Govt. to change Australian Road Rules to allow parking on residents' driveway crossover,
using permit system. To what extent do you agree or disagree that Burnside Council should support this change?
82

8531 City of Burnside Annual Community Survey 2013 Page 69
APPENDIX A1: METHODOLOGY
83

8531 City of Burnside Annual Community Survey 2013 Page 70
A1.1 The interviewing
This telephone survey was conducted with a random sample of n=800 residents of Burnside, drawn randomly from the Electronic White Pages. All interviews were conducted by Harrison Research, using Computer Aided Telephone Interviewing technology (CATI), by Interviewer Quality Control Accreditation (IQCA) interviewers, in accordance with the Market & Social Research Privacy Principles (M&SRPPs).
The interview duration averaged 17.5 minutes, depending on the answers given by respondents. Prior to the fieldwork, a draft questionnaire (survey instrument) was constructed by Harrison Research with input from the client, with some revisions made to the final version. The actual instrument used can be found in Appendix A2: Questionnaire.
A1.2 Resultant sample
Fieldwork began on 11 February 2013 and finished on 17 February 2013.
The sample was random, although an attempt was made to obtain a representation across the age of the population by using the “birthday last” technique so as to avoid bias in the raw sample towards older females.
The raw data was subsequently weighted to correspond with the population distributions by Age and Gender (ABS 2011 Census Data) and also by Wards (provided by City of Burnside Council).
Variations in the unweighted data compared with weighted data are acceptable, due to rounding up or down during the weighting. The marginally lower unweighted figure for completed interviews, is due to several respondents not wishing to provide their age.
Raw Data # Raw Data % Weighted Data # Weighted Data %Male 346 43.3% 389 49.0%Female 454 56.7% 405 51.0%
800 100.0% 794 100.0%
< 35 yrs 63 7.9% 217 27.3%35-44 yrs 28 3.5% 114 14.3%45-54 yrs 78 9.8% 140 17.6%55-64 yrs 140 17.6% 132 16.6%65-74 yrs 231 29.0% 93 11.7%75-84 yrs 164 20.6% 64 8.0%85+ yrs 90 11.3% 35 4.4%
794 99.7% 795 99.9%
Raw Sample Weighted SampleBeaumont 19 16Burnside 16 16Eastwood 16 17Kensington Gardens / Magill 16 17Kensington Park 18 17Rose Park / Toorak Gardens 16 16
84

8531 City of Burnside Annual Community Survey 2013 Page 71
A1.3 Socio-demographic Profile of Sample
The following graphs show the socio-demographic profile of the final sample, after weighting.
Fig. 49: Household category
Fig. 50: Employment Status
2
4
6
10
11
17
24
26
0 10 20 30 40 50 60 70 80 90 100
Young cple, no chldrn
Couple/single family, mainly pre-schoolers
Group h/hold, related or unrelatedadults
Couple/single family, mainly teens
Couple/single family, mainly primary-schoolers
Lone person household
Older couple, no childrn
Couple/single family, mainly adultchildren
Q18 HOUSEHOLD CATEGORY
3
3
3
12
20
23
36
0 10 20 30 40 50 60 70 80 90 100
Unemployed
Home duties
Pensioner (non-age)
Student
Part-time employed
Retired / aged pensioner
Full-time employed
Q19 EMPLOYMENT STATUS
85

8531 City of Burnside Annual Community Survey 2013 Page 72
Fig. 51: Occupation category
Fig. 52: Tenancy
3
3
4
5
6
6
21
50
0 10 20 30 40 50 60 70 80 90 100
Elementary clerical
Labourer / related
Advanced clerical
Tradesperson / related
Associate professional
Intermediate clerical
Manager / Administrator
Professional
Q20 OCCUPATION CATEGORY (BASE: n=444)
92%
8%
Q21 TENANCY
Owner occupied
Rented / tenanted
86

8531 City of Burnside Annual Community Survey 2013 Page 73
Fig. 53: Household income
Fig. 54: Business owner
4
9
12
10
13
7
15
15
15
0 10 20 30 40 50 60 70 80 90 100
<$25,000
$25,000 - <$50,000
$50,000 - <$75,000
$75,000 - <$100,000
$100,000 - <$150,000
$150,000 - <$200,000
$200,000 +
Don't know
Refused
Q22 HOUSEHOLD GROSS INCOME RANGE
1
2
3
9
11
75
0 10 20 30 40 50 60 70 80 90 100
Something else
Own a business, at various locations
Business in premises in Burnside Councilarea
Home-based business
Business in premises outside BurnsideCouncil area
No, do not own a business
Q23 BUSINESS OWNERS
87

8531 City of Burnside Annual Community Survey 2013 Page 74
APPENDIX A2: QUESTIONNAIRE
88

8531 City of Burnside Annual Community Survey 2013 Page 75
8531 CITY OF BURNSIDE ANNUAL COMMUNITY SURVEY FEBRUARY 2013 Q77P PREAMBLE "Good afternoon/evening, my name is _[Q0IV]_ from Harrison Research. We are conducting a survey on behalf of Burnside City Council about the four strategic directions which Council will implement over the next 13 years. In the process, we are speaking with people who reside in the City of Burnside and would like to provide their perceptions of Council’s service delivery performance. _ IF NECESSARY, SAY:_ This is genuine research and I guarantee we are not trying to sell you anything. _IF NECESSARY, SAY:_ If you like you can confirm this by calling the Customer Service Desk at Council on 83664200 and I can call back later. _SCREEN 1:_ Do you live in the Burnside Council area? _IF NO, THANK AND TERMINATE_ _SCREEN 2:_ Does anyone in this household work in market research or for the City of Burnside either as a staff member or an Elected Member? _IF YES, THANK AND NOTE_ Is there anyone living in this household aged 18-24? _IF YES, ASK TO SPEAK WITH THEM OR ARRANGE CALLBACK - IF MORE THAN ONE, ASK FOR ONE WITH LAST BIRTHDAY - RE-INTRODUCE AS REQUIRED _IF NO:_ Please may I speak to the person in the household, aged 18 and over, who was the last to have a birthday? _REINTRODUCE OR CALLBACK AS NECESSARY_" "The survey will take about 18 minutes to go through, depending on your answers. _IF THEY'RE HESITATING BECAUSE OF TIME_ We do need to get opinions from as wide a cross-section as possible; I could call back later if it would be more convenient. _ARRANGE CALLBACK IF REQUIRED OR CONTINUE_ _IF CONCERNED ABOUT PRIVACY_ I assure you that any information you give will remain confidential. Any identifying information, such as this phone number, is removed before we analyse the results. No one's individual answers can be passed on to our clients or anyone else. And before we start, I just need to let you know that this call may be monitored by my supervisor for training and coaching purposes. May we begin? Thank you." START Q1 URBAN FORM AND LIVING SPACES
“Q1 Thinking first about planning and infrastructure in the council area, please rate how satisfied you are that Council has performed each of the following services or facilities, using a 0 to 10 scale where 0 means extremely dissatisfied and 10 means extremely satisfied. How would you rate ……………?”
READ OUT 1-11, RND 1. The overall planning of the City 2. Protecting the built and natural heritage 3. Providing passive recreation opportunities, such as walking, picnic locations or pursuing hobbies 4. Providing active recreation opportunities, such as playing organised sport or outdoor games 5. Providing and maintaining parks and reserves 6. Providing and maintaining playgrounds
89

8531 City of Burnside Annual Community Survey 2013 Page 76
7. Providing and maintaining local roads 8. Providing and maintaining footpaths 9. Providing and maintaining street trees 10. Providing and maintaining cycle paths and walking trails 11. Provision and management of traffic and parking in the City NUM, 0-10, DK FOR EACH Q2 IMPROVEMENTS TO URBAN FORM & LIVING SPACES “Q2 Are there any ways in which these areas of Council business could be improved?” 1. Suggestion made (Q201 SPECIFY) 2. Nothing further to add 3. Don’t know / can’t say Q201 IMPROVEMENTS TO URBAN FORM & LIVING SPACES Q3. PROTECTED AND VALUED ENVIRONMENT “Q3. Thinking now about the environment, how satisfied are you with the way Council has performed each of the following services or facilities. Using the same 0 to 10 scale where 0 means extremely dissatisfied and 10 means extremely satisfied, how would you rate ……………?” READ OUT 1-6, RND 1. Preparation for and support of residents for bushfire management 2. Restoring and protecting the City’s biodiversity 3. Water Management initiatives 4. Garbage and green waste management 5. Hard waste and Electronic waste management 6. After hours and hazard response management NUM, 0-10, DK FOR EACH Q4. IMPROVEMENTS TO OUR PROTECTED AND VALUED ENVIRONMENT “Q4 Are there any ways in which these areas of Council business could be improved?” 1. Suggestion made (Q401 SPECIFY) 2. Nothing further to add 3. Don’t know / can’t say Q401 IMPROVEMENTS TO PROTECTED AND VALUED ENVIRONMENT Q5. DIVERSE, SUPPORTIVE, HAPPY AND HEALTHY PEOPLE “Q5. Thinking now about supporting the community, how satisfied are you with the way Council has performed each of the following services or facilities. Using the same 0 to 10 scale where 0 means extremely dissatisfied and 10 means extremely satisfied, how would you rate ……………?” READ OUT 1-10, RND 1. Support for local businesses 2. Community and cultural activities 3. Providing public and environmental health services 4. Providing services for older residents 5. Providing services for younger residents 6. Providing services for families 7. Presentation and cleanliness of the City 8. Providing animal and pest management services 9. Providing a community bus service 10. Providing library services
90

8531 City of Burnside Annual Community Survey 2013 Page 77
NUM, 0-10, DK FOR EACH Q6. IMPROVEMENTS TO DIVERSITY, SUPPORT, HAPPY & HEALTHY PEOPLE “Q6 Are there any ways in which these areas of Council business could be improved?” 1. Suggestion made (Q601 SPECIFY) 2. Nothing further to add 3. Don’t know / can’t say Q601 IMPROVEMENTS TO DIVERSITY, SUPPORT, HAPPY & HEALTHY PEOPLE Q7. LEADING, INCLUSIVE AND CONNECTED COUNCIL “Q7. Thinking now about how satisfied are you with the way Council has performed in each of the following services or facilities. Using the same 0 to 10 scale where 0 means extremely dissatisfied and 10 means extremely satisfied, how would you rate ……………?” READ OUT 1-6, RND 1. Consultation with and informing the community 2. The performance of current Elected Members in being transparent, ethical and reflecting the best interests and values of the community. 3. The interactions you have with Council Staff 4. Providing leadership in the community 5. Financial management 6. The balance between Council rates and the services and standard of infrastructure provided NUM, 0-10, DK FOR EACH Q8. IMPROVEMENTS TO LEADING, INCLUSIVE AND CONNECTED COUNCIL “Q8 Are there any ways in which these areas of Council business could be improved?” 1. Suggestion made (Q801 SPECIFY) 2. Nothing further to add 3. Don’t know / can’t say Q801 SUGGESTION FOR IMPROVEMENTS TO LEADING, INCLUSIVE & CONNECTED COUNCIL Q9. ADDITIONAL SERVICES NOT PROVIDED NOW “Q9 Is there any service that you would like Council to provide that it currently does not?” 1. Suggestion made (Q901 SPECIFY) 2. Nothing further to add 3. Don’t know / can’t say Q901 SUGGESTION FOR ADDITIONAL SERVICES NOT PROVIDED NOW Q10. CURRENT SERVICES SHOULD NOT BE PROVIDED “Q10 Is there any service that Council currently provides that you consider it should not?” 1. Suggestion made (Q1001 SPECIFY) 2. Nothing further to add 3. Don’t know / can’t say Q1001 SUGGESTION FOR CURRENT SERVICES SHOULD NOT BE PROVIDED Q11 OVERALL SATISFACTION WITH COUNCIL’S PERFORMANCE “Q11 How satisfied or dissatisfied are you with Council’s overall performance over the past 12 months. Please use a 0 to 10 scale, where 0 means extremely dissatisfied and 10 means extremely satisfied?”
91

8531 City of Burnside Annual Community Survey 2013 Page 78
NUM 0-10, Q12 CAT MANAGEMENT “Q12. I'd now like you to rate how strongly you agree or disagree with the following statement, using a 0 to 10 scale with 0 meaning strongly disagree and 10 meaning strongly agree. To what extent do you agree or disagree that “the City of Burnside should have a cat management approach similar to the way Council manages dogs. By this we mean registration, microchipping, desexing and limit on numbers per household?” NUM 0-10,
Q13 PARKING ON DRIVEWAY CROSSOVER OF OWN PROPERTY “Q13 The City of Unley is seeking support from neighbouring Councils to lobby the State Government to change the Australian Road Rules to allow residents to park on the driveway crossover in front of their own properties using a permit system. Using the same 0 to 10 scale, to what extent do you agree or disagree that the City of Burnside should support this change? NUM 0-10, CLASSIFICATIONS: Q14 GENDER. “Q14 We are coming to the end of the survey. I would just like you to answer a few questions about yourself so we can better understand you. This information will be kept confidential and the answers you provide are aggregated into groups _RECORD GENDER - DO NOT ASK UNLESS CAN'T TELL_" 1. Male 2. Female Q15 YOB “Q15 What year were you born? _RECORD NUMBER, D IF REFUSED_" WIDTH=4 NUM 1900-1995, D Q16 HOUSEHOLD “Q16 Which of the following best describes your household? _READ OUT 1-8_" 1. Lone person household 2. Group household of related or unrelated adults 3. Young couple, no children 4. Older couple, no children at home 5. Couple or single parent with mainly pre-school children 6. Couple or single parent with mainly primary-school children 7. Couple or single parent with mainly teenage children 8. Couple or single parent with mainly adult children still living at home 12. Refused Q17. EMPLOYMENT “Q17 What is your current employment status?" 1. Part-time employment 2. Full-time employment 3. Unemployed 4. Home duties
92

8531 City of Burnside Annual Community Survey 2013 Page 79
5. Pensioner (non-age pension) 6. Retired / age pensioner 7. Student 8. Refused IF 3-8 IN Q17 GO Q19 Q18 HOW DO YOU DESCRIBE YOUR OCCUPATION? “Q18 How do you describe your occupation? _IF NECESSARY, MAKE A NOTE AND CHECK LIST FOR CORRECT CODE_" 1. Manager / administrator 2. Professional 3. Associate professional 4. Tradesperson / related worker 5. Advanced clerical, sales & service worker 6. Intermediate clerical, sales & service worker 7. Intermediate production and transport worker 8. Elementary clerical, sales & service worker 9. Labourer / related worker Q19 SUBURB “Q19 What suburb do you live in? UNPROMPTED 1. AULDANA 2. BEAUMONT 3. BEULAH PARK 4. BURNSIDE 5. DULWICH 6. EASTWOOD 7. ERINDALE 8. FREWVILLE 9. GLENSIDE 10. GLEN OSMOND 11. GLENUNGA 12. HAZELWOOD PARK 13. KENSINGTON GARDENS 14. KENSINGTON PARK 15. LEABROOK 16. LEAWOOD GARDENS 17. LINDEN PARK 18. MAGILL 19. MOUNT OSMOND 20. ROSE PARK 21. ROSSLYN PARK 22. SKYE 23. ST GEORGES 24. STONYFELL 25. TOORAK GARDENS 26. TUSMORE 27. WATERFALL GULLY 28. WATTLE PARK
93

8531 City of Burnside Annual Community Survey 2013 Page 80
Q20 TENANCY “Q20 Is this house owner-occupied or rented?" 1. Owner-occupied 2. Rented/tenanted Q21 HOUSEHOLD GROSS INCOME “Q21 Which of the following ranges best describes your household's gross annual income? _READ OUT 1-7_" 1. Less than $25,000 per annum 2. $25,000 to less than $50,000 3. $50,000 to less than $75,000 4. $75,000 to less than $100,000 5. $100,000 to less than $150,000 6. $150,000 to less than $200,000 7. $200,000 or more 8. Don't know 9. Refused Q22 BUSINESS OWNER “Q22 Do you, or anyone else in this household, own a business? If so, would it be…..._READ OUT 1-4_" 1. A home-based business 2. Based in business premises within Burnside Council area 3. In business premises outside of Burnside Council area 4. At various locations / clients’ premises (e.g. builder, contract work, driver etc.) 5. Something else (SPECIFY Q2201) 6. No, do not own business Q2201 BUSINESS OWNER OTHER Q23 CLOSE “Q23 That concludes the survey. On behalf of Burnside City Council and Harrison Research, thank you for your time. Q24 ISO 20252 “Q24 By pressing enter at this screen, I certify that this is a true, accurate and complete interview, conducted in accordance with the ISO 20252 standards and the AMSRS Code of Professional Behaviour (ICC/ESOMAR). I will not disclose to any other person the content of this questionnaire or any other information relating to this project." BLANK Q0QUO TOTAL=800
94

8531 City of Burnside Annual Community Survey 2013 Page 81
APPENDIX A3: MARGIN FOR ERROR
95

8531 City of Burnside Annual Community Survey 2013 Page 82
A1.4 Margin for error: Because nearly all market and social research evaluates results based on population samples, rather than a census where everyone is consulted, there is an inherent degree of error in the results. However, if the sample obtained is a properly randomised section of the target population, there are statistical tests that will calculate the degree of accuracy for those results - known as the margin for error or confidence interval. Unfortunately for the layperson, there is no single figure that says, 'this is a statistically significant difference'. The factors that go into the calculation of statistical differences include: • population size - the total number of people in the target audience, not in the whole population. For
example, if an organisation were researching its casual staff's views on weekend work, the 'population' would be the total number of casual staff.
• sample size - the number of respondents, or people taking part in a survey. • the desired level of confidence in the result - for example, a 95% confidence level simply means
that, if we ran the identical survey and sampling methodology 100 times, you would expect to get a result within the calculated margin for error 95 times out of 100.
• the proximity of the result to the midpoint. This latter element (proximity to the midpoint) means that, regardless of sample or population size, a figure close to 50% is inherently less reliable than a figure close to 100%. As an example, if you wish to be 95% confident in the results for a population (N) of 45,000 and a sample (n) of 800, a result of 50% would be subject to a ±3.45% margin for error. In other words, you could be 95% confident that the real result would be somewhere between 46.55% and 53.45%. However, with the same population, sample and 95% confidence level, a result of 90% saying yes or no would be subject to a margin for error of only ±2.54%, i.e. the real result would be between 87.46% and 92.54%. The following graphs may illustrate more clearly the way margin for error works. In each case, we have calculated the confidence interval for the results. If the intervals overlap, then the differences are not statistically significant; if there is no overlap, they are reliably different.
EXAMPLE 1: PROPORTIONS CHOOSING ANSWER 'A'
5446
0
10
20
30
40
50
60
70
80
90
100
Sub-group 1 Sub-group 2
% o
f res
pond
ents
(n=4
00 fr
om po
p'n 1
millio
n)
The blue error bars show the ± margin for error at the 95% confidence level.
The dotted blue line indicates whether the error bars overlap. If they do, the results are not significantly different.
EXAMPLE 2: PROPORTIONS CHOOSING ANSWER 'A'
60
40
0
10
20
30
40
50
60
70
80
90
100
Sub-group 1 Sub-group 2
% of
resp
onde
nts (n
=400
from
pop'n
1 m
illion)
96

8531 City of Burnside Annual Community Survey 2013 Page 83
97

ANNU
AL C
OMMU
NITY
SUR
VEY
PRES
ENTA
TION
PR
ESEN
TER:
HEL
EN F
ISCH
ER, R
ESEA
RCH
MANA
GER
98

2 2 AG
ENDA
BRIE
F PR
OJEC
T OV
ERVI
EW
KEY
FIND
INGS
– PE
RFOR
MANC
E IN
DICA
TORS
KEY
FIND
INGS
– SE
RVIC
E GA
PS O
R OV
ER-S
ERVI
CING
KEY
FIND
INGS
– OV
ERAL
L SAT
ISFA
CTIO
N AN
D IM
PORT
ANCE
KEY
FIND
INGS
– TO
PICA
L ISS
UES
SUMM
ARY
OF F
INDI
NGS
99

PROJ
ECT
OVER
VIEW
100

4 4
OBJE
CTIV
ES
The C
ity of
Bur
nside
wish
ed to
unde
rtake
a be
nchm
ark A
nnua
l Com
munit
y Sur
vey t
o: ~
infor
m fur
ther d
evelo
pmen
t of th
e Dra
ft Ann
ual B
usine
ss P
lan; a
nd to
~e
xplor
e in m
ore d
etail c
ommu
nity p
erce
ption
s of s
pecif
ic ele
ments
with
in ea
ch of
the f
our K
ey D
irecti
ons.
CA
TI su
rvey c
ondu
cted
amon
g a
samp
le of
n=80
0 ra
ndom
ly se
lected
resid
ents
– ‘bi
rthda
y las
t’ tec
hniqu
e us
ed to
ga
in re
pres
entat
ion ac
ross
lifes
tages
, then
weig
hted t
o Cou
ncil’s
age,
gend
er an
d geo
grap
hic pr
ofile.
Da
tabas
e of
resid
ents’
pho
ne n
umbe
rs ch
ecke
d an
d de
-dup
licate
d ag
ainst
the n
umbe
rs of
partic
ipants
in th
e CA
TI
comp
onen
t of t
he th
ree
most
rece
nt pr
ojects
: Bur
nside
Swi
mming
Cen
tre C
ommu
nity
Enga
geme
nt, G
lenun
ga
Rese
rve C
ommu
nity E
ngag
emen
t and
the S
port
and R
ecre
ation
Acti
vity S
urve
y.
Pu
rpos
e of th
is wa
s to:
~e
nsur
e res
pond
ents
do no
t bec
ome f
atigu
ed w
ith un
derta
king s
urve
ys fo
r Cou
ncil;
and
~ens
ure
oppo
rtunit
y is
prov
ided
for p
artic
ipatio
n ac
ross
as
wide
a c
ross
-secti
on o
f the
loca
l com
munit
y as
po
ssibl
e.
Ha
rriso
n Re
sear
ch c
ontra
cted
to co
nduc
t this
stat
istica
lly re
liable
sur
vey,
as w
ell a
s an
alyse
and
repo
rt on
the
findin
gs.
101

KEY
FIND
INGS
– Pe
rform
ance
Indi
cato
rs
102

6 Pe
rform
ance
Indi
cato
rs O
verv
iew
Ac
ross
all s
ervic
e per
forma
nce i
ndica
tors t
ested
, ser
vices
whic
h attr
acted
the o
vera
ll high
est s
atisfa
ction
leve
l wer
e:
“pro
viding
libra
ry se
rvice
s” (8
.3 me
an sc
ore)
, and
“pre
sent
ation
and c
leanli
ness
of th
e City
” (8.0
mea
n sco
re).
At
the o
ther e
nd of
the s
pectr
um, th
ree a
spec
ts ra
ted at
5.6 m
ean s
core
, thes
e bein
g:
“finan
cial m
anag
emen
t”,
“per
form
ance
of cu
rrent
Elec
ted M
embe
rs be
ing tr
ansp
aren
t, eth
ical a
nd re
flecti
ng th
e be
st int
eres
ts an
d va
lues o
f the c
omm
unity
” and
“pro
viding
lead
ersh
ip in
the c
omm
unity
”.
Al
l oth
er P
erfo
rman
ce In
dicat
ors r
ated
with
in th
e goo
d / q
uite s
atisf
ied ra
nge.
Gr
aph d
emon
strat
es th
e ove
rview
acr
oss a
ll ind
icato
rs.
103

7
104

8 Pe
rform
ance
Indi
cato
rs
Mean
7.6
7.2
6.7
6.4
7.4
6.5
6.2
6.5
6.0
6.3
6.6
Hi
ghes
t leve
ls of
satis
factio
n for
par
ks
and
rese
rves
, play
grou
nds a
nd
pass
ive re
crea
tion
facilit
ies (8
5% to
71
% sa
tisfie
d and
low
dissa
tisfac
tion)
.
High
est d
issati
sfacti
on w
as w
ith
foot
path
s, lo
cal r
oads
and t
raffi
c /
park
ing
(betw
een 1
4% an
d 20%
dis
satis
fied b
ut sti
ll 65%
to 72
%
satis
fied)
.
All o
ther in
dicato
rs sh
owed
low
levels
of
dissa
tisfac
tion,
rang
ing fr
om 2%
to
13%
diss
atisfi
ed, b
alanc
ed by
stro
ng
satis
factio
n lev
els.
105

9 Su
gges
tions
for I
mpr
ovem
ent
Mo
st co
mmon
sugg
estio
ns fo
r impr
ovem
ent w
ere:
Foot
path
s nee
d rep
air / m
ainte
nanc
e or p
rovis
ion of
mor
e foo
tpat
hs (1
6% o
f sug
gesti
ons)
Herita
ge tr
ees /
main
tain
or p
rese
rve h
erita
ge, la
rge o
r sign
ifican
t tree
s (15
%)
Mor
e roa
d main
tena
nce /
resu
rfacin
g (8%
)
Mor
e bike
path
s / w
alking
trail
s (7%
)
Mor
e exe
rcise
/ play
equip
men
t (6%
) and
Car p
arkin
g iss
ues /
mon
itorin
g of p
arkin
g com
men
ts (6
%).
NOTE
: A th
ird (3
2%) o
f res
iden
ts su
rvey
ed h
ad n
o su
gges
tions
to im
prov
e any
of t
hese
urb
an fo
rm an
d liv
ing
spac
es in
dica
tors
and
a fur
ther
12%
did
not
know
wha
t to
sugg
est.
106

10
Perfo
rman
ce In
dica
tors
Mean
7.2
6.7
6.6
6.4
6.3
6.3
Hi
ghes
t leve
ls of
satis
factio
n for
was
te
and
gree
n wa
ste m
anag
emen
t (87
%
satis
fied v
ersu
s 9%
diss
atisfi
ed).
Hi
ghes
t diss
atisfa
ction
was
with
har
d an
d ele
ctro
nic w
aste
man
agem
ent
(16%
diss
atisfi
ed ve
rsus 6
8% sa
tisfie
d).
Al
l othe
r indic
ators
show
ed le
vels
of dis
satis
factio
n ran
ging f
rom
4% to
10%
dis
satis
fied b
alanc
ed by
sign
ifican
tly
stron
ger s
atisfa
ction
.
Some
of th
ese s
ervic
es sh
owed
low
levels
of aw
aren
ess (
i.e. d
on’t k
now
resp
onse
s).
Inc
luding
the C
ity’s
biod
ivers
ity an
d wa
ter m
anag
emen
t initia
tives
.
Sugg
ests
some
awar
enes
s / pr
omoti
on of
the
se ac
tivitie
s wou
ld be
valua
ble in
ga
ining
comm
unity
supp
ort.
32 35
50 56
68
87
10 8
12 14
10
3
4
10
9
6
16
9
55 47
29 24
5 1
0%20
%40
%60
%80
%10
0%
Afte
r hou
rs a
nd h
azar
d re
spon
se m
anag
emen
t
Prep
arat
ion
for a
nd su
ppor
t of r
esid
ents
for
bush
fire
man
agem
ent
Wat
er M
anag
emen
t ini
tiativ
es
Rest
orin
g an
d pr
otec
ting
the
City
's bi
odiv
ersit
y
Hard
was
te a
nd E
lect
roni
c w
aste
man
agem
ent
Gar
bage
and
gre
en w
aste
man
agem
ent
PRO
TECT
ED A
ND
VALU
ED E
NVI
RON
MEN
T O
VERA
LL (0
-10
Scal
e)
Satis
fied
Nei
ther
Diss
atisf
ied
Don’
t' kn
ow
107

11
Sugg
estio
ns fo
r Im
prov
emen
t
Mo
st co
mmon
sugg
estio
ns fo
r impr
ovem
ent w
ere:
Mor
e har
d rub
bish c
ollec
tions
(15%
)
Mor
e gre
en / w
aste
rubb
ish co
llecti
ons (
9%)
Mor
e elec
tronic
was
te co
llecti
ons /
mor
e rec
yclin
g for
elec
tronic
was
te (6
%)
Mor
e inf
orm
ation
/ com
mun
icatio
n bet
ween
Cou
ncil a
nd re
siden
ts (5
%)
NOTE
: A n
early
half
(48%
) of r
esid
ents
surv
eyed
had
no
sugg
estio
ns to
impr
ove a
ny o
f the
se p
rote
cted
an
d va
lued
envir
onm
ent i
ndica
tors
and
a fur
ther
11%
did
not
know
wha
t to
sugg
est.
108

12
Perfo
rman
ce In
dica
tors
Mean
8.0
8.3
7.6
6.8
7.6
7.0
6.9
6.7
6.2
6.2
Hi
ghes
t leve
ls of
satis
factio
n for
pr
esen
tatio
n an
d cle
anlin
ess
and p
rovid
ing
libra
ry se
rvice
s (9
6% an
d 92%
satis
fied)
.
High
est d
issati
sfacti
on w
as w
ith
prov
idin
g se
rvice
s for
yo
unge
r res
iden
ts (9
%
dissa
tisfie
d) an
d com
mun
ity
and
cultu
ral a
ctivi
ties (
6%).
Al
l othe
r indic
ators
show
ed
levels
of di
ssati
sfacti
on ra
nging
fro
m 0%
to 5%
diss
atisfi
ed
balan
ced b
y sign
ifican
tly
stron
ger s
atisfa
ction
.
Some
of th
ese s
ervic
es sh
owed
low
leve
ls of
awar
enes
s (i.e
. do
n’t kn
ow re
spon
ses).
Includ
ing su
ppor
t for
loca
l bu
sines
ses a
nd se
rvice
s for
yo
unge
r res
iden
ts.
33 42
49
51 55
61
63
65
92 96
10
11
11
7
6
5
10
5
3
3
5
9
5
3
3
1
6
2
0
1
51
38 35
40 36
33 21
28
5
0
0%20
%40
%60
%80
%10
0%
Supp
ort f
or lo
cal b
usin
esse
s
Prov
idin
g se
rvic
es fo
r you
nger
resid
ents
Prov
idin
g an
imal
and
pes
t man
agem
ent s
ervi
ces
Prov
idin
g pu
blic
and
env
ironm
enta
l hea
lth se
rvic
es
Prov
idin
g se
rvic
es fo
r fam
ilies
Prov
idin
g a
com
mun
ity b
us se
rvic
e
Com
mun
ity a
nd c
ultu
ral a
ctiv
ities
Prov
idin
g se
rvic
es fo
r old
er re
siden
ts
Prov
idin
g lib
rary
serv
ices
Pres
enta
tion
and
clea
nlin
ess o
f the
City
DIVE
RSE,
SU
PPO
RTIV
E, H
APPY
& H
EALT
HY P
EOPL
E O
VERA
LL (0
-10
Scal
e)
Satis
fied
Nei
ther
Diss
atisf
ied
Don’
t' kn
ow
109

13
Sugg
estio
ns fo
r Im
prov
emen
t
Mo
st co
mmon
sugg
estio
n for
impr
ovem
ent w
as:
Mor
e tra
nspa
renc
y / cl
ear e
xplan
ation
of in
tent
ions /
com
mun
icatio
n / m
ore i
nfor
mat
ion (6
%)
NOTE
: Six
out o
f ten
(61%
) res
iden
ts su
rvey
ed h
ad n
o su
gges
tions
to im
prov
e any
of t
hese
dive
rse,
supp
ortiv
e, ha
ppy a
nd h
ealth
y peo
ple i
ndica
tors
and
a fur
ther
12%
did
not
know
wha
t to
sugg
est.
110

14
Perfo
rman
ce In
dica
tors
Mean
6.2
6.9
6.2
5.6
5.6
5.6
Hi
ghes
t leve
ls of
satis
factio
n for
co
nsul
tatio
n an
d in
form
ing
com
mun
ity an
d int
erac
tion
with
Co
uncil
staf
f (64
% an
d 61%
sa
tisfie
d).
Hi
ghes
t diss
atisfa
ction
was
with
pr
ovid
ing
leade
rshi
p in
co
mm
unity
and p
erfo
rman
ce o
f El
ecte
d Me
mbe
rs (1
7% di
ssati
sfied
wi
th ea
ch of
thes
e).
Al
l othe
r indic
ators
show
ed le
vels
of dis
satis
factio
n ran
ging f
rom
11%
to
14%
diss
atisfi
ed. T
hese
prop
ortio
ns
are b
alanc
ed by
stro
nger
sa
tisfac
tion l
evels
.
Havin
g said
this,
the l
evels
of
dissa
tisfac
tion a
re hi
gher
than
for
other
Key
Dire
ction
s’ pe
rform
ance
ind
icator
s.
35 39
40
58 61
64
12 14
15
12 9
13
14
17 17
13
11
14
39 30
27 18
19 10
0%20
%40
%60
%80
%10
0%
Fina
ncia
l man
agem
ent
Perf
orm
ance
of E
lect
ed M
embe
rs
Prov
idin
g le
ader
ship
in th
e co
mm
unity
Bala
nce
betw
een
rate
s, se
rvic
es a
nd in
fras
truc
ture
stan
dard
s
Inte
ract
ions
resid
ents
hav
e w
ith C
ounc
il st
aff
Cons
ulta
tion
with
and
info
rmin
g th
e co
mm
unity
LEAD
ING
, IN
CLU
SIVE
AN
D CO
NN
ECTE
D CO
UN
CIL O
VERA
LL (0
-10
Scal
e)
Satis
fied
Nei
ther
Diss
atisf
ied
Don’
t' kn
ow
111

15
Sugg
estio
ns fo
r Im
prov
emen
t
Mo
st co
mmon
sugg
estio
ns fo
r impr
ovem
ent w
ere:
Coun
cil sh
ould
be in
touc
h with
resid
ents
/ liste
n and
cons
ult / b
ette
r com
mun
icatio
n / n
otify
of w
orks
pro
jects
(11%
)
Mor
e hon
esty,
tran
spar
ency
, ope
nnes
s abo
ut de
aling
s, fin
ancia
l or o
ther
coun
cil bu
sines
s (7%
).
NOTE
: Mor
e tha
n ha
lf (5
4%) o
f res
iden
ts su
rvey
ed h
ad n
o su
gges
tions
to im
prov
e any
of t
hese
lead
ing,
in
clusiv
e and
conn
ecte
d co
uncil
indi
cato
rs an
d a f
urth
er 13
% d
id n
ot kn
ow w
hat t
o su
gges
t.
112

KEY
FIND
INGS
– Se
rvice
gap
s or o
ver-s
ervic
ing
113

Curre
nt se
rvice
gap
s?
Th
e ma
jority
eith
er h
ad n
o su
gges
tions
for s
ervic
es n
ot cu
rrentl
y pr
ovide
d (6
1%) o
r did
not
kno
w wh
at to
sugg
est
(16%
).
Th
e mos
t com
mon s
ugge
stion
s wer
e com
ments
abou
t : ~C
ollec
tion
of ha
rd,
electr
onic,
haz
ardo
us a
nd g
reen
wa
ste m
ore
often
/ du
mping
loca
tion
withi
n Co
uncil
for
these
was
tes (5
%);
and
~Mor
e ma
inten
ance
of t
rees
, foo
tpaths
, roa
ds, g
utter
s, ge
nera
l main
tenan
ce in
parks
(5%
).
17
61
16
5 5 3 2 2
6
010
2030
4050
6070
8090
100
Not
hing
furt
her t
o ad
d
Don'
t kno
w /
can'
t say
Colle
ctio
n of
har
d, e
lect
roni
c, h
azar
dous
and
gree
n w
aste
mor
e fr
eque
ntly
. Dum
ping
loca
tion
with
in c
ounc
il fo
r the
se w
aste
s.
Mor
e m
aint
enan
ce o
ftr
ees/
foot
path
s/ro
ads/
gutt
ers/
gene
ral
mai
nten
ance
of c
ounc
il pa
rks.
Mor
e re
crea
tion
faci
litie
s/op
en a
reas
/wal
king
,cy
clin
g tr
ails/
dog
park
/BM
X/sk
ateb
oard
Tran
spor
t/ho
me
help
/fac
ilitie
s for
eld
erly
and
peop
le w
ith d
isabi
litie
s eg:
shop
ping
, gar
deni
ngex
erci
sing,
supp
ort
Enga
gem
ent w
ith c
omm
unity
/mor
ein
form
atio
n/ph
one
serv
ice/
face
to fa
ce c
onta
ctw
ith m
embe
rs Oth
er su
gges
tion
% o
f res
pons
es (i
ncl.
mul
tiple
resp
onse
)
Q9
Is th
ere
any
serv
ice
that
you
wou
ld li
ke C
ounc
il to
pro
vide
th
at it
cur
rent
ly d
oes n
ot?
BASE
: Tot
al sa
mpl
e, n
=794
114

Curre
nt se
rvice
s not
nee
ded?
The
over
whelm
ing m
ajority
eith
er h
ad n
o su
gges
tions
for s
ervic
es n
ot re
quire
d (7
3%) o
r did
not
kno
w wh
at to
sugg
est
(24%
).
18
73
24
3
0%10
%20
%30
%40
%50
%60
%70
%80
%90
%10
0%%
of r
espo
nses
(inc
l. m
ultip
le re
spon
se)
Q10
Is th
ere
any
serv
ice
that
Cou
ncil
curr
ently
pro
vide
s tha
t you
co
nsid
er it
shou
ld n
ot?
BASE
: Tot
al sa
mpl
e, n
=794
Not
hing
furt
her t
o ad
dDo
n't k
now
/ ca
n't s
ayO
ther
sugg
estio
n
Am
ong t
he 3%
who
mad
e sug
gesti
ons
abou
t ser
vices
they
thou
ght w
ere n
ot ne
eded
, a co
mmon
them
e was
mea
ls pr
ovide
d in c
ommu
nity c
entre
s.
Re
siden
ts ind
icated
they
thou
ght th
is se
rvice
was
abus
ed.
115

KEY
FIND
INGS
– Ov
erall
satis
fact
ion
and
impo
rtanc
e
116

Over
all sa
tisfa
ctio
n
As
ked
to ra
te Co
uncil
’s ov
erall
per
forma
nce
in las
t yea
r.
6.7
mea
n sc
ore
amon
g all
res
idents
sur
veye
d (w
ithin
the g
ood
to q
uite
satis
fied
rang
e).
No
table
acro
ss a
ll pe
rform
ance
indic
ators
was
lower
rate
s of
satis
factio
n am
ong
two
spec
ific
segm
ents:
~4
5 to
54 y
ear o
lds c
onsis
tently
less
sati
sfied
wi
th bo
th ov
erall
and
indiv
idual
perfo
rman
ce
indica
tors;
and
~Res
idents
of R
ose
Park
/ Too
rak
Gard
ens
War
d als
o sh
owed
co
nsist
ently
low
er
satis
factio
n ra
tes a
cross
ove
rall a
nd in
dividu
al pe
rform
ance
indic
tors.
Ag
e co
hort
may
have
man
y ex
plana
tions
, e.g
. life
-stag
e (te
ens
/ yo
ung
adult
s sti
ll liv
ing a
t ho
me),
gene
ratio
nal
(Gen
X)
or s
ome
other
ex
plana
tion (
just g
rump
y?).
Ma
y wish
to re
view
servi
ce p
rovis
ion to
resid
ents
of Ro
se P
ark /
Too
rak G
arde
ns?
20
6.6 6.
8 7
6.5
6.1 6.
5 6.8 7.
3
7.3
6.6
6.6 6.7 6.8 7
6.4 6.
7 7.1
6.7
01
23
45
67
89
10
Mal
e
Fem
ale
<35
35-4
4
45-5
4
55-6
4
65-7
4
75-8
4
85+
Beau
mon
t
Burn
side
East
woo
d / G
lenu
nga
Kens
ingt
on G
dns /
Mag
ill
Kens
ingt
on P
k
Rose
Par
k/To
orak
Gdn
s
Ow
ner-
occu
pied
Rent
ed/t
enan
ted
TOTA
L
GENDERAGEWARDTENANCYTOTA
L
Q11
How
satis
fied
or d
issa
tisfie
d ar
e yo
u w
ith C
ounc
il's o
vera
ll pe
rfor
man
ce o
ver t
he p
ast 1
2 m
onth
s. (
0 to
10
scal
e)
BASE
: Tot
al sa
mpl
e, n
=794
117

21
Corre
latio
n an
alysis
Ta
king
all of
the
indivi
dual
perfo
rman
ce in
dicato
rs we
have
just
gone
thro
ugh,
we un
derto
ok co
rrelat
ion
analy
sis.
Co
rrelat
ion
refer
s to s
tatist
ical re
lation
ships
invo
lving
dep
ende
nce
betw
een
two
sets
of d
ata.
Tha
t
is, ho
w the
y inte
ract
with
each
othe
r.
In
this i
nstan
ce w
e hav
e (co
rrelat
ed) c
ompa
red
the ra
tings
for i
ndivi
dual
perfo
rman
ce in
dica
tors
(the o
nes w
e hav
e jus
t exa
mine
d) a
gains
t the
ratin
gs fo
r ove
rall s
atisf
actio
n.
Th
e pur
pose
is to
reve
al an
y rela
tions
hip b
etwee
n sp
ecific
perfo
rman
ce in
dicato
rs an
d ove
rall
satis
factio
n. In
othe
r wor
ds, h
ow im
porta
nt att
ribute
s are
in dr
iving
resid
ents’
satis
factio
n wi
th
Coun
cil’s
over
all pe
rform
ance
.
118

22
Corre
latio
n an
alysis
This
analy
sis re
veale
d tha
t six
serv
ice in
dicat
ors w
ere
mor
e stro
ngly
relat
ed to
ove
rall s
atisf
actio
n tha
n oth
ers.
(Stro
nges
t rela
tions
hips a
re cl
oses
t to 1
.0).
Fi
nanc
ial m
anag
emen
t (0.
700 c
orre
l ation
vers
us 5
.6 sa
tisfa
ction
scor
e);
Th
e per
form
ance
of c
urre
nt E
lecte
d Me
mbe
rs in
bein
g tra
nspa
rent
, eth
ical a
nd re
flect
ing
the b
est
inte
rest
s and
valu
es o
f the
com
mun
ity (0
.684
corre
lation
vers
us 5
.6 sa
tisfa
ction
scor
e);
Pr
ovid
ing
leade
rshi
p in
the c
omm
unity
(0.6
84 co
rrel at
ion ve
rsus
5.6
satis
facti
on sc
ore)
;
Th
e bala
nce b
etwe
en C
ounc
il rat
es an
d th
e ser
vices
and
stan
dard
of i
nfra
stru
ctur
e pro
vided
(0.6
82
corre
lation
vers
us 6
.2 sa
tisfa
ction
scor
e);
Co
nsul
tatio
n wi
th an
d in
form
ing
the c
omm
unity
(0.6
32 co
rrel at
ion ve
rsus
6.2
satis
facti
on sc
ore)
;
Th
e int
erac
tions
resid
ents
hav
e with
Cou
ncil s
taff
(0.6
22 co
rrelat
ion ve
rsus
6.9
satis
facti
on sc
ore)
.
Th
ese r
esul
ts d
o no
t mea
n th
at al
l oth
er p
erfo
rman
ce in
dica
tors
are n
ot im
porta
nt, it
just
mea
ns th
at th
ese s
ix
were
reve
aled
as m
ore i
mpo
rtant
to th
e ove
rall s
atisf
actio
n of
resid
ents
.
Th
ese s
ix pe
rform
ance
indic
ator
s are
a “li
tmus
test”
for r
eside
nt sa
tisfa
ction
in a
ny “s
naps
hot in
time”
.
Th
is m
eans
that
focu
s on t
hese
six a
spec
ts is
likely
to h
ave a
corre
spon
ding p
ositiv
e im
pact
on re
siden
t sat
isfac
tion
with
Cou
ncil o
vera
ll.
119

KEY
FIND
INGS
– To
pica
l Issu
es
120

24
Cat m
anag
emen
t
7.7
7.7
7.5 7.
8
7.8
7.7 7.8 8.
1
7.6
7.6
7.4 7.
7 8.0
8.0
7.6 7.7
7.7
7.7
01
23
45
67
89
10
Mal
e
Fem
ale
<35
35-4
4
45-5
4
55-6
4
65-7
4
75-8
4
85+
Beau
mon
t
Burn
side
East
woo
d / G
lenu
nga
Kens
ingt
on G
dns /
Mag
ill
Kens
ingt
on P
k
Rose
Par
k/To
orak
Gdn
s
Ow
ner-
occu
pied
Rent
ed/t
enan
ted
TOTA
L
GENDERAGEWARDTENANCYTOTA
L
Q11
How
stro
ngly
do
you
agre
e or
dis
agre
e th
at "
The
City
of
Burn
side
shou
ld h
ave
a ca
t man
agem
ent a
ppro
ach
sim
ilar t
o th
e w
ay C
ounc
il m
anag
es d
ogs"
. (0
to 1
0 sc
ale)
BA
SE: T
otal
sam
ple,
n=7
94
St
rong
supp
ort f
or C
ounc
il to
deve
lop a
cat m
anag
emen
t ap
proa
ch si
milar
to th
e way
dogs
ar
e man
aged
.
Mean
ing re
gistra
tion,
micro
-ch
ipping
, de-
sexin
g an
d lim
it on
numb
ers p
er ho
useh
old.
7.7
mea
n sc
ore a
nd si
milar
ou
tcome
s acro
ss so
cio-
demo
grap
hic a
nd ge
ogra
phic
segm
ents.
79%
agr
ee ve
rsus 1
1% d
isagr
ee
(8%
neit
her a
nd 2%
don
’t kno
w).
121

25
Supp
ort f
or ch
ange
to R
oad
Rules
Lo
wer a
gree
ment
that C
ounc
il sup
port
neigh
bour
ing co
uncil
s in l
obby
ing S
tate
Gove
rnme
nt to
chan
ge A
ustra
lian
Road
Rule
s.
5.9 m
ean
scor
e and
some
varia
tion
in ou
tcome
s acro
ss so
cio-d
emog
raph
ic an
d ge
ogra
phic
segm
ents.
Still
has m
ajority
supp
ort -
57%
agre
e ve
rsus
31%
disa
gree
(10%
neit
her
and
1% d
on’t k
now)
.
5.9 6.0 6.
4
6.1
4.9
6.0
6.0
5.7
6.4
6.1 6.
6
5.3
6.1
6.0
5.4
6.0
4.9
5.9
01
23
45
67
89
10
Mal
e
Fem
ale
<35
35-4
4
45-5
4
55-6
4
65-7
4
75-8
4
85+
Beau
mon
t
Burn
side
East
woo
d / G
lenu
nga
Kens
ingt
on G
dns /
Mag
ill
Kens
ingt
on P
k
Rose
Par
k/To
orak
Gdn
s
Ow
ner-
occu
pied
Rent
ed/t
enan
ted
TOTA
L
GENDERAGEWARDTENANCYTOTAL
Mea
n sc
ore
(0-1
0 sc
ale)
Q13
City
of U
nley
seek
ing
supp
ort t
o lo
bby
Stat
e G
ovt.
to c
hang
e Au
stra
lian
Road
Rul
es to
allo
w p
arki
ng o
n re
side
nts'
driv
eway
cros
sove
r, us
ing
perm
it sy
stem
. To
wha
t ext
ent d
o yo
u ag
ree
or d
isag
ree
that
Bu
rnsi
de C
ounc
il sh
ould
supp
ort t
his c
hang
e?
122

SUMM
ARY
123

27
SUMM
ARY
St
atisti
cally
relia
ble co
mmun
ity su
rvey,
resu
lts ha
ve a
low m
argin
for e
rror o
f ±3.4
5% @
95%
confi
denc
e lev
el.
Da
ta ra
ndom
ly co
llecte
d fro
m ac
ross
who
le of
Coun
cil a
rea,
then
weigh
ted to
be
repr
esen
tative
by
age
and
gend
er (A
BS C
ensu
s 20
11 D
ata fo
r City
of B
urns
ide S
LA) a
nd a
lso w
eighte
d by
War
d to
be g
eogr
aphic
ally
repr
esen
tative
.
Mo
st pe
rform
ance
indic
ators
acro
ss a
ll fou
r Key
Dire
ction
s att
racte
d sa
tisfac
tion
levels
at t
he g
ood
to q
uite
sa
tisfie
d lev
el.
So
me p
erfor
manc
e ind
icator
s ar
e m
ore
impo
rtant
than
oth
ers
in dr
iving
resid
ents’
sati
sfacti
on.
All o
f the
se
revo
lved a
roun
d the
Key
Dire
ction
of a
Lead
ing,
Inclu
sive a
nd C
onne
cted
Cou
ncil.
Th
is is
a pos
itive o
utcom
e in t
hat th
ese e
lemen
ts ar
e ser
vice o
rient
ed ra
ther
than
infra
stru
ctur
e and
ther
efore
sm
all c
hang
es (
such
as
incre
ased
com
munic
ation
and
con
sulta
tion)
can
hav
e an
imp
act
on r
eside
nts’
perce
ption
s of C
ounc
il’s pe
rform
ance
over
all.
Po
sitive
indic
ators
acro
ss al
l othe
r kpi’
s, wi
th fe
w su
gges
tions
for i
mpr
ovem
ent m
ade b
y res
idents
.
124

28
SUMM
ARY
Se
rvicin
g ap
pear
s to
be a
t the
righ
t lev
el, w
ith fe
w se
rvice
gap
s an
d m
inim
al su
gges
tions
for s
ervic
e ar
eas
perce
ived a
s ove
r-ser
viced
.
Th
ere i
s stro
ng su
ppor
t for a
cat m
anag
emen
t app
roac
h sim
ilar t
o dog
man
agem
ent.
Th
ere
is mo
dera
te su
ppor
t for
lobb
ying
Stat
e Go
vern
men
t to
allow
par
king
on re
siden
t’s d
rivew
ay cr
osso
ver,
by pe
rmit,
withi
n the
Aus
tralia
n Roa
d Rule
s.
Ac
ross
all
findin
gs, s
ocio-
demo
grap
hic a
nd g
eogr
aphic
diffe
renc
es w
ere
noted
in s
atisfa
ction
leve
ls (a
nd
agre
emen
t leve
ls) am
ong:
~Res
idents
of R
ose
Park
/ To
orak
Gar
dens
and
, to
a les
ser e
xtent,
resid
ents
of Ea
stwo
od /
Glen
unga
W
ard;
and
~Res
idents
in th
e midd
le fam
ily lif
e-sta
ge, a
ged 4
5 to
54 ye
ars.
125

29
THAN
K YO
U
126

www.burnside.sa.gov.au
An n u a l Co m m u n it y Su r vey 2013 The inaugural Annual Community Survey was undertaken in February 2013 using a statistically valid random telephone survey of 800 City of Burnside residents.
The purpose of the Annual Community Survey was to provide a measure of the level of community satisfaction and perceived performance of services provided by the Council to its residents.
Results were used to measure the Council’s performance in delivering and achieving the Be the Future of Burnside 2025 Strategic Community Plan desired outcomes and were utilised to inform the allocation process for 2013/14 Annual Council Budget.
As a result, it is proposed that in the Draft 2013/14 Annual Budget, additional funds will be spent on trees, consultation with and informing the community and providing and maintaining footpaths and continuing to improve the new waste service known as Three Bins and a Basket.
General Survey Results
The Annual Community Survey revealed that residents generally have a reasonably high level of satisfaction with the services provided by Council. Some services have lower levels of satisfaction, but all services can be deemed to be considered average to good.
Across all service performance indicators tested, services which attracted the overall highest satisfaction levels were; “providing library services” and “presentation and cleanliness of the City”.
At the other end of the spectrum, three aspects rated lower being; “financial management”, “performance of current Elected Members being transparent, ethical and reflecting the best interests and values of the community” and “providing leadership in the community”.
informed
127

An n u a l Co m m u n it y Su r vey
Council’s Overall Performance
One in three respondents said they were very satisfied with Council’s overall performance in the last twelve months and rated the performance 8 out of 10 or higher. 77 per cent of respondents stated they were satisfied with the overall performance of Council.
The following bar graph shows the relative scores out of a total of 10, with 10 being the highest satisfaction, of all of the services which were the topic of questions in the survey.
128

Resident Suggestions for Areas to Consider for Improvement
• Footpaths need repair / want more footpaths (16 per cent of respondents suggested this theme);
• Maintain and preserve heritage trees / verges (15 per cent of respondents suggested this theme);
• More hard rubbish collection (15 per cent of respondents suggested this theme);
• Council should be in touch with residents / listen and consult / better communication / notify of works projects (11 per cent of respondents suggested this theme); and
• More green waste rubbish collection (9 per cent of respondents suggested this theme).
Resident Suggestions for Stopping a Service
Only three per cent of respondents perceived that there were services currently provided by Council that they considered should not be provided.
Resident Suggestions for New Services
Three in four respondents could not suggest any new services. Themes that were suggested included more:
• Collection of hard, electronic, hazardous and green waste. Provision of a dump location within Council area for these waste products;
• Emphasis on maintenance of trees, footpaths, roads and general maintenance of parks;
• Recreation facilities i.e. walking/ cycling trails, dog parks, BMX and skateboard areas;
• Transport / home help / facilities for elderly and people with disabilities; and
• Engagement with community / more information / phone service / face to face contact with Elected Members.
There was strong support for Council to develop a cat management approach similar to the way dogs are managed.
There was lower agreement that Council should support neighbouring councils in lobbying State Government to change Australian Road Rules to allow residents to park on the driveway crossover in front of their own properties using a permit system.
Council wishes to thank all of the residents who gave of their time and opinions to help make the City of Burnside a better place to be.
An n u a l Co m m u n it y Su r vey
Fu r t h er In fo r m a t io n City of Burnside, Community Relations
Phone: 8366 4200 Email: [email protected]
129