cotton crop development in central punjab (faisalabad, 2019)
TRANSCRIPT
Cotton Crop Development in Central Punjab
(Faisalabad, 2019)
By
Ali Imran
(Meteorologist)
Regional Agromet Centre Pakistan Meteorological Department
Ayub Agriculture Research Institute, Jhang Road
Faisalabad, Pakistan
- 2 -
Contents
ABSTRACT ……………………………………………….................................. 6
CHAPTER 1: INTRODUCTION --------------------------------------------------------- 7
1.1 Geographical Description and Climate of Pakistan and Central Punjab (Study Area) 7
1.2 Scope of the Study …………………..………………………………………………………….……………… 8
1.3 Objective of the Study………………………………………………………………………………………… 9
1.4 Review of Agriculture Production in Pakistan………………………………….………….……… 9
1.5 Cotton Production in Pakistan ……………………………………………………………….…………….. 9
CHAPTER 2: MATERIALS AND METHOD ------------------------------------------ 11
2.1 Phenology ………………………………………………………………….............................................. 11
2.1.1 Phenological Observations ……………………………………………………………………. 12
2.2 Methodology ……………………………………………………………………………………………………….. 12
CHAPTER 3: RESULTS AND DISCUSSION ---------------------------------------- 14
3.1 Rainfall and Cotton Crop Growth …………………………………………………………………………. 15
3.2 Irrigation during Crop Growth ……………………………………………………………………………… 17
3.3 Air Temperature and Cotton Crop Growth ………………………………………………………….. 17
3.4 Soil Moisture Observations during Crop Growth ………………………………………………… 19
3.5 Soil Temperature and Crop Growth …………………………………………………………………….. 21
3.6 Heat Units Requirements …………………………………………………………………………………….. 23
3.7 Relative Humidity (%) …………………………………………………………………………………………… 24
3.8 Reference Crop Evapotranspiration, ETo (mm/day) …………………………………………….. 25
3.9 Wind and Crop Growth………………………………………………………………………………………… 25
3.10 Crop Water Requirement…………………………………………………………………………………. 26
3.11 Agro Meteorological Summary of Crop Cycle ……………..……………………………….......... 28
CHAPTER 4: CONCLUSION AND RECOMMENDATIONS -------------------- 31
4.1 Conclusions …….……………………………………………………………………………………………………. 32
4.2 Recommendations ………………………………………………………………………………………………. 32
REFERENCES …………………………………….............................................. 33
- 3 -
List of Figures
Page
No.
Figure 1.1 Mean Annual Rainfall (mm) of Punjab [Normal (1981-2010)] …………………… 8
Figure 1.2 Monthly Mean Annual Rainfall (mm) of Faisalabad during Kharif Season … 8
Figure 1.3 Mean daily Maximum and Minimum Temperature (°C) of Faisalabad
during Kharif Season …………………………………………………………………………………
8
Figure 3.1 Comparison of Monthly Observed Precipitation with Normal (1981-2010)
at Faisalabad …………………………………………………………………………………………….. 15
Figure 3.2 Mean daily Minimum Temperature (°C) of Faisalabad………………………………. 18
Figure 3.3 Mean daily Maximum Temperature (°C) of Faisalabad……………………………… 18
Figure 3.4 Mean Monthly Temperature during 2019…………………………………………………. 18
Figure 3.5 Soil moisture chrono Isopleths for Kharif Crop at Faisalabad for the year
2019...............................................................................................................
20
Figure 3.6 Soil moisture at different depths during Cotton crop 2019……………………... 21
Figure 3.7 Moisture at deep soils (90cm) during Cotton crop 2019…………………………… 21
Figure 3.8 Soil temperature during Cotton crop 2019……………………………………………….. 22
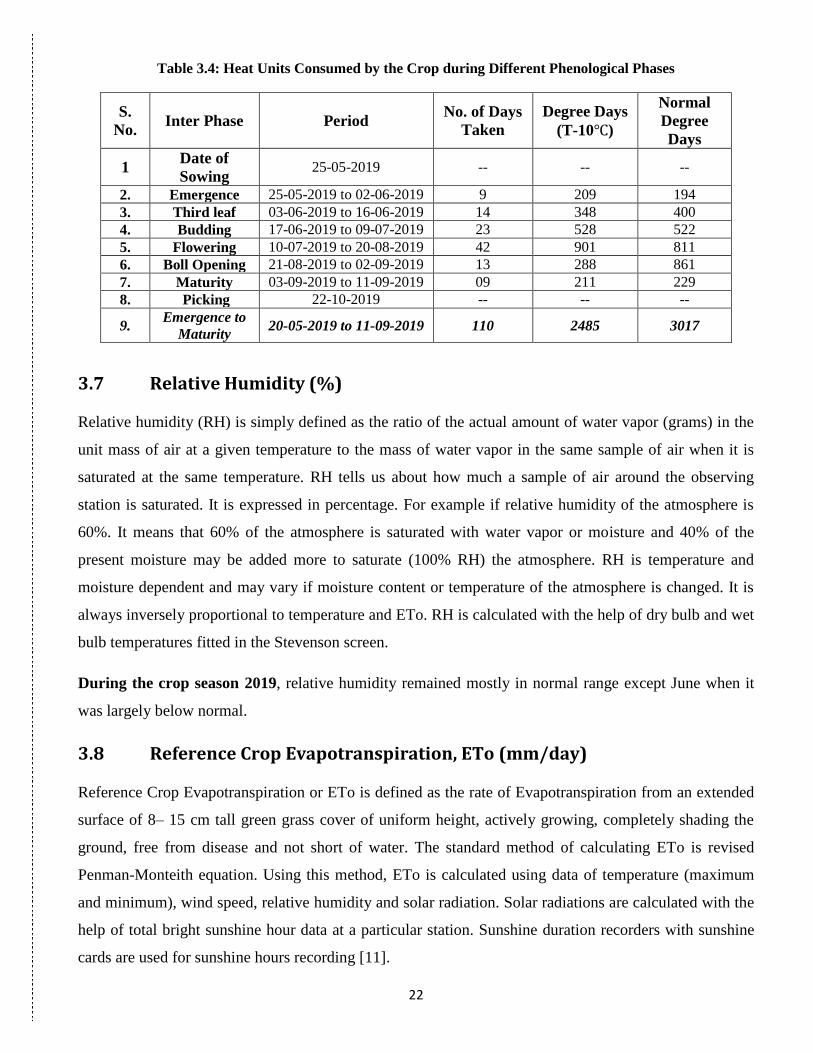
Figure 3.9 Heat units during crop life 2019………………………………………………………………… 24
Figure 3.10 March of Crop Coefficient (Kc) for normal duration of Cotton growing
season (Emergence to Wax- Maturity) .…………………………………………………….. 27
Figure 3.11 Crop Water Requirement (CWR) During Crop Life……………………………………… 28
- 4 -
List of Tables
Page
No.
Table 2.1 Observed Meteorological Parameters ……………………………………………………………. 11
Table 2.2 Phenological Stages of Cotton Crop ……………………………………………………………… 12
Table 3.1 Brief Summary of the Cotton Crop …………………………………………………………………. 14
Table 3.2 Daily rainfall history of the crop life 2019………………………………………………….. 16
Table 3.3 Mean Monthly Temperature during Kharif Season 2019……………………………… 18
Table 3.4 Heat Units Consumed by the Crop during Different Phenological Phases ………. 24
Table 3.5 Summary of some Meteorological Parameters during Kharif Season 2019 ….. 25

- 5 -
Abstract
This study has been carried out to investigate the impact of day to day changes in the meteorological
parameters like rainfall, air and soil temperature, air and soil moisture, sunshine duration and
significant weather events on plant growth and development during each phenological stage and
hence on final yield of cotton crop. For this purpose both Meteorological and phenological
observations along with soil moisture data have been monitored at each phenological stage of cotton
crop, cultivated in the field of Ayub Agriculture Research Institute Faisalabad (Central Punjab)
during the Kharif Seasons 2019. Beside this some other factors e.g., time of sowing, fertilizer intake,
insecticides, weeds removing operations and supplied irrigated water have also been studied. The
crop accumulated 2485 heat units in 110 days during its life cycle from emergence to maturity. Crop
was sown later than the normal time of sowing. Water requirement was fulfilled through flood
irrigation onwards from early growth up to maturity stage. Crop growth and production depends
upon mainly on the time of sowing, irrigation, in time use of chemicals against weeds and pest/viral
attacks, variation in rainfall and heavy rain spells from flowering to maturity stages, day time rise in
temperature and other meteorological parameters. This study is based upon the data collected at the
crop field and meteorological observatory located at the Ayub Agriculture research Institute,
Faisalabad. The study will be much fruitful in future to narrow the gap between present yield
obtained and potential yield of this cultivar, being cultivated in Faisalabad and other cotton growing
areas of central Punjab. During the Kharif season 2019, weather conditions badly affect the cotton
crop and hence final yield was much reduced.
Chapter 1
INTRODUCTION
This study is based upon field observations of cotton crop at Regional Agrometeorological Center
Faisalabad, cultivated in the experimental field of Plant Physiological section of AARI Faisalabad during
the Kharif season 2019. The cotton crop variety F.H-142 was cultivated in the experimental field. It is a
BT (Bacillus Thuringiensis) variety-BT variety are resistant against bollworm. The study will provide a
base to estimate the optimum ranges of various meteorological parameters for getting highest yield of the
particular crop variety grown under varying weather conditions.
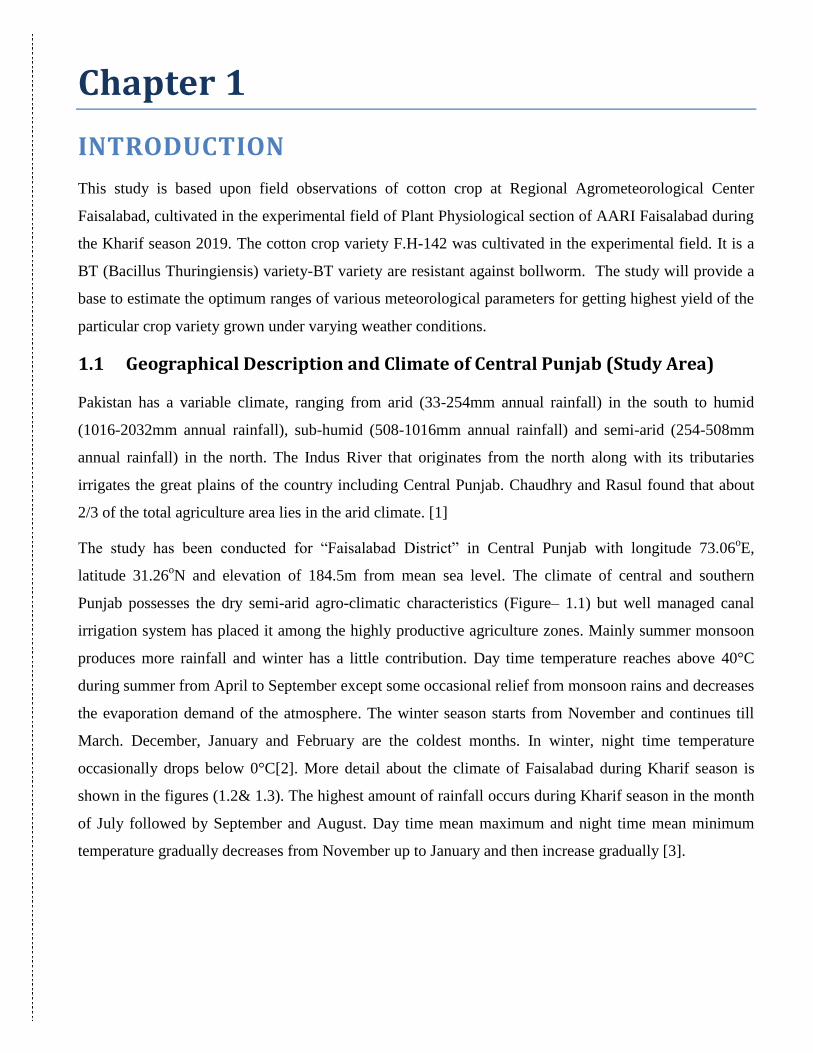
1.1 Geographical Description and Climate of Central Punjab (Study Area)
Pakistan has a variable climate, ranging from arid (33-254mm annual rainfall) in the south to humid
(1016-2032mm annual rainfall), sub-humid (508-1016mm annual rainfall) and semi-arid (254-508mm
annual rainfall) in the north. The Indus River that originates from the north along with its tributaries
irrigates the great plains of the country including Central Punjab. Chaudhry and Rasul found that about
2/3 of the total agriculture area lies in the arid climate. [1]
The study has been conducted for “Faisalabad District” in Central Punjab with longitude 73.06oE,
latitude 31.26oN and elevation of 184.5m from mean sea level. The climate of central and southern
Punjab possesses the dry semi-arid agro-climatic characteristics (Figure– 1.1) but well managed canal
irrigation system has placed it among the highly productive agriculture zones. Mainly summer monsoon
produces more rainfall and winter has a little contribution. Day time temperature reaches above 40°C
during summer from April to September except some occasional relief from monsoon rains and decreases
the evaporation demand of the atmosphere. The winter season starts from November and continues till
March. December, January and February are the coldest months. In winter, night time temperature
occasionally drops below 0°C[2]. More detail about the climate of Faisalabad during Kharif season is
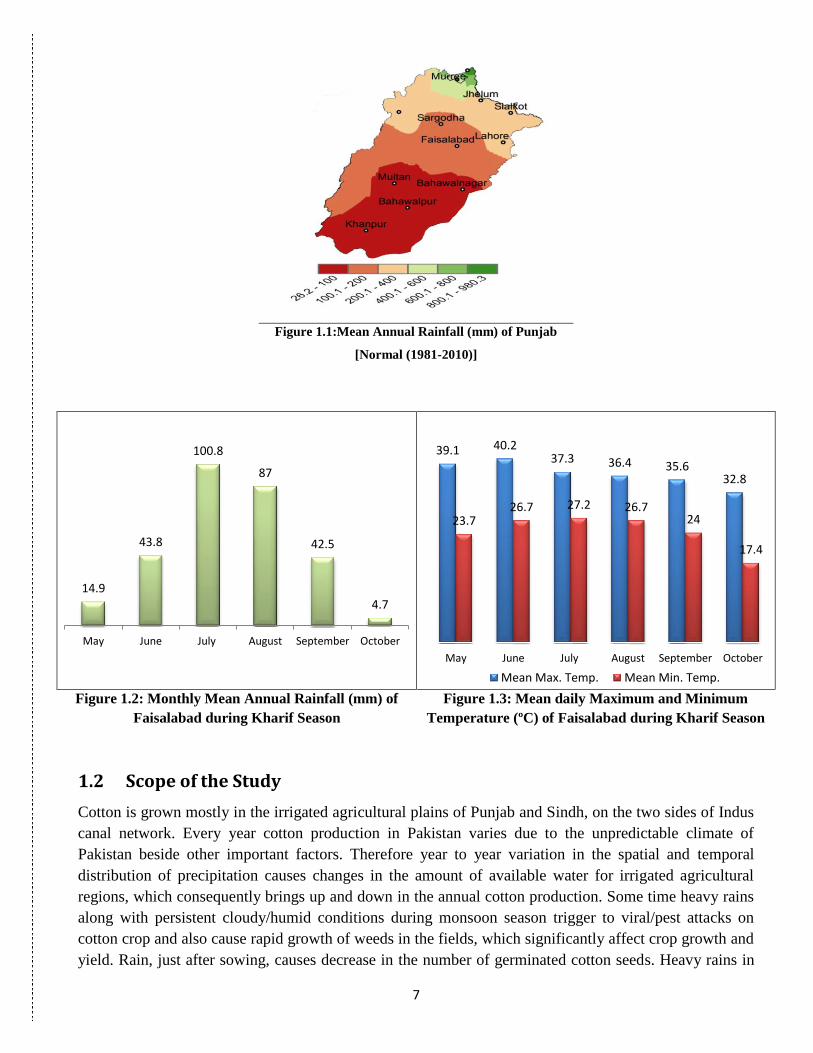
shown in the figures (1.2& 1.3). The highest amount of rainfall occurs during Kharif season in the month
of July followed by September and August. Day time mean maximum and night time mean minimum
temperature gradually decreases from November up to January and then increase gradually [3].
7
14.9
43.8
100.8
87
42.5
4.7
May June July August September October
39.1 40.2 37.3 36.4 35.6
32.8
23.7 26.7 27.2 26.7
24
17.4
May June July August September October
Mean Max. Temp. Mean Min. Temp.
Figure 1.1:Mean Annual Rainfall (mm) of Punjab
[Normal (1981-2010)]
Figure 1.2: Monthly Mean Annual Rainfall (mm) of
Faisalabad during Kharif Season
Figure 1.3: Mean daily Maximum and Minimum
Temperature (ºC) of Faisalabad during Kharif Season
1.2 Scope of the Study
Cotton is grown mostly in the irrigated agricultural plains of Punjab and Sindh, on the two sides of Indus
canal network. Every year cotton production in Pakistan varies due to the unpredictable climate of
Pakistan beside other important factors. Therefore year to year variation in the spatial and temporal
distribution of precipitation causes changes in the amount of available water for irrigated agricultural
regions, which consequently brings up and down in the annual cotton production. Some time heavy rains
along with persistent cloudy/humid conditions during monsoon season trigger to viral/pest attacks on
cotton crop and also cause rapid growth of weeds in the fields, which significantly affect crop growth and
yield. Rain, just after sowing, causes decrease in the number of germinated cotton seeds. Heavy rains in
8
particular, damage and cause shedding of flowers/bolls from flowers to maturity stages. Abnormal rise in
day time temperature due to climatic variability may also raise crop water requirement at a particular
phase and also may cause early completion of a phase. Therefore, in this study the impacts of variations
in all weather parameters along with variations in soil temperature and moisture is analyzed to understand
crop growth and development throughout the crop life and their impact on final yield of the crop.
1.3 Objective of the Study
• To analyze and study the impact of various meteorological parameters on crop growth and
development.
• To investigate the water satisfaction sensitivity of crop in Faisalabad region.
• To develop the relationship between weather parameters, crops life cycle and yield obtained.
• To determine the onset of pests and diseases related to weather elements.
• To get a step forward for formulation of yield estimation.
1.4 Review of Agriculture Production in Pakistan
The agriculture sector continues to be an essential component of Pakistan’s economy. It currently
contributes 21 percent of GDP. Agriculture generates productive employment opportunities for 45
percent of the country’s labor force and 60 percent of the rural population depends upon this sector for its
livelihood. It has a vital role in ensuring food security, generating overall economic growth, reducing
poverty and the transforming towards industrialization.
Within the agricultural sector, the contribution of crop production is about 42 % while livestock
contributes 55 %. Therefore any change in agricultural productivity sends a ripple effect throughout the
rural population of Pakistan. Thus rapid agricultural growth can stimulate and sustain the pace of
industrial growth, setting into motion a mutually reinforcing process of sustained economic growth in the
country [5].
The Economic development of Punjab largely depends on the progress and growth of Agriculture Sector.
The province dominates in overall national agriculture production in major crops: it contributes up
to55% in National Rice Production, 65% in National Sugarcane Production, 75% in National wheat
Production and 70% in National Cotton Production [6].
1.5 Cotton Production in Pakistan
Cotton is an important cash crop for Pakistan known as “white gold”. It accounts for 8.2 percent of the
value added share in agriculture and about 3.2 percent to GDP. Around two thirds of the country’s export
earnings are from the cotton by-products which add over $2.5 billion to the national economy. Hundreds
of ginning factories and textile mills in the country mainly depend on cotton. Life of millions of farmers
is dependent on this crop, in addition to millions of people employed along the entire cotton value chain,
from weaving to textile and garment exports. Well-researched cotton seed, proper crop-related
information to growers for usage of fertilizer and pesticides and appropriate water availability in major

9
crop-growing areas in Punjab and Sindh increased the production beside torrential rains and flash
flooding in cotton belt of Punjab and Sindh in 2010 and 2011 [7].
In Punjab cotton is cultivated on both sides of Indus River. The crop is mainly grown in agricultural
plains of central and southern Punjab. The crop is planted in April/May and picking starts in
August/September. The crop is harvested in October/November. Total contribution of Punjab is about
70% in total cotton production of Pakistan. The fertile land of Sindh dominates in per acre yield across
the cotton belt followed by Punjab. Whereas Punjab dominates in area cultivated and total annual
production in the country.
10
Chapter 2
MATERIALS AND METHOD
The cotton crop F.H-142 was cultivated at Regional Agrometeorological Center, Faisalabad in central
Punjab during Kharif season 2019. Both the meteorological and crop phenological data were recorded
during the crop season. In order to compile the data of each development stage careful, precise and timely
recording of the following parameters (table 2.1) were undertaken at 0300, 0900 and 1200 (UTC) as
routine practice.
Table 2.1: Observed Meteorological Parameters
1. Air Temperature (˚C)
2. Maximum & Minimum Temperature (˚C)
3. Soil Temperature (˚C)
4. Relative Humidity (%)
5. Precipitation (mm)
6. Pan Evaporation at 0300 & 1200UTC
7. Bright Sunshine Hours
8. Wind Speed (km/hour)
9. Wind Direction
10. Soil Moisture (%)
Crop data including Phenological data and soil moisture observation was collected according to World
Meteorological Organization (WMO) and Food & Agriculture Organization (FAO) standards.
2.1 Phenology
For a sound understanding of plant growth and development, observation and recording of phenological
stages of plant is an essential element (table 2.2). The impact of precipitation, heat, drought, diseases,
insects, and weeds can be more accurately predicted with a clear picture of the relationship between
growth stage and plant response to stress. The optimum timing of fertilizer, irrigation, herbicide,
insecticide, and fungicide applications are also best determined by crop growth or phenological stage
rather than calendar date. [8]
11
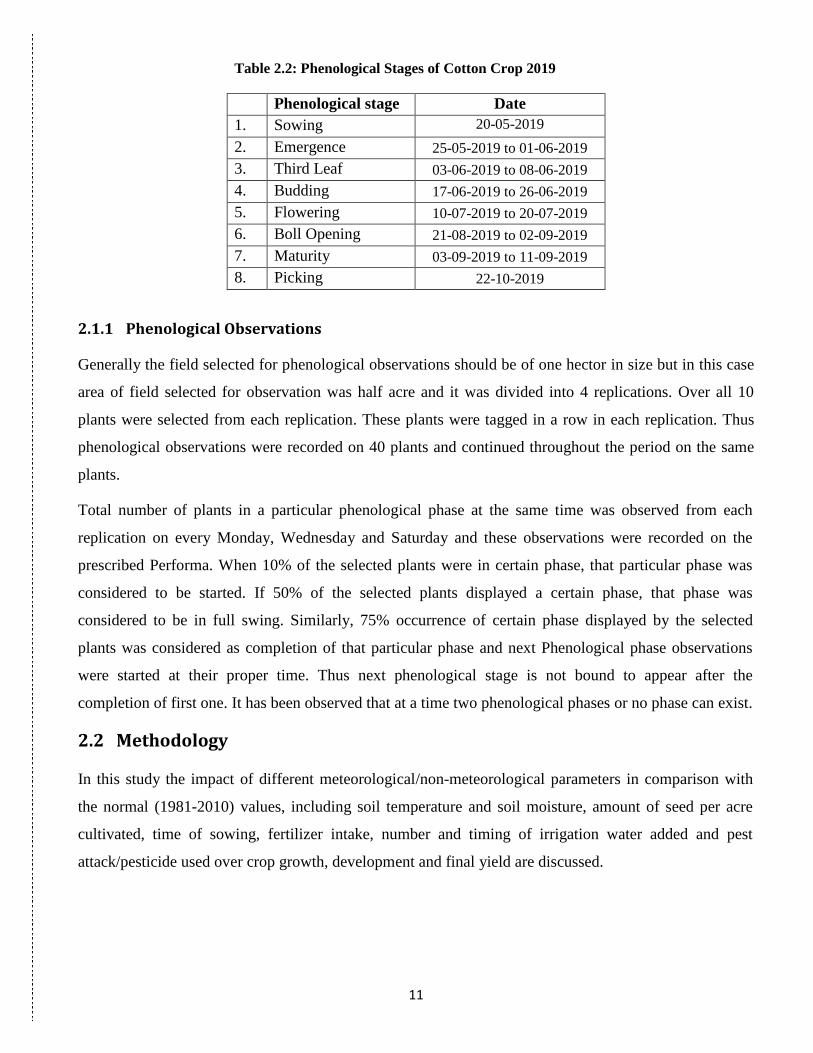
Table 2.2: Phenological Stages of Cotton Crop 2019
Phenological stage Date
1. Sowing 20-05-2019
2. Emergence 25-05-2019 to 01-06-2019
3. Third Leaf 03-06-2019 to 08-06-2019
4. Budding 17-06-2019 to 26-06-2019
5. Flowering 10-07-2019 to 20-07-2019
6. Boll Opening 21-08-2019 to 02-09-2019
7. Maturity 03-09-2019 to 11-09-2019
8. Picking 22-10-2019
2.1.1 Phenological Observations
Generally the field selected for phenological observations should be of one hector in size but in this case
area of field selected for observation was half acre and it was divided into 4 replications. Over all 10
plants were selected from each replication. These plants were tagged in a row in each replication. Thus
phenological observations were recorded on 40 plants and continued throughout the period on the same
plants.
Total number of plants in a particular phenological phase at the same time was observed from each
replication on every Monday, Wednesday and Saturday and these observations were recorded on the
prescribed Performa. When 10% of the selected plants were in certain phase, that particular phase was
considered to be started. If 50% of the selected plants displayed a certain phase, that phase was
considered to be in full swing. Similarly, 75% occurrence of certain phase displayed by the selected
plants was considered as completion of that particular phase and next Phenological phase observations
were started at their proper time. Thus next phenological stage is not bound to appear after the
completion of first one. It has been observed that at a time two phenological phases or no phase can exist.
2.2 Methodology
In this study the impact of different meteorological/non-meteorological parameters in comparison with
the normal (1981-2010) values, including soil temperature and soil moisture, amount of seed per acre
cultivated, time of sowing, fertilizer intake, number and timing of irrigation water added and pest
attack/pesticide used over crop growth, development and final yield are discussed.

12
Chapter 3
RESULTS AND DISCUSSION
In this chapter, variations in meteorological and non-meteorological parameters and their impact on the
cotton crop is analyzed along with a brief summary of whole cotton crop’s life cycle. Normally the cotton
crop takes 140-160 days to get fully mature. The crop is cultivated in the start of April up to the mid of
May. In order to investigate the chief causes about variation in the crop’s growth, development and yield
related to varying weather conditions and some other factors during each phenological stages of cotton
crop, different meteorological parameters are studied as well.
Table 3.1: Brief Summary of the Cotton Crop
1 Field size 4 kanal
2 Crop variety F.H-142
3 Date of Sowing 20-05-2019
4 Information about any disease/pest attack Boll worms, Whitefly, Jassid
5 Pesticides and weedicides details
10-07-2019: Endexocoren 100ml/Acre + Big Hit
300gm/Acre for Jassid
22-07-2019: Big Hit 300gm/Acre for Jassid
01-08-2019:Gramoxone 1lit/Acre for weeds removal
05-08-2019: Red Gold 250ml/Acre for Pest control
17-08-2019:Red Gold 250ml/Acre+ Chlorphrofos
1lit/Acre for sucking worms
05-09-2019: Proaxis 100ml/Acre for Pink Boll Worm
6 Quantity of seed per acre 08 kg
7 Row spacing 75cm
8 Schedule and quantity of supplied dose of
fertilizer
At sowing 1.5 Bag DAP/Acre +1Bag Potash/Acre.
At later stages 2 bags of Urea/Acre
9 Irrigation Type Flood irrigation
10 Irrigation schedule
20-05-2019 (First irrigation)
27-05-2019 (Second irrigation)
12-06-2019 (Third irrigation)
27-06-2019 (Fourth irrigation)
03-07-2019 (Fifth irrigation)
18-07-2019 (Sixth irrigation)
07-08-2019 (Seventh irrigation)
11 Heat units consumed from sowing to full
maturity 2485
12 Total days taken by the crop from sowing to
full maturity 110
13 Date of Picking 22-10-2019
14 Actual/ Potential yield 600/1600 kg /acre
13
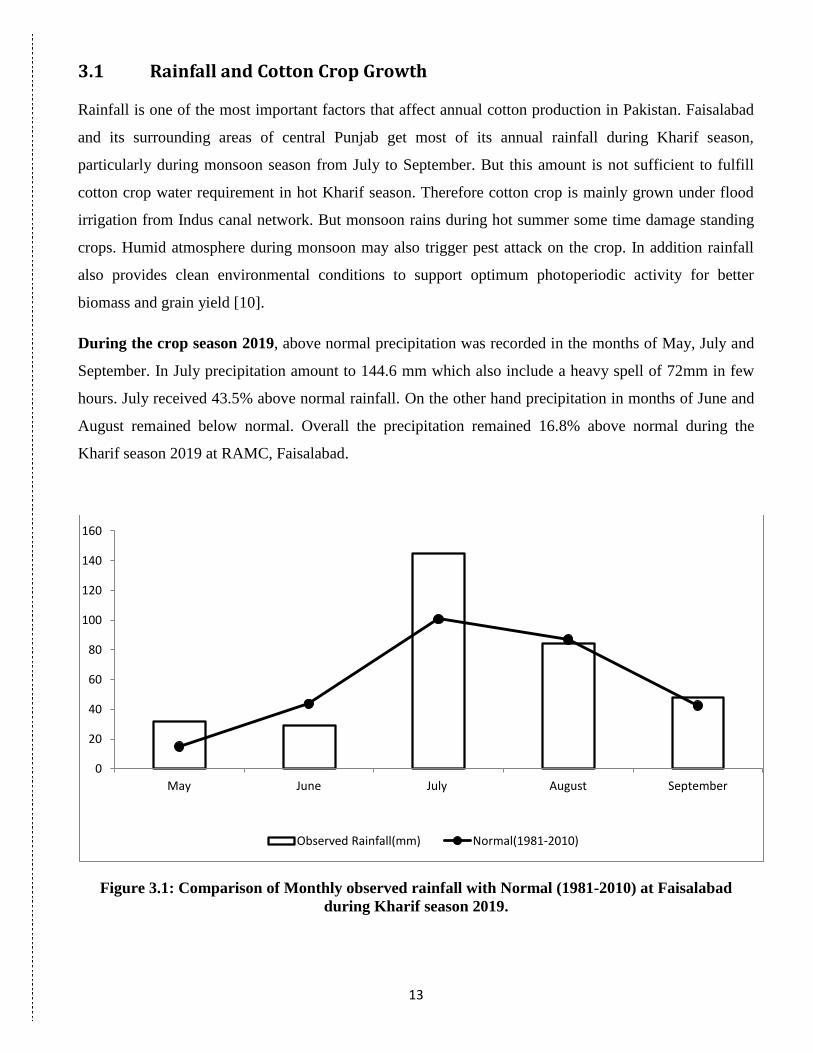
3.1 Rainfall and Cotton Crop Growth
Rainfall is one of the most important factors that affect annual cotton production in Pakistan. Faisalabad
and its surrounding areas of central Punjab get most of its annual rainfall during Kharif season,
particularly during monsoon season from July to September. But this amount is not sufficient to fulfill
cotton crop water requirement in hot Kharif season. Therefore cotton crop is mainly grown under flood
irrigation from Indus canal network. But monsoon rains during hot summer some time damage standing
crops. Humid atmosphere during monsoon may also trigger pest attack on the crop. In addition rainfall
also provides clean environmental conditions to support optimum photoperiodic activity for better
biomass and grain yield [10].
During the crop season 2019, above normal precipitation was recorded in the months of May, July and
September. In July precipitation amount to 144.6 mm which also include a heavy spell of 72mm in few
hours. July received 43.5% above normal rainfall. On the other hand precipitation in months of June and
August remained below normal. Overall the precipitation remained 16.8% above normal during the
Kharif season 2019 at RAMC, Faisalabad.
Figure 3.1: Comparison of Monthly observed rainfall with Normal (1981-2010) at Faisalabad
during Kharif season 2019.
0
20
40
60
80
100
120
140
160
May June July August September
Observed Rainfall(mm) Normal(1981-2010)
14
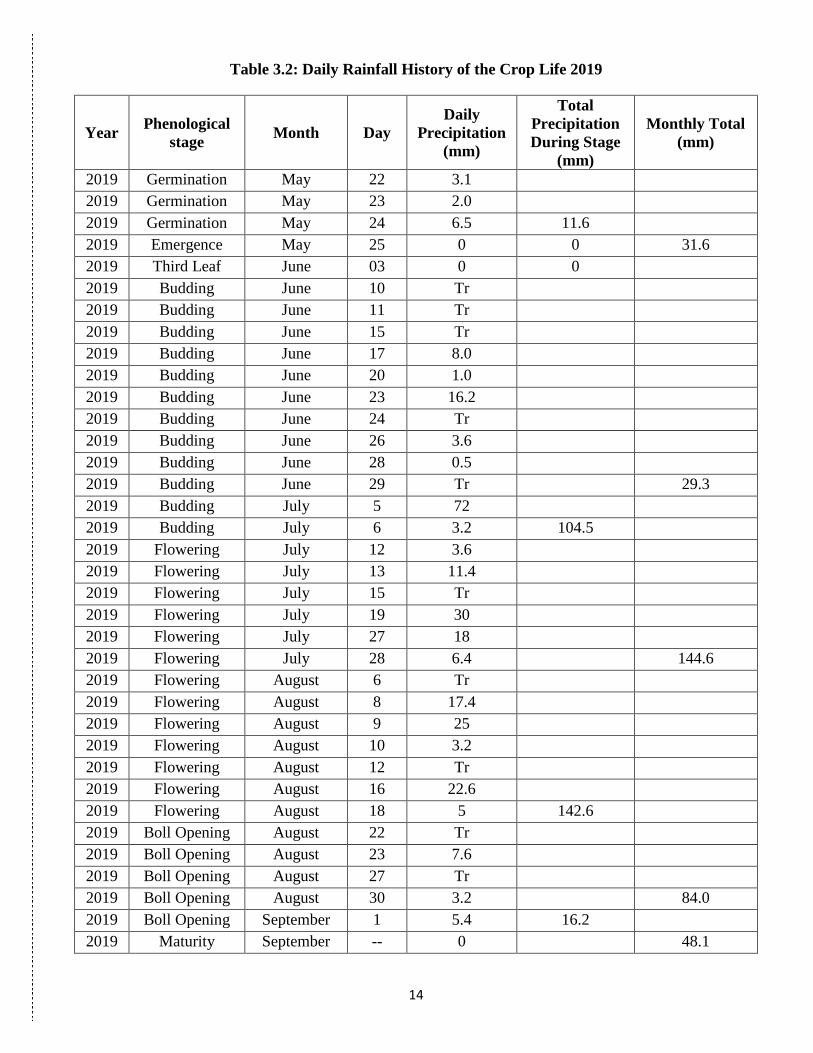
Table 3.2: Daily Rainfall History of the Crop Life 2019
Year Phenological
stage Month Day
Daily
Precipitation
(mm)
Total
Precipitation
During Stage
(mm)
Monthly Total
(mm)
2019 Germination May 22 3.1
2019 Germination May 23 2.0
2019 Germination May 24 6.5 11.6
2019 Emergence May 25 0 0 31.6
2019 Third Leaf June 03 0 0
2019 Budding June 10 Tr
2019 Budding June 11 Tr
2019 Budding June 15 Tr
2019 Budding June 17 8.0
2019 Budding June 20 1.0
2019 Budding June 23 16.2
2019 Budding June 24 Tr
2019 Budding June 26 3.6
2019 Budding June 28 0.5
2019 Budding June 29 Tr 29.3
2019 Budding July 5 72
2019 Budding July 6 3.2 104.5
2019 Flowering July 12 3.6
2019 Flowering July 13 11.4
2019 Flowering July 15 Tr
2019 Flowering July 19 30
2019 Flowering July 27 18
2019 Flowering July 28 6.4 144.6
2019 Flowering August 6 Tr
2019 Flowering August 8 17.4
2019 Flowering August 9 25
2019 Flowering August 10 3.2
2019 Flowering August 12 Tr
2019 Flowering August 16 22.6
2019 Flowering August 18 5 142.6
2019 Boll Opening August 22 Tr
2019 Boll Opening August 23 7.6
2019 Boll Opening August 27 Tr
2019 Boll Opening August 30 3.2 84.0
2019 Boll Opening September 1 5.4 16.2
2019 Maturity September -- 0 48.1
15
3.2 Irrigation during Crop Growth
During Kharif season 2019, irrigated water was added to the field 07 times; first irrigation was done at
sowing while 2nd
irrigation was done 07 days after sowing when emergence stage was completed.
Remaining irrigations were done during other phenological stages at the time of need. Because of below
normal amount of rain in the month of June, water requirements of the crop were fulfilled by irrigation.
Above normal rain during the later phases of plant mainly fulfilled the need of water.
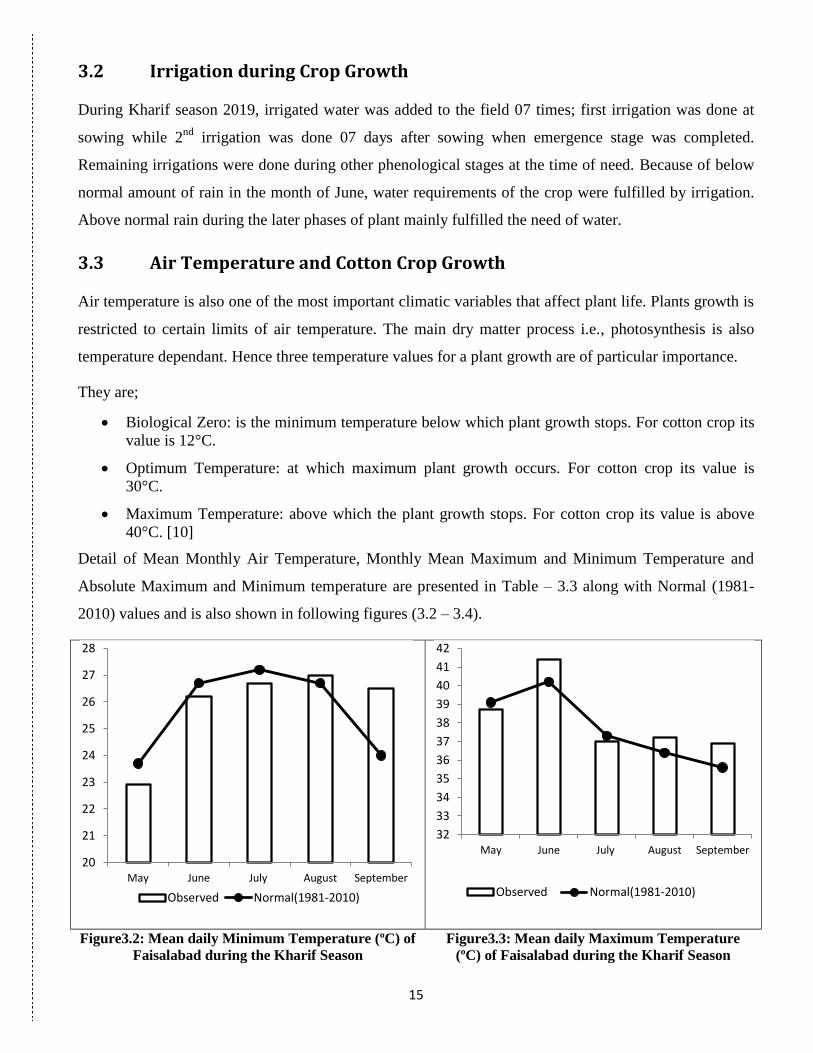
3.3 Air Temperature and Cotton Crop Growth
Air temperature is also one of the most important climatic variables that affect plant life. Plants growth is
restricted to certain limits of air temperature. The main dry matter process i.e., photosynthesis is also
temperature dependant. Hence three temperature values for a plant growth are of particular importance.
They are;
Biological Zero: is the minimum temperature below which plant growth stops. For cotton crop its
value is 12°C.
Optimum Temperature: at which maximum plant growth occurs. For cotton crop its value is
30°C.
Maximum Temperature: above which the plant growth stops. For cotton crop its value is above
40°C. [10]
Detail of Mean Monthly Air Temperature, Monthly Mean Maximum and Minimum Temperature and
Absolute Maximum and Minimum temperature are presented in Table – 3.3 along with Normal (1981-
2010) values and is also shown in following figures (3.2 – 3.4).
Figure3.2: Mean daily Minimum Temperature (ºC) of
Faisalabad during the Kharif Season
Figure3.3: Mean daily Maximum Temperature
(ºC) of Faisalabad during the Kharif Season
20
21
22
23
24
25
26
27
28
May June July August September
Observed Normal(1981-2010)
32
33
34
35
36
37
38
39
40
41
42
May June July August September
Observed Normal(1981-2010)

16
Figure 3.4: Mean Monthly Temperature during Kharif Season 2019
During the crop season of 2019 both mean daily temperature and day time maximum temperature
observed to be remained above normal during most of the crop life except July when temperature did not
increase to above normal values due to heavy rainfall. Mean minimum temperature also remained slightly
above normal during most of the crop life except June and July when it was slightly below normal. In
August and especially in the month of September both minimum and maximum temperature remained
above normal which lead to the early completion of phonological stages.
Table 3.3: Mean Monthly Temperature during Kharif Season 2019
Month Mean
Monthly (°C)
Monthly
Mean Max.(°C)
Monthly
Mean Min(°C)
Absolute
Max. (°C)
Absolute
Min. (°C)
May-2019 30.8
(30.6)
38.7
(38.4)
22.9
(22.7)
45.0
(48.0)
18.5
(13.0)
Jun-2019 33.8
(33.7)
41.4
(40.5)
26.2
(26.9)
46.5
(48.0)
21.0
(17.0)
Jul-2019 31.9
(32.3)
37
(37.1)
26.7
(27.1)
43.5
(47.0)
22.0
(19.0)
August-
2019
32.1
(32.3)
37.2
(36.1)
27.0
(26.6)
39.5
(42.0)
21.4
(18.6)
Sept-2019 31.7
(29.7)
36.9
(35.7)
26.5
(23.7)
41.6
(43.0)
21.5
(16.0)
( ) in Table 3.3 shows Normal values (1981-2010)
27
28
29
30
31
32
33
34
35
May June July August September
Observed Normal(1981-2010)
17
3.4 Soil Moisture Observations during Crop Growth
Soil moisture plays a vital role during crop’s life. Soil moisture content is proportional to rainfall and
intake of irrigated water and is inversely proportional to evapotranspiration from the plant and its
surroundings. Variation in soil moisture during crop’s life play important role in plant growth and
development. Water or soil moisture requirement of cotton crop varies during different growth or
Phenological stages. Highest amount is needed during flowering stage followed by grain formation stages
and then vegetative stages [11].
To calculate soil moisture, soil samples are taken on 7th
, 17th
and 27th
of each month in four replications at
5, 10, 20, 30, 40, 50, 70 and 90 cm depths with the help of auger. However in case of any anomalous
event on the specific date, the sample can also be taken on the next day. Soil sample is then weighed and
dried in the oven for about 8 hours. The dried sample is weighed again and moisture present in the soil is
then calculated by the difference of weight between wet and dry samples as illustrated below:
Moisture contents of the soil varied due to dry and wet spells throughout the season. After each effective
irrigation or rain the moisture level increased in the shallow layers as compared to deep layers of the soil.
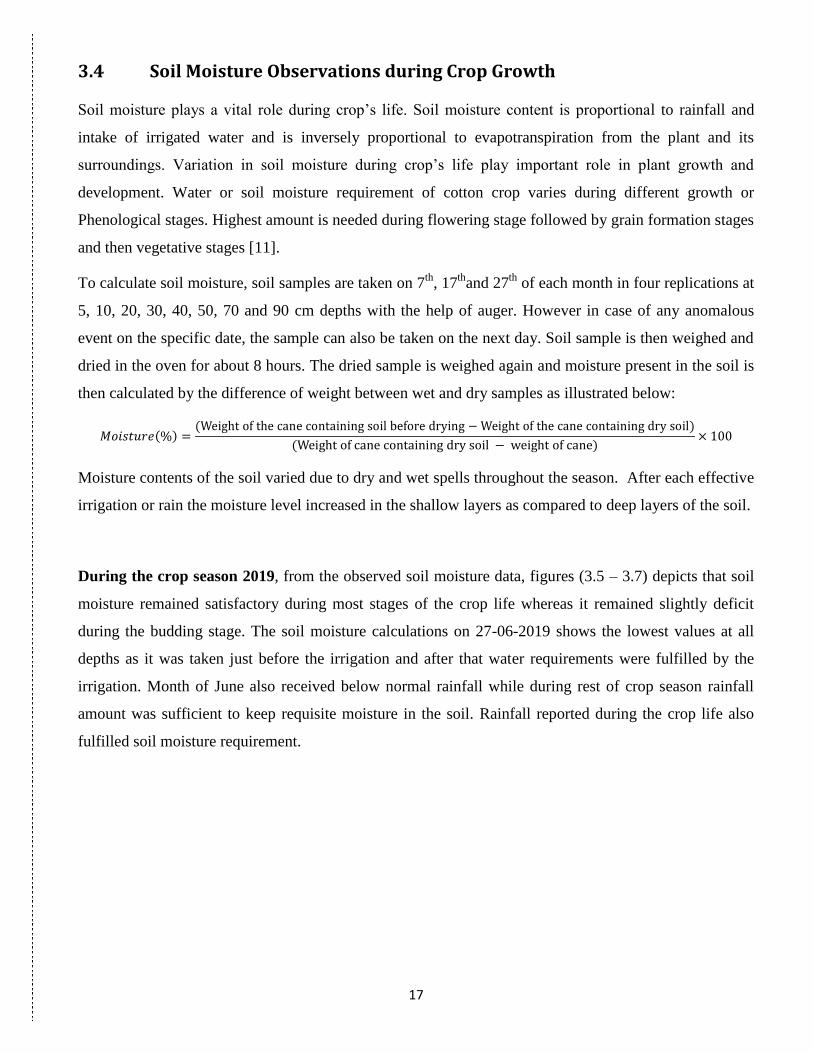
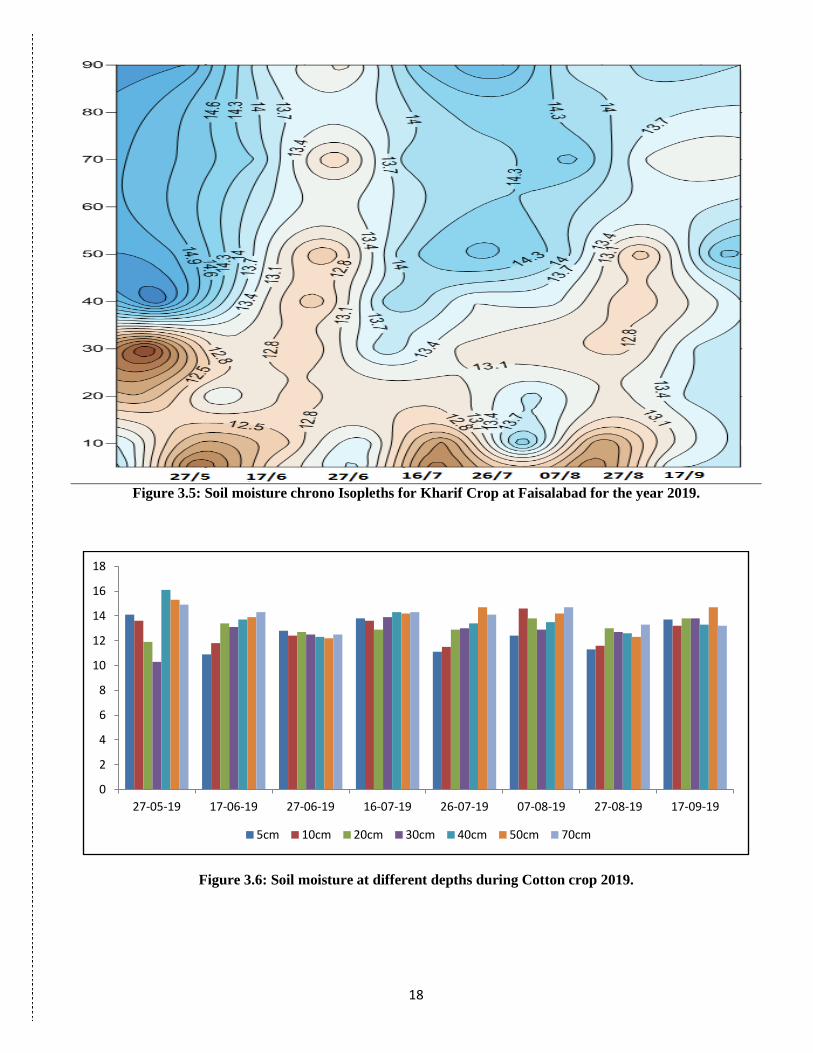
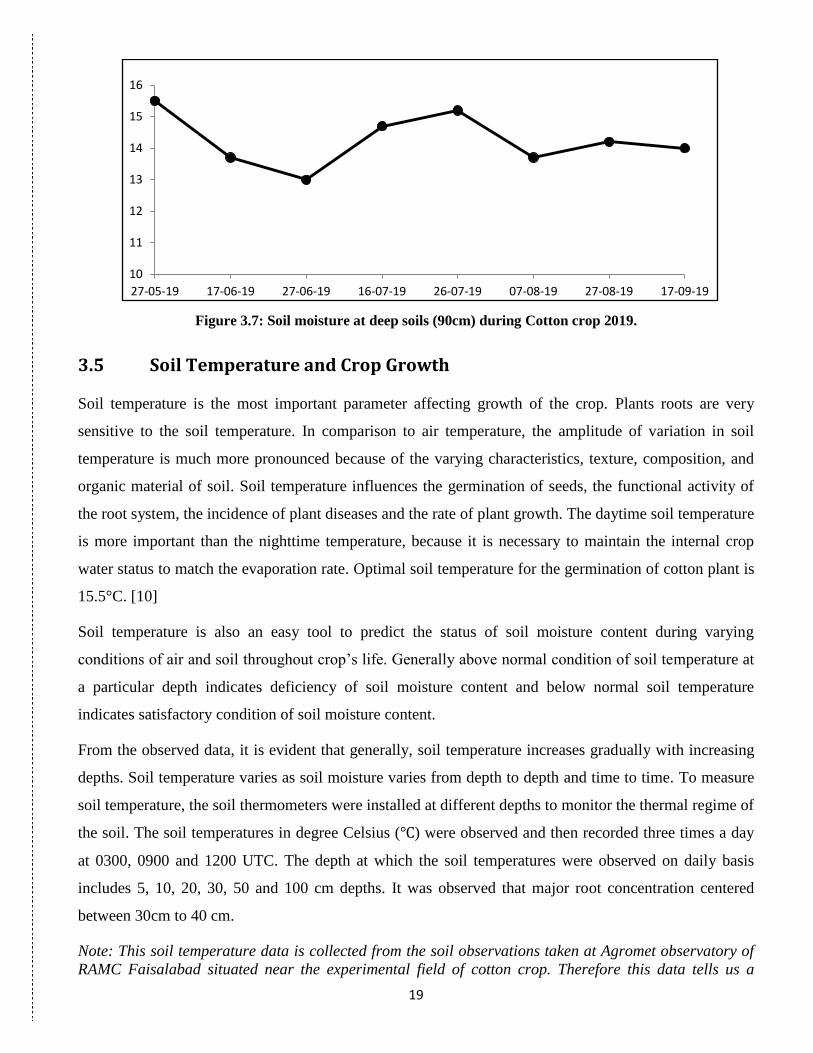
During the crop season 2019, from the observed soil moisture data, figures (3.5 – 3.7) depicts that soil
moisture remained satisfactory during most stages of the crop life whereas it remained slightly deficit
during the budding stage. The soil moisture calculations on 27-06-2019 shows the lowest values at all
depths as it was taken just before the irrigation and after that water requirements were fulfilled by the
irrigation. Month of June also received below normal rainfall while during rest of crop season rainfall
amount was sufficient to keep requisite moisture in the soil. Rainfall reported during the crop life also
fulfilled soil moisture requirement.
18
Figure 3.5: Soil moisture chrono Isopleths for Kharif Crop at Faisalabad for the year 2019.
Figure 3.6: Soil moisture at different depths during Cotton crop 2019.
0
2
4
6
8
10
12
14
16
18
27-05-19 17-06-19 27-06-19 16-07-19 26-07-19 07-08-19 27-08-19 17-09-19
5cm 10cm 20cm 30cm 40cm 50cm 70cm
19
Figure 3.7: Soil moisture at deep soils (90cm) during Cotton crop 2019.
3.5 Soil Temperature and Crop Growth
Soil temperature is the most important parameter affecting growth of the crop. Plants roots are very
sensitive to the soil temperature. In comparison to air temperature, the amplitude of variation in soil
temperature is much more pronounced because of the varying characteristics, texture, composition, and
organic material of soil. Soil temperature influences the germination of seeds, the functional activity of
the root system, the incidence of plant diseases and the rate of plant growth. The daytime soil temperature
is more important than the nighttime temperature, because it is necessary to maintain the internal crop
water status to match the evaporation rate. Optimal soil temperature for the germination of cotton plant is
15.5°C. [10]
Soil temperature is also an easy tool to predict the status of soil moisture content during varying
conditions of air and soil throughout crop’s life. Generally above normal condition of soil temperature at
a particular depth indicates deficiency of soil moisture content and below normal soil temperature
indicates satisfactory condition of soil moisture content.
From the observed data, it is evident that generally, soil temperature increases gradually with increasing
depths. Soil temperature varies as soil moisture varies from depth to depth and time to time. To measure
soil temperature, the soil thermometers were installed at different depths to monitor the thermal regime of
the soil. The soil temperatures in degree Celsius ( ) were observed and then recorded three times a day
at 0300, 0900 and 1200 UTC. The depth at which the soil temperatures were observed on daily basis
includes 5, 10, 20, 30, 50 and 100 cm depths. It was observed that major root concentration centered
between 30cm to 40 cm.
Note: This soil temperature data is collected from the soil observations taken at Agromet observatory of
RAMC Faisalabad situated near the experimental field of cotton crop. Therefore this data tells us a
10
11
12
13
14
15
16
27-05-19 17-06-19 27-06-19 16-07-19 26-07-19 07-08-19 27-08-19 17-09-19

20
general status of soil moisture of the soils of the area (which is not irrigated) and not of the crop’s field
particularly, which is irrigated as per requirement. It is thus important to note that any deficiency in soil
moisture indicated by soil temperature data may or may not be actually experienced by the crop’s soil,
which was irrigated in accordance with water requirement of the crop several times during its life time.
During the crop season 2019, soil temperature remained highest during June at all depths while at 100cm
depth July also has the same highest value of temperature. The deep layer of 100 cm remained warmest in June and
July while coolest in May.
Figure 3.8: Soil temperature during Cotton crop 2019.
3.6 Heat Units Consumption during Crop Cycle
Heat units, Growing Degree Days, effective heat units or growth units are a simple means of relating
plant growth, development, and maturity to air temperature. Heat units are often used in agronomy,
essentially to estimate or predict the length of the different phases of development in crop plants.
The heat unit concept assumes a direct and linear relationship between plant growth and temperature. It
starts with the assumption that total plant growth is dependent on the total amount of heat to which it is
subjected during its life time. The heat units for a particular crop on any day are the difference between
the daily mean temperature (T) and the base temperature (Tb) of the crop. Base temperature or Biological
zero is the minimum temperature below which no growth occurs. The base temperature or threshold
varies with different plants, and for the majority it ranges from 4.5 to 12.5°C.Here for cotton crop base
temperature is 12°C. This concept assumes that a given cultivar requires the same summation (k) of the
daily mean temperature for going one phenological stage to next stage, regardless of temperature
distribution. Generally only positive values above the biological zero (Tb) are considered. The period of
25
27
29
31
33
35
37
39
5 10 20 30 50 100
Tem
p. (
oC
)
Soil Depth(cm)
May June July August September
21
negative value is termed as “dormant” because crop does not grow under such conditions.
In this study the effective method has been used for determining heat units which is represented by the
following equation.
And
whereT= Mean daily temperature, Tb = Biological Zero (5°C),k= Heat Unit [10].
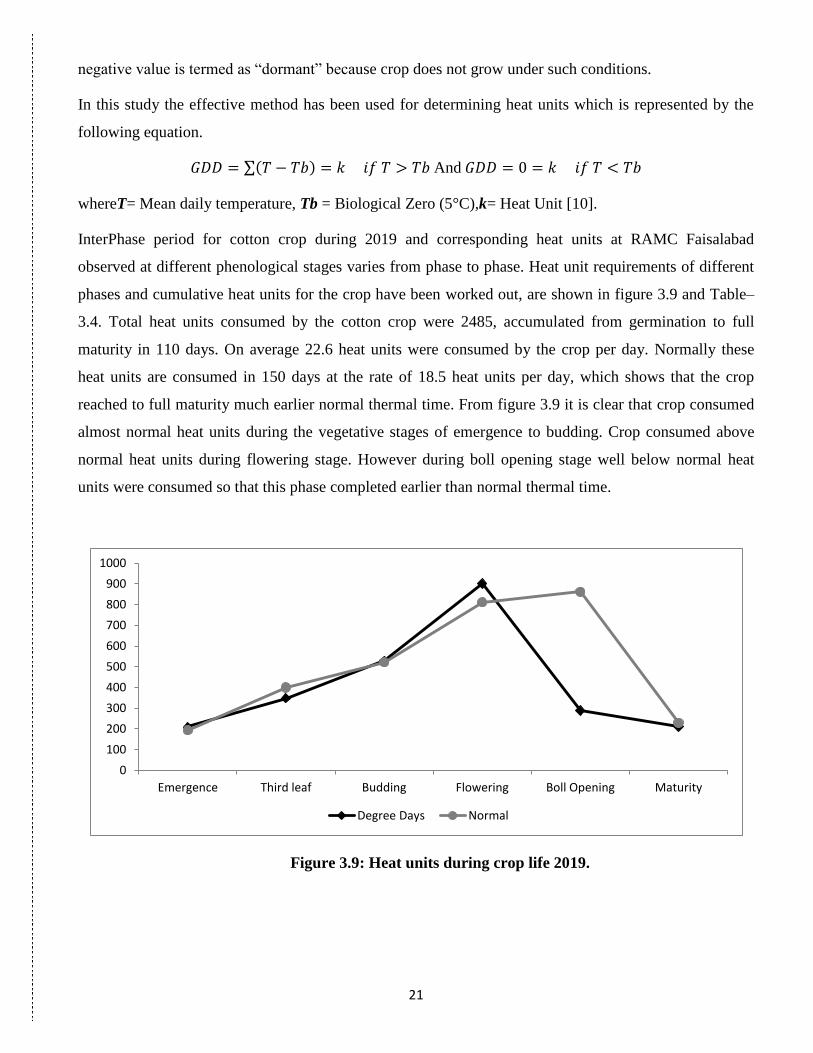
InterPhase period for cotton crop during 2019 and corresponding heat units at RAMC Faisalabad
observed at different phenological stages varies from phase to phase. Heat unit requirements of different
phases and cumulative heat units for the crop have been worked out, are shown in figure 3.9 and Table–
3.4. Total heat units consumed by the cotton crop were 2485, accumulated from germination to full
maturity in 110 days. On average 22.6 heat units were consumed by the crop per day. Normally these
heat units are consumed in 150 days at the rate of 18.5 heat units per day, which shows that the crop
reached to full maturity much earlier normal thermal time. From figure 3.9 it is clear that crop consumed
almost normal heat units during the vegetative stages of emergence to budding. Crop consumed above
normal heat units during flowering stage. However during boll opening stage well below normal heat
units were consumed so that this phase completed earlier than normal thermal time.
Figure 3.9: Heat units during crop life 2019.
0
100
200
300
400
500
600
700
800
900
1000
Emergence Third leaf Budding Flowering Boll Opening Maturity
Degree Days Normal
22
Table 3.4: Heat Units Consumed by the Crop during Different Phenological Phases
S.
No. Inter Phase Period
No. of Days
Taken
Degree Days
(T-10 )
Normal
Degree
Days
1 Date of
Sowing 25-05-2019 -- -- --
2. Emergence 25-05-2019 to 02-06-2019 9 209 194
3. Third leaf 03-06-2019 to 16-06-2019 14 348 400
4. Budding 17-06-2019 to 09-07-2019 23 528 522
5. Flowering 10-07-2019 to 20-08-2019 42 901 811
6. Boll Opening 21-08-2019 to 02-09-2019 13 288 861
7. Maturity 03-09-2019 to 11-09-2019 09 211 229
8. Picking 22-10-2019 -- -- --
9. Emergence to
Maturity 20-05-2019 to 11-09-2019 110 2485 3017
3.7 Relative Humidity (%)
Relative humidity (RH) is simply defined as the ratio of the actual amount of water vapor (grams) in the
unit mass of air at a given temperature to the mass of water vapor in the same sample of air when it is
saturated at the same temperature. RH tells us about how much a sample of air around the observing
station is saturated. It is expressed in percentage. For example if relative humidity of the atmosphere is
60%. It means that 60% of the atmosphere is saturated with water vapor or moisture and 40% of the
present moisture may be added more to saturate (100% RH) the atmosphere. RH is temperature and
moisture dependent and may vary if moisture content or temperature of the atmosphere is changed. It is
always inversely proportional to temperature and ETo. RH is calculated with the help of dry bulb and wet
bulb temperatures fitted in the Stevenson screen.
During the crop season 2019, relative humidity remained mostly in normal range except June when it
was largely below normal.
3.8 Reference Crop Evapotranspiration, ETo (mm/day)
Reference Crop Evapotranspiration or ETo is defined as the rate of Evapotranspiration from an extended
surface of 8– 15 cm tall green grass cover of uniform height, actively growing, completely shading the
ground, free from disease and not short of water. The standard method of calculating ETo is revised
Penman-Monteith equation. Using this method, ETo is calculated using data of temperature (maximum
and minimum), wind speed, relative humidity and solar radiation. Solar radiations are calculated with the
help of total bright sunshine hour data at a particular station. Sunshine duration recorders with sunshine
cards are used for sunshine hours recording [11].
23
During the crop season 2019, ETо remained below normal during most of the growing period. At
emergence and flowering stages it remained above normal and water deficiency was fulfilled by in time
irrigation. Overall soil and air moisture content was favorable for crop growth.
3.9 Wind and Crop Growth
Wind also play significant role in plant growth besides its role in variation of ETо. Normal/gentle wind is
necessary for the movement of carbon dioxide to plant canopy so that normal rate of photosynthesis
continue in day time. Strong cyclonic or stormy wind accompanied by any severe weather event like hail
storm, heavy shower may badly affect/damage the crop. During the Kharif crop period 2019, wind speed
was observed mostly below normal. However, wind guest accompanied with heavy rainfall was observed
few times during the vegetative growth phases of the crop. Wind guest of 46.3 km/h was observed on 5th
July 2019 after the completion of budding stage. No damage was done during this weather event. Wind
gusts of 37.04 km/h, was observed on 16th
of September 2019. It was after the completion of the maturity
stage, the dust raised by the strong wind deteriorated the quality of cotton fiber.
Table 3.5: Summary of some Meteorological Parameters during Kharif Season 2019
Month Wind speed (km/hr) RH (%) Days with mean RH ≥ 80% ETо (mm/day)
May-19 3.0(4.6) 36 (37.0) 0 5.8
Jun-19 3.8 (6.4) 37 (49.1) 0 6.5
Jul-19 5.1 (6.0) 63 (61.0) 03 5.2
Aug-19 3.1 (4.0) 64 (66.0) 01 4.9
Sep-19 3.0 (2.5) 62 (60.0) 0 5.0
3.10 Crop Water Requirement (CWR)
The crop water requirement (ET crop) is defined as the depth (or amount) of water needed to meet the
water loss through evapotranspiration. In other words, it is the amount of water needed by the various
crops to grow optimally.
The crop water need always refers to a crop grown under optimal conditions, i.e. a uniform crop, actively
growing, completely shading the ground, free of diseases, and favorable soil conditions (including
fertility and water). The crop thus reaches its full production potential under the given environment.
The crop water need mainly depends on:

24
Water Requirement is mainly dependant on climatic factors such as air temperature, solar
radiation, relative humidity, wind velocity etc. and agronomic factors like stage of the crop
development as well.
The climate: in a sunny and hot climate crops need more water per day than in a cloudy and cool
climate.
The crop type: crops like maize or sugarcane need more water than crops like millet or sorghum.
The growth stage of the crop; fully grown crops need more water than crops that have just been
planted [12].
3.10 Calculation of Crop Water Requirement (CWR)
After determining ETo, the ET crop/crop water requirement (CWR) can be predicted using the
appropriate crop-coefficient (Kc)
ETcrop = Kc. ETo or CWR = Kc. ETo
Crop coefficient (Kc) is actually the ratio of maximum crop evapotranspiration to reference crop
evapotranspiration. For cotton, this ratio becomes 1 during the boll opening otherwise it remains less than
1 bearing minimum values during the early age of the crop and at maturity. The crop water requirement
was calculated for the period from emergence to wax maturity. A schematic variation of the crop
coefficient related to different crop development stages under normal conditions is given in figure 3.10.
Figure 3.10: March of Crop Coefficient (Kc) for normal duration of Cotton growing season (Emergence to
Wax- Maturity).
25
The water requirements can be calculated in millimeters and they can be converted into cubic meter per
hectare by following equation:
10 mm = 1 cubic meter per hectare
Along with the loss of water through evaporation and transpiration, the compensation of this loss by
precipitation may also be considered. Normally most of the plants grow successfully and utilize water for
the soil at 50% and above available soil moisture. The maximum demand (daily or seasonal) may be
equal to the reference crop evapotranspiration (ETo) which is utilized through soil moisture. It is
observed that crop water requirement has quantitatively increased due to increasing temperature trend
[13].
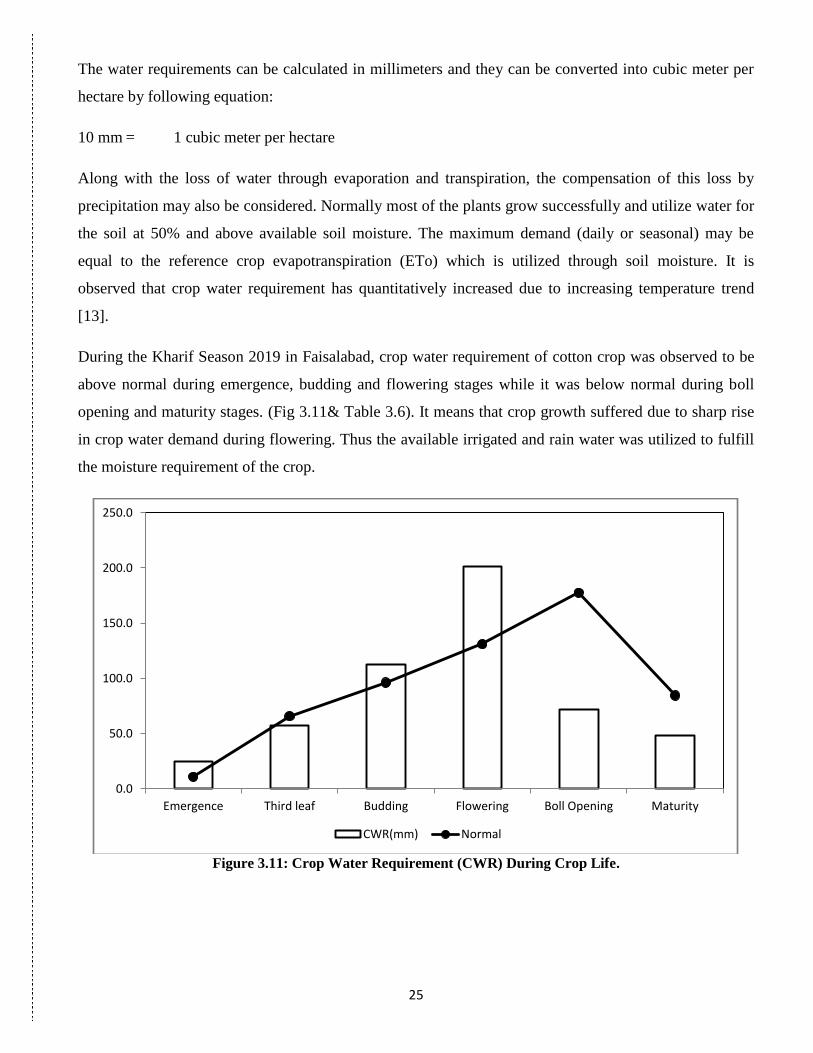
During the Kharif Season 2019 in Faisalabad, crop water requirement of cotton crop was observed to be
above normal during emergence, budding and flowering stages while it was below normal during boll
opening and maturity stages. (Fig 3.11& Table 3.6). It means that crop growth suffered due to sharp rise
in crop water demand during flowering. Thus the available irrigated and rain water was utilized to fulfill
the moisture requirement of the crop.
Figure 3.11: Crop Water Requirement (CWR) During Crop Life.
0.0
50.0
100.0
150.0
200.0
250.0
Emergence Third leaf Budding Flowering Boll Opening Maturity
CWR(mm) Normal
26
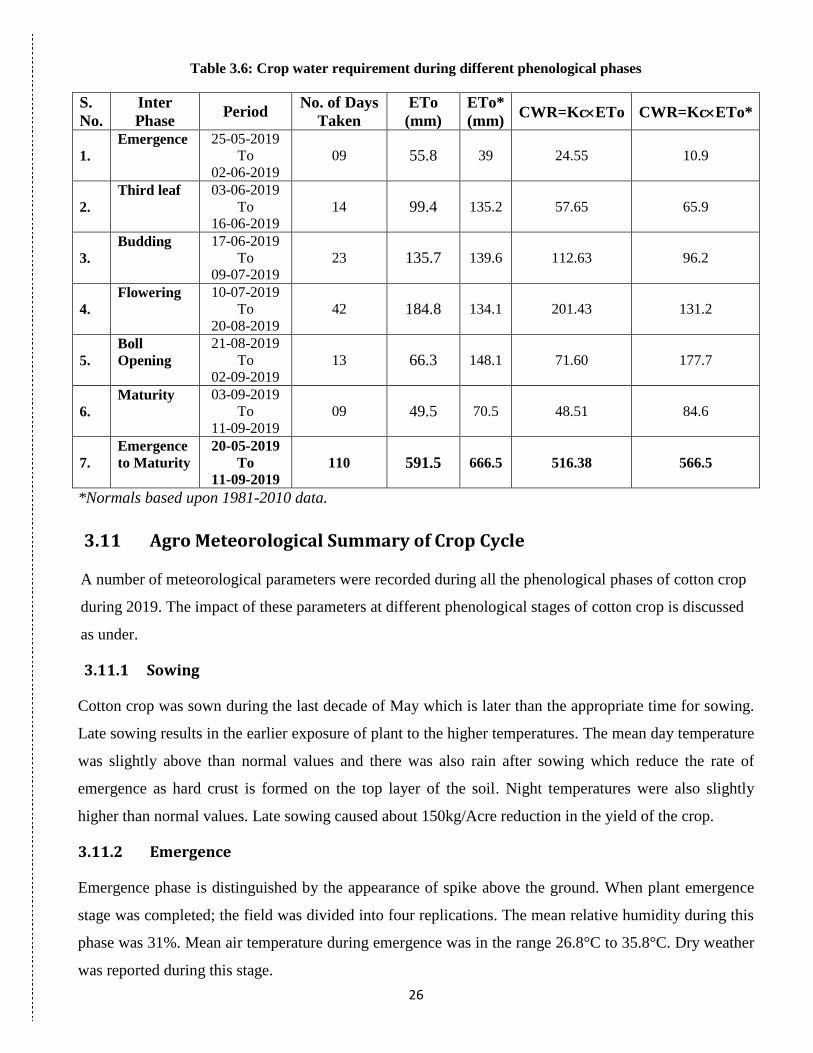
Table 3.6: Crop water requirement during different phenological phases
S.
No.
Inter
Phase Period
No. of Days
Taken
ETo
(mm)
ETo*
(mm) CWR=KcETo CWR=KcETo*
1.
Emergence 25-05-2019
To
02-06-2019
09 55.8 39 24.55 10.9
2.
Third leaf 03-06-2019
To
16-06-2019
14 99.4 135.2 57.65 65.9
3.
Budding 17-06-2019
To
09-07-2019
23 135.7 139.6 112.63 96.2
4.
Flowering 10-07-2019
To
20-08-2019
42 184.8 134.1 201.43 131.2
5.
Boll
Opening
21-08-2019
To
02-09-2019
13 66.3 148.1 71.60 177.7
6.
Maturity 03-09-2019
To
11-09-2019
09 49.5 70.5 48.51 84.6
7.
Emergence
to Maturity
20-05-2019
To
11-09-2019
110 591.5 666.5 516.38 566.5
*Normals based upon 1981-2010 data.
3.11 Agro Meteorological Summary of Crop Cycle
A number of meteorological parameters were recorded during all the phenological phases of cotton crop
during 2019. The impact of these parameters at different phenological stages of cotton crop is discussed
as under.
3.11.1 Sowing
Cotton crop was sown during the last decade of May which is later than the appropriate time for sowing.
Late sowing results in the earlier exposure of plant to the higher temperatures. The mean day temperature
was slightly above than normal values and there was also rain after sowing which reduce the rate of
emergence as hard crust is formed on the top layer of the soil. Night temperatures were also slightly
higher than normal values. Late sowing caused about 150kg/Acre reduction in the yield of the crop.
3.11.2 Emergence
Emergence phase is distinguished by the appearance of spike above the ground. When plant emergence
stage was completed; the field was divided into four replications. The mean relative humidity during this
phase was 31%. Mean air temperature during emergence was in the range 26.8°C to 35.8°C. Dry weather
was reported during this stage.
27
3.11.3 Third Leaf
This phase took 06 days to complete. The mean relative humidity was 30%; mean air temperature was
from 34.0°C to 35.5°C. No precipitation was recorded during this phase. Good crop growth was reported
during this stage.
3.11.4 Budding
The bud is in the shape of three walled pyramid and lighter in colour than the plant leaves. This phase is
considered established when the bud is 3-5 mm in size. The mean air temperature during this
phenological stage was 28.0°C to 34.5°C and mean relative humidity was 49%. This phase experienced
high amount of precipitation i.e. 104.5 mm which also include a spell of 72.0 mm rainfall on 05-07-2019.
3.11.5 Flowering
The mean air temperature during this stage was recorded in the range from 27.3°C to 34.2°C and mean
relative humidity was 69%. This phase experienced much frequent rain with a significant total amount of
142.6 mm. It includes a spell of 30 mm on 19th
of July. The increase in humidity also triggered the pest
and disease attack on the crop.
3.11.6 Boll Opening
This phase is established when the opening of the top of the boll is one centimeter long and the cotton
fibers are visible through the opening. The mean air temperature was from 26.9°C to 33.1°C during this
phase. The relative humidity was 60%. Precipitation of 16.2 mm was reported during this phase. Due to
relatively higher temperatures during this phase boll took less days to open. The opening of boll was not
proper and large number of boll were unable to open to full extent as a result cotton fiber stuck in the boll
and result in decline of both quality and quantity. Higher temperatures not only reduce the production of
new boll but also cause shedding of boll. Pest attack was observed during this phase.
3.11.7 Maturity
This phase is established when the lint hairs have dried and turned into fez and can be easily detached
from the boll. The mean air temperature was recorded as from 32.0°C to 35.1°C whereas mean relative
humidity during this phase was 58%. This stage experienced absolutely no rain.
3.11.8 Picking of Cotton
Picking of the cotton crop was done on 22-10-2019. It was also late as the maturity was completed on 11-
09-2019. The dust raised by the wind and other weather conditions like rain badly affects the quality of
cotton fiber.
28
Chapter 4
CONCLUSION AND RECOMMENDATIONS
The crop variety F.H-142 was cultivated in the experimental field of Ayub Agriculture Research Institute
Faisalabad. The sowing time is a very important factor. The time of sowing is directly related to yield of
the crop.
According to Table – 3.1 and Chapter-3 (Results and Discussion), the crop was sown later than the
proper time. Amount of seed cultivated per acre was 08 kg which is sufficient for the crop cultivated in
May. Fertilizer intake was also enough. Above normal Rainfall was reported in May while June received
below normal rainfall. July received 144.6 mm of precipitation which was also largely above normal.
Cotton was in budding and flowering stages during this month. Below normal rainfall was experienced in
the month of August but September experienced above normal precipitation. Irrigation was made 07
times during the season which mostly fulfilled the water requirement of the crop. Day and night time
temperatures fluctuate from slightly below normal to above normal range. RH was also observed to be
slightly below normal throughout the crop life. ETo remained below normal during most of the crop’s
growth period. As a result normal moisture content of soil in major root zone was observed during most
of the crop life thus contributing to normal crop’s growth, development. Air temperature regime
remained above normal for most of the crop’s period. Total heat units consumed by the cotton crop were
2485 accumulated from germination to full maturity in 110 days. On average 22.6 heat units were
consumed by the crop per day. Normally these heat units are consumed in 150 days at the rate of 18.5
heat units per day, which shows that the crop reached to full maturity earlier than normal thermal time.
From figure 3.9 it is clear that crop consumed around normal heat units during the vegetative stages.
However during flowering slightly above normal heat units were consumed. At boll opening stage below
normal heat units were consumed.
Excess of weeds also play important role in yield’s reduction as weeds consume considerable amount of
moisture and other soil nutrients and negatively affect crop’s growth at the same time. But this issue can
be resolved by proper and timely use of recommended varieties of weedicides. During 2019
recommended weedicides operations were performed in time, which also reinforced crop’s growth and
production. Due to favorable temperature and humidity values pest attack was observed on the crop
during its life cycle. Pesticides were used for the control of whitefly, Jassid, sucking and bollworms.

29
4.1 Conclusions
During the Kharif season 2019, crop was sown later than normal time, one of the reasons for late sowing
was late harvesting of wheat as wheat-cotton crop rotation is usual practice in most of cotton cultivation
areas. Higher temperatures also resulted in early maturity of particular phonological stages which did not
allow the plant to consume the proper growing time. Higher temperatures cause flower and boll shedding.
Higher values of humidity triggered the pest and diseases attack. Crop was treated with normal fertilizer
doze and weeds removing spray at suitable intervals. Pesticides were also used to control the pest attacks.
Overall the weather conditions impose negative effect on the growth and final yield of the cotton crop
during the Kharif season 2019.
4.2 Recommendations
Keeping above results and conclusions, following recommendations/suggestions are given to farmers and
other related personals to enhance cotton crop yield in central Punjab as well as all over Pakistan.
1 – Farmers generally plant cotton late due to late harvesting of Rabi crop which results in drastic low
yields because the crop is exposed to heat stress at early stages leading to the formation of reduced boll
size. Late-planted crop has central germination, smaller heads, shriveled boll and central biomass than the
timely planted crop. Any delay in planting would reduce yield drastically. To achieve good yield, cotton
sowing should be carried out well in time. Keeping the results of this study, it is suggested that the most
suitable time of sowing under existing climate and available water in central Punjab is month of May.
2 – Cotton plant water requirement is maximum during flowering and boll opening and maturity stages
followed by vegetative stages. Therefore farmers and other decision makers should make possible the
availability of irrigation water to cotton crop keeping this order in mind to get maximum crop yield.
3- Farmers should take in time precautionary measures against any pest/fungus/viral etc. attack on crop,
especially during hot/humid period of monsoon.
4 – The frequency of extreme weather events like heat waves, flash flooding, and heavy spells with
stormy winds has increased globally including Pakistan in the last decade due to climate change. Pakistan
has also been o facing water shortages and drought conditions for the last several years due to lesser rains
and high temperatures due to global warming which resulted in hampering of cotton production. In order
to minimize the negative effects of climate change and accompanied global warming, drought and heat
tolerant varieties need to be evolved in addition to the judicial use of available irrigation water. Keeping
30
in mind the available water resources, it is also indeed necessary to decide suitable verities to be
cultivated in a particular region.
5 – Farmers may be advised to be in contact with local and Federal Agricultural Departments and
Pakistan Meteorological Department throughout crop’s life, especially at the time of sowing, adding
fertilizers to crop and before irrigation. It will help the farmers to get in time weather advices to deal in
better way with any present or coming water stress condition and to be aware of any weather related pest
attack, especially during monsoon season and to get best results of fertilizer and irrigated water used.
6 – Frequent rains/irrigation some time sharply increases plant growth and elongates plant height above
normal and speeds up weeds growth. Due to which crop stages take more time for completion and
number of branches emerge on each plant decrease, which ultimately affect final yield and lengthens crop
life span. As a result sowing of coming Rabi crop on the same field becomes late. Therefore farmers
should carefully add irrigated water in rainy conditions.
7 – Weeds being the main robbers of plant food from soil; space and even light required for cotton plants,
be controlled by cultural practices and in case of heavy infestation, may be eliminated by application of
recommended herbicides and weedicides. This technique will definitely increase the yield.
8 – Seed of high yielding cotton varieties resistant to rusts, smuts, etc. approved by Agricultural
Department for a particular region in a particular amount must be used. Seed should be treated with a
suitable insecticide carefully before sowing.
9 – Timely application of nitrogen-phosphoric fertilizers should be done.
10 – Care must be taken to check the pre and post-harvest losses of cotton.
11 – Crop rotation is an important factor that enriches the fertility of the land, which should not be
ignored.

31
References
[1] Chaudhry, Q. Z. and G. Rasul (2004): Agroclimatic Classification of Pakistan, Science Vision
Vol.9 No.1-2 (Jul - Dec, 2003) & 3-4 (Jan - Jun, 2004).
[2] Shamshad, K.M. (1988): Meteorology of Pakistan, Royal Book Agency, Karachi, Pakistan.
[3] Monthly Climatic Normals of Pakistan, 1981-2010 (January 2013): Climate Data Processing
Center, Pakistan meteorological Department, Karachi.
[4] Economic Survey of Pakistan, 2013-14: http://budget.par.com.pk/dll/1189/
[5] Punjab Agriculture Department 2014: http://www.agripunjab.gov.pk
[6] Pakistan Agricultural Department: http://www.defence.pk/forums/national-political-
issues/102679-punjab-door-revolution.html#ixzz2PWvbxY6r/
[7] USDA Foreign Agriculture Service Report (2014): www.fas.usda.gov
[8] Fowler, D. B. (2002): Growth stages of Wheat, Chapter 10:
http://www.usask.ca/agriculture/plantsci/winter_cereals/index.php
[9] Imran, A, Q. Zaman and M. Afzal (2013): Temporal trends in the peak monsoonal precipitation
events over Northeast Pakistan, Pakistan Journal of Meteorology. Vol. 10, Issue 19: July 2013.
[10] Mavi, H. S. and Graeme J. T. (2005):Agrometeorology; principals and applications of climate
studies in agriculture, international book distributing company, Lucknow, India.
[11] FAO Irrigation and Drainage Paper 33.
[12] Crop water needs chapter10. FAO.(http://www.fao.org/docrep/S2022E/s2022e07.htm).
[13] Naheed, G and G. Rasul (2010). Recent water requirement of Cotton crop in Pakistan, Pakistan
Journal of Meteorology. Vol. 6, Issue 12: January 2010.