costly external finance, corporate investment, and the subprime mortgage credit crisis ran duchin,...
TRANSCRIPT

Costly External Finance, Corporate Investment, and the Subprime Mortgage Credit Crisis
Ran Duchin, Oguzhan Ozbas and Berk Sensoy
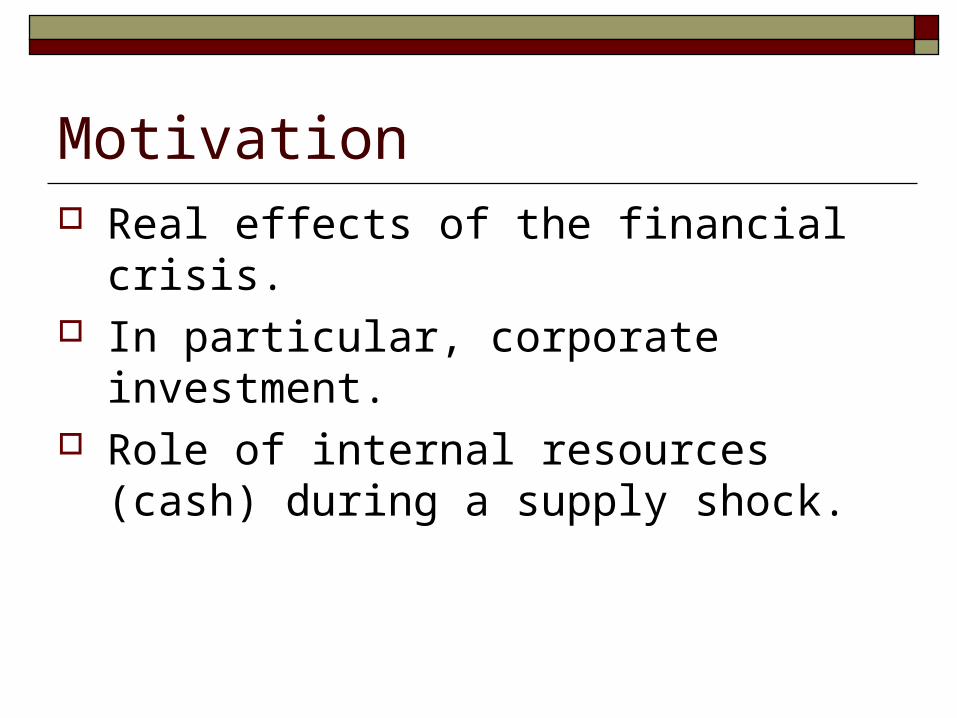
Motivation Real effects of the financial crisis. In particular, corporate investment. Role of internal resources (cash) during a
supply shock.

August, 2007

Motivating Figure 1:Cash
10
15
20
25
Cas
h (p
erce
ntag
e of
tota
l ass
ets)
1985 1990 1995 2000 2005 2008Year
Average Cash/Assets (%)

Motivating Figure 2: Cash and Returns
-.05
0
.05
.1
.15
.2
Cu
mul
ativ
e A
bno
rmal
Re
turn
Mar Jun Sep Dec2007
High cash Low cash H - L
Cash Sorted Portfolio Returns

This Paper
Non-financial firms cut investment following the onset of the crisis.
More so when less cash on hand. More so when financially constrained or
dependent on external financing. Some evidence of an interaction, especially
between cash and external finance dependence.

Empirical Strategy Differences-in-differences
Before (Q3 2006- Q2 2007) vs. after (Q3 2007 – Q2 2008).
Response as a function of cash reserves Firm fixed effects Control for Q, cash flow Standard errors clustered by firm
itititiiit CFQCashAfterAfterI 4321
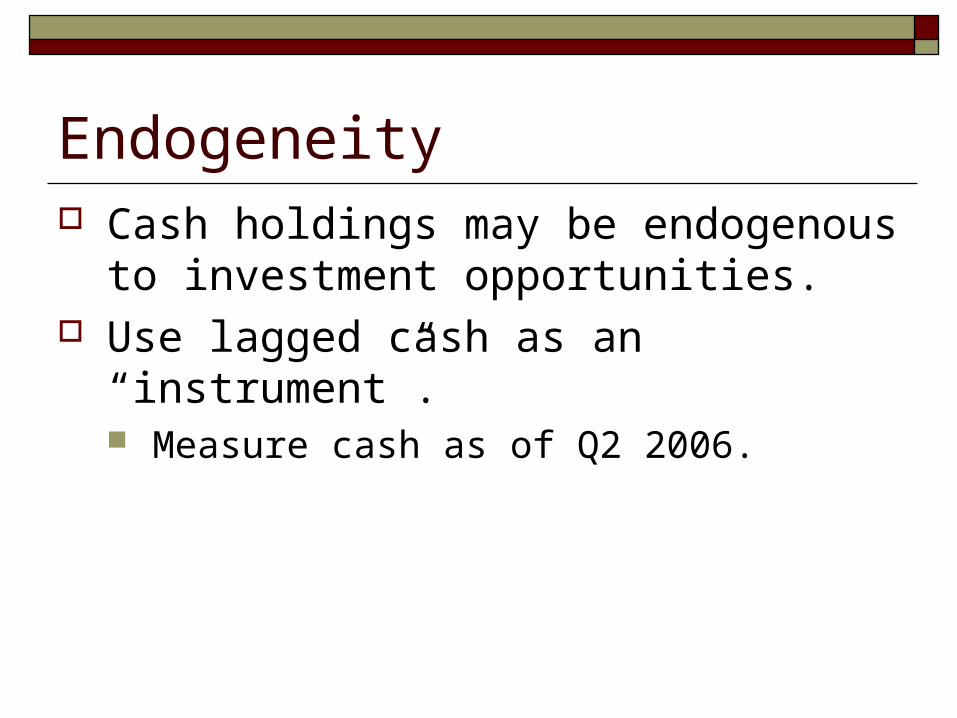
Endogeneity Cash holdings may be endogenous to
investment opportunities. Use lagged cash as an “instrument”.
Measure cash as of Q2 2006.

Timeline
Before2006Q3 – 2007Q2
After2007Q3 – 2008Q2
Subprime MortgageCredit Crisis
Cash Reserves2006Q2
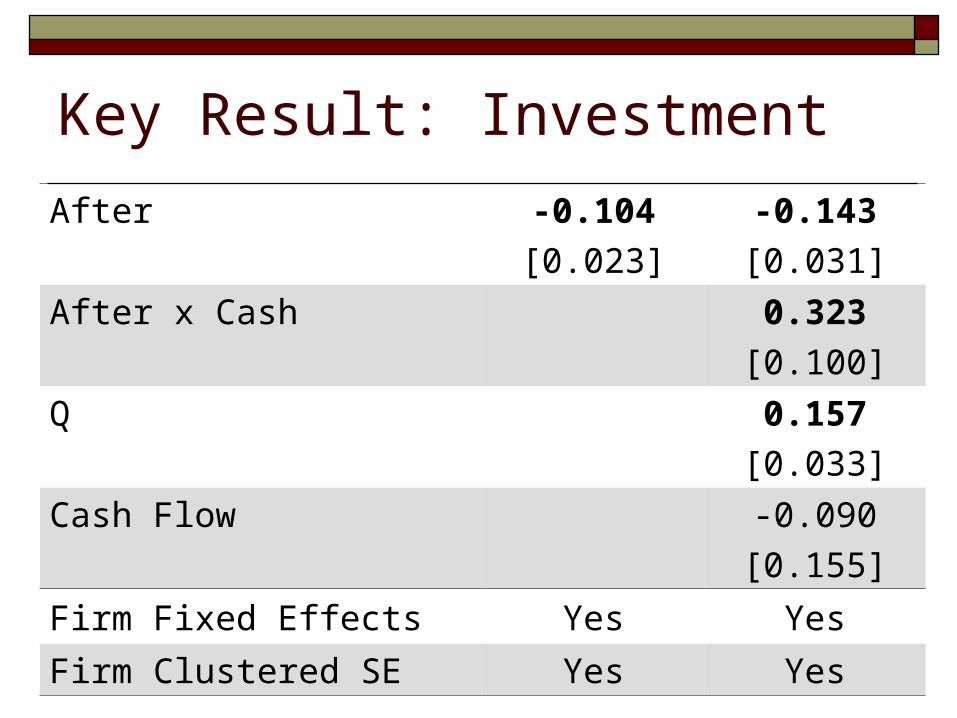
Key Result: Investment
After -0.104
[0.023]
-0.143
[0.031]
After x Cash 0.323
[0.100]
Q 0.157
[0.033]
Cash Flow -0.090
[0.155]
Firm Fixed Effects Yes Yes
Firm Clustered SE Yes Yes

Endogeneity What if even lagged cash proxies for
susceptibility to demand shocks? We provide direct evidence against this idea. We also provide cross-sectional evidence based
on financial constraints and external finance dependence, consistent with a supply effect.

Direct Evidence: Placebo Regressions
(1) (2) (3) (4)
After -0.399
[0.026]
0.108
[0.030]
0.027
[0.033]
-0.038
[0.032]
After x Cash Reserves -0.116
[0.079]
0.106
[0.102]
-0.286
[0.101]
-0.047
[0.099]
Q 0.146
[0.022]
0.136
[0.034]
0.150
[0.041]
0.213
[0.035]
Cash Flow -0.139
[0.115]
0.049
[0.116]
-0.040
[0.131]
-0.037
[0.132]
Placebo Crisis Date 9/11 2004Q2 2005Q2 2006Q2

Placebo Conclusions Relation between lagged cash and investment
is not a general feature of the data. It is also not a feature of the data in bad times
that are mostly demand-driven.
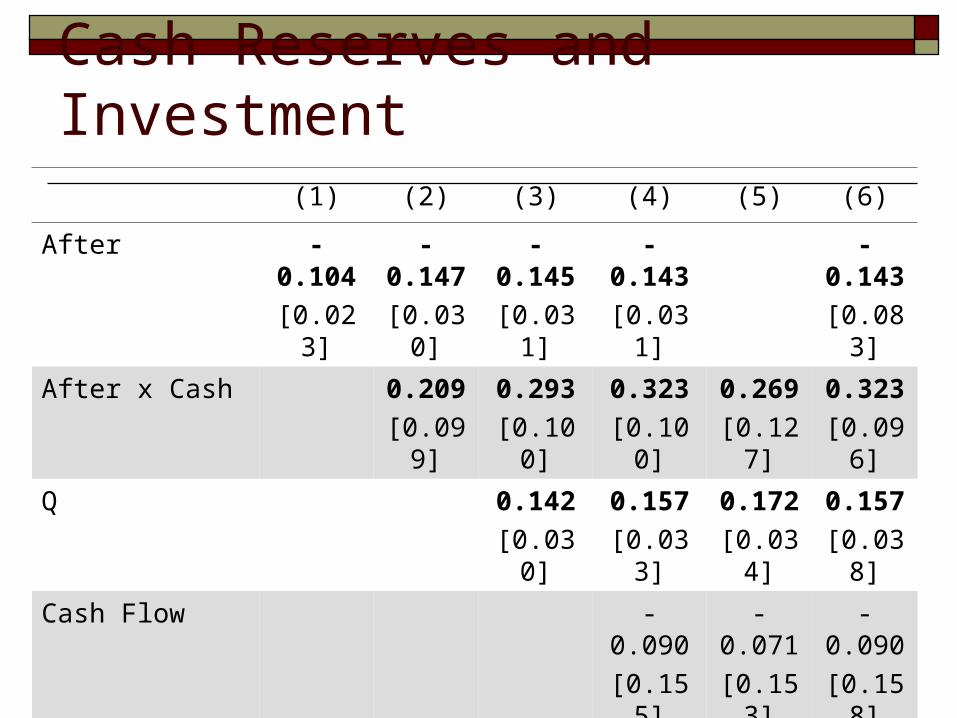
Cash Reserves and Investment(1) (2) (3) (4) (5) (6)
After -0.104
[0.023]
-0.147
[0.030]
-0.145
[0.031]
-0.143
[0.031]
-0.143
[0.083]
After x Cash 0.209
[0.099]
0.293
[0.100]
0.323
[0.100]
0.269
[0.127]
0.323
[0.096]
Q 0.142
[0.030]
0.157
[0.033]
0.172
[0.034]
0.157
[0.038]
Cash Flow -0.090
[0.155]
-0.071
[0.153]
-0.090
[0.158]
Firm Fixed Effects Yes Yes Yes YesFirm & Ind-Qtr
Yes
Firm Clustered SE Yes Yes Yes Yes Yes Double
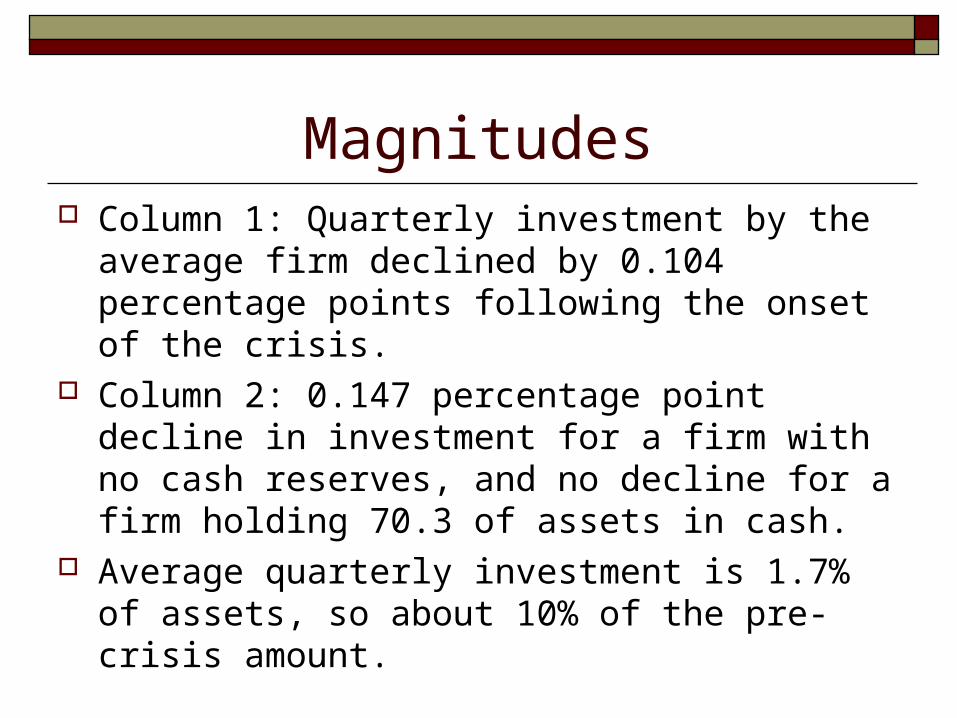
Magnitudes Column 1: Quarterly investment by the
average firm declined by 0.104 percentage points following the onset of the crisis.
Column 2: 0.147 percentage point decline in investment for a firm with no cash reserves, and no decline for a firm holding 70.3 of assets in cash.
Average quarterly investment is 1.7% of assets, so about 10% of the pre-crisis amount.

Magnitudes After x Cash coefficient is about 0.3. Sample average Cash is 0.23, with standard
deviation 0.26. One-standard deviation increase in Cash is
associated with 0.07 percentage points greater investment, almost offsetting the average decline (-0.10).

Cash Reserves, Financial Constraints and Investment
Panel A: Change in investment
Kaplan-Zingales Whited-Wu Bond Ratings
Low High Low High High Low
After -0.049
[0.026]
-0.138
[0.042]
-0.024
[0.019]
-0.114
[0.038]
0.002
[0.024]
-0.135
[0.027]
Panel B: Change in investment conditional on cash reserves
After -0.095
[0.036]
-0.174
[0.051]
-0.032
[0.027]
-0.250
[0.058]
-0.010
[0.036]
-0.203
[0.038]
After x Cash 0.226
[0.109]
0.429
[0.276]
0.206
[0.117]
0.573
[0.129]
0.294
[0.187]
0.398
[0.138]
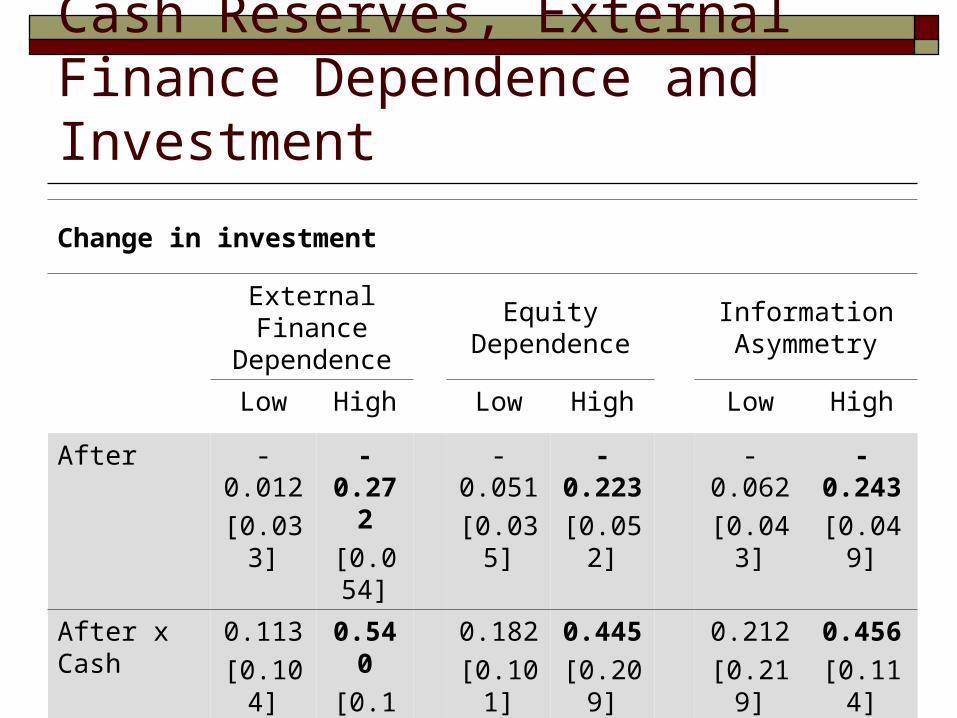
Cash Reserves, External Finance Dependence and Investment
Change in investment
External Finance Dependence
Equity Dependence
Information Asymmetry
Low High Low High Low High
After -0.012
[0.033]
-0.272
[0.054]
-0.051
[0.035]
-0.223
[0.052]
-0.062
[0.043]
-0.243
[0.049]
After x Cash 0.113
[0.104]
0.540
[0.184]
0.182
[0.101]
0.445
[0.209]
0.212
[0.219]
0.456
[0.114]

Excess Cash and Investment(1) (2) (3) (4)
After -0.100
[0.023]
-0.075
[0.023]
-0.101
[0.023]
-0.074
[0.023]
After x Excess Cash 0.187
[0.099]
0.237
[0.096]
0.119
[0.096]
0.166
[0.096]
Q 0.152
[0.031]
0.155
[0.032]
Cash Flow -0.155
[0.150]
-0.103
[0.150]
Excess Cash Measure Baseline Baseline Extended Extended

Cash Reserves and Other Investment
(1) (2) (3) (4)
After -0.028
[0.030]
-0.128
[0.047]
-0.081
[0.040]
-0.247
[0.105]
After x Cash Reserves 0.661
[0.152]
0.789
[0.191]
0.438
[0.106]
1.591
[0.384]
Investment Measure SG&A R&D Inventory NWC

Conclusion Corporate investment declines following the
onset of the crisis. Decline mitigated by cash reserves, including
seemingly excess cash. Decline worse for financially constrained,
external finance dependent firms. Some evidence of an interaction, especially
between cash and external finance dependence.

Conclusion Evidence consistent with a supply effect. Campello, Graham, and Harvey (2009)
survey corporate managers and find that they are foregoing investments because of financing constraints.
Tong and Wei (2008) find that financially constrained firms exhibit worse stock-price performance during the crisis.

Conclusion Contributions are threefold.
Help understand the real effects of the crisis. Add to the literature on financial constraints,
external finance dependence and investment. Deepen our understanding of the role of corporate
cash holdings Bright-side of seemingly excess cash.
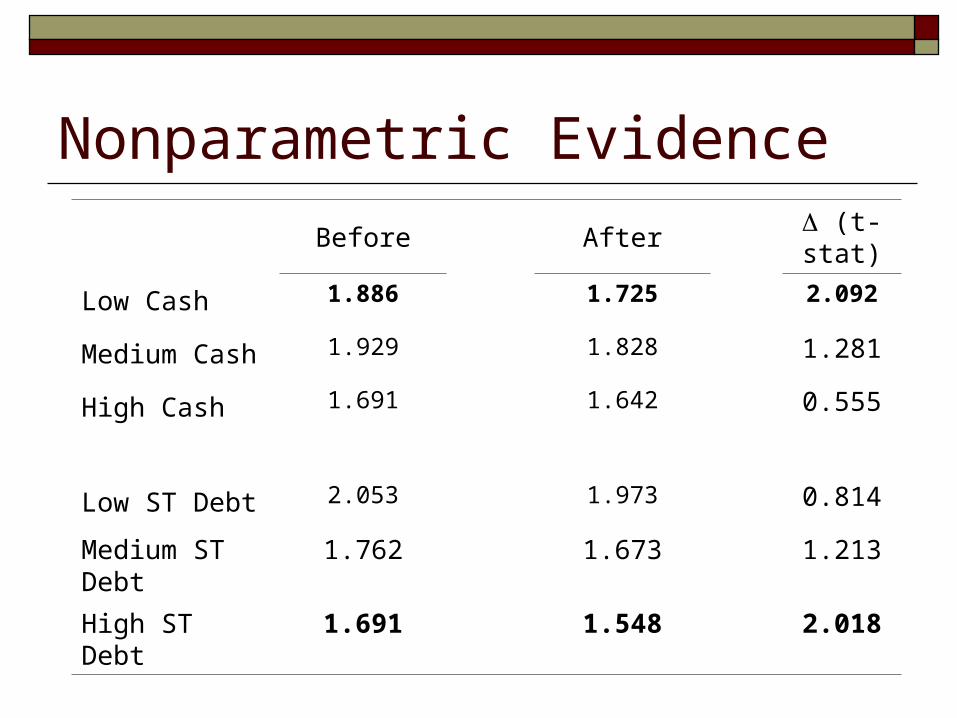
Nonparametric EvidenceBefore After (t-stat)
Low Cash 1.886 1.725 2.092
Medium Cash 1.929 1.828 1.281
High Cash 1.691 1.642 0.555
Low ST Debt 2.053 1.973 0.814
Medium ST Debt 1.762 1.673 1.213
High ST Debt 1.691 1.548 2.018

What Do We Know About Cash? Theory
Benefits of cash Precautionary motive (Keynes 1936)
Costs of cash Agency (e.g., Jensen 1986)
Evidence Precautionary cash holdings (Opler et al. 1999; Bates et
al. 2008) Agency costs of (excess) cash (Harford 1999; Dittmar and
Mahrt-Smith 2007)

Measuring Financial Constraints Kaplan-Zingales Index = -1.002*Cash Flow + 0.283*Q
+ 3.319*Debt – 39.368*Dividends – 1.315*Cash Whited-Wu Index = -0.091*Cash Flow +
0.062*Dividend Dummy + 0.021*Long Term Debt – 0.044*Size + 0.102*Industry Sales Growth – 0.035*Sales Growth
Bond Ratings = Indicator variable equal to 1 if the firm has a bond rating

What Do We know About Investment And The Supply Of Capital?
Theory (Credit Rationing ) Information Asymmetry (Jaffee and Russell (1976) ,
Stiglitz and Weiss (1981)) Moral hazard (Holmstrom and Tirole (1997))
Evidence Investment-Cash Flow Sensitivity (e.g., Fazzari,
Hubbard, and Petersen (1988), Hoshi, Kashyap, and Scharfstein (1991), Kaplan and Zingales (1997))
Inventory (Kayshap, Lamont and Stein (1994)) Credit supply shocks (e.g., Lemmon and Roberts
(2007), Tong and Wei (2008)

Measuring External Finance Dependence and Information Asymmetry Following Rajan and Zingales (1998), we
compute the following industry measures: External Finance Dependence =
Proportion of capital expenditure that cannot be financed by funds from operations
External Equity Dependence = Ratio of the net amount of equity issued to capital expenditures.
Information Asymmetry = Dispersion in productivity growth (to measure idiosyncratic firm performance)

A Standard Model of InvestmentWith Costly External Finance Choose I, E
When C is sufficiently high
When C is sufficiently low
IECts
IEkIf
..
)()(max
1)( FBIf
01)()( CIkIf SBSB

Model (Cont.) Effect of cash on investment
Effect of financing constraints on investment
0)()(
)(
CIkIf
CIk
dC
dISBSB
SBSB
0)()(
)(
CIkIf
CIk
d
dISBSB
SBSB