cost of in situ treatment of fuel oxygenates - us epa · pdf filecost of in situ treatment of...
TRANSCRIPT
Cost of In situ Treatment of Fuel Oxygenates
Linda Fiedler, U.S. EPA, Office of Solid Waste and Emergency Response, Washington, DC Michael Berman, Tetra Tech EM Inc., Reston, VA
Abstract
Introduction As a result of fuel spills, thousands of sites across the United States are contaminated with fuel hydrocarbons and oxygenates. Most of these sites are service stations that have stored gasoline in leaking underground storage tanks. Latest data from the U.S. Environmental Protection Agency’s Office of Underground Storage Tanks indicate that out of 436,500 confirmed releases of gasoline into the environment, 139,500 still require cleanup (EPA, 2003). Many of these sites are contaminated with fuel hydrocarbons, most often benzene, ethylbenzene, toluene, and xylene (BTEX) compounds, as well as the common fuel oxygenate methyl tertiary-butyl ether (MtBE). In a 2000 survey, of the 44 states that reported testing for MtBE at leaking tank sites, 35 reported finding it in the groundwater at least 20 percent of the time they sampled for it, and 24 states reported finding it at least 60 percent of the time. Twenty-six states have established standards for MtBE in drinking water, and 32 states have established MtBE cleanup levels for soil and groundwater. Data on Treatment Technologies Used to Remediate MtBE Sites EPA maintains an on-line database of MtBE Treatment Profiles containing data on the design, operation, performance, and cost of treatment at sites contaminated with MtBE (http://cluin.org/products/mtbe). These sites may be contaminated with BTEX and other oxygenates, such as ethyl tertiary-butyl ether, tertiary-amyl methyl ether (TAME), diisopropyl ether (DIPE), tertiary-butyl alcohol (TBA), ethanol, and methanol. The sources of these project data are journal articles, conference proceedings, interviews with practitioners, and direct data input from site managers and technology vendors. In March 2003, there were 239 ongoing and 84 completed projects on the website. The technologies on the website include bioremediation, in situ chemical oxidation, air sparging, soil vapor extraction (SVE), multi-phase extraction, phytoremediation, thermal desorption, and pump-and-treat. Often these technologies are used in combination to cost-effectively address soil and groundwater or high and low contaminant concentrations. Treatment Technology Costs In July 2003, EPA conducted an analysis of the costs for 162 ongoing and completed full-scale cleanup projects included in the MtBE Treatment Profiles. The cost data were intended to be total completed or to-date costs for the treatment components of the cleanup. Specific components of the cost are not listed in the database, and are often not available. As shown below, the costs within and across technologies varied widely. The cost ranges and median costs (in parentheses) for the seven technologies or technology groups with at least 8 projects are listed below. Technology Category Total Cost Range Median Total Cost • Air Sparging (8 projects) - $20,536 - $345,000 ($135,762) • Bioremediation (29projects) - $21,000 - $5,700,000 ($150,000) • Air Sparging with SVE (56 projects) - $26,988 - $754,712 ($181,144) • Soil Vapor Extraction (16 projects) - $37,830 - $1,203,200 ($214,850) • SVE and Pump-and-Treat (10projects) - $160,000 - $1,390,000 ($331,525) • Air Sparging, SVE, and Pump-and-Treat (12projects) - $143,500 - $643,500 ($353,500) • Pump-and-Treat (16projects) - $71,928 - $1,628,300 ($457,725)
219

The purpose of this paper is to present a more detailed analysis of the cost data available in the MtBE Treatment Profiles related to the treatment, specifically in situ treatment, of MtBE and other fuel oxygenates. This analysis will consist of a review of the available cost and related data with the goal of identifying variables from which unit costs can be derived. The paper will discuss factors that potentially impact the cost of these projects and will attempt to draw conclusions about the cost of treating MtBE and other oxygenates in general, based on the data from the projects in MtBE Treatment Profiles. Linda Fiedler U.S. EPA (5102G) 1200 Pennsylvania Ave., NW Washington, DC 20460 (703) 603-7194 (703) 603-9135 (fax) [email protected] Ms. Fiedler is an environmental engineer with EPA’s Technology Innovation Office, under the Office of Solid Waste and Emergency Response. For the past 15 years she has collected and disseminated information on technologies to assess and remediate contaminated sites, including methods to treat methyl tertiary-butyl ether (MtBE) and other fuel oxygenates. Michael H. Berman, P.E. Tetra Tech EM Inc. 1881 Campus Commons Drive Suite 200 Reston, VA 20191 (703) 390-0662 (703) 391-5876 (fax) [email protected] Michael H. Berman, P.E., is an engineer with Tetra Tech EM Inc. with 10 years experience in site remediation and technology transfer projects. For the past five years, he has supported EPA’s Technology Innovation Office in making information about the cost and performance of emerging treatment technologies more readily available.
220
Cost of In situ Treatment of Fuel Oxygenates
Linda Fiedler, U.S. EPA, Office of Solid Waste and Emergency Response, Washington, DC Michael Berman, Tetra Tech EM Inc., Reston, VA
INTRODUCTION Thousands of sites across the United States (U.S.) are contaminated with fuel hydrocarbons and oxygenates. Most of these sites are service stations that have stored gasoline in leaking underground storage tanks. Latest data from the U.S. Environmental Protection Agency’s Office of Underground Storage Tanks indicate that out of 436,500 confirmed releases of gasoline into the environment, 139,500 still require cleanup (EPA, 2003). At many of these sites, methyl tertiary-butyl ether (MtBE) and other fuel oxygenates are contaminants of concern. Fuel oxygenates are oxygen-containing compounds that have been used over the past several decades as gasoline additives to increase octane ratings and produce cleaner burning fuel. They consist of ether-based or alcohol-based compounds, such as methyl tertiary-butyl ether (MtBE), ethyl tertiary-butyl ether (ETBE), tertiary-amyl methyl ether (TAME), diisopropyl ether (DIPE), tertiary-butyl alcohol (TBA), ethanol, and methanol. Oxygenates have been used in the U.S. since the late 1970s as octane boosters, with their use increasing in response to the requirement to oxygenate fuels under the 1990 Clean Air Act Amendments. Until recently, MtBE was the most common fuel oxygenate, present in more than 80 percent of oxygenated fuels. Over the past several years, as site owners and regulators have discovered the widespread extent of contamination with MtBE, its use has been reduced and in some cases replaced with other oxygenates such as ethanol. Even with its reduced usage, in 2002, the U.S. General Accounting Office estimated that at least 40,000 UST sites with MtBE contamination remained to be addressed (GAO, 2002). There are many challenges associated with the characterization and remediation of sites contaminated with MtBE and other oxygenates. For example, fuel oxygenates are generally more soluble, less likely to partition to organic matter in soil, and slower to biodegrade than other contaminants in fuel, such as benzene, toluene, ethylbenzene, and xylene (BTEX). These properties result in larger and more widespread groundwater plumes and challenges with employing certain treatment technologies. These factors also impact the ability to characterize the nature and extent of contamination involving fuel oxygenates. Technologies available to cleanup MtBE and other oxygenates in soil, groundwater, and drinking water include: air sparging, bioremediation, in situ chemical oxidation, groundwater pump-and-treat, multi-phase extraction (MPE), soil vapor extraction (SVE), phytoremediation, and thermal treatment. Until recently, limited information was available about technologies used to address sites contaminated with MtBE and other oxygenates. To address this need for information, the U.S. Environmental Protection Agency (EPA) has worked to make available information about the characterization and treatment of sites contaminated with MtBE and other oxygenates, including the publication of fact sheets, technical reports, and other documents. Since 2000, EPA’s Office of Solid Waste and Emergency Response has compiled information about actual cleanup sites where the treatment of MtBE and other oxygenates has taken place to provide additional information to regulators, remediation consultants, technology vendors, and other interested parties. In April 2002, EPA published an online database of this information as MtBE Treatment Profiles, located at the website http://cluin.org/products/mtbe/. This website is intended to be used as a starting point for identifying technologies that have been used for the treatment of MtBE and other oxygenates, as well as for identifying other environmental professionals, technology providers, or remediation consultants that may serve as resources This paper focuses on the analysis of the cost data for the projects that treated MtBE and other oxygenates that are described in the MtBE Treatment Profiles. Results of such an analysis could be used to evaluate costs of using in situ and other technologies for future projects involving the treatment of soil or water contaminated with MtBE and other fuel oxygenates. To provide context to this cost analysis, the paper also includes background information about the MtBE Treatment Profiles website, including an overview of the web site
221

functionality and summaries of project information included in the database, including site locations, technologies employed, contaminants treated, and treatment system performance. OVERVIEW OF THE WEBSITE The MtBE Treatment Profiles website is a searchable database of projects at sites treating MtBE and other oxygenates in drinking water, groundwater, or soil. The website contains project treatment profiles that include background information, cost and performance information, points of contact, and references, as shown in Exhibit 1. Exhibit 1: Types of Information in Treatment Profiles
Project Information • Site name, location, type, lithology, depth to groundwater • Contaminant(s) and media treated • Area of contamination • Technology design and operation, including the number of wells,
scale, vendor, period of operation, and status Cost and Performance Information
• Cleanup goals • Concentration data for MtBE, TBA, & BTEX (before and after
treatment) • Cost for remediation (capital, O&M, assessment, and monitoring)
Point of Contact • Contact information (name, title, affiliation, mailing address, phone, fax, and e-mail address)
References • Sources of information used to prepare profile The website allows users to search for treatment profiles and to submit new profiles or update existing profiles. New or updated profiles are submitted frequently. The site provides a search engine that allows a user to search the profiles by contaminant, media, technology, scale, status, state, site name, or by performing a keyword search. Alternately, a user may browse a list of all the profiles in the database. Through July 2003, the website has been visited more than 9,000 times, and, during these visits, the individual pages within the website have been accessed approximately 40,000 times. Each month, the website has been visited an average of more than 600 times. In addition to serving as a tool for identifying existing and completed cleanup projects, the website provides a portal to other environmental professionals and technology providers. Each profile provides information on point(s) of contact, allowing more detailed information about the profile to be acquired directly from those individuals involved with the site. EPA encourages regulators, remediation consultants, and technology vendors to add new treatment profiles to this site. To submit a new profile, a user selects the ‘Submit a New MtBE Treatment Profile’ button and enters the site information as prompted by selecting options from the drop down boxes where appropriate, and providing numerical or text data where drop down boxes are not provided. In an effort to keep the site profiles current and up-to-date, EPA also asks users to update site profiles whenever necessary. To update a profile, a user can select the ‘Update an MtBE Treatment Profile’ button and fill in the site information that has changed. For instance, a user may submit a site profile while it is still an on-going project, but may later update the profile information once the treatment project is complete and the site has reached closure. This functionality allows users to track current remediation projects at all stages of development. In summer 2003, EPA updated much of the information in the database, including cost information for 57 projects. To prepare the profiles, EPA obtained data from site managers, regulatory officials, and technology providers, as well as from published reports, conference proceedings, and other available reference materials. Consequently, each profile has a varying level of detail, depending on the data and information that was available. In addition, some of the profiles include active links to more detailed case studies, which present in-depth information about the treatment sites. No additional testing of technologies was performed during the preparation of the treatment profiles and no independent review was performed for the data provided by project managers and technology vendors. The profiles contained in the database do not represent all projects treating
222
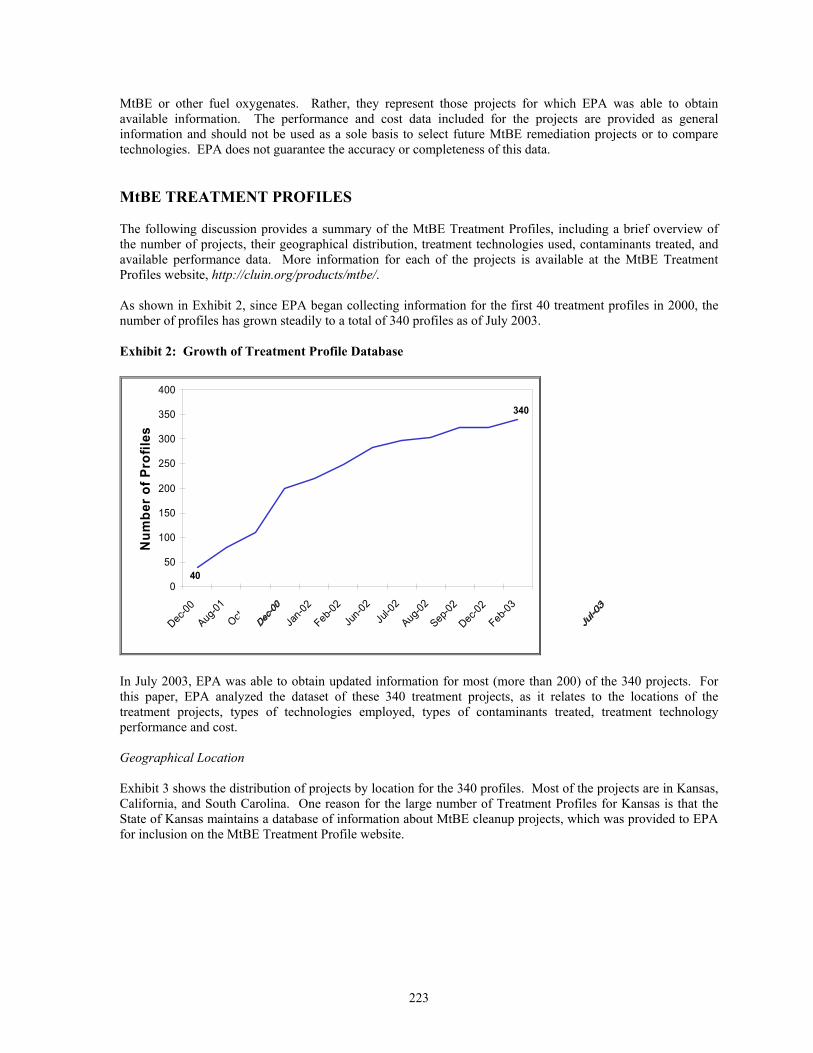
MtBE or other fuel oxygenates. Rather, they represent those projects for which EPA was able to obtain available information. The performance and cost data included for the projects are provided as general information and should not be used as a sole basis to select future MtBE remediation projects or to compare technologies. EPA does not guarantee the accuracy or completeness of this data. MtBE TREATMENT PROFILES The following discussion provides a summary of the MtBE Treatment Profiles, including a brief overview of the number of projects, their geographical distribution, treatment technologies used, contaminants treated, and available performance data. More information for each of the projects is available at the MtBE Treatment Profiles website, http://cluin.org/products/mtbe/. As shown in Exhibit 2, since EPA began collecting information for the first 40 treatment profiles in 2000, the number of profiles has grown steadily to a total of 340 profiles as of July 2003. Exhibit 2: Growth of Treatment Profile Database
40
340
0
50
100
150
200
250
300
350
400
Dec-00
Aug-01
Oct-01
Dec-01
Jan-0
2
Feb-02
Jun-0
2Ju
l-02
Aug-02
Sep-02
Dec-02
Feb-03
Num
ber
of P
rofil
es
In July 2003, EPA was able to obtain updated information for most (more than 200) of the 340 projects. For this paper, EPA analyzed the dataset of these 340 treatment projects, as it relates to the locations of the treatment projects, types of technologies employed, types of contaminants treated, treatment technology performance and cost. Geographical Location Exhibit 3 shows the distribution of projects by location for the 340 profiles. Most of the projects are in Kansas, California, and South Carolina. One reason for the large number of Treatment Profiles for Kansas is that the State of Kansas maintains a database of information about MtBE cleanup projects, which was provided to EPA for inclusion on the MtBE Treatment Profile website.
223

Exhibit 3: Geographical Distribution of 340 Projects in the Profile Database
NV6 Projects
All Other States 47 Projects Total
ME7 Projects
KS85 Projects
CA82 Projects
SC51 Projects
NY24 ProjectsMA
15 Projects
TX9 Projects
NJ14 Projects
Treatment Technologies Employed The 340 projects employed all of the technologies commonly used to treat MtBE and other oxygenates, including air sparging, bioremediation (in situ and ex situ), in situ chemical oxidation, pump-and-treat, MPE, SVE, phytoremediation, and thermal desorption. The projects included in the database focus on those using active treatment technologies to treat MtBE and other oxygenates. Therefore, it does not include projects that primarily employed non-active treatment remedies such as natural attenuation or institutional controls. In addition, the database generally does not include projects where the only remedial technology employed was a removal technology, such as excavation or product recovery. Exhibit 4 summarizes the technologies employed at the 104 completed and 233 ongoing projects. The projects included in the database used air sparging, pump-and-treat, and in situ bioremediation more frequently to remediate groundwater and soil contaminated with MtBE and in situ chemical oxidation, MPE, SVE, drinking water treatment, phytoremediation, and thermal desorption were used less frequently. Most (83%) of the 340 projects included in the database are full-scale; 14% are pilot-scale and 3% are bench-scale. Exhibit 4: Breakdown of Technologies for 340 Projects
Treatment Technologies Number of Projects Air Sparging 124 (36%) Pump-and-Treat 88 (26%) Bioremediation 79 (23%) Soil Vapor Extraction 43 (13%) In situ Chemical Oxidation 25 (7%) Drinking Water Treatment 15 (5%) Multi-Phase Extraction 14 (4%) Phytoremediation 8 (2%) Thermal Desorption 1 (<1%) Note: May be more than one technology per project
Contaminants Treated While the treatment profiles primarily focus on projects where MtBE was the contaminant treated, a number of these projects also provided information about other contaminants that were treated along with MtBE. Where this information about other contaminants was provided, it was included in the treatment profiles. As shown on
224
225
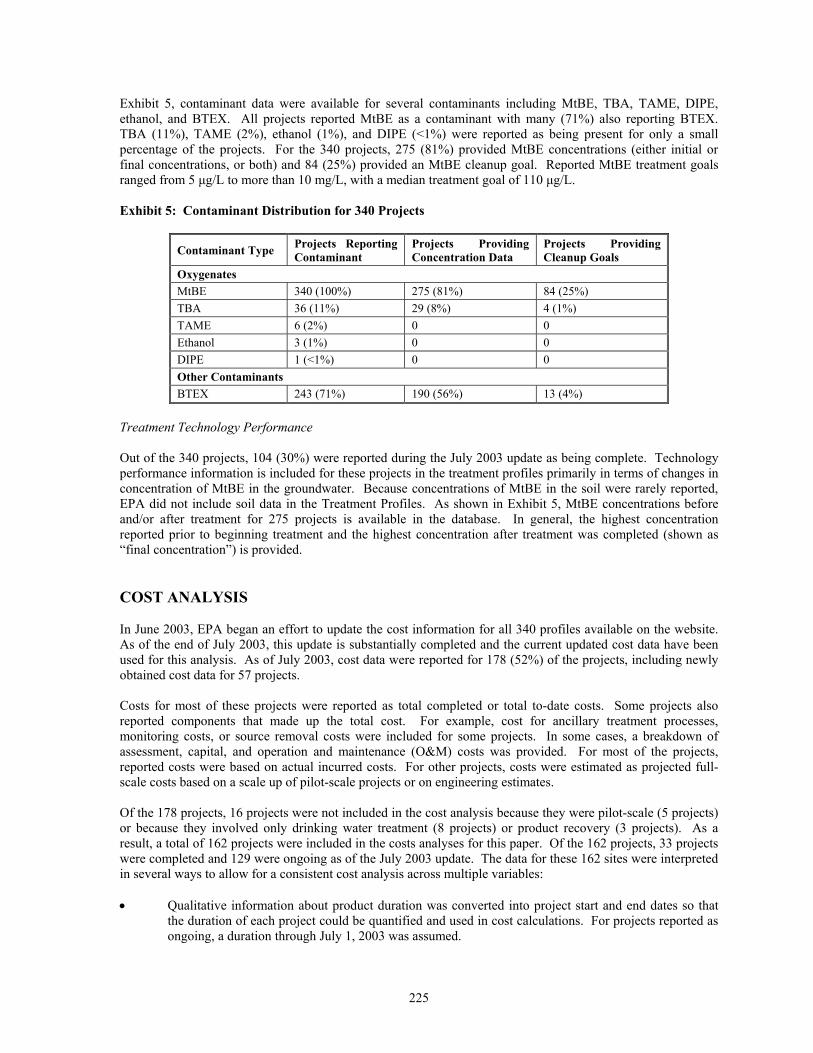
Exhibit 5, contaminant data were available for several contaminants including MtBE, TBA, TAME, DIPE, ethanol, and BTEX. All projects reported MtBE as a contaminant with many (71%) also reporting BTEX. TBA (11%), TAME (2%), ethanol (1%), and DIPE (<1%) were reported as being present for only a small percentage of the projects. For the 340 projects, 275 (81%) provided MtBE concentrations (either initial or final concentrations, or both) and 84 (25%) provided an MtBE cleanup goal. Reported MtBE treatment goals ranged from 5 µg/L to more than 10 mg/L, with a median treatment goal of 110 µg/L. Exhibit 5: Contaminant Distribution for 340 Projects
Contaminant Type Projects Reporting Contaminant
Projects Providing Concentration Data
Projects Providing Cleanup Goals
Oxygenates MtBE 340 (100%) 275 (81%) 84 (25%) TBA 36 (11%) 29 (8%) 4 (1%) TAME 6 (2%) 0 0 Ethanol 3 (1%) 0 0 DIPE 1 (<1%) 0 0 Other Contaminants BTEX 243 (71%) 190 (56%) 13 (4%)
Treatment Technology Performance Out of the 340 projects, 104 (30%) were reported during the July 2003 update as being complete. Technology performance information is included for these projects in the treatment profiles primarily in terms of changes in concentration of MtBE in the groundwater. Because concentrations of MtBE in the soil were rarely reported, EPA did not include soil data in the Treatment Profiles. As shown in Exhibit 5, MtBE concentrations before and/or after treatment for 275 projects is available in the database. In general, the highest concentration reported prior to beginning treatment and the highest concentration after treatment was completed (shown as “final concentration”) is provided. COST ANALYSIS In June 2003, EPA began an effort to update the cost information for all 340 profiles available on the website. As of the end of July 2003, this update is substantially completed and the current updated cost data have been used for this analysis. As of July 2003, cost data were reported for 178 (52%) of the projects, including newly obtained cost data for 57 projects. Costs for most of these projects were reported as total completed or total to-date costs. Some projects also reported components that made up the total cost. For example, cost for ancillary treatment processes, monitoring costs, or source removal costs were included for some projects. In some cases, a breakdown of assessment, capital, and operation and maintenance (O&M) costs was provided. For most of the projects, reported costs were based on actual incurred costs. For other projects, costs were estimated as projected full-scale costs based on a scale up of pilot-scale projects or on engineering estimates. Of the 178 projects, 16 projects were not included in the cost analysis because they were pilot-scale (5 projects) or because they involved only drinking water treatment (8 projects) or product recovery (3 projects). As a result, a total of 162 projects were included in the costs analyses for this paper. Of the 162 projects, 33 projects were completed and 129 were ongoing as of the July 2003 update. The data for these 162 sites were interpreted in several ways to allow for a consistent cost analysis across multiple variables: • Qualitative information about product duration was converted into project start and end dates so that
the duration of each project could be quantified and used in cost calculations. For projects reported as ongoing, a duration through July 1, 2003 was assumed.
226
• A “calculated total cost” was calculated for projects that provided capital and annual O&M costs by multiplying the annual O&M cost by the duration of the project and adding it to the capital cost.
• Qualitative information about the area treated was converted into square footage. For example, if a
100-foot by 100-foot treatment area was reported, a treatment area of 10,000 square feet was calculated. These types of data were available for 54 of the 178 projects (30%) reporting costs. A similar interpretation was done for in situ treatment volume. However, treatment volume data were available for only eight projects.
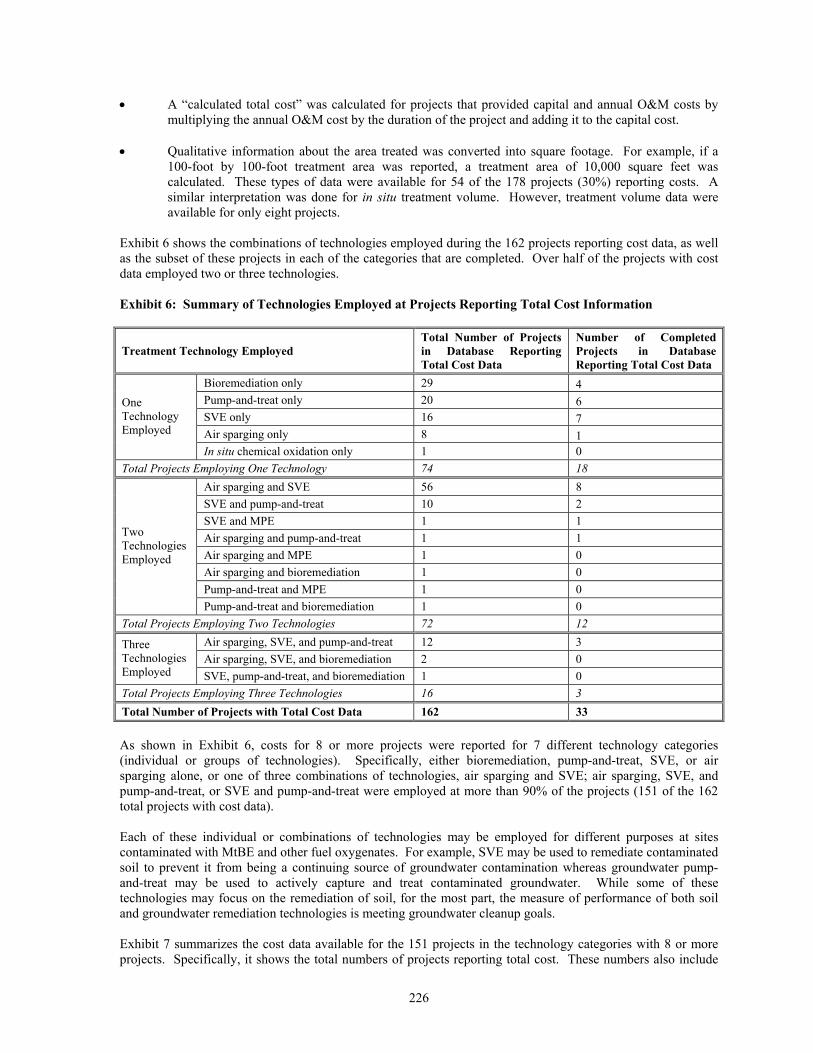
Exhibit 6 shows the combinations of technologies employed during the 162 projects reporting cost data, as well as the subset of these projects in each of the categories that are completed. Over half of the projects with cost data employed two or three technologies. Exhibit 6: Summary of Technologies Employed at Projects Reporting Total Cost Information
Treatment Technology Employed Total Number of Projects in Database Reporting Total Cost Data
Number of Completed Projects in Database Reporting Total Cost Data
Bioremediation only 29 4 Pump-and-treat only 20 6 SVE only 16 7 Air sparging only 8 1
One Technology Employed
In situ chemical oxidation only 1 0 Total Projects Employing One Technology 74 18
Air sparging and SVE 56 8 SVE and pump-and-treat 10 2 SVE and MPE 1 1 Air sparging and pump-and-treat 1 1 Air sparging and MPE 1 0 Air sparging and bioremediation 1 0 Pump-and-treat and MPE 1 0
Two Technologies Employed
Pump-and-treat and bioremediation 1 0 Total Projects Employing Two Technologies 72 12
Air sparging, SVE, and pump-and-treat 12 3 Air sparging, SVE, and bioremediation 2 0
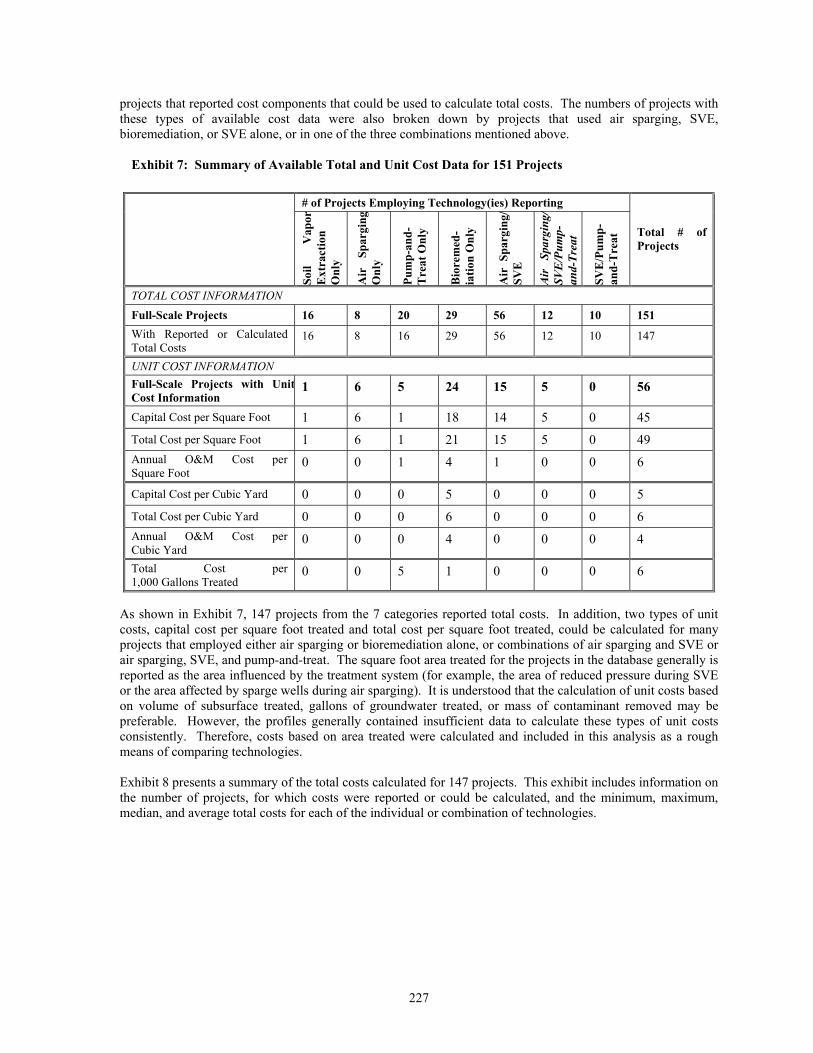
Three Technologies Employed SVE, pump-and-treat, and bioremediation 1 0 Total Projects Employing Three Technologies 16 3 Total Number of Projects with Total Cost Data 162 33 As shown in Exhibit 6, costs for 8 or more projects were reported for 7 different technology categories (individual or groups of technologies). Specifically, either bioremediation, pump-and-treat, SVE, or air sparging alone, or one of three combinations of technologies, air sparging and SVE; air sparging, SVE, and pump-and-treat, or SVE and pump-and-treat were employed at more than 90% of the projects (151 of the 162 total projects with cost data). Each of these individual or combinations of technologies may be employed for different purposes at sites contaminated with MtBE and other fuel oxygenates. For example, SVE may be used to remediate contaminated soil to prevent it from being a continuing source of groundwater contamination whereas groundwater pump-and-treat may be used to actively capture and treat contaminated groundwater. While some of these technologies may focus on the remediation of soil, for the most part, the measure of performance of both soil and groundwater remediation technologies is meeting groundwater cleanup goals. Exhibit 7 summarizes the cost data available for the 151 projects in the technology categories with 8 or more projects. Specifically, it shows the total numbers of projects reporting total cost. These numbers also include
227
projects that reported cost components that could be used to calculate total costs. The numbers of projects with these types of available cost data were also broken down by projects that used air sparging, SVE, bioremediation, or SVE alone, or in one of the three combinations mentioned above.
Exhibit 7: Summary of Available Total and Unit Cost Data for 151 Projects
# of Projects Employing Technology(ies) Reporting
Soil
Vap
orE
xtra
ctio
n O
nly
Air
Sp
argi
ngO
nly
Pum
p-an
d-T
reat
Onl
y
Bio
rem
ed-
iatio
n O
nly
Air
Spa
rgin
g/
SVE
Air
Sp
argi
ng/
SVE
/Pum
p-an
d-Tr
eat
SVE
/Pum
p-an
d-T
reat
Total # of Projects
TOTAL COST INFORMATION Full-Scale Projects 16 8 20 29 56 12 10 151 With Reported or Calculated Total Costs
16 8 16 29 56 12 10 147
UNIT COST INFORMATION Full-Scale Projects with UnitCost Information
1 6 5 24 15 5 0 56
Capital Cost per Square Foot 1 6 1 18 14 5 0 45 Total Cost per Square Foot 1 6 1 21 15 5 0 49 Annual O&M Cost per Square Foot
0 0 1 4 1 0 0 6
Capital Cost per Cubic Yard 0 0 0 5 0 0 0 5 Total Cost per Cubic Yard 0 0 0 6 0 0 0 6 Annual O&M Cost per Cubic Yard
0 0 0 4 0 0 0 4
Total Cost per 1,000 Gallons Treated
0 0 5 1 0 0 0 6
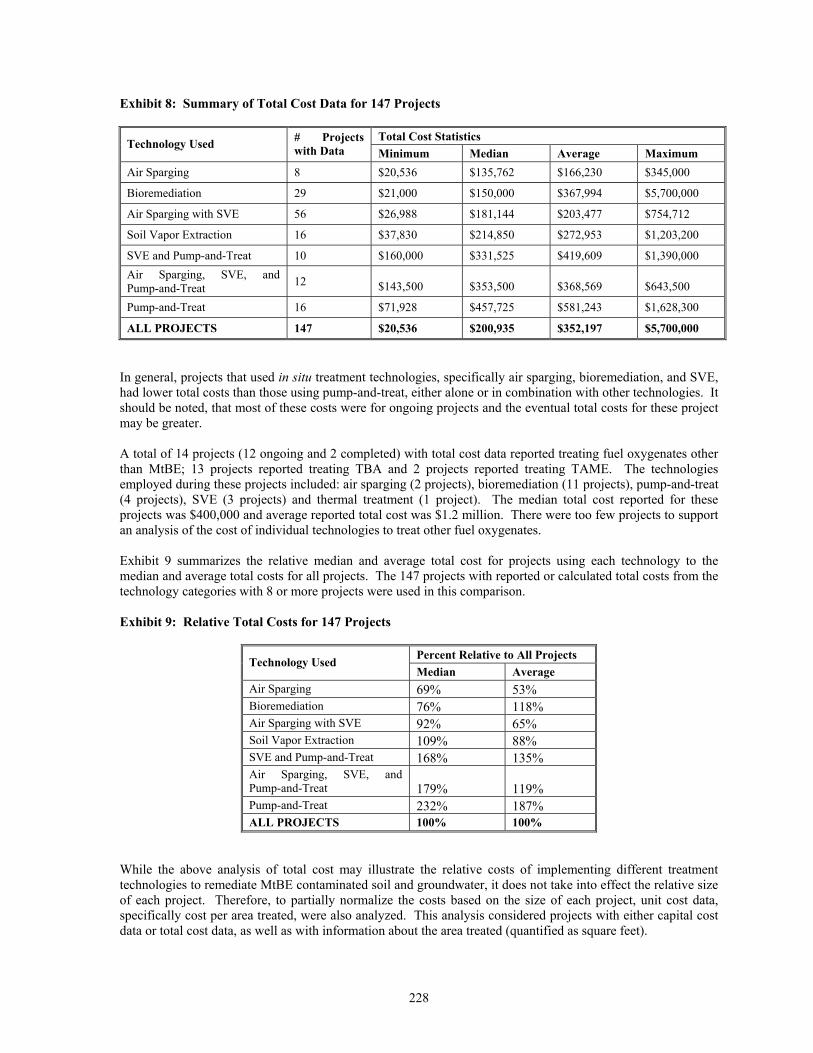
As shown in Exhibit 7, 147 projects from the 7 categories reported total costs. In addition, two types of unit costs, capital cost per square foot treated and total cost per square foot treated, could be calculated for many projects that employed either air sparging or bioremediation alone, or combinations of air sparging and SVE or air sparging, SVE, and pump-and-treat. The square foot area treated for the projects in the database generally is reported as the area influenced by the treatment system (for example, the area of reduced pressure during SVE or the area affected by sparge wells during air sparging). It is understood that the calculation of unit costs based on volume of subsurface treated, gallons of groundwater treated, or mass of contaminant removed may be preferable. However, the profiles generally contained insufficient data to calculate these types of unit costs consistently. Therefore, costs based on area treated were calculated and included in this analysis as a rough means of comparing technologies. Exhibit 8 presents a summary of the total costs calculated for 147 projects. This exhibit includes information on the number of projects, for which costs were reported or could be calculated, and the minimum, maximum, median, and average total costs for each of the individual or combination of technologies.
228
Exhibit 8: Summary of Total Cost Data for 147 Projects
Total Cost Statistics Technology Used # Projects with Data Minimum Median Average Maximum
Air Sparging 8 $20,536 $135,762 $166,230 $345,000
Bioremediation 29 $21,000 $150,000 $367,994 $5,700,000
Air Sparging with SVE 56 $26,988 $181,144 $203,477 $754,712
Soil Vapor Extraction 16 $37,830 $214,850 $272,953 $1,203,200
SVE and Pump-and-Treat 10 $160,000 $331,525 $419,609 $1,390,000 Air Sparging, SVE, and Pump-and-Treat 12 $143,500 $353,500 $368,569 $643,500
Pump-and-Treat 16 $71,928 $457,725 $581,243 $1,628,300
ALL PROJECTS 147 $20,536 $200,935 $352,197 $5,700,000
In general, projects that used in situ treatment technologies, specifically air sparging, bioremediation, and SVE, had lower total costs than those using pump-and-treat, either alone or in combination with other technologies. It should be noted, that most of these costs were for ongoing projects and the eventual total costs for these project may be greater. A total of 14 projects (12 ongoing and 2 completed) with total cost data reported treating fuel oxygenates other than MtBE; 13 projects reported treating TBA and 2 projects reported treating TAME. The technologies employed during these projects included: air sparging (2 projects), bioremediation (11 projects), pump-and-treat (4 projects), SVE (3 projects) and thermal treatment (1 project). The median total cost reported for these projects was $400,000 and average reported total cost was $1.2 million. There were too few projects to support an analysis of the cost of individual technologies to treat other fuel oxygenates. Exhibit 9 summarizes the relative median and average total cost for projects using each technology to the median and average total costs for all projects. The 147 projects with reported or calculated total costs from the technology categories with 8 or more projects were used in this comparison. Exhibit 9: Relative Total Costs for 147 Projects
Percent Relative to All Projects Technology Used Median Average
Air Sparging 69% 53% Bioremediation 76% 118% Air Sparging with SVE 92% 65% Soil Vapor Extraction 109% 88% SVE and Pump-and-Treat 168% 135% Air Sparging, SVE, and Pump-and-Treat 179% 119% Pump-and-Treat 232% 187% ALL PROJECTS 100% 100%
While the above analysis of total cost may illustrate the relative costs of implementing different treatment technologies to remediate MtBE contaminated soil and groundwater, it does not take into effect the relative size of each project. Therefore, to partially normalize the costs based on the size of each project, unit cost data, specifically cost per area treated, were also analyzed. This analysis considered projects with either capital cost data or total cost data, as well as with information about the area treated (quantified as square feet).

229
Exhibit 10 summarizes the unit costs that were calculated for 43 projects based on capital cost data and 47 sites based on total cost data. This summary includes the technology categories with unit cost data for five or more projects. Exhibit 10: Summary of Unit Cost Data for All Projects
Capital Cost per Square Foot Treated Technology Used # Projects Minimum Median Average Maximum
Bioremediation 18 $0.53 $2.80 $5.80 $29.21 Air Sparging with SVE 14 $0.90 $3.05 $3.91 $13.33 Air Sparging 6 $1.64 $4.19 $4.68 $8.64 Air Sparging, SVE, and Pump-and-Treat
5 $1.97 $10.66 $8.70 $11.52
ALL PROJECTS 43 $0.53 $3.45 $5.29 $29.21 Total Cost per Square Foot Treated
Technology Used # Projects Minimum Median Average Maximum
Air Sparging with SVE 15 $0.90 $2.56 $4.00 $13.33 Air Sparging 6 $1.64 $4.19 $4.68 $8.64 Bioremediation 21 $0.53 $5.71 $11.88 $71.93 Air Sparging, SVE, and Pump-and-Treat
5 $1.97 $11.33 $10.18 $16.09
ALL PROJECTS 47 $0.53 $3.98 $8.26 $71.93 As shown in Exhibit 10, there are fewer data points for this unit cost analysis than the total cost analysis. However, after normalizing for area treated, this unit costs analysis shows that in situ treatment approaches are generally less costly than pump-and-treat for remediating MtBE at the sites in the dataset. The unit cost of the projects employing pump-and-treat more than twice that of in situ remedies. As stated above, there were insufficient data to calculate unit cost based on volume treated for the projects. Many other factors related to site setting, hydrogeology, and remedial goals may affect the cost of treatment. Sufficient data were not available to analyze the potential cost impacts of these factors. However, these analyses may become viable as more data are obtained. CONCLUSION The analysis presented in this paper provides an overview of the cost to treat oxygenates based on data from 162 projects with information available at EPA’s MtBE Treatment Profiles website, located at http://cluin.org/products/mtbe/. Most of the projects (151 of the 162 projects with cost data) employed bioremediation, pump-and-treat, SVE, or air sparging alone, or one of three combinations of technologies, air sparging and SVE; air sparging, SVE, and pump-and-treat; or SVE and pump-and-treat. The cost analyses in this paper show that, overall, in situ technologies are less costly to implement than pump-and-treat. Both total costs and unit costs based on area treated for projects employing pump and treat either alone or in combination with other technologies were upwards of twice that of projects employing only in situ technologies. It should be noted that most of the costs included in this analysis were for ongoing projects (129 of 162 projects). Therefore, the total costs for many of the projects may eventually be greater that what is currently reported in the Treatment Profiles. In general, there was a limited amount of data available about the cost of treating fuel oxygenates in addition to MtBE. However, based on limited data, this comparison suggest that systems designed to treat other fuel oxygenates in addition to MtBE may be more costly than those that treat only MtBE. EPA continues to increase the cost and other information available on the website, both by adding new profiles and by expanding the data fields for new and existing profiles. EPA also has added fields to the database to
230
capture concentration data for fuel oxygenates beyond MtBE and TBA. The database now can also include concentration data for TAME, DIPE, BTEX, ethyl tertiary-butyl ether (ETBE), tertiary amyl ethyl ether (TAEE), tertiary-amyl alcohol (TAA), ethanol, and methanol. As the amount of available cost data related to the treatment of MtBE and other oxygenates grows, cost sensitivity analyses, similar to those presented in EPA’s Remediation Technology Cost Compendium – Year 2000 (EPA 2000) for other remedial technologies and contaminant types may be able to be completed. The results of such analyses may provide further information useful to professionals engaged with sites contaminated with MtBE and other fuel oxygenates. OTHER RESOURCES Some additional EPA resources about MtBE and other oxygenates are listed below. • EPA’s MtBE Web Page – Provides a list of Frequently Asked Questions that provide basic
background information on MtBE, as well as links to other websites. Available at http://www.epa.gov/mtbe
• EPA’s Office of Underground Storage Tanks MtBE Web Page – Provides general information
about MtBE and USTs. Available at http://www.epa.gov/swerust1/mtbe/ • Clu-In – A website that provides information about innovative treatment and site characterization
technologies while acting as a forum for all waste remediation stakeholders. Available on line at http://www.cluin.org
• TechDirect – Hosted by the U.S. EPA's Technology Innovation Office, TechDirect is a monthly e-
mail that highlights new publications and events of interest to site remediation and site assessment professionals. Sign up on line at http://www.cluin.org/newsletters/
• Technology News and Trends – A newsletter about soil, sediment, and groundwater characterization
and remediation technologies Available on line at http://www.clu-in.org/products/newsltrs/tnandt/. REFERENCES Blue Ribbon Panel on Oxygenates in Gasoline, 1999, Achieving Clean Air and Clean Water: The Report of the Blue Ribbon Panel on Oxygenates in Gasoline: EPA 420-R-99-021. http://www.epa.gov/oms/consumer/fuels/oxypanel/blueribb.htm. EPA, 2003, UST Program Facts: Office of Solid Waste and Emergency Response. http://www.epa.gov/oust/pubs/ustprogramfacts.pdf EPA, 2003a, MtBE Treatment Profiles: http://cluin.org/products/mtbe. EPA, 2001, Remediation Technology Cost Compendium – Year 2000 (EPA-542-R-01-009): Office of Solid Waste and Emergency Response. September. http://clu-in.org/download/remed/542r01009.pdf U.S. General Accounting Office (GAO), 2002, Testimony Before the Subcommittee on Environment and Hazardous Materials, Committee on Energy and Commerce, House of Representatives, ENVIRONMENTAL PROTECTION, MTBE Contamination From Underground Storage Tanks: GAO-02-753. http://www.gao.gov/new.items/d02753t.pdf