cost of governance. 2 credibility a. pfm out-turns comprehensiveness transparency b. key...
TRANSCRIPT
Cost of Governance
2
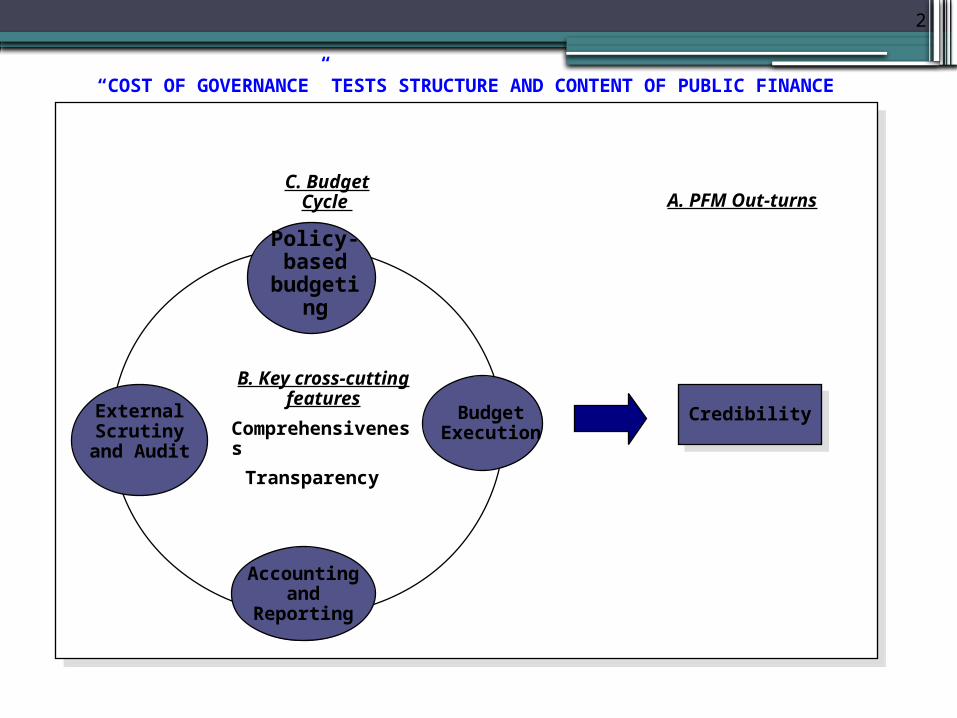
CredibilityCredibility
A. PFM Out-turns
Comprehensiveness
Transparency
B. Key cross-cutting features
External Scrutiny and
Audit
Accounting and
Reporting
Budget Execution
Policy-based
budgeting
C. Budget Cycle
“COST OF GOVERNANCE” TESTS STRUCTURE AND CONTENT OF PUBLIC FINANCE
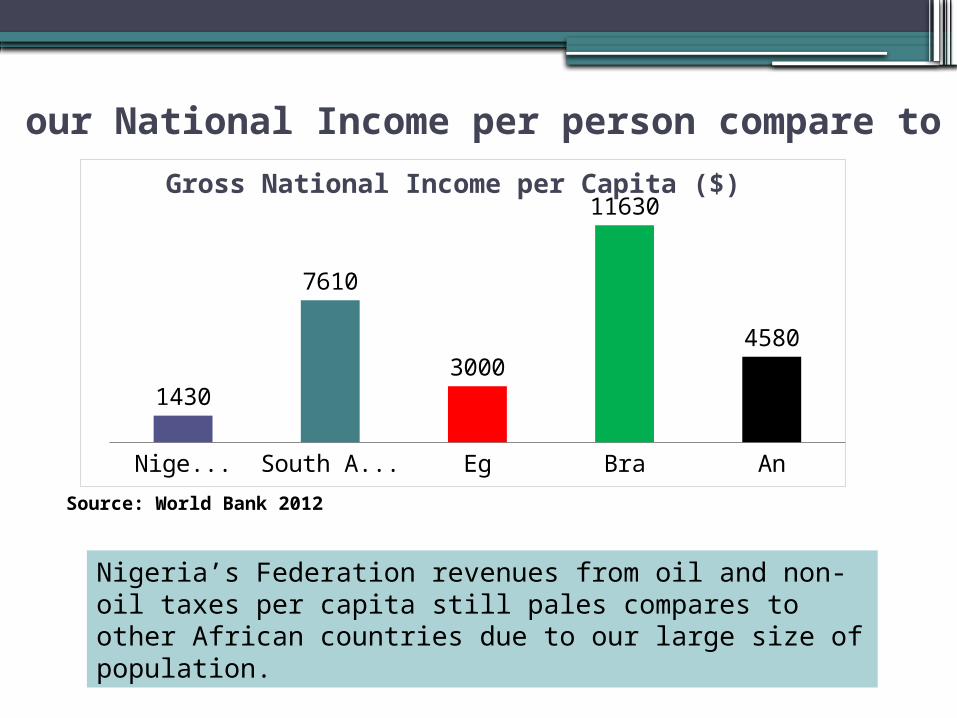
Gross National Income per Capita ($)
Nigeria South Africa Egypt Brazil Angola
1430
7610
3000
11630
4580
Source: World Bank 2012
Nigeria’s Federation revenues from oil and non-oil taxes per capita still pales compares to other African countries due to our large size of population.
How does our National Income per person compare to others?

Singa
pore
South
Kor
ea
Malay
sia
Brazil
Chile
Nig
eria
50,000
22,000
10,00013,000 14,000
1,500
Nigeria Poverty Figures (m)
“Our own paltry $1,500 income per capita helps drive home the point that we have been left behind many times over by every one of those other countries…. How did these nations steer and stir their people to achieve such economic performance over the last five years? ”
1980 1985 1992 1996 2004 2010
17.1
34.5 39.2
67.1 68.4
112.47
“ The Nigeria is a paradox of the kind of wealth the breeds penury is widely known as the fact that the world considers us a poster nation for poor governance wealth from natural resources”.
“What happened to Nigeria? Why did we get left behind? Why did we get left behind? How did these nations become productively wealth over the last fifty years while Nigeria stagnated”
Income per capita , 2011 ($)
Understanding The Context
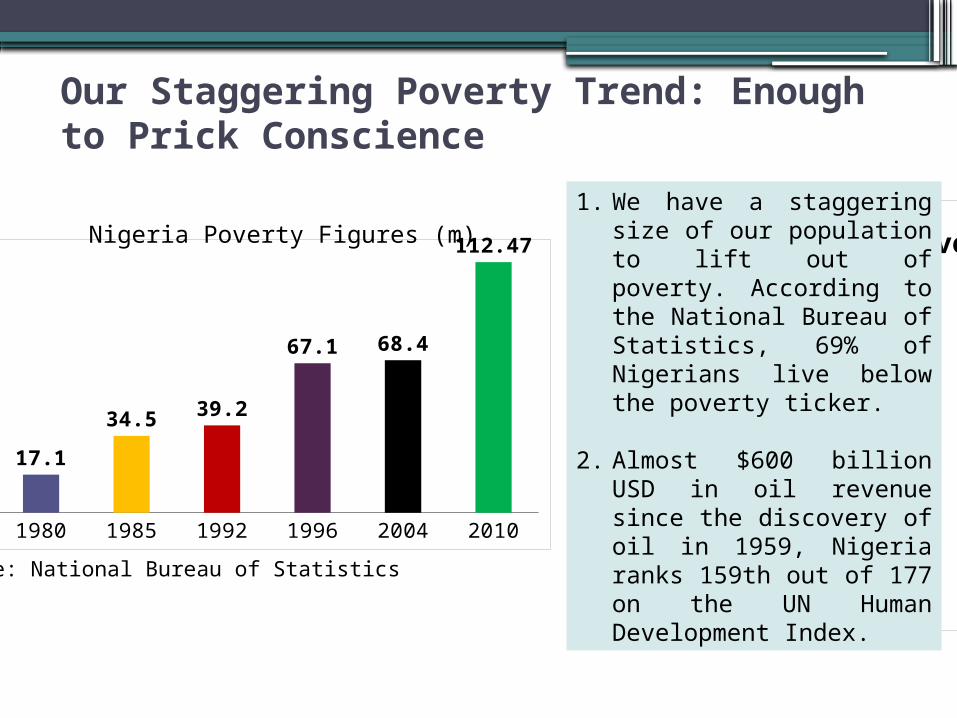
Our Staggering Poverty Trend: Enough to Prick Conscience
Poverty Rate (%) 1. We have a staggering size of our
population to lift out of poverty. According to the National Bureau of Statistics, 69% of Nigerians live below the poverty ticker.
2. Almost $600 billion USD in oil revenue since the discovery of oil in 1959, Nigeria ranks 159th out of 177 on the UN Human Development Index.
Source: National Bureau of Statistics
1980 1985 1992 1996 2004 2010
17.1
34.5 39.2
67.1 68.4
112.47Nigeria Poverty Figures (m)
NiSin
Sou ChM
al Br
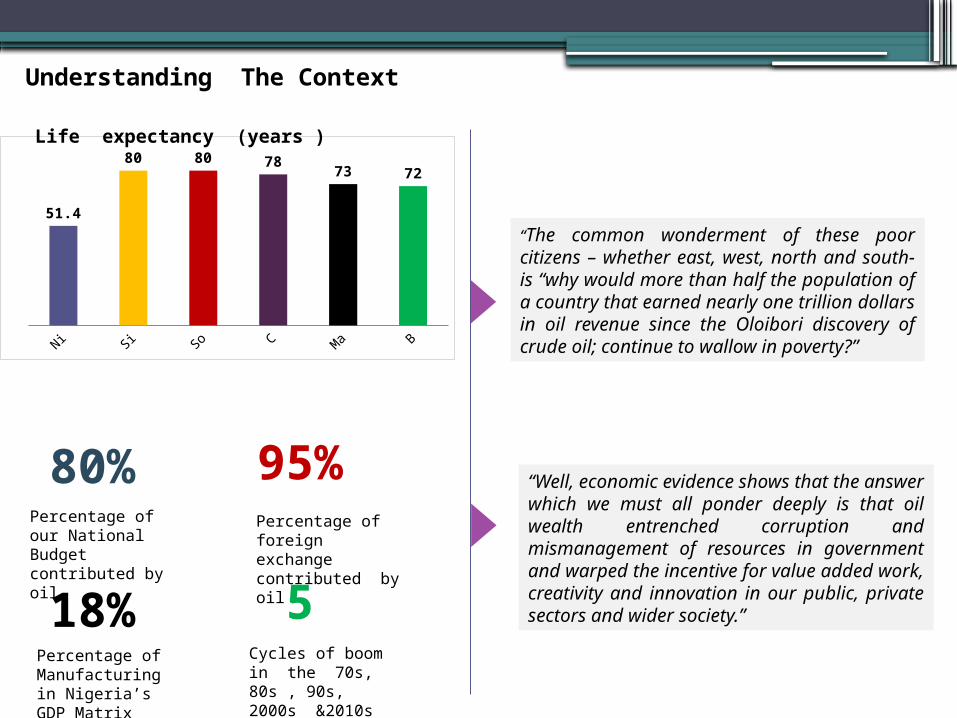
51.4
80 80 7873 72
Life expectancy (years )
Understanding The Context
80% 95%
18%
Percentage of our National Budget contributed by oil
Percentage of foreign exchange contributed by oil
Percentage of Manufacturing in Nigeria’s GDP Matrix
5 Cycles of boom in the 70s, 80s , 90s, 2000s &2010s
“The common wonderment of these poor citizens – whether east, west, north and south- is “why would more than half the population of a country that earned nearly one trillion dollars in oil revenue since the Oloibori discovery of crude oil; continue to wallow in poverty?”
“Well, economic evidence shows that the answer which we must all ponder deeply is that oil wealth entrenched corruption and mismanagement of resources in government and warped the incentive for value added work, creativity and innovation in our public, private sectors and wider society.”
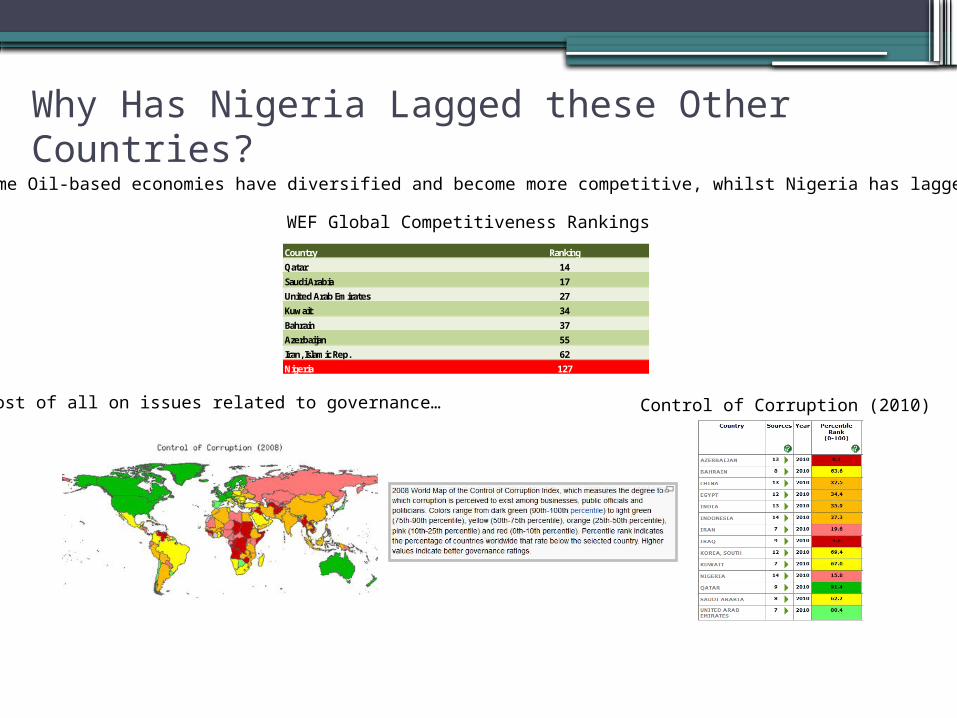
Why Has Nigeria Lagged these Other Countries?Even some Oil-based economies have diversified and become more competitive, whilst Nigeria has lagged…
Country Ranking
Qatar 14
Saudi Arabia 17
United Arab Emirates 27
Kuwait 34
Bahrain 37
Azerbaijan 55
Iran, Islamic Rep. 62
Nigeria 127
WEF Global Competitiveness Rankings
Most of all on issues related to governance… Control of Corruption (2010)
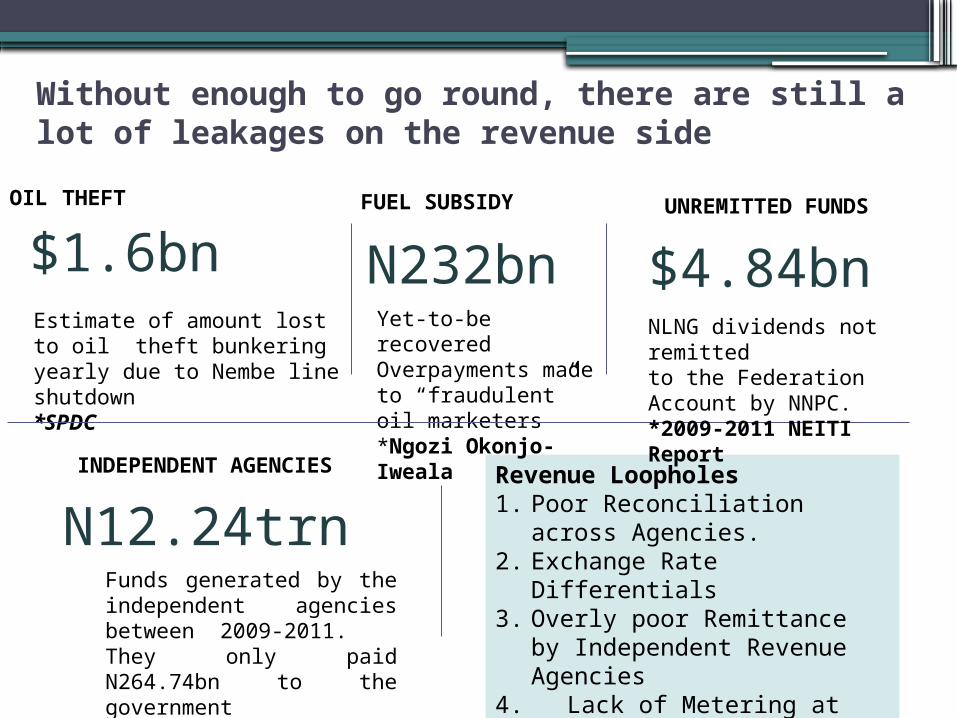
Without enough to go round, there are still a lot of leakages on the revenue side
Estimate of amount lost to oil theft bunkering yearly due to Nembe line shutdown *SPDC
Revenue Loopholes 1. Poor Reconciliation across Agencies.2. Exchange Rate Differentials 3. Overly poor Remittance by Independent
Revenue Agencies 4. Lack of Metering at Oil Terminals
N232bnYet-to-be recovered Overpayments made to “fraudulent” oil marketers*Ngozi Okonjo-Iweala
$1.6bnOIL THEFT
$4.84bnFUEL SUBSIDY
NLNG dividends not remitted to the Federation Account by NNPC.*2009-2011 NEITI Report
UNREMITTED FUNDS
N12.24trn Funds generated by the independent agencies between 2009-2011. They only paid N264.74bn to the government*NABRO
INDEPENDENT AGENCIES
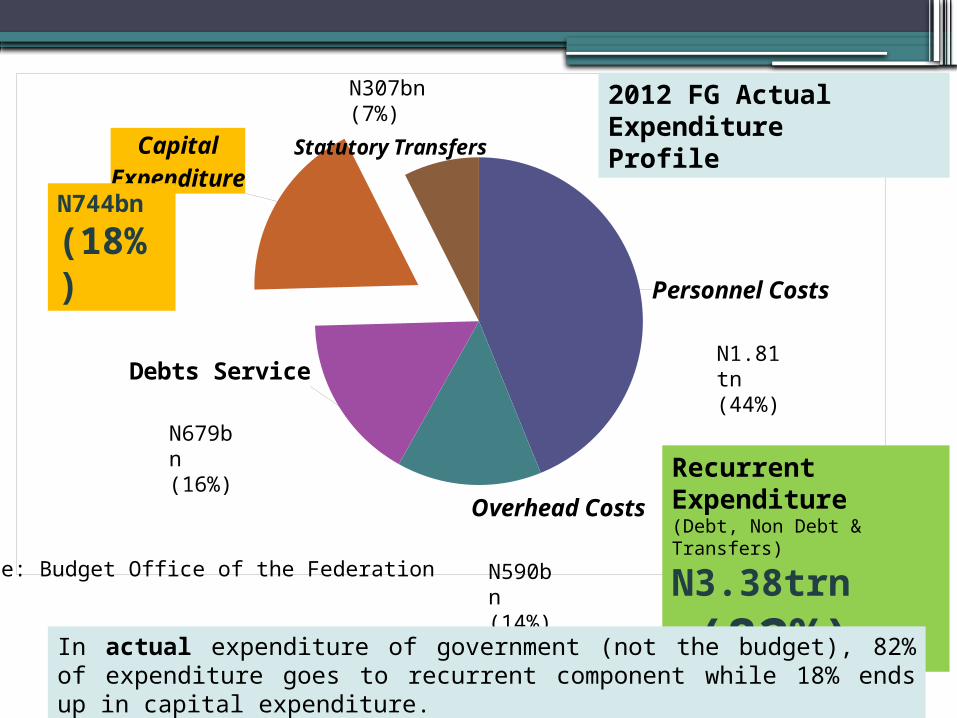
Personnel Costs
Overhead Costs
Debts Service
Capital Ex-penditure
Statutory Transfers
N1.81tn (44%)
N590bn (14%)
N679bn (16%)
N307bn (7%)
N744bn
(18%)
2012 FG Actual Expenditure Profile
Source: Budget Office of the Federation
Recurrent Expenditure(Debt, Non Debt & Transfers)
N3.38trn
(82%)In actual expenditure of government (not the budget), 82% of expenditure goes to recurrent component while 18% ends up in capital expenditure.
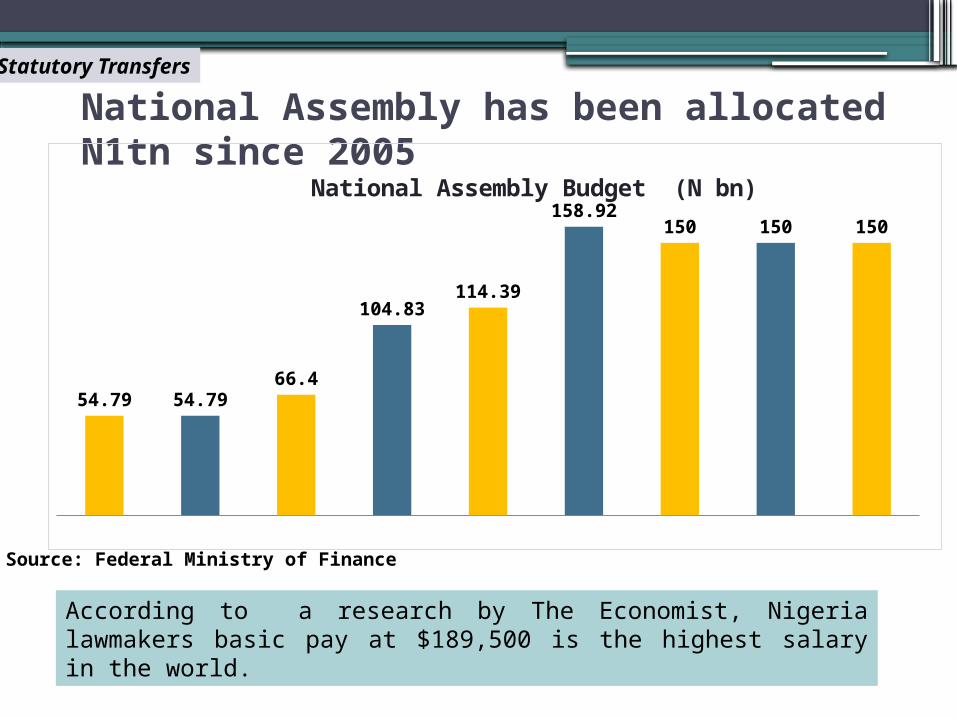
National Assembly has been allocated N1tn since 2005
2005 2006 2007 2008 2009 2010 2011 2012 2013
54.79 54.7966.4
104.83114.39
158.92150 150 150
National Assembly Budget (N bn)
Source: Federal Ministry of Finance
According to a research by The Economist, Nigeria lawmakers basic pay at $189,500 is the highest salary in the world.
Statutory Transfers
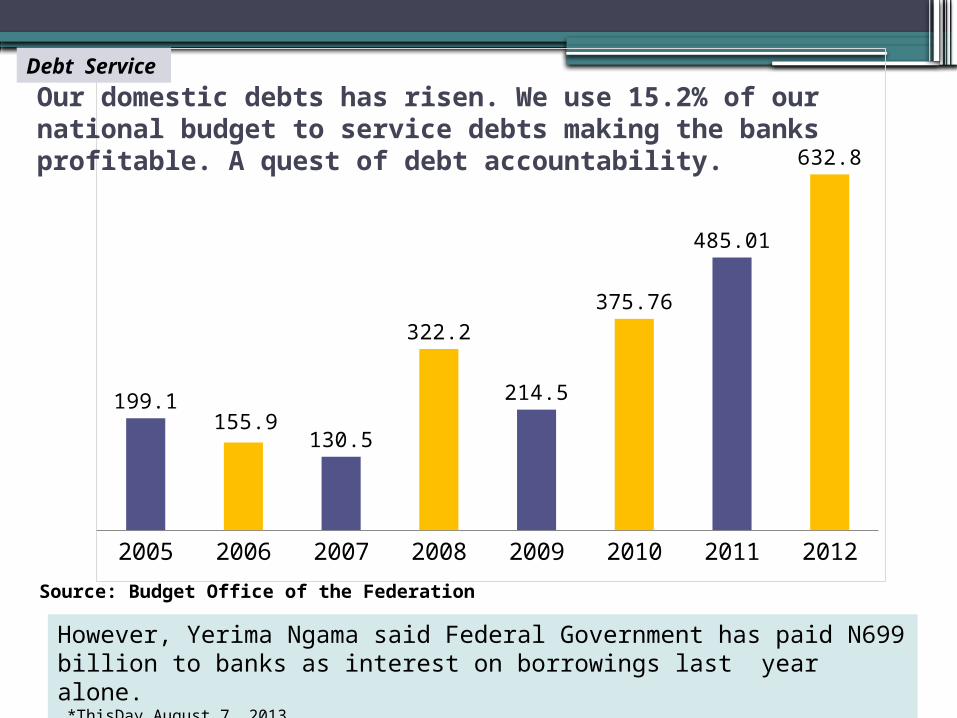
2005 2006 2007 2008 2009 2010 2011 2012
199.1155.9
130.5
322.2
214.5
375.76
485.01
632.8
Our domestic debts has risen. We use 15.2% of our national budget to service debts making the banks profitable. A quest of debt accountability.
However, Yerima Ngama said Federal Government has paid N699 billion to banks as interest on borrowings last year alone. *ThisDay August 7, 2013
Source: Budget Office of the Federation
Debt Service
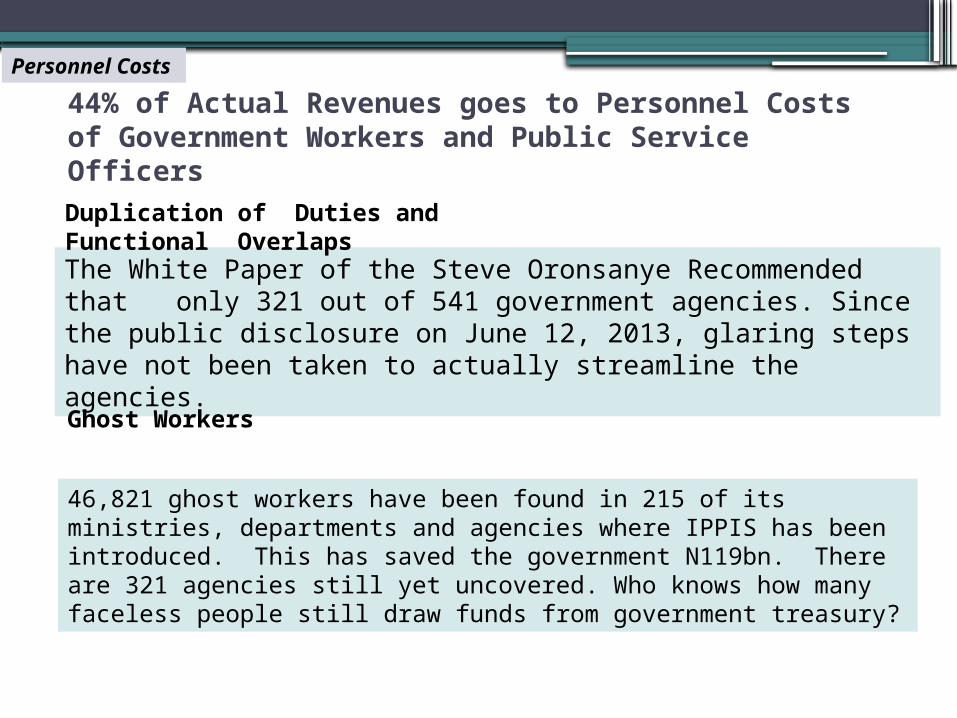
44% of Actual Revenues goes to Personnel Costs of Government Workers and Public Service Officers
The White Paper of the Steve Oronsanye Recommended that only 321 out of 541 government agencies. Since the public disclosure on June 12, 2013, glaring steps have not been taken to actually streamline the agencies.
Duplication of Duties and Functional Overlaps
Ghost Workers
46,821 ghost workers have been found in 215 of its ministries, departments and agencies where IPPIS has been introduced. This has saved the government N119bn. There are 321 agencies still yet uncovered. Who knows how many faceless people still draw funds from government treasury?
Personnel Costs
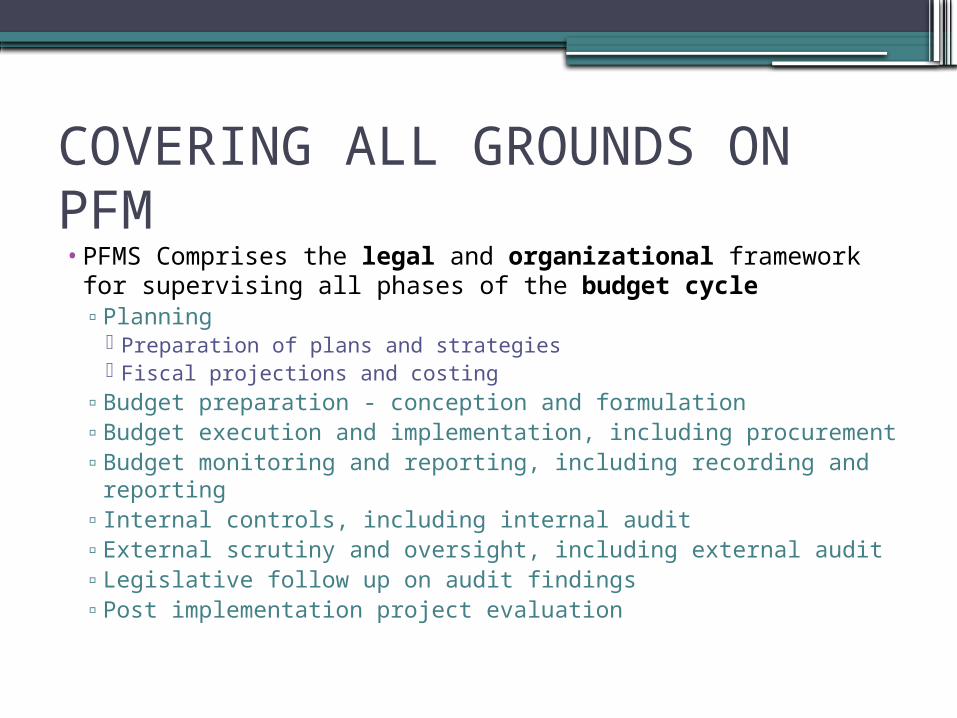
COVERING ALL GROUNDS ON PFM• PFMS Comprises the legal and organizational
framework for supervising all phases of the budget cycle▫ Planning
Preparation of plans and strategies Fiscal projections and costing
▫ Budget preparation - conception and formulation▫ Budget execution and implementation, including
procurement▫ Budget monitoring and reporting, including recording and
reporting▫ Internal controls, including internal audit▫ External scrutiny and oversight, including external audit ▫ Legislative follow up on audit findings▫ Post implementation project evaluation
Objectives & Relevance of PFM
•Supports responsible management to promote availability of benefits to the greatest number of citizens possible
•Supports good governance•Facilitate attainment of the 3 budgetary
goals of ▫Aggregate fiscal discipline▫Effective allocation of resource allocation
to priorities ▫Efficient service delivery services

15
Comprehensive fiscal risk oversight :
Is oversight of fiscal risk arising from public
enterprises and sub-national governments adequate?
Comprehensive fiscal risk oversight :
Is oversight of fiscal risk arising from public
enterprises and sub-national governments adequate?
Information:Is adequate fiscal, revenue and expenditure
information produced and disseminated to meet decision-making and management purposes?
Information:Is adequate fiscal, revenue and expenditure
information produced and disseminated to meet decision-making and management purposes?
Comprehensive, Policy-based, budget:
Does the budget capture all relevant fiscal
transactions, and is the process and composition
giving regard to government policy for benefit of the poor in
particular?
Comprehensive, Policy-based, budget:
Does the budget capture all relevant fiscal
transactions, and is the process and composition
giving regard to government policy for benefit of the poor in
particular?
Budget Realism:Is the budget realistic, and
implemented as intended in a
predictable manner?
Budget Realism:Is the budget realistic, and
implemented as intended in a
predictable manner?
Control :Is effective control and stewardship exercised
in the use of public funds?
Control :Is effective control and stewardship exercised
in the use of public funds?
The questions the PFM performance indicators seek to answer
Accountability and Transparency :
Are effective external financial accountability
and transparency arrangements in place?
Accountability and Transparency :
Are effective external financial accountability
and transparency arrangements in place?
MEASURING WHAT PERFORMANCE?
Six core objectives
of PFM system
SO WHAT CAN WE DO AS EFFECTIVE CITIZENS OF NIGERIA?• Set and monitor the benchmark of what levels of
performance/results we expect from governance and hold everyone involved accountable.
• Build a system of massive link up of budget analysis to “everyday citizen’s need to know” profile.
• Sustain the scrutiny on how resources are allocated and spent across the arms and levels of government.
• Link demand for governance Results to all other advocacies especially political and electoral reforms.
• Demand that government hosts a stakeholders mini national debate on Oronsanye’s report with cost/benefit presentation on all recommendations.
• Pick an “Anchor Citizens' Demand” from this Conference– “Fix Education Now”!
STRUCTURAL TRANSFORMATION IS THE ANTIDOTE TO OUR OIL ECONOMY
ENTRAPMENT.
•HUMAN DEVELOPMENT•PHYSICAL INFRASTRUCTURE•RULES-RESPECTING SOCIETY
•POLICIES•INSTITUTIONS•INVESTMENTS (The sad story of our
Public Budgets)
YET OUR EDUCATION IS PRESENTLY OUR WEAKEST LINK
The result of the diagnostics that we produced on the state of our education system and sector was so heart wrenching that I was filled with angst at how low we had sunk educationally. Deciding to channel the angst positively, we built a strong team that articulated some three hundred and sixty eight ‘root and branch’ reforms measures across the six levels and aspects of education
THE AMARTYA SEN COUNSEL (1)•Why is China ahead of India?
One answer is that India has paid inadequate attention to the lessons of Asian economic development, which gives a crucial role to the rapid expansion of human capability as a part of pursuing fast economic growth.
THE AMARTYA SEN COUNSEL(2)
•A critical part of the Human Capability for Economic Growth Strategy is “the use of public revenue, itself expanded by economic growth, to remove huge deficiencies in social, educational and health services……….”
THE AMARTYA SEN COUNSEL(3)
•Finally, a critical part of the Human Capability for Economic Growth Strategy is “to meet the growing demands of social and physical infrastructure, while making public services more accountable and efficiently organized”.

THE AMARTYA SEN COUNSEL (4)•You should not dig holes and fill them up,
you should build schools!• You can't skip public health care &
education to focus on growth. That's main lesson for India to learn! (Even more so a lesson for Nigeria to learn!!)
AVERAGE GDP GROWTH RATE OF 7% OVER A DECADE-OVER 24% UNEMPLOYMENT RATE AND ABOUT 40% UNEMPLOYMENT
RATE AMONG THE YOUTHFUL POPULATION
ECONOMIC GROWTH- JOBLESSNESS DICHOTOMY
IS ALL ABOUT
INEQUALITY OF OPPORTUNITIES CREATED BY A FAILED EDUCATION
SYSTEM!!!
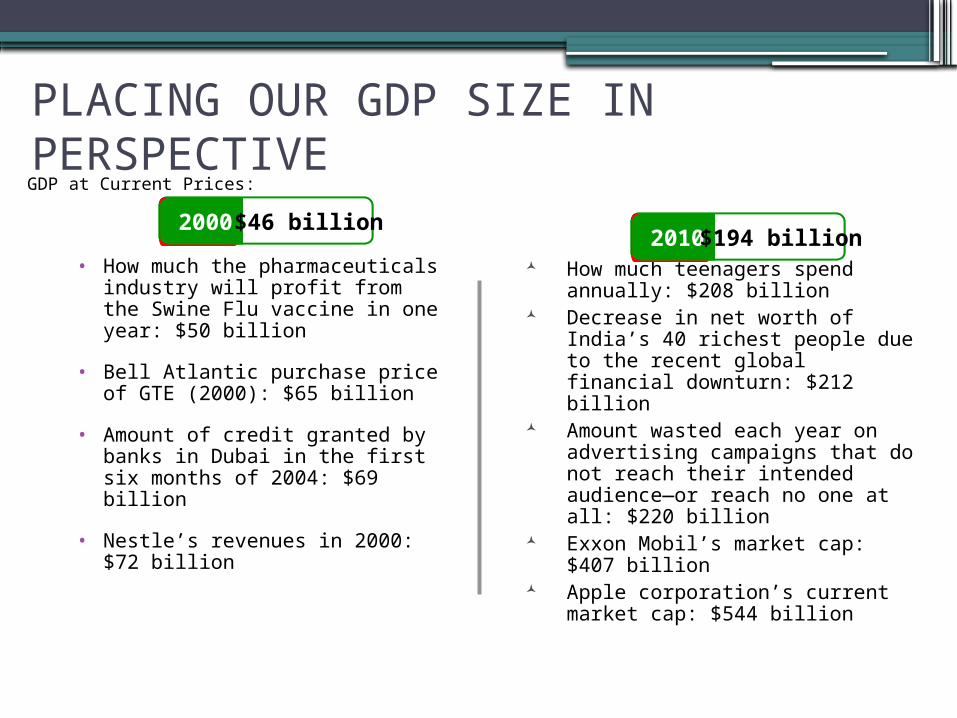
• How much the pharmaceuticals industry will profit from the Swine Flu vaccine in one year: $50 billion
• Bell Atlantic purchase price of GTE (2000): $65 billion
• Amount of credit granted by banks in Dubai in the first six months of 2004: $69 billion
• Nestle’s revenues in 2000: $72 billion
PLACING OUR GDP SIZE IN PERSPECTIVE
How much teenagers spend annually: $208 billion
Decrease in net worth of India’s 40 richest people due to the recent global financial downturn: $212 billion
Amount wasted each year on advertising campaigns that do not reach their intended audience—or reach no one at all: $220 billion
Exxon Mobil’s market cap: $407 billion Apple corporation’s current market cap:
$544 billion
GDP at Current Prices:
2000 $46 billion2010 $194 billion