cost estimate for stabilization of class f fly ash for...
TRANSCRIPT

Cost Estimate for Stabilization of Class F Fly Ash for Mine Restoration
June 2010
DNR-12-392012-559 PPRP-157

COST ESTIMATE FOR STABILIZATION OF CLASS F FLY
ASH FOR MINE RESTORATION
PREPARED FOR:
POWER PLANT RESEARCH PROGRAM MARYLAND DEPARTMENT OF NATURAL RESOURCES
PREPARED BY:
LEONARD RAFALKO JOSEPH GIACINTO
June 2010

PPRP PPRP/ FLY ASH STABILIZATION/JUNE 2010
i
TABLE OF CONTENTS
FOREWORD ii
PAUL PETZRICK ii
ABSTRACT iii
1.0 INTRODUCTION 1
1.1 STABILIZATION TECHNOLOGY 2
1.2 COST ESTIMATE ASSUMPTIONS 4
2.0 REAGENTS AND COST COMPONENTS 7
2.1 COST ESTIMATES 8
3.0 SUMMARY 11
4.0 REFERENCES 12
LIST OF FIGURES
1 CONCEPTUAL VIEW OF SOIL-CEMENT PROCESSING OPERATIONS USING STANDARD CONSTRUCTION EQUIPMENT (AFTER PCA SOIL CEMENT CONSTRUCTION HANDBOOK, 1995).
2 PER UNIT STABILIZATION COSTS VERSUS ROUNDTRIP DISTANCE FOR PV AND NOMINAL COST.
LIST OF TABLES
1 SUMMARY OF STABILIZATION COSTS FOR 200,000 TONS OF FLY ASH OVER 10 YEARS.
2 SUMMARY OF RELATIVE COSTS VERSUS ROUNDTRIP DISTANCE.
LIST OF APPENDICES
A DETAILED COST COMPONENT ESTIMATES FOR LIME, CEMENT KILN DUST, LIME KILN DUST, GROUND GRANULATED BLAST FURNACE SLAG CEMENT, AND PORTLAND CEMENT.

PPRP PPRP/ FLY ASH STABILIZATION/JUNE 2010
ii
FOREWORD
Maryland power plant operators have peformed better than the national average in having more than 50% of their Class F fly ash used beneficially in recent years. This is due in a large part to the existence of a major Portland cement industry in the area, where fly ash can substitute for a percentage of Portland cement. The Maryland Power Plant Research Program continues to support and encourage research addressing the need to find beneficial uses for an additional 800,000 tons of Class F fly ash per year. Until this goal is realized, Maryland power plant operators will have to continue to dispose of large quantities of fly ash by approved methods.
This study evaluated the cost of stabilizing Class F fly ash using various sources of free lime in industrial waste products available in the area. The study evolved from concern that power plant operators may have over estimated the cost of such stabilization compared to the ultimate cost of conventional landfill operations. The study assumed that stabilization/solidification according to the Environmental Protection Agency’s definition of these terms would become an accepted method of placing pozzolanic ash in pits without liners. Even in cases where regulatory authorities required liners, ash producers might find a cost advantage in stabilization by eliminating the need to pump and treat leachate and eliminating the risk associated from any failure of a dike or liner.
The request for the study required that the stabilization methodology be carried out with conventional equipment readily available at the present time.
Paul Petzrick Power Plant Site Assessor Maryland Power Plant Research Program

PPRP PPRP/ FLY ASH STABILIZATION/JUNE 2010
iii
ABSTRACT
The cost of stabilizing Class F fly ash from a Curtis Bay, Maryland source during back fill operations at an open pit mine reclamation site near Perryville, Maryland was evaluated for five reagents: quick lime, cement kiln dust (CKD), lime kiln dust (LKD), Portland cement, and ground granulated blast furnace slag (GGBFS) cement. The cost estimates capture only those expenses required for stabilizing the fly ash and not those costs associated with procuring or transporting the fly ash to the mine reclamation site (i.e., the costs assume that the fly ash is already being delivered to the site). The study presents costs in net present value and nominal value (annual payment).
The reagents are common, conventional, and locally available options to stabilize fly ash and mitigate leaching of constituents and potential impacts to ground water. The cost evaluation accounts for stabilization of 200,000 tons per year of fly ash for 10 years mixed with reagents in situ using standard soil mixing techniques. Dry weight ratios of reagents to fly ash, (0.10:1.0 for quick lime, GGBFS and Portland cement, 1.5:1.0 for CKD, and 0.75:1.0 for LKD), were taken from values cited in the literature. Final total project costs and dry weight mix ratios will be refined based on results of an initial, site-specific bench scale engineering study. Costs estimates account for all additional materials, equipment, labor, and engineering required for delivery, storage, and mixing of the reagents with the fly ash in 2007 dollars.
As the number of roundtrips and the distance to a reagent source increases, transportation costs eventually overwhelm savings associated with a low cost reagent. Manufactured products (quick lime, Portland cement, and GGBFS cement), have a relatively high free lime content compared to by-products (CKD and LKD). Therefore, higher volumes of CKD and LKD are required resulting in relatively high transportation costs compared to quick lime, Portland cement and GGBFS. Nonetheless, LKD is the lowest overall cost reagent considering roundtrip distances of less than 165 miles. Quick lime is the lowest cost reagent option for roundtrips at distances greater than 165 miles.
Over ten years, stabilization cost per cubic yard of fly ash using LKD is estimated at $6.15 (net present value) and $8.50 (nominal value). Using quick lime, stabilization costs over 10 years per cubic yard of fly ash is estimated at $8.60 (net present value) and $11.80 (nominal value). Due to transportation costs, CKD was the among the most costly reagent stabilization options over the 10 year period.

PPRP PPRP/ FLY ASH STABILIZATION/JUNE 2010
1
Figure 1. Conceptual view of in situ soil stabilization operations.
(after PCA Soil Cement Construction Handbook, 1995).
Step 1
Step 2
Step 3
1.0 INTRODUCTION
At the request of the Maryland Department of Natural Resources Power Plant Research Program (PPRP), the Environmental Engineering Integrator (EEI) performed a study to evaluate the incremental cost to stabilize Class F fly ash for use in mine restoration at various open pit mines in Maryland. The methods and techniques are similar to existing and common soil stabilization techniques, illustrated in Figure 1.

PPRP PPRP/ FLY ASH STABILIZATION/JUNE 2010
2
In-situ mixing (Figure 1) at the hypothetical mine reclamation site is assumed to consist of placing the fly ash in lifts of 2 to 24 inches. The fly ash would then be overlain with the selected reagents and/or additives. Once the two lifts are placed, a disc harrow pulled by a tractor would be used to turn the layer with multiple passes. Water would then be added to the resulting mixture which would then be compacted.
The cost estimates capture only those expenses required for stabilizing the fly ash and not those costs associated with procuring or transporting the fly ash to the mine reclamation site (i.e., the costs assume that the fly ash is already being delivered to the site). Although beyond the scope of this study, the CONSOL Energy (2002) CCP landfill cost model for sites specific to Ohio, Pennsylvania, and Kentucky offers a comprehensive costing method which could be adapted to sites in Maryland. The CONSOL model accounts for factors including permitting, landfill design and development, type of CCP, placement, and post-closure costs.
Consistent with the literature, PPRP believes that chemical stabilization will reduce the leaching of constituents from the fly ash and potential ground water impacts. Applicable to variable mine restoration locations with minor modifications, the cost estimate utilizes conventional low cost chemical reagents to stabilize the fly ash. By blending selected reagents with the fly ash, mix designs and technology can mitigate the release of a variety of constituents including leachable metals. Among the stabilization methods currently available, in-situ mixing of reagents and fly ash is a conventional and economical method typically used in stabilization technology.
This report outlines a stabilization project using existing methods of fly ash placement at a mine reclamation site with the addition of materials, equipment, and labor required for reagent transportation, placement, and blending. The technology considered for the cost estimate is in-situ mixing of reagents and fly ash using standard construction equipment. For costing purposes, the mine restoration site is assumed to be located near Perryville, Maryland and the fly ash source in Curtis Bay, Maryland. An initial bench scale engineering study would serve to refine the final fly ash stabilization costs.
1.1 STABILIZATION TECHNOLOGY
In use for several decades, stabilization treatment involves mixing one or more reagents with target material such as soil, sediment or sludge to physically and chemically immobilize constituents within the treated material. Stabilization treatment processes are typically designed to:

PPRP PPRP/ FLY ASH STABILIZATION/JUNE 2010
3
• Improve the physical and chemical characteristics of the target material;
• Decrease the surface area of the target material from which leaching of constituents can occur; and
• By changing the pH, reduce the solubility of leachable constituents.
Stabilization often referred to as “solidification/stabilization”, is a general category of processes that are used to treat a wide variety of materials, including solids and liquids. Solidification and stabilization are each distinct and complementary technologies.i Solidification, a typical result of lime activated stabilization, refers to techniques that encapsulate the material in a low to impermeable monolithic solid. For CCP stabilization, the encapsulation of fine particles and material occurs. Stabilization refers to techniques which reduce the leaching potential of a material by converting potentially hazardous constituents to their least soluble, mobile or toxic form. For purposes of this report, “stabilization” will refer to the processes of solidification and stabilization.
Class F fly ash is a pozzolan material. Pozzolan is a siliceous or alumno-siliceous material that is not cementitious. In the finely divided form of fly ash, a pozzolan with added moisture will chemically react with a free lime reagent such as cement or lime to form compounds with cementitious properties. The resulting cementitious property serves to encapsulate and stabilize leachable constituents.
The majority of stabilization processes can perform well with target materials that are approximately neutral (pH 7), although alkaline conditions are typically desired in circumstances where soluble metals are present. Many toxic metals are amphoteric (i.e., increased solubility at both high and low pH), and pH adjustment is necessary to produce a minimal or negligible amount of metals in the leachate. Depending on the metals present, a pH range between 9.5 and 11 is generally desired for
1According to the U.S. EPA (1997) and the Portland Cement Association (1991), stabilization and solidification are described as:
Solidification - refers to processes that encapsulate a waste to form a solid material and to restrict contaminant migration by decreasing the surface area exposed to leaching and/or by coating the waste with low-permeability materials. Solidification can be accomplished by a chemical reaction between a waste and binding (solidifying) reagents or by mechanical processes. Solidification of fine waste particles is referred to as microencapsulation, while solidification of a large block or container of waste is referred to as macroencapsulation.
Stabilization - refers to processes that involve chemical reactions that reduce the leachability of a waste. Stabilization chemically immobilizes hazardous materials or reduces their solubility through a chemical reaction. The physical nature of the waste may or may not be changed by this process.

PPRP PPRP/ FLY ASH STABILIZATION/JUNE 2010
4
minimal metal solubility. Quicklime or hydrated lime (lime) is commonly used as a buffering agent to maintain relatively alkaline (i.e., pH 9.5 to 11) conditions.
Five common, low cost, and readily available reagents were chosen for the cost estimate: quick lime, Cement Kiln Dust (CKD), Lime Kiln Dust (LKD), Portland cement, and Ground Granulated Blast Furnace Slag (GGBFS) cement. The most common reagents for stabilization systems are (quick or hydrated) lime and Portland cement. Primarily a binder, quick lime and Portland cement encapsulate and complex leachable metals into less soluble components. CKD and LKD are high lime by-products of cement manufacturing and behave much like Portland cement. Produced from steel manufacturing, GGBFS cement is a recycled product that acts as a Portland cement substitute.
In summary, when mixed with a pozzolan, the above reagents result in a low permeability material that eliminates or significantly limits leaching of soluble constituents.
1.2 COST ESTIMATE ASSUMPTIONS
The cost estimates are based on 2007 costs for the required materials, equipment and labor. Price quotes for quick lime, LKD, CKD, GGBFS and Portland cement were obtained from local vendors where possible or the closest material vendor in the absence of a local distributor. Cost estimates for heavy equipment and operators were obtained from unit prices as published in standard references for construction cost data (R.S. Means Company, 2005) and adjusted for inflation (3 percent) to 2007 dollars.
For the purpose of comparing unit costs, a dry weight ratio of 0.1:1 of reagent to fly ash, where the reagents are quick lime, Portland and GGBFS cement, a ratio of 1.5:1 of CKD to fly ash, and a ratio of 0.75:1 of LKD to fly ash were assumed. The variable ratios of reagents to fly ash are due to the differences in free lime and binder available for stabilization of the fly ash. These ratios are consistent with a general range of reagent ratios to fly ash ratios cited in the literature (e.g., http://www.tfhrc.gov/hnr20/recycle/waste/kd3.htm, Ghosh and Subbaro, 1998, Daniels and Gautham, 2006).
A small amount, (one percent by dry weight), of gypsum enhances the ability of lime to encapsulate and bind metal concentrations in leachate (Ghosh and Subbaro, 1998 and 2006) as well as prevent leaching of the added lime. As such, only the cost estimate for quick lime includes one percent gypsum. Gypsum is a by-product of coal fired power plants fitted with Flue Gas Desulfurization (FGD) air scrubbers. As a by-product,

PPRP PPRP/ FLY ASH STABILIZATION/JUNE 2010
5
gypsum material can be purchased for negligible cost from nearby FGD power plants. Brandon Shores operated by Constellation Energy was assumed as the source of gypsum due to the FGD fitting planned for the near future. The primary cost component for a gypsum admixture is the transportation.
Additional small volumes of supplemental reagents (e.g., calcium carbonate, phosphate, etc.) are available that may serve to refine and enhance the performance of the stabilization process. However, the low cost of these supplements would not significantly impact stabilization cost estimates, and were not considered. Reagent supplements if any, would be determined from the initial bench scale studies.
In summary, key assumptions in developing the cost estimate include:
• Class F fly ash will be the target material for stabilization;
• Transportation costs are based on a mine restoration site located near Perryville, Maryland;
• Approximately 200,000 tons of Class F fly ash per year for 10 years will be stabilized;
• In-situ mixing will be used for blending of reagents and fly ash;
• The same equipment used for spreading, wetting, and compacting fly ash will be used for the stabilization;
• New equipment and material shelters required for stabilization reagents will be purchased;
• Operators (labor) required for new equipment will be an additional expense;
• Nominal value is the total projected costs measured in current (2007) dollars, not adjusted for inflation;
• Annual inflation is assumed to be 3 percent;
• Net present value cost represents an initial lump sum needed to complete the project over a ten year period assuming a nominal discount rate of 8.25 percent;
• Costs include 10 percent annual equipment operation and maintenance;
• Quick lime, LKD, CKD, GGBFS and Portland cement would be delivered in cement tanker trucks;

PPRP PPRP/ FLY ASH STABILIZATION/JUNE 2010
6
• Gypsum may be obtained for negligible cost from near-by power plants;
• An initial bench scale study and quarterly field/laboratory testing will be sufficient for all reagents;
• The initial bench scale study will determine the final proportions of reagents/additives and the resulting final stabilization cost; and
• The cost for a final lift of top soil and seed maintained as the final cover surface is not included in the cost estimate.
As materials manufactured to standardized specifications, lime, GGBFS and Portland cement typically maintain a consistent and predictable composition and would not require periodic quality assurance testing. As manufacturing by-products, the chemical composition of CKD and LKD composition may vary over short periods of time due to variations in associated processing methods and base material. If using CKD/LKD, more frequent field and laboratory testing may be required to ensure the final mix is within treatability specifications. Although testing costs of CKD/LKD may be double those of manufactured products, these additional costs are insignificant relative to the overall total cost of fly ash stabilization. Due to potentially variable lime content of CKD/LKD, proportionally more or less of these reagents may be needed over the course of stabilization operations based on results of periodic field and laboratory testing.

PPRP PPRP/ FLY ASH STABILIZATION/JUNE 2010
7
2.0 REAGENTS AND COST COMPONENTS
The cost estimates were developed to provide a probable range in costs based on incoming fly ash volumes, types of reagent, transportation costs, and potential mixtures of reagents. The modular cost components (Attachment A) include probable transportation costs of bulky materials such as CKD/LKD versus more concentrated products such as quick lime, GGBSS, and Portland cement. For estimation, the component cost categories are:
• Engineering;
• Materials;
• Equipment; and
• Labor.
Engineering includes the initial mix design and treatability study (i.e., bench scale study). Materials include the reagent on a cost per ton basis. Fly ash and mix water are an existing cost and are not included in the Materials cost. Equipment included the heavy equipment and material storage building. Labor is included in the cost for heavy equipment operators needed for the corresponding stabilization option. Mix design reports and quarterly testing is included in the engineering oversight and monitoring cost.
The reagents, (quick lime, CKD, LKD, Portland and GGBFS cement), chosen for the cost estimates are among the most common and low cost materials that could be obtained locally for stabilization projects. Reagents may be intermixed depending on the material availability, cost, and stabilization objectives. Quick lime, CKD, LKD, Portland and GGBFS cement have similar physical properties and can be handled with similar equipment although a greater volume of CKD and LKD would be required.
A silo would store the reagents at the mine reclamation site. Cement tanker trucks would be used to haul the reagent to the silo while pneumatic pumps would move the material from the silo to a distribution truck for spreading over the fly ash lifts (Figure 1). Through multiple passes, a tractor-pulled disc harrow would blend the reagents and fly ash.

PPRP PPRP/ FLY ASH STABILIZATION/JUNE 2010
8
2.1 COST ESTIMATES
For each material, a separate cost estimate (Attachment A) was developed for a unit comparison among the different reagents based on information provided by vendors and the referenced research. The analysis of the five reagents indicates that the net present value cost for stabilization of the fly ash can be expected to range from approximately $6.15 to $11.50 per cubic yard (Table 1). Based on nominal value projection over ten years, the average cost per cubic yard is about $12.20 and ranges from about $8.50 to $15.90. Total net present value project costs range from $12.3 million (LKD) to $23.0 million (CKD) and average about $18 million. Final project costs will be refined by the recommended reagent volumes and mix ratios as determined from initial, site specific bench scale engineering studies, and periodic field monitoring and adjustments of material performance.
Table 1. Summary of Stabilization Costs for 200,000 Tons of Fly Ash over 10 Years.
Cost Fraction (Percent of Total) Net present value Cost ($)1
Nominal Cost ($)2
Reagent Eng. Material Transp. Equip. Labor Total (x106) Cu.Yd Cu. Yd.
Q-Lime3 0.4 72.5 14.6 1.6 11.0 17.1 8.56 11.81 CKD4 0.3 9.6 57.4 1.2 31.6 23.0 11.50 15.90 LKD5 0.5 9.1 54.6 2.2 33.6 12.3 6.15 8.46
GGBFS6 0.4 88.1 3.4 1.5 6.7 17.6 8.79 12.13 P.C.7 0.4 84.1 6.5 1.5 7.6 18.2 9.11 12.58
1 Net present value total/unit paid entirely up front (at year 0) to finance 10-years of fly ash stabilization. 2 Nominal cost represents the projected total cost in nominal (2007) dollars per cubic yard of fly ash stabilized. Assumes 10% lime; 150% CKD; 75% LKD; 10% GGBFS; 10% Portland cement (P.C.) by dry wt. mix with fly ash. 3See Attachment A, page A-1 and A-2 for details and line items. 4See Attachment A, page A-3 and A-4 for details and line items. 5See Attachment A, page A-5 and A-6 for details and line items. 6See Attachment A, page A-7 and A-8 for details and line items. 7See Attachment A, page A-9 and A-10 for details and line items.
Proportionally more high lime by-products (CKD or LKD) than lime, GGBFS or Portland cement are required to reach equivalent lime activator content in the stabilization mix. Of the lower cost (CKD and LKD) materials, LKD has relatively higher free lime content than CKD. Therefore, less LKD will be required for stabilization of an equivalent volume of fly ash incurring proportionally less transportation costs.
As reagent volume increases, transportation costs become a primary consideration in the selection of the lowest cost stabilization reagents (Table 1). Stabilization supplemented with high lime by-products available in close proximity to the mine site may significantly reduce stabilization treatment costs due to negligible material costs.

PPRP PPRP/ FLY ASH STABILIZATION/JUNE 2010
9
Regardless of the payment method, LKD is the lowest average cost option for short to intermediate (i.e., less than about 165 miles) roundtrip transport distances (Figure 2). At greater distances, transportation costs eventually overwhelm lower material costs to make quick lime the lowest cost option.
Present Value Unit Cost (Per CY) - Material Source Distance
$0.00
$2.00
$4.00
$6.00
$8.00
$10.00
$12.00
$14.00
$16.00
$18.00
$20.00
0 100 200 300 400 500
Roundtrip Distance (miles)
Uni
t Cos
t ($/
CY
of s
tabi
lized
fly
ash)
CementGBFSCKDQuick LimeLKD
Nominal Unit Cost (Per CY) - Material Source Distance
$0.00
$2.00
$4.00
$6.00
$8.00
$10.00
$12.00
$14.00
$16.00
$18.00
$20.00
0 100 200 300 400 500
Roundtrip Distance (miles)
Uni
t Cos
t ($/
ton
of s
tabi
lized
fly
ash)
CementGBFSCKDQuick LimeLKD
Figure 2. Per Unit Stabilization Cost versus Roundtrip Distance for PV and Nominal
Cost.
Roundtrip distances for the lowest cost reagent are the same regardless of the payment method (Figure 2) with intervals summarized in Table 2. LKD remains the lowest cost option at short to intermediate roundtrip distances, while lime becomes the lowest cost option at greater distances due to overwhelming transportation costs.

PPRP PPRP/ FLY ASH STABILIZATION/JUNE 2010
10
Table 2. Summary of Relative Costs versus Roundtrip Distance.
Roundtrip Miles to/from Reagent Source Relative
CY Cost < 60 mi 60 to 85 mi 85 to 165 mi 165 to 210 mi > 210 mi
Highest GGBFS/P.C. GGBFS/P.C. CKD CKD CKD
Quick Lime CKD GGBFS/P.C. GGBFS/P.C. LKD
CKD Quick Lime Quick Lime LKD GGBFS/P.C.
Lowest LKD LKD LKD Quick Lime Quick Lime
To provide an estimate of potential cost variability due to varying reagent amounts in the fly ash mix, reagent amounts were increased and decreased by 50 percent from the original mix rations (0.1:1 for Portland and GGBFS cement, 1.5:1 for CKD, and 0.75:1 for LKD). For this estimate, no variables were changed except the amount of reagent used for stabilization; the calculation does not adjust the labor, travel costs or equipment relative to an increase/decrease in the reagent amount. Although results vary slightly among reagents, increasing the reagent amount by 50 percent generally increases the corresponding unit and total project costs by approximately 30 percent; and decreasing the reagent amount by 50 percent decreases the corresponding unit costs and project costs by approximately 55 percent. This cost fluctuation demonstrates the relatively large potential impact on total and unit project costs of the reagent amount used for fly ash stabilization.
PPRP PPRP/ FLY ASH STABILIZATION/JUNE 2010
11
3.0 SUMMARY
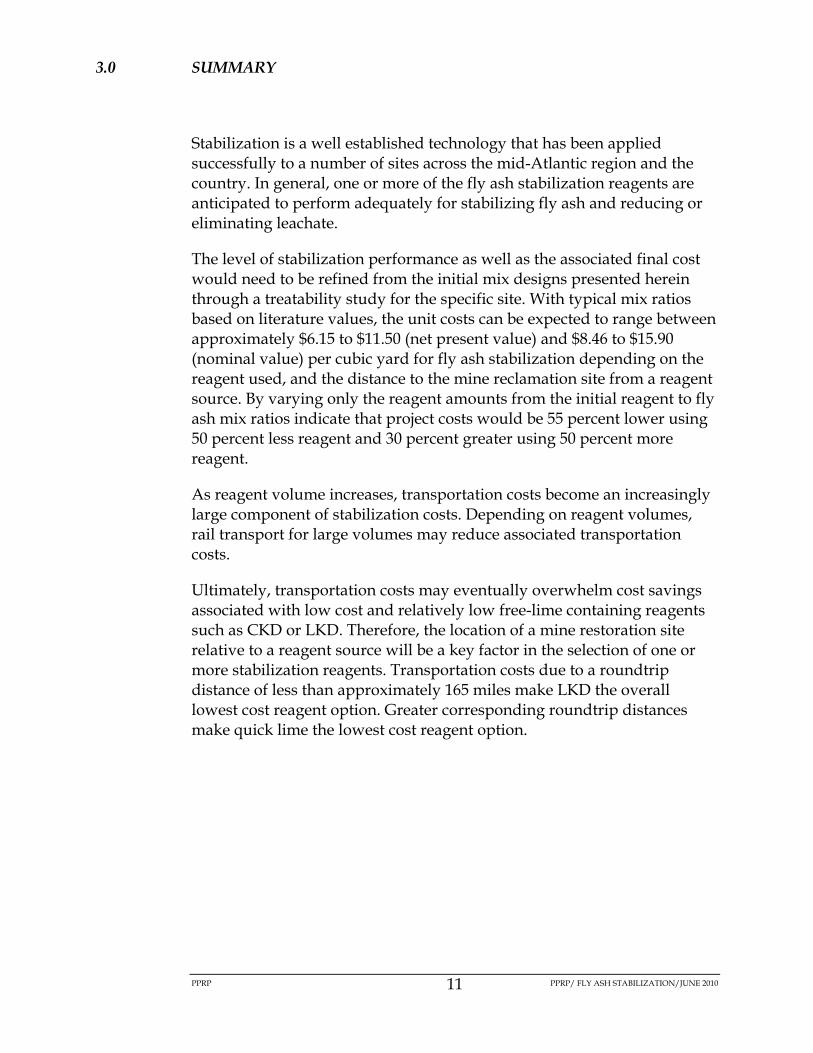
Stabilization is a well established technology that has been applied successfully to a number of sites across the mid-Atlantic region and the country. In general, one or more of the fly ash stabilization reagents are anticipated to perform adequately for stabilizing fly ash and reducing or eliminating leachate.
The level of stabilization performance as well as the associated final cost would need to be refined from the initial mix designs presented herein through a treatability study for the specific site. With typical mix ratios based on literature values, the unit costs can be expected to range between approximately $6.15 to $11.50 (net present value) and $8.46 to $15.90 (nominal value) per cubic yard for fly ash stabilization depending on the reagent used, and the distance to the mine reclamation site from a reagent source. By varying only the reagent amounts from the initial reagent to fly ash mix ratios indicate that project costs would be 55 percent lower using 50 percent less reagent and 30 percent greater using 50 percent more reagent.
As reagent volume increases, transportation costs become an increasingly large component of stabilization costs. Depending on reagent volumes, rail transport for large volumes may reduce associated transportation costs.
Ultimately, transportation costs may eventually overwhelm cost savings associated with low cost and relatively low free-lime containing reagents such as CKD or LKD. Therefore, the location of a mine restoration site relative to a reagent source will be a key factor in the selection of one or more stabilization reagents. Transportation costs due to a roundtrip distance of less than approximately 165 miles make LKD the overall lowest cost reagent option. Greater corresponding roundtrip distances make quick lime the lowest cost reagent option.

PPRP PPRP/ FLY ASH STABILIZATION/JUNE 2010
12
4.0 REFERENCES
CONSOL Energy, 2002. Landfill Cost Model for Disposal of Coal Combustion Products. Version 1.0. Issue Date: November 2002.
Daniels, J.L., and P.D. Gautham, 2006. Leaching Behavior of Lime–Fly Ash Mixtures. Environmental Engineering Science. Jan 2006, Vol. 23, No. 1 : 42 -52
EPA. 1997. Innovative Site Remediation Technology, Solidification/Stabilization. Design & Application, Volume 4. (EPA 542-B-97-007)
Ghosh, A., and C Sabbaro, 1998. Hydraulic Conductivity and Leachate Characteristics of Stabilized Fly Ash. J. Envir. Engrg., Volume 124, Issue 9, pp. 812-820 (September 1998).
Ghosh, A., and C Sabbaro, 2006. Leaching of Lime from Fly Ash Stabilized with Lime and Gypsum. J. Mat. in Civ. Engrg., Volume 18, Issue 1, pp. 106-115 (January/February 2006).
Portland Cement Association. 1991. Solidification and Stabilization of Waste Using Portland Cement.
R.S. Means Company, 2005. Environmental Remediation Cost Data – Unit Price. 11th ed. 2005.
Spence, R.D., 1993. Chemistry and Microstructures of Solidified Waste Forms. Lewis Publishers, Boca Raton, FL.
Appendix A
Detailed Cost Component Estimates for Quick Lime, Cement Kiln Dust, Lime Kiln Dust, Portland Cement,
and Ground Granulated Blast Furnace Slag

FLY ASH STABILIZATION COST ESTIMATE ATTACHMENT A
Estimated Fly Ash (1,000s of tons annually) 200
Item Unit Quantity Unit Price
Total Estimated
Cost
Engineering
Mix Design Study LS 1 35,000$ 35,000$
Quarterly Testing/Monitoring (Annual Costing) LS 1 6,000$ 6,000$
Equipment
Pneumatic Trailer, 1600 CF capacity + Tractor EA 2 $90,000 180,000$
Pneumatic Tube System, 2 Stations, Blower1EA 1 $18,139 18,139$
Distribution Truck2EA 1 $100,000 100,000$
Tractor 52 H.P. EA 1 $48,000 48,000$
Disc Harrow - 7.5 feet width EA 1 $13,400 13,400$
Silo: Concrete, 16' diameter, 45' high3EA 1 $51,577 51,577$
Silo Foundation: Concrete Slab 12" thick SF 200 $4.78 955$
Annual Material4
Gypsum (1:100 mix ratio) TON 2000 $1 2,000$
High Calcium Quick Lime (1:10 mix ratio) TON 20000 $84 1,680,000$
Annual Labor/Transport (Based on Annual Material)
Truck Driver, Heavy (1hr/40mi + 1hr/trip) Hour 4775 $29.23 139,563$
Number of Truck Roundtrips - Gypsum Trips 50 $160.00 8,000$
Roundtrip Distance and Average Cost per Mile Mile 80 $2.00
Number of Truck Roundtrips - Quick Lime Trips 500 $660.00 330,000$
Roundtrip Distance and Average Cost per Mile Mile 330 $2.00
Equipment Operator, Medium Hour 1600 $36.76 58,816$
Equipment Operator, Light Hour 1600 $35.06 56,100$
NOMINAL UNIT COST (PER CY) PROJECTION (10 YEAR PERIOD) 11.81$
PRESENT VALUE COST (10 YEAR PERIOD): 17,122,501$
PRESENT VALUE COST PER CUBIC YARD (10 YEAR PERIOD): 8.56$
Notes:I. Assumptions: 8 hour days, 200 days work per year; 5 acre site; fly ash density of 1.0 tons/cy.
II. Nominal unit cost represents the projected total cost in nominal dollars (2007 dollars) per cubic yard of fly ash
stabilized.
III. Present value cost represents the amount of money invested in Year 0, which would be sufficient to cover
accrued costs. (assumes a nominal discount rate of 8.25%)
IV. Costs assume 10% annual equipment O&M.
V. Road Reclaimer would be the alternative to the tractor+disc - At an estimated cost of $500,000.
VI. Unit prices obtained from RS Means (inflation adjusted), suppliers, and engineering experience.
Estimated Cost for Quick Lime S/S of Fly Ash
A - 1

FLY ASH STABILIZATION COST ESTIMATE ATTACHMENT A
Footnotes(see Table A-1. Cost References for Fly Ash Stabilization , pg A-11 for complete references)
1. Includes single 100' long, 4" DIA tube and labor.
2. Trailer has 40 Ton capacity of dry lime; Trailer can act as distribution truck with attachments.
3. Silo volume of 256 cu. m., 225 tons of dry lime; price includes materials and labor.
4. Material Sources:
Gypsum: Brandon Shores Power Plant; Baltimore, MD
Quick Lime: Graymont; Pleasant Gap, PA
Nominal Component Costs (10-Year Period)
72.5%
11.0%
14.6%
0.4%
1.6%
Materials
Labor
Transport
Engineering
Equipment
Cash Flow Diagram: Quick Lime S/S Annual Costs
(3% Inflation)
$2.73
$2.39 $2.46 $2.54 $2.61 $2.69 $2.77 $2.86 $2.94 $3.03
1 2 3 4 5 6 7 8 9 10
Year
$ m
illions
A - 2

FLY ASH STABILIZATION COST ESTIMATE ATTACHMENT A
Estimated Fly Ash (1,000s of tons annually) 200
Item Unit Quantity Unit Price
Total Estimated
Cost
Engineering
Mix Design Study LS 1 35,000$ 35,000$
Quarterly Testing/Monitoring LS 1 6,000$ 6,000$
Equipment
Pneumatic Trailer, 1600 CF capacity + Tractor EA 2 $90,000 180,000$
Pneumatic Tube System, 2 Stations, Blower1EA 1 $18,139 18,139$
Distribution Truck2EA 1 $100,000 100,000$
Tractor 52 H.P. EA 1 $48,000 48,000$
Disc Harrow - 7.5 feet width EA 1 $13,400 13,400$
Silo: Concrete, 16' diameter, 45' high3EA 1 $51,577 51,577$
Silo Foundation: Concrete Slab 12" thick SF 200 $4.78 955$
Annual Material4
% Mix LKD with Fly Ash 75%
Lime Kiln Dust (0.75:1 mix ratio) TON 150000 $1 150,000$
Annual Labor/Transport (Based on Annual Material)
Truck Driver, Heavy (1hr/40mi + 1hr/trip) Hour 15000 $29.23 438,417$
Number of Truck Roundtrips - CKD Trips 3750 $240.00 900,000$
Roundtrip Distance and Average Cost per Mile Mile 120 $2.00
Equipment Operator, Medium Hour 1600 $36.76 58,816$
Equipment Operator, Light Hour 1600 $35.06 56,100$
NOMINAL UNIT COST (PER CY) PROJECTION (10 YEAR PERIOD) 8.46$
PRESENT VALUE COST (10 YEAR PERIOD): 12,302,020$
PRESENT VALUE COST PER CUBIC YARD (10 YEAR PERIOD): 6.15$
Notes:I. Assumptions: 8 hour days, 200 days work per year; 5 acre site; fly ash density of 1.0 tons/cy.
II. Nominal unit cost represents the projected total cost in nominal dollars (2007 dollars) per cubic yard of fly ash
stabilized.
III. Present value cost represents the amount of money invested in Year 0, which would be sufficient to cover
accrued costs. (assumes a nominal discount rate of 8.25%)
IV. Costs assume 10% annual equipment O&M.
V. Road Reclaimer would be the alternative to the tractor+disc - At an estimated cost of $500,000.
VI. Unit prices obtained from RS Means (inflation adjusted), suppliers, and engineering experience.
Estimated Cost for Lime Kiln Dust (LKD) S/S of Fly Ash
A - 3

FLY ASH STABILIZATION COST ESTIMATE ATTACHMENT A
Footnotes(see Table A-1. Cost References for Fly Ash Stabilization , pg A-11 for complete references)
1. Includes single 100' long, 4" DIA tube and labor.
2. Trailer has 40 Ton capacity of dry lime; Trailer can act as distribution truck with attachments.
3. Silo volume of 256 cu. m., 225 tons of dry lime; price includes materials and labor.
4. Material Sources:
LKD: LWB Refactories; York, PA
Nominal Component Costs (10-Year Period)
9.1%
33.6%
54.6%
0.5%
2.2% Materials
Labor
Transport
Engineering
Equipment
Cash Flow Diagram: LKD S/S Annual Costs
(3% Inflation)
$2.06
$1.70 $1.75 $1.80 $1.86 $1.91 $1.97 $2.03 $2.09 $2.15
1 2 3 4 5 6 7 8 9 10Year
$ m
illions
A - 4

FLY ASH STABILIZATION COST ESTIMATE ATTACHMENT A
Estimated Fly Ash (1,000s of tons annually) 200
Item Unit Quantity Unit Price
Total Estimated
Cost
Engineering
Mix Design Study LS 1 35,000$ 35,000$
Quarterly Testing/Monitoring LS 1 6,000$ 6,000$
Equipment
Pneumatic Trailer, 1600 CF capacity + Tractor EA 2 $90,000 180,000$
Pneumatic Tube System, 2 Stations, Blower1EA 1 $18,139 18,139$
Distribution Truck2EA 1 $100,000 100,000$
Tractor 52 H.P. EA 1 $48,000 48,000$
Disc Harrow - 7.5 feet width EA 1 $13,400 13,400$
Silo: Concrete, 16' diameter, 45' high3EA 1 $51,577 51,577$
Silo Foundation: Concrete Slab 12" thick SF 200 $4.78 955$
Annual Material4
Cement Kiln Dust (1.5:1 mix ratio) TON 300000 $1 300,000$
Annual Labor/Transport (Based on Annual Material)
Truck Driver, Heavy (1hr/40mi + 1hr/trip) Hour 30000 $29.23 876,834$
Number of Truck Roundtrips - CKD Trips 7500 $240.00 1,800,000$
Roundtrip Distance and Average Cost per Mile Mile 120 $2.00
Equipment Operator, Medium Hour 1600 $36.76 58,816$
Equipment Operator, Light Hour 1600 $35.06 56,100$
NOMINAL UNIT COST (PER CY) PROJECTION (10 YEAR PERIOD) 15.90$
PRESENT VALUE COST (10 YEAR PERIOD): 22,992,521$
PRESENT VALUE COST PER CUBIC YARD (10 YEAR PERIOD): 11.50$
Notes:I. Assumptions: 8 hour days, 200 days work per year; 5 acre site; fly ash density of 1.0 tons/cy.
II. Nominal unit cost represents the projected total cost in nominal dollars (2007 dollars) per cubic yard of fly ash
stabilized.
III. Present value cost represents the amount of money invested in Year 0, which would be sufficient to cover
accrued costs. (assumes a nominal discount rate of 8.25%)
IV. Costs assume 10% annual equipment O&M.
V. Road Reclaimer would be the alternative to the tractor+disc - At an estimated cost of $500,000.
VI. Unit prices obtained from RS Means (inflation adjusted), suppliers, and engineering experience.
Estimated Cost for Cement Kiln Dust (CKD) S/S of Fly Ash
A - 5

FLY ASH STABILIZATION COST ESTIMATE ATTACHMENT A
Footnotes(see Table A-1. Cost References for Fly Ash Stabilization , pg A-11 for complete references)
1. Includes single 100' long, 4" DIA tube and labor.
2. Trailer has 40 Ton capacity of dry lime; Trailer can act as distribution truck with attachments.
3. Silo volume of 256 cu. m., 225 tons of dry lime; price includes materials and labor.
4. Material Sources:
CKD: Lehigh Cement Company; York, PA
Nominal Component Costs (10-Year Period)
9.6%
31.6%
57.4%
0.3%
1.2% Materials
Labor
Transport
Engineering
Equipment
Cash Flow Diagram: CKD S/S Annual Costs (3% Inflation)
$3.54
$3.14 $3.23 $3.33 $3.43 $3.53 $3.64 $3.75 $3.86 $3.98
1 2 3 4 5 6 7 8 9 10
Year
$ m
illions
A - 6

FLY ASH STABILIZATION COST ESTIMATE ATTACHMENT A
Estimated Fly Ash (1,000s of tons annually) 200
Item Unit Quantity Unit Price
Total Estimated
Cost
Engineering
Mix Design Study LS 1 35,000$ 35,000$
Quarterly Testing/Monitoring LS 1 6,000$ 6,000$
Equipment
Pneumatic Trailer, 1600 CF capacity + Tractor EA 2 $90,000 180,000$
Pneumatic Tube System, 2 Stations, Blower1EA 1 $18,139 18,139$
Distribution Truck2EA 1 $100,000 100,000$
Tractor 52 H.P. EA 1 $48,000 48,000$
Disc Harrow - 7.5 feet width EA 1 $13,400 13,400$
Silo: Concrete, 16' diameter, 45' high3EA 1 $51,577 51,577$
Silo Foundation: Concrete Slab 12" thick SF 200 $4.78 955$
Annual Material4
Portland Cement Type II (1:10 mix ratio) TON 20000 $104 2,080,000$
Annual Labor/Transport (Based on Annual Material)
Truck Driver, Heavy (1hr/40mi + 1hr/trip) Hour 2500 $29.23 73,069$
Number of Truck Roundtrips - Portland Cement Trips 500 $320.00 160,000$
Roundtrip Distance and Average Cost per Mile Mile 160 $2.00
Equipment Operator, Medium Hour 1600 $36.76 58,816$
Equipment Operator, Light Hour 1600 $35.06 56,100$
NOMINAL UNIT COST (PER CY) PROJECTION (10 YEAR PERIOD) 12.58$
PRESENT VALUE COST (10 YEAR PERIOD): 18,225,058$
PRESENT VALUE COST PER CUBIC YARD (10 YEAR PERIOD): 9.11$
Notes:I. Assumptions: 8 hour days, 200 days work per year; 5 acre site; fly ash density of 1.0 tons/cy.
II. Nominal unit cost represents the projected total cost in nominal dollars (2007 dollars) per cubic yard of fly ash
stabilized.
III. Present value cost represents the amount of money invested in Year 0, which would be sufficient to cover
accrued costs. (assumes a nominal discount rate of 8.25%)
IV. Costs assume 10% annual equipment O&M.
V. Road Reclaimer would be the alternative to the tractor+disc - At an estimated cost of $500,000.
VI. Unit prices obtained from RS Means (inflation adjusted), suppliers, and engineering experience.
Estimated Cost for Portland Cement S/S of Fly Ash
A - 7

FLY ASH STABILIZATION COST ESTIMATE ATTACHMENT A
Footnotes(see Table A-1. Cost References for Fly Ash Stabilization , pg A-11 for complete references)
1. Includes single 100' long, 4" DIA tube and labor.
2. Trailer has 40 Ton capacity of dry lime; Trailer can act as distribution truck with attachments.
3. Silo volume of 256 cu. m., 225 tons of dry lime; price includes materials and labor.
4. Material Sources:
Portland Cement: Lehigh; Union Bridge, MD
Nominal Component Costs (10-Year Period)
83.0%
8.6%
6.4%
1.6%
0.4% Materials
Labor
Transport
Engineering
Equipment
Cash Flow Diagram: Portland Cement S/S Annual Costs
(3% Inflation)
$2.88$2.55 $2.63 $2.70 $2.79 $2.87 $2.96 $3.04 $3.14 $3.23
1 2 3 4 5 6 7 8 9 10
Year
$ m
illions
A - 8

FLY ASH STABILIZATION COST ESTIMATE ATTACHMENT A
Estimated Fly Ash (1,000s of tons annually) 200
Item Unit Quantity Unit Price
Total Estimated
Cost
Engineering
Mix Design Study LS 1 35,000$ 35,000$
Quarterly Testing/Monitoring LS 1 6,000$ 6,000$
Equipment
Pneumatic Trailer, 1600 CF capacity + Tractor EA 2 $90,000 180,000$
Pneumatic Tube System, 2 Stations, Blower1EA 1 $18,139 18,139$
Distribution Truck2EA 1 $100,000 100,000$
Tractor 52 H.P. EA 1 $48,000 48,000$
Disc Harrow - 7.5 feet width EA 1 $13,400 13,400$
Silo: Concrete, 16' diameter, 45' high3EA 1 $51,577 51,577$
Silo Foundation: Concrete Slab 12" thick SF 200 $4.78 955$
Annual Material4
Granulated Blast Furnace Slag (1:10 mix ratio) TON 20000 $105 2,100,000$
Annual Labor/Transport (Based on Annual Material)
Truck Driver, Heavy (1hr/40mi + 1hr/trip) Hour 1500 $29.23 43,842$
Number of Truck Roundtrips - Steel Slag Trips 500 $160.00 80,000$
Roundtrip Distance and Average Cost per Mile Mile 80 $2.00
Equipment Operator, Medium Hour 1600 $36.76 58,816$
Equipment Operator, Light Hour 1600 $35.06 56,100$
NOMINAL UNIT COST (PER CY) PROJECTION (10 YEAR PERIOD) 12.13$
PRESENT VALUE COST (10 YEAR PERIOD): 17,584,182$
PRESENT VALUE COST PER CUBIC YARD (10 YEAR PERIOD): 8.79$
Notes:I. Assumptions: 8 hour days, 200 days work per year; 5 acre site; fly ash density of 1.0 tons/cy.
II. Nominal unit cost represents the projected total cost in nominal dollars (2007 dollars) per cubic yard of fly ash
stabilized.
III. Present value cost represents the amount of money invested in Year 0, which would be sufficient to cover
accrued costs. (assumes a nominal discount rate of 8.25%)
IV. Costs assume 10% annual equipment O&M.
V. Road Reclaimer would be the alternative to the tractor+disc - At an estimated cost of $500,000.
VI. Unit prices obtained from RS Means (inflation adjusted), suppliers, and engineering experience.
Estimated Cost for Ground Granulated Blast Furnace Slag (GGBFS) S/S of Ash
A - 9

FLY ASH STABILIZATION COST ESTIMATE ATTACHMENT A
Footnotes(see Table A-1. Cost References for Fly Ash Stabilization , pg A-11 for complete references)
1. Includes single 100' long, 4" DIA tube and labor.
2. Trailer has 40 Ton capacity of dry lime; Trailer can act as distribution truck with attachments.
3. Silo volume of 256 cu. m., 225 tons of dry lime; price includes materials and labor.
4. Material Sources:
GBFS: Sparrows Point Lafarge Plant; Baltimore, MD
Nominal Component Costs (10-Year Period)
6.7%
3.4%
88.1%
1.5%
0.4%Materials
Labor
Transport
Engineering
Equipment
Cash Flow Diagram: GGBFS S/S Annual Costs
(3% Inflation)
$2.79$2.46 $2.53 $2.61 $2.69 $2.77 $2.85 $2.93 $3.02 $3.11
1 2 3 4 5 6 7 8 9 10
Year
$ m
illions
A - 10

FLY ASH STABILIZATION COST ESTIMATE ATTACHMENT A
Table A-1. Cost References for Fly Ash Stabilization
Item Source
Mix Design Study Engineering Experience Quarterly Testing/Monitoring Engineering Experience Pneumatic Trailer, 1600 CF capacity +
Tractor http://www.pneutechtrailer.com/ Pneumatic Tube System, 2 Stations,
Blower1 14580 800 0300 - 2004 RSMeans Building Construction Cost Data
Distribution Truck
Cost estimated based on used cost for similar distribution trucks that
range from 50k-80k
Tractor 52 H.P. Caterpillar Website Quote - John Deere 91 hp alternative for $31,000 Disc Harrow - 7.5 feet width John Deere - www.deere.com
Silo: Concrete, 16' diameter, 45' high4 13128 840 0200 - 2004 RSMeans Building Construction Cost Data
Silo Foundation: Concrete Slab 12" thick 03310 240 4900 - 2004 RSMeans Building Construction Cost Data
Truck Driver 2005 RSMeans Environmental Remediation Cost Data - Unit Price
Equipment Operator, Medium 2005 RSMeans Environmental Remediation Cost Data - Unit Price
Equipment Operator, Light 2005 RSMeans Environmental Remediation Cost Data - Unit Price Gypsum (pg A-1) $1/Ton Brandon Shores Power Plant (Baltimore, MD)
Lime (pg A-1)
$84/Ton Graymont (Pleasant Gap, PA) - High Calcium Quicklime -
Mark Hill 610-636-2437
$100/Ton Carmeuse Lime (Annville, PA) - Stabilime (75%
Quicklime, 25% lime kilm dust) - Douglas Yearick - (570-660-0902)$80/Ton Greer Lime and Cement Company (Riverton, WV) -
Ground Quicklime - Chuck Pollard - 304-296-1751
LKD (pg A-3)
$18/Ton Pleasant Gap, PA: Graymont (Pleasant Gap, PA) - Mark Hill
610-636-2437$20/Ton Carmeuse Lime (Annville, PA) - 30% free lime - Douglas
Yearick - (570-660-0902)$0.50 - $1/Ton LWB Refactories (York, PA)
CKD (pg A-5) $1/Ton Lehigh Cement Company (York, PA) Portland Cement (pg A-7) $104/Ton Lehigh (Union Bridge, MD)
$112/Ton Lafarge (South Baltimore) - Art - 443-370-3161 GGBFS (pg A-9) $105/Ton Sparrows Point Lafarge Plant (Baltimore, MD)
Mixes
1-2:1 CKD:Fly Ash USDOT,
FHA<http://www.tfhrc.gov/hnr20/recycle/waste/kd3.htm>0.5-1:1 LKD:Fly Ash USDOT,
FHA<http://www.tfhrc.gov/hnr20/recycle/waste/kd3.htm>
Average Cost Per Mile
USDOT, FHA http://www.ops.fhwa.dot.gov/freight/
freight_analysis/exp_mile/index.htm#note Nominal discount rate US Prime Rate Round-trip Distances (Perryville, MD) 80 miles - Baltimore, MD
330 miles - Pleasant Gap, PA160 miles - Union Bridge, MD120 miles - York, PA140 miles - Annville, PA540 miles - Riverton, WV90 miles - South Baltimore, MD
Based on Google Maps Driving
Directions
A - 11