cost effectiveness of treatment for people on probation farrokh alemi, ph.d. faye taxman, ph.d. jee...
Post on 21-Dec-2015
217 views
TRANSCRIPT
Cost Effectiveness of Treatment for People on Probation
Farrokh Alemi, Ph.D.Faye Taxman, Ph.D.
Jee VangMeridith Thanner
Victoria Doyon
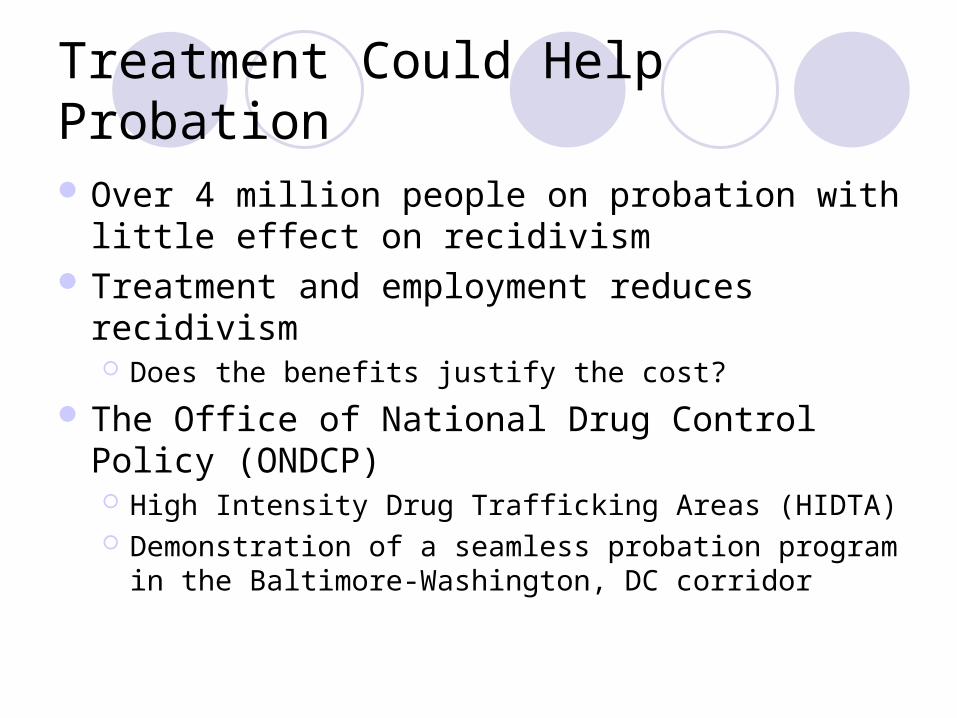
Treatment Could Help Probation
Over 4 million people on probation with little effect on recidivism
Treatment and employment reduces recidivism Does the benefits justify the cost?
The Office of National Drug Control Policy (ONDCP) High Intensity Drug Trafficking Areas (HIDTA) Demonstration of a seamless probation program in the
Baltimore-Washington, DC corridor
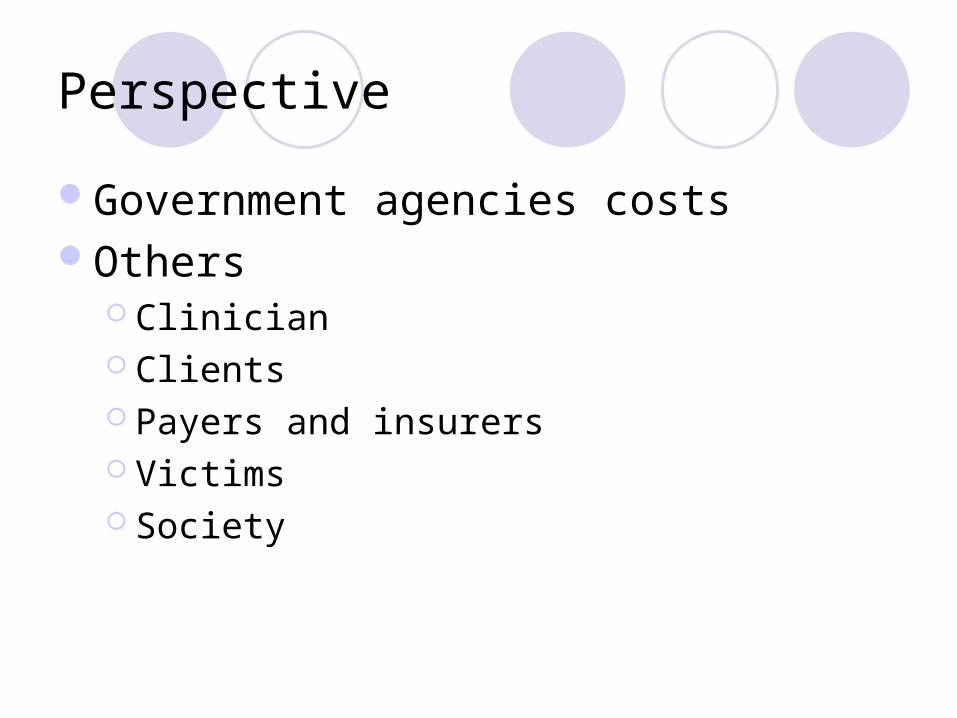
Perspective
Government agencies costsOthers
Clinician Clients Payers and insurers Victims Society
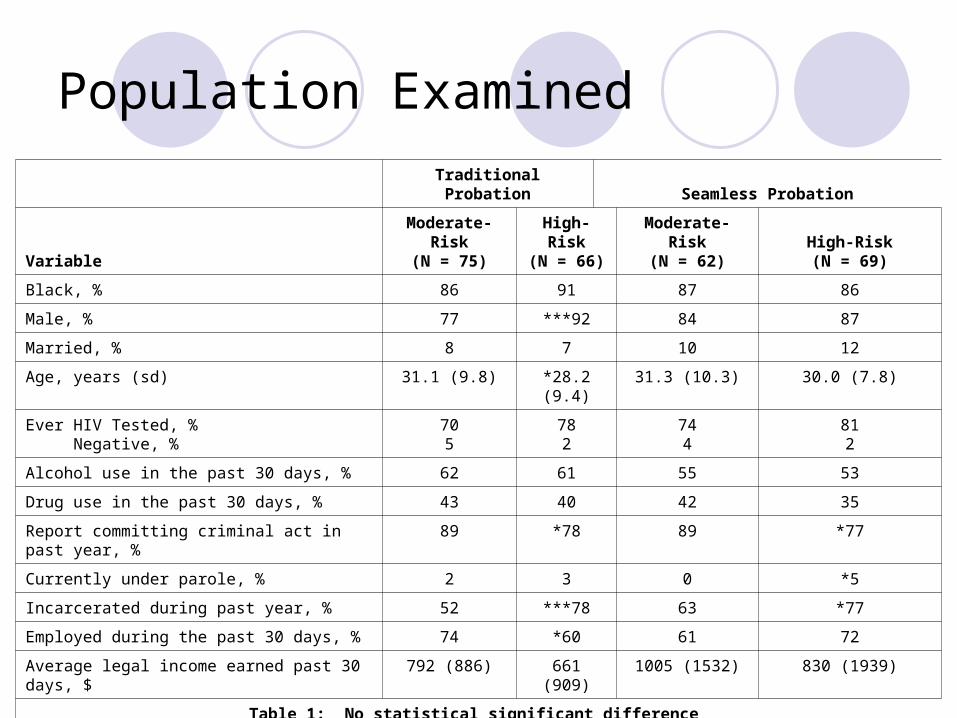
Population Examined
Traditional Probation Seamless Probation
VariableModerate-Risk
(N = 75)High-Risk(N = 66)
Moderate-Risk(N = 62)
High-Risk(N = 69)
Black, % 86 91 87 86
Male, % 77 ***92 84 87
Married, % 8 7 10 12
Age, years (sd) 31.1 (9.8) *28.2 (9.4) 31.3 (10.3) 30.0 (7.8)
Ever HIV Tested, % Negative, %
705
782
744
812
Alcohol use in the past 30 days, % 62 61 55 53
Drug use in the past 30 days, % 43 40 42 35
Report committing criminal act in past year, % 89 *78 89 *77
Currently under parole, % 2 3 0 *5
Incarcerated during past year, % 52 ***78 63 *77
Employed during the past 30 days, % 74 *60 61 72
Average legal income earned past 30 days, $ 792 (886) 661 (909) 1005 (1532) 830 (1939)
Table 1: No statistical significant difference between traditional and seamless groups at baseline
***p .01 ** p .05 * p .10 (significance tests run between seamless and traditional group)
Source of Data
Self-report We interviewed offenders at baseline and at 12
months Treatment & probation utilization Drug testingRe-arrest from FBI records Unit costs
Budget of the agencies Literature review
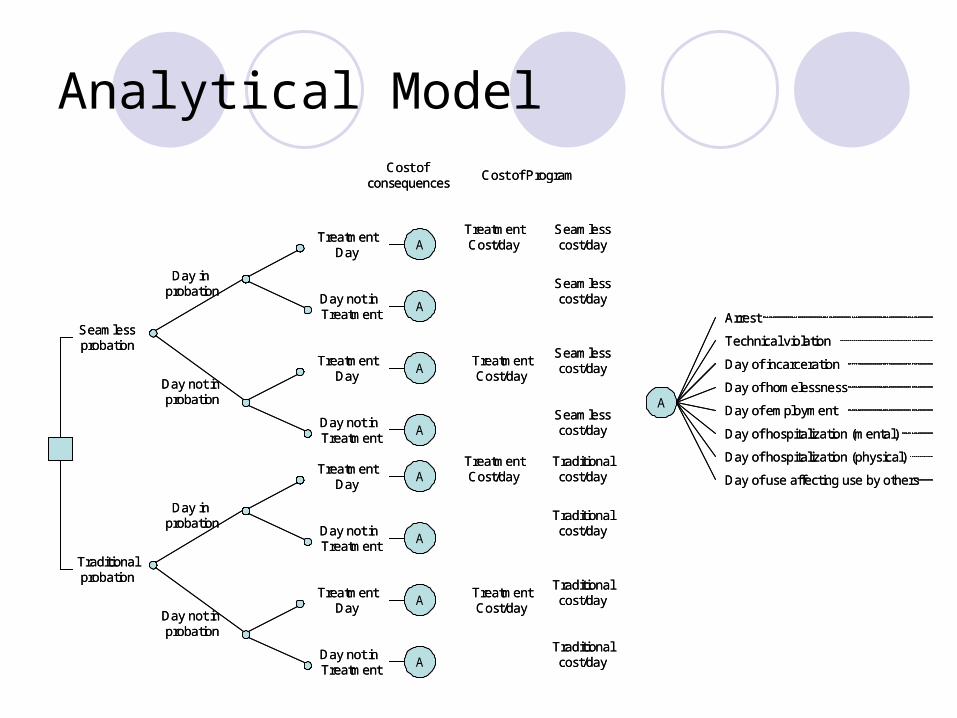
Analytical Model
Seamlessprobation
Day in probation
TreatmentDay
Day not in Treatment
A
A
TreatmentCost/day
Day not in probation
TreatmentDay
Day not in Treatment
A
A
Seamlesscost/day
TreatmentCost/day
Seamlesscost/day
Seamlesscost/day
Seamlesscost/day
Traditionalprobation
Day in probation
TreatmentDay
Day not in Treatment
A
A
TreatmentCost/day
Day not in probation
TreatmentDay
Day not in Treatment
A
A
Traditionalcost/day
TreatmentCost/day
Traditionalcost/day
Traditionalcost/day
Traditionalcost/day
Cost of consequences
Cost of Program
A
Arrest
Technical violation
Day of incarceration
Day of homelessness
Day of employment
Day of hospitalization (mental)
Day of use affecting use by others
Day of hospitalization (physical)
Cost of arrest & court processing
Cost of arrest without processing
Cost of day of incarceration
Cost of day of shelter
Tax income per day (negative cost)
Cost of day of hospitalization (mental)
Expected cost of drug use for others
Cost of day of hospitalization (physical)
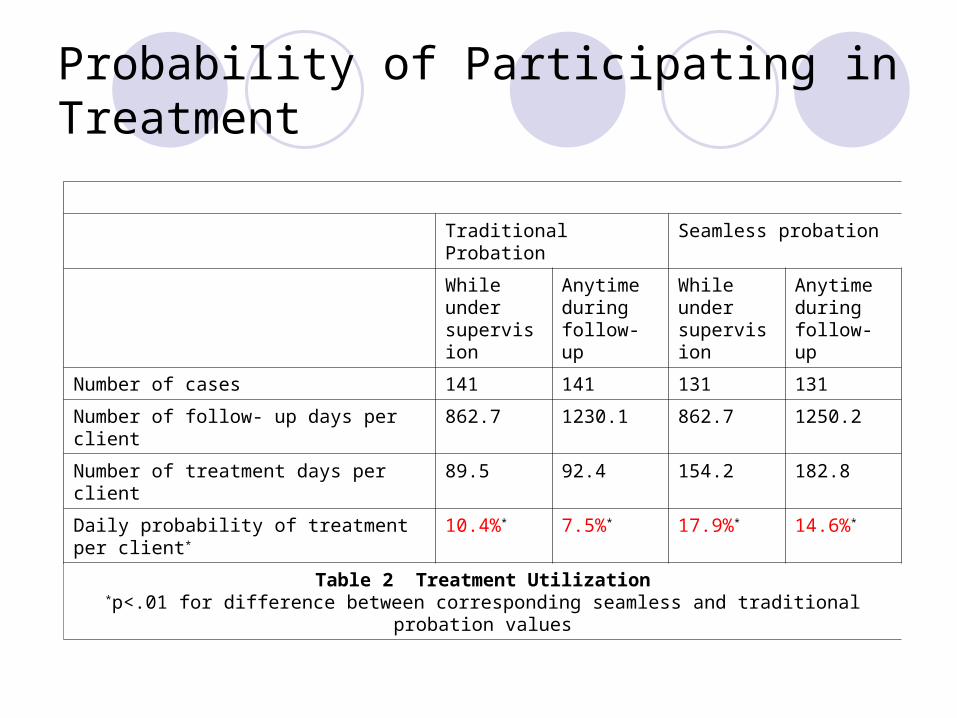
Probability of Participating in Treatment
Traditional Probation Seamless probation
While under supervision
Anytime during follow-up
While under supervision
Anytime during follow-up
Number of cases 141 141 131 131
Number of follow- up days per client 862.7 1230.1 862.7 1250.2
Number of treatment days per client 89.5 92.4 154.2 182.8
Daily probability of treatment per client* 10.4%* 7.5%* 17.9%* 14.6%*
Table 2 Treatment Utilization*p<.01 for difference between corresponding seamless and traditional probation values
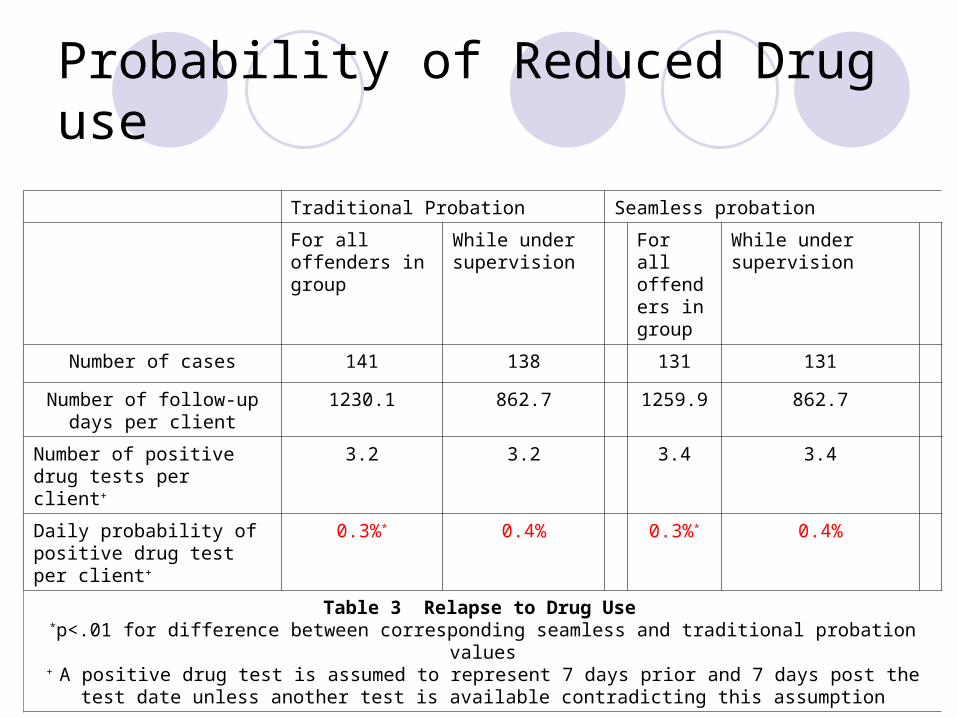
Probability of Reduced Drug use
Traditional Probation Seamless probation
For all offenders in group
While under supervision
For all offenders in group
While under supervision
Number of cases 141 138 131 131
Number of follow-up days per client
1230.1 862.7 1259.9 862.7
Number of positive drug tests per client+
3.2 3.2 3.4 3.4
Daily probability of positive drug test per client+
0.3%* 0.4% 0.3%* 0.4%
Table 3 Relapse to Drug Use
*p<.01 for difference between corresponding seamless and traditional probation values+ A positive drug test is assumed to represent 7 days prior and 7 days post the test date unless another test is available
contradicting this assumption
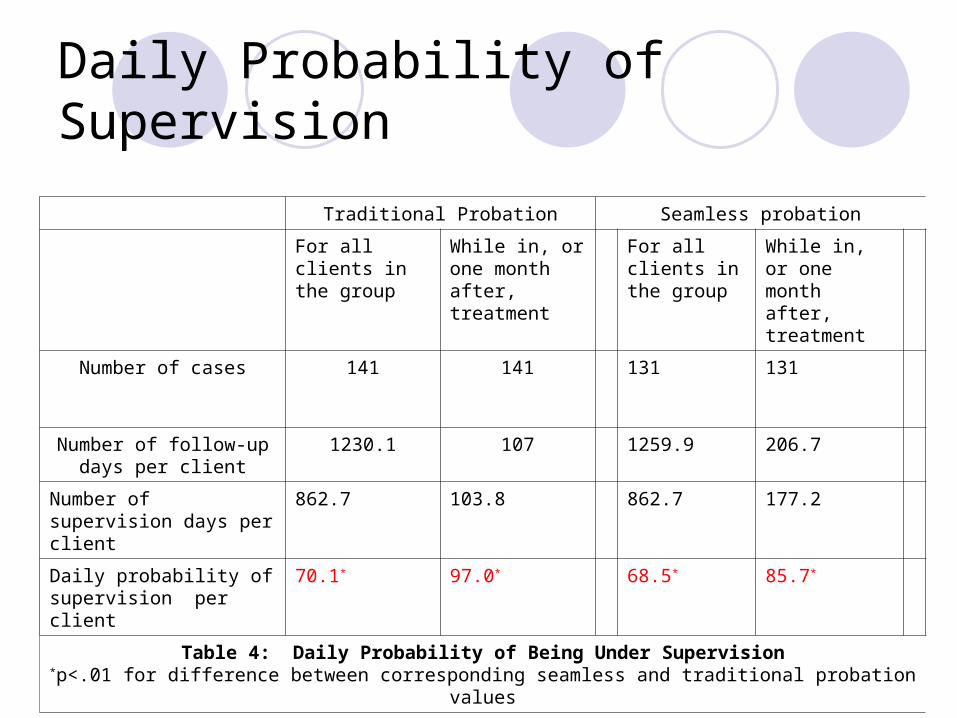
Daily Probability of Supervision
Traditional Probation Seamless probation
For all clients in the group
While in, or one month after, treatment
For all clients in the group
While in, or one month after, treatment
Number of cases 141 141 131 131
Number of follow-up days per client
1230.1 107 1259.9 206.7
Number of supervision days per client
862.7 103.8 862.7 177.2
Daily probability of supervision per client
70.1* 97.0* 68.5* 85.7*
Table 4: Daily Probability of Being Under Supervision*p<.01 for difference between corresponding seamless and traditional probation values
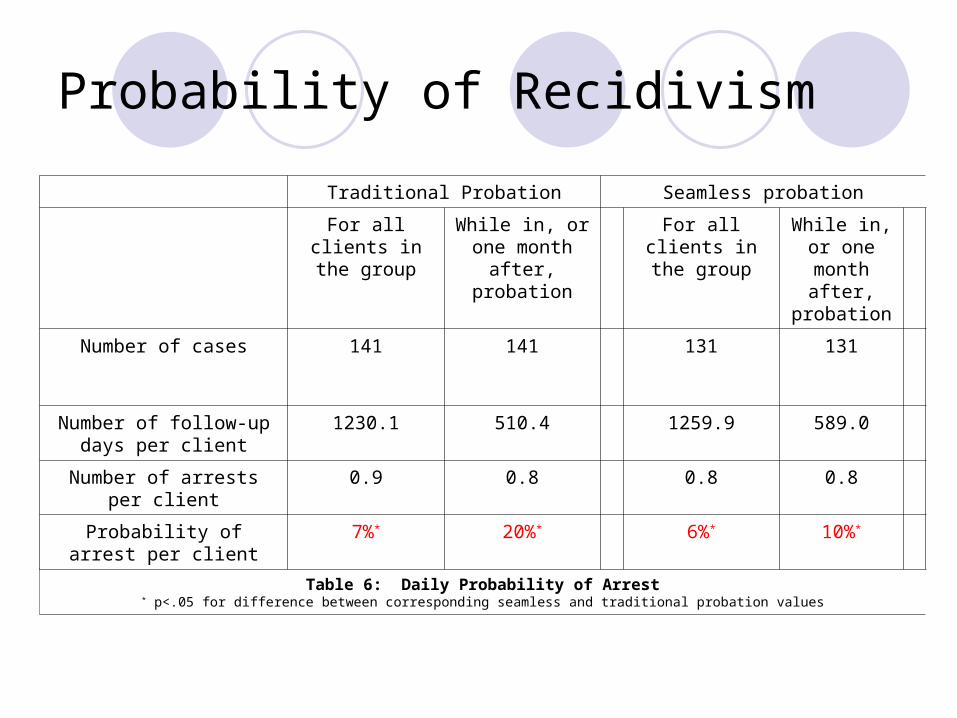
Probability of Recidivism
Traditional Probation Seamless probation
For all clients in the group
While in, or one month after,
probation
For all clients in the group
While in, or one month
after, probation
Number of cases 141 141 131 131
Number of follow-up days per client
1230.1 510.4 1259.9 589.0
Number of arrests per client 0.9 0.8 0.8 0.8
Probability of arrest per client 7%* 20%* 6%* 10%*
Table 6: Daily Probability of Arrest* p<.05 for difference between corresponding seamless and traditional probation values
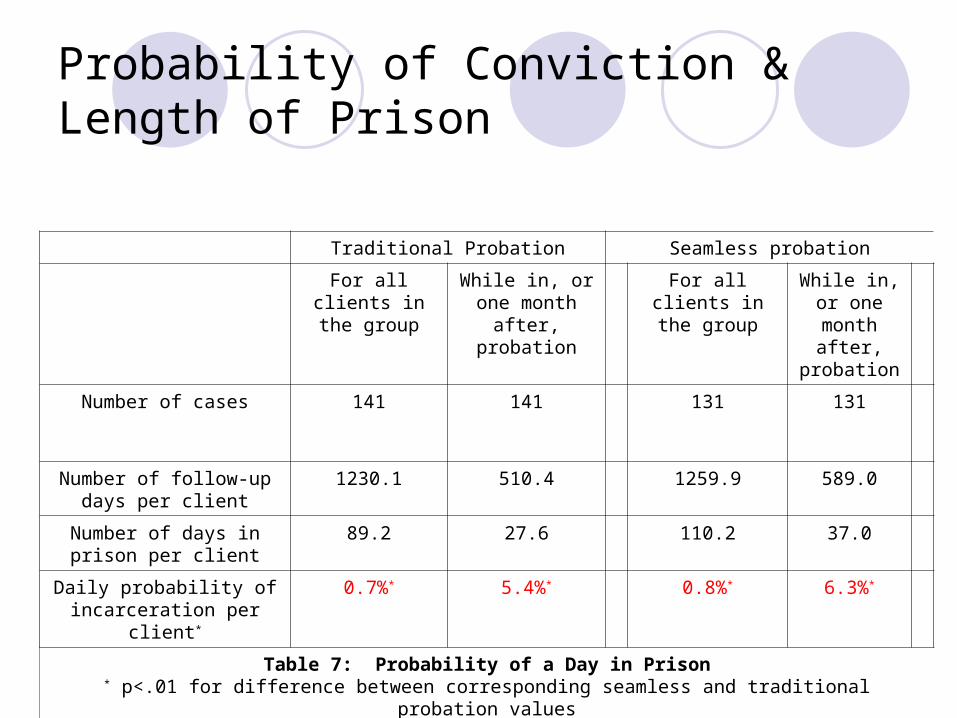
Probability of Conviction & Length of Prison
Traditional Probation Seamless probation
For all clients in the group
While in, or one month after,
probation
For all clients in the group
While in, or one month
after, probation
Number of cases 141 141 131 131
Number of follow-up days per client
1230.1 510.4 1259.9 589.0
Number of days in prison per client
89.2 27.6 110.2 37.0
Daily probability of incarceration per client*
0.7%* 5.4%* 0.8%* 6.3%*
Table 7: Probability of a Day in Prison* p<.01 for difference between corresponding seamless and traditional probation values
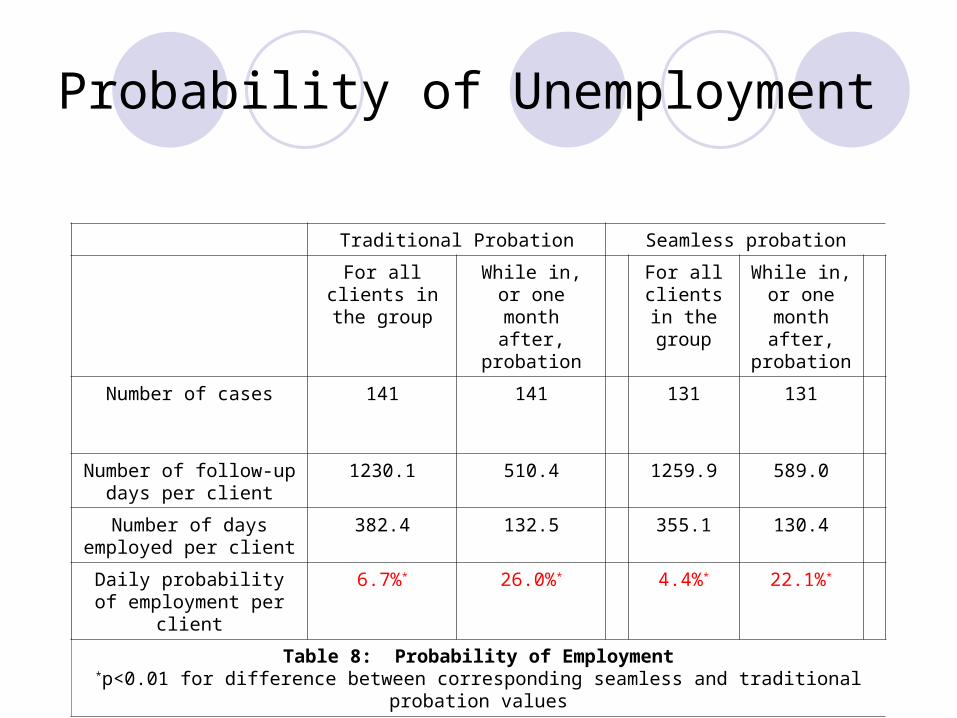
Probability of Unemployment
Traditional Probation Seamless probation
For all clients in the group
While in, or one month after,
probation
For all clients in the group
While in, or one month
after, probation
Number of cases 141 141 131 131
Number of follow-up days per client
1230.1 510.4 1259.9 589.0
Number of days employed per client
382.4 132.5 355.1 130.4
Daily probability of employment per client
6.7%* 26.0%* 4.4%* 22.1%*
Table 8: Probability of Employment*p<0.01 for difference between corresponding seamless and traditional probation values

Probability of Mental Illness
Traditional Probation Seamless probation
For all clients in the group
While in, or one month after,
probation
For all clients in the group
While in, or one month
after, probation
Number of cases 141 141 131 131
Number of follow-up days per client
1230.1 510.4 1259.9 589.0
Number of days in mental health hospital per client
0.20 0.03 1.0 0.7
Daily probability of hospitalization for mental
health per client
0.02%* 0.006%* 0.08%* 0.1%*
Table 9: Probability of Mental Health Hospitalization*p<0.01 for difference between corresponding seamless and traditional probation values
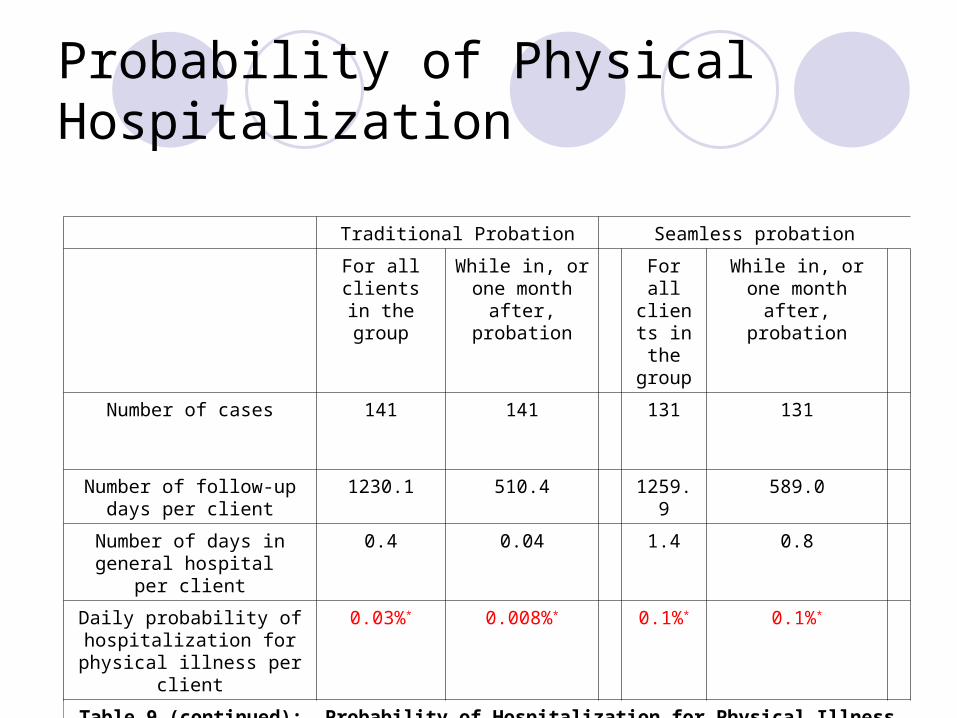
Probability of Physical Hospitalization
Traditional Probation Seamless probation
For all clients in the group
While in, or one month after,
probation
For all clients in the group
While in, or one month after,
probation
Number of cases 141 141 131 131
Number of follow-up days per client
1230.1 510.4 1259.9 589.0
Number of days in general hospital per client
0.4 0.04 1.4 0.8
Daily probability of hospitalization for physical
illness per client
0.03%* 0.008%* 0.1%* 0.1%*
Table 9 (continued): Probability of Hospitalization for Physical Illness*p<.01 for difference between corresponding seamless and traditional probation values
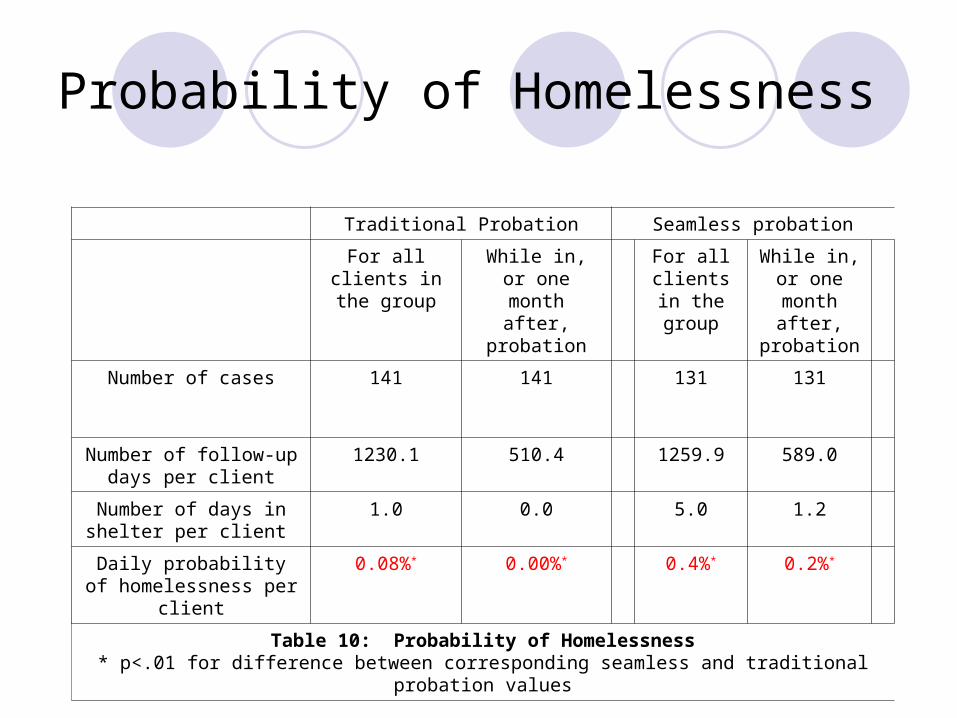
Probability of Homelessness
Traditional Probation Seamless probation
For all clients in the group
While in, or one month after,
probation
For all clients in the group
While in, or one month
after, probation
Number of cases 141 141 131 131
Number of follow-up days per client
1230.1 510.4 1259.9 589.0
Number of days in shelter per client
1.0 0.0 5.0 1.2
Daily probability of homelessness per client
0.08%* 0.00%* 0.4%* 0.2%*
Table 10: Probability of Homelessness* p<.01 for difference between corresponding seamless and traditional probation values
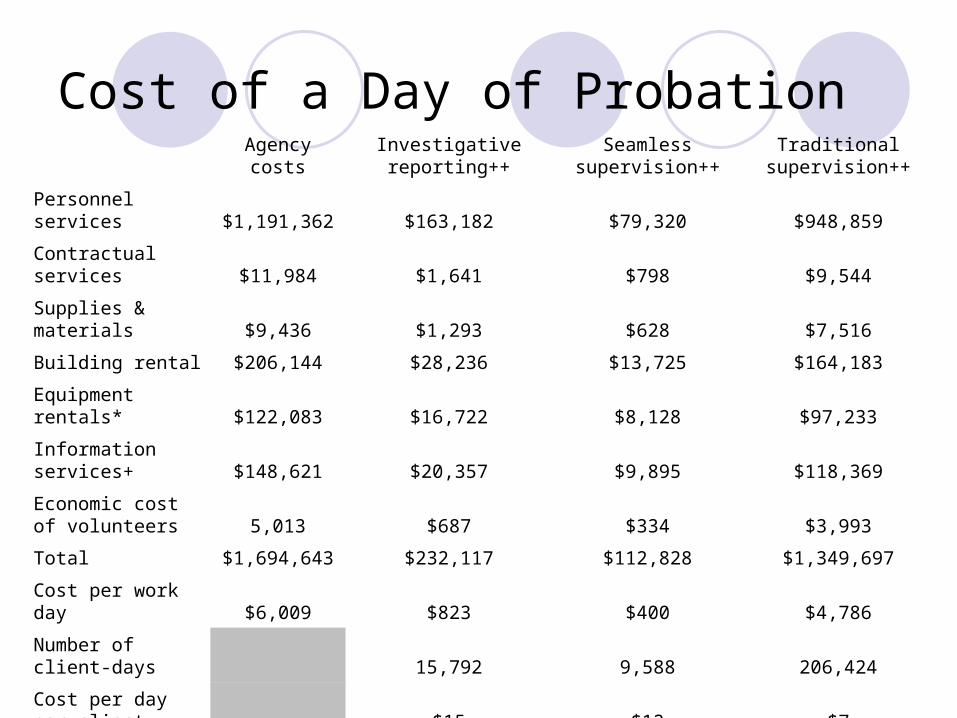
Cost of a Day of ProbationAgency costs
Investigative reporting++
Seamless supervision++
Traditional supervision++
Personnel services $1,191,362 $163,182 $79,320 $948,859
Contractual services $11,984 $1,641 $798 $9,544
Supplies & materials $9,436 $1,293 $628 $7,516
Building rental $206,144 $28,236 $13,725 $164,183
Equipment rentals* $122,083 $16,722 $8,128 $97,233
Information services+ $148,621 $20,357 $9,895 $118,369
Economic cost of volunteers 5,013 $687 $334 $3,993
Total $1,694,643 $232,117 $112,828 $1,349,697
Cost per work day $6,009 $823 $400 $4,786
Number of client-days 15,792 9,588 206,424
Cost per day per client $15 $12 $7
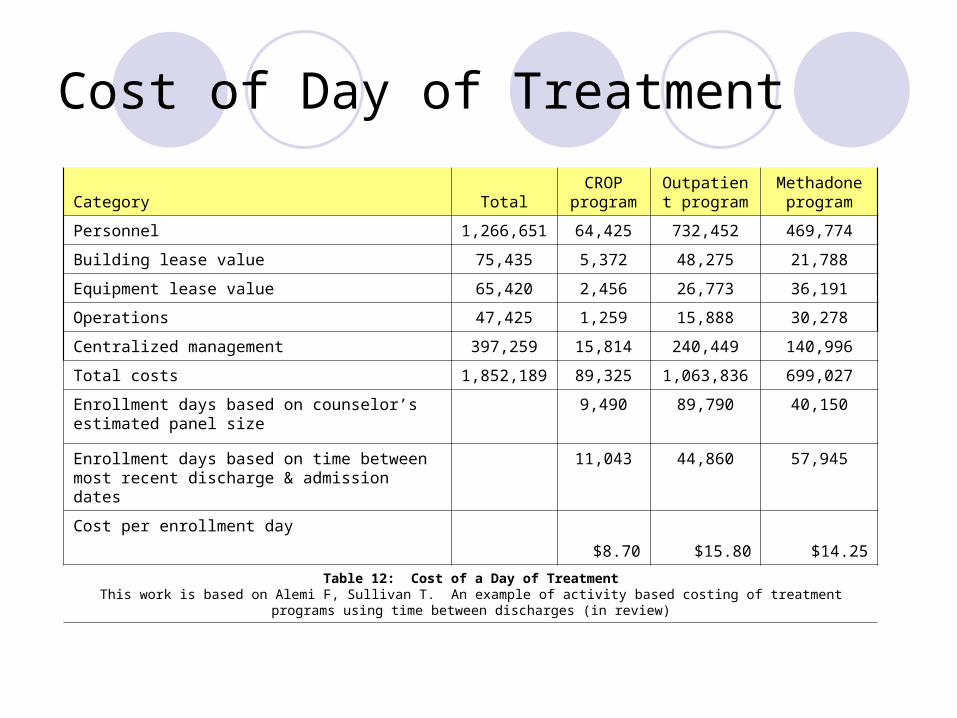
Cost of Day of Treatment
Category TotalCROP
programOutpatient program
Methadone program
Personnel 1,266,651 64,425 732,452 469,774
Building lease value 75,435 5,372 48,275 21,788
Equipment lease value 65,420 2,456 26,773 36,191
Operations 47,425 1,259 15,888 30,278
Centralized management 397,259 15,814 240,449 140,996
Total costs 1,852,189 89,325 1,063,836 699,027
Enrollment days based on counselor’s estimated panel size
9,490 89,790 40,150
Enrollment days based on time between most recent discharge & admission dates
11,043 44,860 57,945
Cost per enrollment day
$8.70 $15.80 $14.25
Table 12: Cost of a Day of TreatmentThis work is based on Alemi F, Sullivan T. An example of activity based costing of treatment programs using time between discharges (in review)
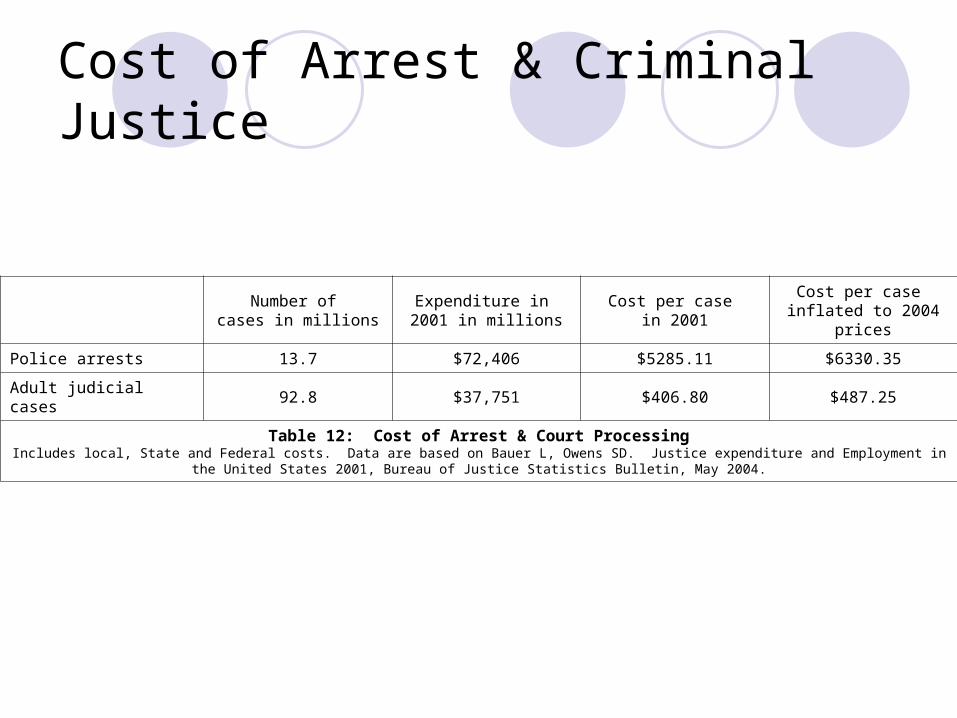
Cost of Arrest & Criminal Justice
Number of
cases in millionsExpenditure in 2001 in millions
Cost per case in 2001
Cost per case inflated to 2004 prices
Police arrests 13.7 $72,406 $5285.11 $6330.35
Adult judicial cases 92.8 $37,751 $406.80 $487.25
Table 12: Cost of Arrest & Court ProcessingIncludes local, State and Federal costs. Data are based on Bauer L, Owens SD. Justice expenditure and Employment in the United States 2001, Bureau of Justice Statistics
Bulletin, May 2004.
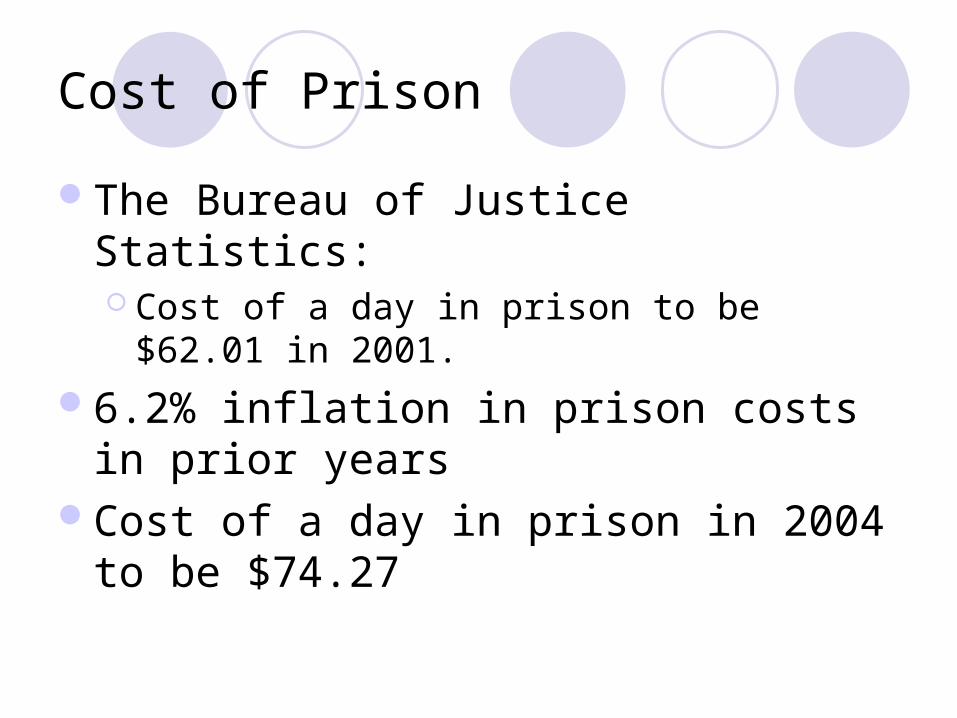
Cost of Prison
The Bureau of Justice Statistics: Cost of a day in prison to be $62.01 in 2001.
6.2% inflation in prison costs in prior years
Cost of a day in prison in 2004 to be $74.27
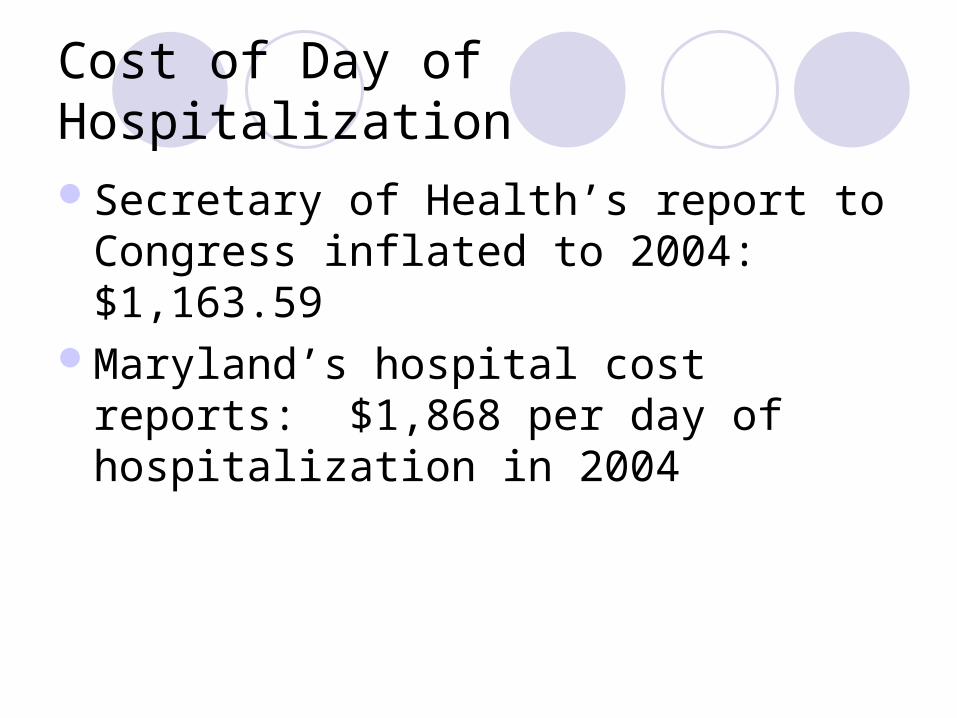
Cost of Day of Hospitalization
Secretary of Health’s report to Congress inflated to 2004: $1,163.59
Maryland’s hospital cost reports: $1,868 per day of hospitalization in 2004
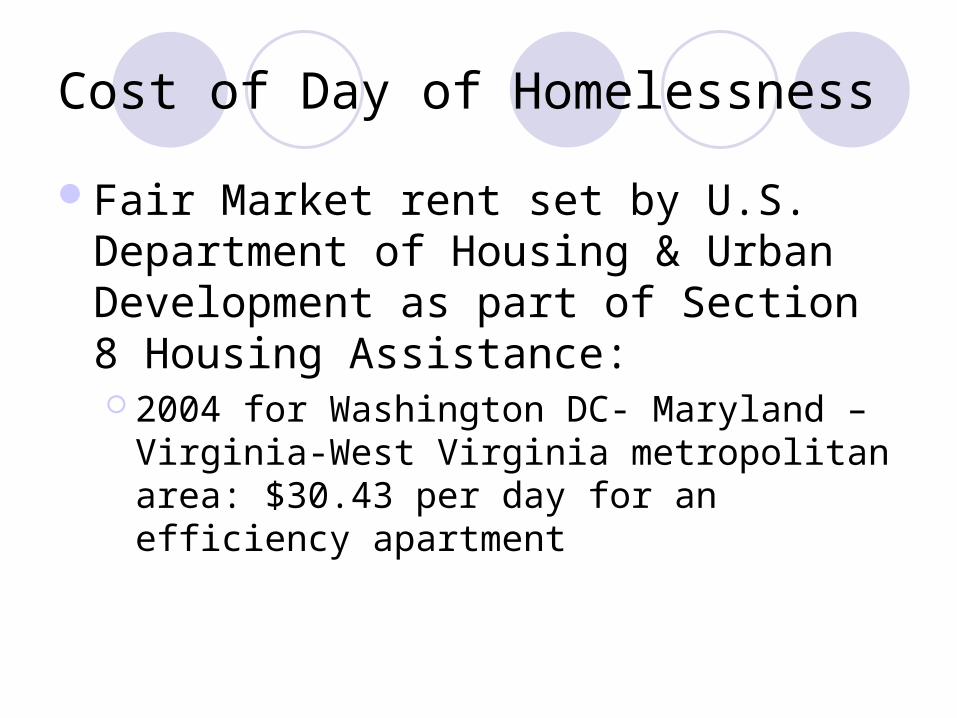
Cost of Day of Homelessness
Fair Market rent set by U.S. Department of Housing & Urban Development as part of Section 8 Housing Assistance: 2004 for Washington DC- Maryland –Virginia-
West Virginia metropolitan area: $30.43 per day for an efficiency apartment
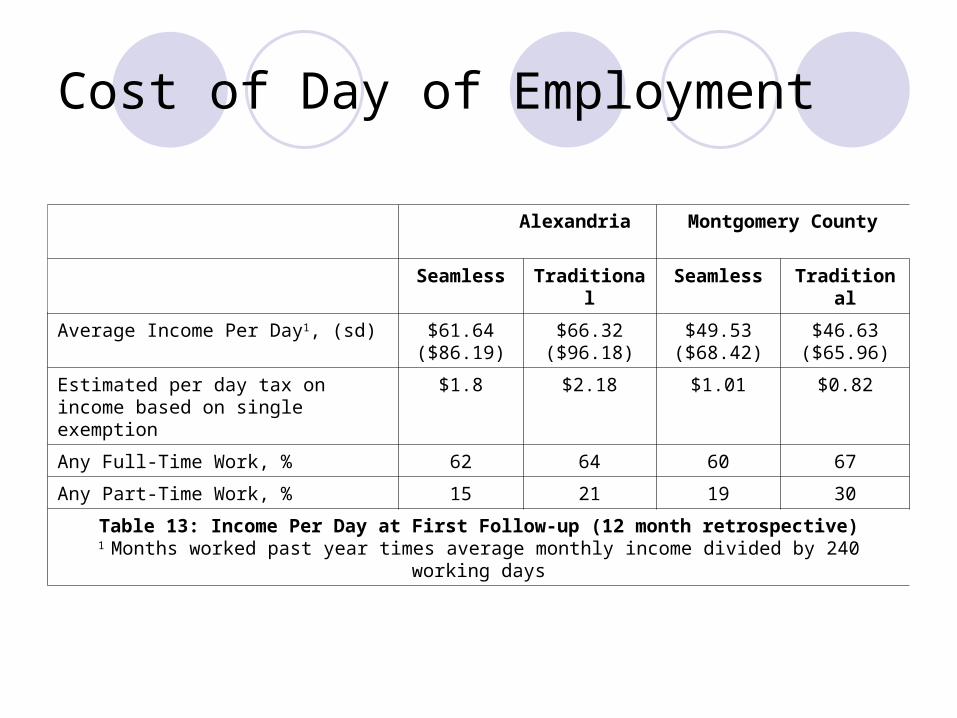
Cost of Day of Employment
Alexandria Montgomery County
Seamless Traditional Seamless Traditional
Average Income Per Day1, (sd) $61.64 ($86.19)
$66.32 ($96.18)
$49.53 ($68.42)
$46.63 ($65.96)
Estimated per day tax on income based on single exemption
$1.8 $2.18 $1.01 $0.82
Any Full-Time Work, % 62 64 60 67
Any Part-Time Work, % 15 21 19 30
Table 13: Income Per Day at First Follow-up (12 month retrospective)1 Months worked past year times average monthly income divided by 240 working days
So what?
Expected costs Does treatment pay for itself?
What if we have better treatment?What if supervision is longer?