cost effectiveness of stop smoking services in wirral · pdf filepage 1 cost effectiveness of...
TRANSCRIPT
Page 1 Cost effectiveness of smoking services in Wirral. Brendan Collins. October 2012 v1.5
Cost Effectiveness of Stop Smoking Services in Wirral
Version: 1.5
November 2012
Author: Brendan Collins, NHS Wirral / University of Liverpool
Please let me know what you think of this report here:
http://www.surveymonkey.com/s/DGGYY89
(Your answers are anonymous)
Version History
Version
Number
Date Author Reviewer Actions
0.5 14th
September 2012 Brendan Collins Kim Ozano Work in progress.
0.6 21st September 2012 Brendan Collins Kim Ozano Includes some information as
suggested by Kim.
1.0 3rd
October 2012 Brendan Collins Becky Mellor First draft
1.1 8th
October 2012 Brendan Collins Includes some
changes/suggestions made by
Becky.
1.2 17th
October 2012 Brendan Collins Chris Harwood Alan Haycox
Includes changes suggested by
Chris.
1.3 19th
October 2012 Brendan Collins Added in results of NICE ROI
tool.
1.4 13th
November 2012 Brendan Collins Fiona Johnstone Added in more info about NICE
model.
1.5 20th
November Brendan Collins Sarah Kinsella Reworded cost savings to local
authorities and fire services.
Citation:
Please cite this as
Collins, B. (2012) Cost Effectiveness of Stop Smoking Services in Wirral. Wirral.

Page 2 Cost effectiveness of smoking services in Wirral. Brendan Collins. October 2012 v1.5
Summary
Smoking is the biggest single cause of health inequalities in Wirral.
An economic model was used to estimate the impact of Public Health-
funded smoking cessation activity on health & economic outcomes for
2011/12 financial year.
The model showed that in the long term smoking cessation activity would
reduce disease prevalence, and produce some NHS cost savings.
The overall net cost per QALY (quality adjusted life year) was £11,590
which would be regarded as cost effective but is higher than other
published estimates for smoking cessation.
Inputting local data into a NICE Return on Investment Tool suggested that
over a lifetime the impact of interventions could be cost saving for the
health sector.
Triangulating this data with results from a Value for Money tool showed
that smoking and tobacco control activity produces cost savings for the
local services through reduced need for social care, reduced litter and
fewer fires caused by smoking.
Smoking cessation also produces quantifiable benefits to individuals
through reduced expenditure on cigarettes and benefits to employers in
terms of increased productivity.
The SROI (Social Return on Investment) Ratio was between £1.71 and
£2.43 for each pound spent.
This document also summarises the available data around smoking
prevalence in Wirral.
The cost effectiveness of interventions targeted at pregnant women, young
people and smokefree homes is also discussed.
Recommendations
1. It is recommended that smoking services should be considered on a regional scale more
often, for interventions to be more efficiently managed and delivered. It is difficult to
achieve the change in social norms needed for population level behaviour change while
working on a local footprint.
2. It is recommended that services are incentivised to record quit status at 6 months and 12
months.
3. Any incentives around smoking quitters need to be weighted towards the most hard to
reach and disadvantaged groups, including pregnant mothers and people with mental
health, alcohol and drug problems.
4. It is recommended that all services complete the database accurately, and that any
redundant fields are taken out, and that the Fagerström dependence score is recorded.

Page 3 Cost effectiveness of smoking services in Wirral. Brendan Collins. October 2012 v1.5
5. It is recommended that recording of pharmacotherapy treatment (i.e. NRT, Champix and
Zyban) is more made more consistent and detailed in the database.
6. Wirral should consider contacting or visiting areas like Leeds where smoking cessation
rates are high to get ideas, taking into account that what works in one population may
not transfer to Wirral which has high levels of deprivation, and may have a different
smoking culture than other areas.
7. It is recommended that more is done to de-normalise smoking around mental health
settings.
8. It is recommended that pharmacists are allowed to prescribe Champix directly to
increase quit rates in the most deprived areas.
9. It is recommended that services are tailored using new technologies to meet the needs
of young people.
10. It is recommended that joint interventions that target cannabis and tobacco smoking at
the same time are considered.
11. It is recommended that services are tailored to meet the needs of carers who may find it
hard to attend smoking cessation services, and may need additional help in finding
alternative ways of coping with stress.
12. Wirral should preserve its investment in smoking cessation services, which have a good
cost effectiveness profile through providing increased quality and length of life for
quitters, reducing health inequalities and producing cost savings to the NHS, local
authorities, employers and individuals.
13. Wirral should do more to improve the quit rate for pregnant smokers, which in 2011/12
was 23% compared to 45% nationally.
14. It is recommended that any future smokefree homes interventions targeted at families
consider the use of clinical markers like cotinine levels to counter smoker denial about
the effect of their smoking on family members.
15. The PbR (Payment by Results) Stop Smoking Service was relatively successful in
attracting clients from target groups, so should be considered as a future service model.
16. Future PbR services need to be able to prescribe Champix, which has the highest quit
rate, as this may be a lost opportunity otherwise.
17. Senior officers in Wirral should use their voice with national organisations to lobby for
more smoking legislation to create an environment that further decreases the social
acceptability of smoking.
18. Wirral should investigate measures to discourage outdoor smoking particularly near
schools, in parks, and in other areas where young people are likely to be.
19. Quitting smoking should be part of public sector culture.
Page 4 Cost effectiveness of smoking services in Wirral. Brendan Collins. October 2012 v1.5
1. Introduction
1.1 Purpose of document
The purpose of this document is to describe the results of an economic evaluation of stop
smoking services in Wirral. This is the first in a series of economic evaluations of public
health interventions to be carried out. The purpose of these evaluations is to inform future
commissioning decisions in a changing environment where public health is moving to local
authorities and the NHS commissioning structure has changed. The evidence base around
smoking and smoking interventions is vast and this study is not attempting to review all of
the evidence but rather give a broad introduction. There have been several prevalence
surveys done for Wirral which give more qualitative information about smoking behaviour,
and there have been mixed methods evaluations1 commissioned by and carried out by the
Wirral R&D team. This document will focus on smoking cessation services but will also
briefly look at smoking in pregnancy, services for younger people, and smokefree homes. It
will also look at social return on investment (SROI) and impact on Marmot priority areas.
1.2 Policy Context
The most recent key national policy document is ' Healthy Lives, Healthy People, a Tobacco
Control Plan for England (2011)' which followed 'A Smokefree Future: a Tobacco Control
Strategy for England' published a year earlier by the previous government in 2010, and
'Smoking Kills' published in 19982. There are several pieces of NICE Guidance which make
recommendations around smoking (see Box 1). Appendix 2 has a list of recommendations
from 'Healthy Lives, Healthy People'. The National Centre for Smoking Cessation and
Training3 is key organisation which was set up in 2009 to help improve the delivery,
management and commissioning of smoking cessation support services in England. The
NCSC has lots of information resources on its website.
Tobacco is an addictive substance, which individuals find hard to give up even when there
are clear health benefits, for instance 60% of people smoke again post-myocardial infarction,
50% smoke again post-laryngectomy (removal of the larynx following cancer), and 80% of
women do not stop smoking during pregnancy. Smoking is the major cause of preventable
illness and premature death. In the UK, around 1 in 5 people smoke, and smoking causes
around 100,000 deaths per year. Smoking still kills more people than obesity and alcohol put
together. Treating smoking-related diseases was estimated to cost the NHS £5.2billion per
year in 2005/064, and the wider economy £2.5 billion in sick leave and lost productivity. A
report by the Policy Exchange in 20105 (see Appendix 2 for a list of recommendations from
this report) estimated the total cost to society of smoking to be £13.74 billion. This includes
the £2.7bn cost to the NHS but also the estimated loss in productivity from smoking breaks
1 http://info.wirral.nhs.uk/intelligencehub/surveysandqualitativeinformation.html - has results of smoking prevalence
surveys and evaluation of Quit Stop Wirral – a smoking incentive scheme 2 HM Government (1998) Smoking Kills: A White paper on tobacco
3 http://www.ncsct.co.uk/
4 Allender, S. (2009) The burden of smoking-related ill health in the UK. Tobacco Control 18:262-267
doi:10.1136/tc.2008.026294 5 Nash, R & Featherstone H. (2010) Cough Up: Balancing tobacco income and costs in society. Policy Exchange, 2010
http://www.policyexchange.org.uk/publications/publication.cgi?id=182

Page 5 Cost effectiveness of smoking services in Wirral. Brendan Collins. October 2012 v1.5
(£2.9bn) and increased absenteeism (£2.5bn). Other costs include: cleaning up cigarette
butts (£342 million), the cost of fires (£507m), the loss of economic output from the death of
smokers (£4.1bn) and passive smokers (£713m). Based on apportioning this on smoking
prevalence (Wirral has 0.7% of England’s smokers) the cost per year for the Wirral economy
is £80million. A smoking reckoner commissioned by ASH put the cost at £95.1million for
2012 (see Box 3). Smokers pay c. £10billion per year in duty to the revenue; however this
revenue would not be all lost if people did not smoke as they may spend their money on
other taxable goods and services that may benefit the economy more. It is fair to argue that
smoking generates a net loss to society, both economically, and through causing more
human suffering than pleasure. Most smokers regret taking up smoking and want to quit.
1.3 Smoking & Health Inequalities
Smoking remains the biggest cause of health inequalities. Any efforts to reduce health
inequalities need therefore to focus on smoking prevalence as a priority. Smoking causes
health inequalities in several ways; the ill health from smoking reduces individual lifespan
and capacity to work; watching relatives die young has an emotional impact; and also
smoking is expensive, households on income support who smoke spend 15% of their
disposable income on tobacco, meaning they are more likely to go without other essential
items6. Reducing the gap between rich and poor in smoking prevalence will go a great way
towards reducing the gap between rich and poor in premature death rates. A paper by the
Kings Fund looked at how 4 unhealthy lifestyle behaviours (smoking, excessive alcohol use,
poor diet, and low levels of physical activity) clustered together and were more prevalent in
the most deprived populations7. This paper recommended that public health policies and
interventions need to be more holistic and integrated to successfully reduce health
inequalities.
6 Acheson D. (1998) Independent inquiry into inequalities in health. London: The Stationery Office, 1998.
7 Buck D, Frosini F. Clustering of unhealthy behaviours over time. Implications for policy and practice. The King's Fund. August
2012. http://www.kingsfund.org.uk/sites/files/kf/clustering-of-unhealthy-behaviours-over-time-appendices.pdf
Box 1. NICE & Public Health
Since 2001, NICE (The National Institute for Health and Clinical Excellence) has advised the NHS on whether it
should provide new treatments. It was formed to stop the 'postcode lottery' where some treatments were available
in some parts of the country but not others. Since 2005 NICE has also produced public health guidance, the first
one of which was on smoking. NICE have 8 documents with recommendations around smoking:
Quitting smoking in pregnancy and following childbirth. NICE public health guidance 26 (2010) School-based interventions to prevent smoking. NICE public health guidance 23 (2010) Identifying and supporting people most at risk of dying prematurely. NICE public health guidance 15 (2008) Preventing the uptake of smoking by children and young people. NICE public health guidance 14 (2008) Smoking cessation services. NICE public health guidance 10 (2008) Workplace interventions to promote smoking cessation. NICE public health guidance 5 (2007) Brief interventions and referral for smoking cessation. NICE public health guidance 1 (2006) Varenicline for smoking cessation. NICE technology appraisal 123 (2007)

Page 6 Cost effectiveness of smoking services in Wirral. Brendan Collins. October 2012 v1.5
The UK Government has used public health policy measures like increasing the cost of
tobacco at a faster rate than inflation, banning tobacco advertising (2002), raising the
minimum smoking age from 16 to 18 (2007), banning smoking in indoor public places
(2007), putting pictorial health warnings on tobacco packaging (2008) and banning tobacco
vending machines (2011). These measures have contributed to reduced smoking
prevalence, and the ban on smoking in public places was associated with a reduced rate of
heart attacks8. Future measures being considered include banning smoking in cars, having
plain packaging for tobacco products (which will mean that packaging is less likely to make
smokers think ‘mild’ brands of cigarettes are safer), and increasing availability of
pharmacotherapy products. A nationally marketed quit event called 'Stoptober' is planned for
October 2012. With advertising banned, tobacco companies have been accused of turning to
increasingly sophisticated, under the radar, ‘guerrilla’ marketing methods to keep their
products in the public eye, and promote their products to young people as being cool or
rebellious9. Most people take up smoking at a young age so interventions targeted at
reducing uptake by de-normalising smoking, like the ASSIST programme, could potentially
be more effective than supporting people who have already taken up smoking to quit.
70% of smokers would like to stop and many try going “cold turkey”. Many people do
succeed in quitting smoking on their own. NHS Stop Smoking services, which rolled out
nationally in 2000, were developed to help those smokers who need more support to quit.
NHS Stop Smoking Services generally attract smokers with a higher level of dependency,
which can make the services seem less effective than they actually are10. Public health-
commissioned smoking services have been shown to be highly cost effective and aim to
treat 3-5% of the smoking population per year11. Services which are more intense offer the
greatest chance of success but reach smaller numbers of smokers12. The cost effectiveness
8 Sims M, Maxwell R, Bauld L, Gilmore A. (2010)Short term impact of smoke-free legislation in England: retrospective
analysis of hospital admissions for myocardial infarction. BMJ 340:c2161 9 Soulos G, Sanders S. (2004) Promoting tobacco to the young in the age of advertising bans. NSW Public Health Bulletin
Volume 15, Number 5-6. 10
Kotz, D., J. Fidler, and R. West, (2009) Factors associated with the use of aids to cessation in English smokers. Addiction, 104(8): p. 1403-10. 11
Jarvis MJ, McIntyre D, Bates C, Foulds J. (2002) Effectiveness of smoking cessation initiatives. BMJ 324:608. 12
Smoking Toolkit Study, www.smokinginengland.info
Box 2. The quitting timeline
What happens when you quit smoking
After 20 minutes your blood pressure and pulse return to normal.
After 24 hours your lungs start to clear.
After two days your body is nicotine-free and your sense of taste and smell improve.
After three days you can breathe more easily, and your energy increases.
After two to 12 weeks, your circulation improves.
After three to nine months coughs, wheezing and breathing improves.
After one year your heart attack risk is half that of a smoker.
After 10 years your lung cancer risk is half that of a smoker.
Source: NHS Choices website

Page 7 Cost effectiveness of smoking services in Wirral. Brendan Collins. October 2012 v1.5
of services is typically assessed using the carbon monoxide validated quit at 4 weeks as a
proxy measure. Current estimates of 12 month success rates vary from 1% for brief
intervention to 31% for Varenicline (Champix) with specialist group behavioural support13.
1.4 What kind of reductions in smoking prevalence can be achieved?
Smoking prevalence has been falling in the UK since the 1970s and would probably continue
to fall (although some evidence suggests that smoking prevalence increases in a recession,
and smoking prevalence increased in Ireland around 2004 when smoking became more
affordable), so the ambition of policy interventions as well as local programmes is to
accelerate that fall in smoking prevalence until smoking is a niche activity or does not
happen at all. Smoking prevalence in New York City has fallen from 21% in 2001 to 14% in
2010 which shows what kind of reduction can be achieved with the right kind of sea change
in attitudes around smoking14. One thing that was recommended in the West Midlands pilot
of Payment by Results (PbR) smoking services was that that PbR behaviour change
interventions should be commissioned on a regional scale so that potential new providers
are attracted by the scale of the market and so that there are economies of scale in
responding to challenges. Unfortunately this has not been possible yet for Wirral.
Recommendation 1: It is recommended smoking services should be considered on a
regional scale more often, for interventions to be more efficiently managed and delivered. It
is difficult to achieve the change in social norms needed for population level behaviour
change while working on a local footprint.
1.5 Rationale for Economic Evaluation
Smoking & tobacco control activity makes up a large proportion of the public health budget.
Getting value for money out of smoking services is therefore important. Some individuals
see smoking as a lifestyle choice where the state should not step in to help people quit, so
demonstrating that services are cost effective in terms of preventing healthcare costs is
important. This way the economic argument can be made for stop smoking services, even if
individuals think that morally the state should not help people who have chosen to take up
smoking. Some people think almost the opposite, i.e. that smokers should be incentivised to
quit if this helps to reduce the number of people smoking in the population. Giving people a
relatively small cash incentive can be effective because it gives them a rational reason to
explain to their peer group why they are going against the social norms of the group by no
longer smoking.
Also with this type of economic analysis, services that are more cost effective can be
expanded while services that are less cost effective can be given advice to improve, or
investment can be shifted from less to more cost effective services. NHS Stop Smoking
Services have generally been very cost effective, but it may be in future there are different
ways of delivering it, for example Wirral has had a pilot of a Payment by Results (PbR)
smoking service, whereby instead of paying for the service, Wirral paid for the number of
13
West R, Owen L (2012) Estimates of 52-week continuous abstinence rates following selected smoking cessation interventions in England. www.smokinginengland.info Version 2 14
http://www.nyc.gov/html/doh/downloads/pdf/epi/databrief12.pdf

Page 8 Cost effectiveness of smoking services in Wirral. Brendan Collins. October 2012 v1.5
quitters at 4 weeks and 12 weeks. Historically Stop Smoking Services only had 4 week
quitter targets, and this is still the case nationally. This Payment by Results approach means
that providers are being paid for outcomes rather than outputs, although there may be a risk
with PbR of providers not working with clients who they do not think will succeed, which
could be those experiencing the worst health inequalities, like those with mental health
problems or women who are more likely to continue smoking in pregnancy. So it may be that
additional incentives need to be set at a level to make it worthwhile for providers to target all
health inequalities.
Recommendation 2: It is recommended that services are incentivised to record quit status
at 6 months and 12 months.
Recommendation 3: Any incentives around smoking quitters need to be weighted towards
the most hard to reach and disadvantaged groups, including pregnant mothers and people
with mental health, alcohol and drug problems.
Box 3. Results from ASH Reckoner, ‘The Cost of Local Tobacco Control’ 2012.

Page 9 Cost effectiveness of smoking services in Wirral. Brendan Collins. October 2012 v1.5
1.6 Smoking Database
Since 2011, all stop smoking activity in Wirral has been recorded on one database (the Quit
with us database). This database is quite comprehensive and includes:
1. Demographic data about people using services like date of birth, age, gender and
postcode, ethnicity, deprivation group, socio-economic classification, employment
status and type of employment.
2. Quit method – i.e. Zyban, Champix, NRT or combinations. It is not clear how reliably
or consistently this is recorded. Combination NRT is more effective than one NRT
method15 so better recording of NRT method would be valuable.
3. Medical conditions – recorded for 1,844 out of 8123 clients for 2011/12. The most
common medical conditions recorded are respiratory problems (801 people), mental
health issues (630), high blood pressure (403) and heart problems (205).
4. Referral date and quit attempt date.
5. Carbon monoxide (CO) reading for some clients.
6. Whether someone has quit successfully at four weeks and whether it has been
validated with CO reading.
7. Whether someone has quit at 12 weeks (recorded for some clients); whether
someone has quit at 26 or 52 weeks (not generally recorded).
8. Type of intervention delivered - Closed Groups; Drop In; Family/Couples; One To
One; Open Groups; Telephone Support.
9. Type of intervention setting, typically Stop Smoking Service, Pharmacy, Primary Care
or Other; where other is split mainly between HAAs, Quit Stop, Solutions for Health,
external provider, third sector, health service in schools.
10. Fagerström Nicotine Dependence test data is recorded for around 50% of clients.
11. Number of cigarettes smoked per day is recorded for around 40% of clients – the
average is 18.3 cigarettes per day. 14% of clients were recorded as smoking 30 or
more cigarettes per day.
12. Years smoked and number of pack years is recorded for at least 16% of clients – the
database has lots of zeros which could be zero years smoked or could be not
recorded. The average number of years smoked excluding zeros is 17.85 years.
13. Whether or not someone smokes at home, in the car, or lives with children (recorded
for around 50% of clients).
The database does not include costing data for the service.
Recommendation 4: It is recommended that all services complete the database accurately,
and that any redundant fields are taken out, and that the Fagerström dependence score is
recorded.
Recommendation 5: It is recommended that recording of pharma products is more made
more consistent and detailed in the database.
15
Stead LF, Perera R, Bullen C, Mant D, Lancaster T. (2008) Nicotine replacement therapy for smoking cessation. Cochrane Database Syst Rev:CD000146.

Page 10 Cost effectiveness of smoking services in Wirral. Brendan Collins. October 2012 v1.5
1.7 Smoking, and the EQ-5D (General health related quality of life
questionnaire) and WEMWBS (Warwick Edinburgh Mental Wellbeing Scale)
At the moment the database does not record general health and wellbeing outcomes such
as the EQ-5D (Euroqol 5-dimension) or WEMWBS (Warwick-Edinburgh Mental Wellbeing
Scale). These would allow direct estimation of QALYs (quality adjusted life years) gained
through smoking cessation (at the moment the model uses indirect estimates drawn from the
literature)and also measure of change in subjective wellbeing (SWB) (using WEMWBS) as a
result of the intervention. It is hoped that these will be collected in future and further analysis
can be undertaken using this data, and this will be included in an updated version of this
report in 2013 which will look at how individual’s experience of health related quality of life
and subjective wellbeing improves as a result of quitting smoking. These data are also being
collected as part of the smoking prevalence survey for 2012.
Figure 1 shows average EQ-5D and SWEMWBS (Short Warwick Edinburgh Mental
Wellbeing Scale) for smokers, ex-smokers and people who have never smoked. The
average EQ-5D general health score is higher in ex-smokers than smokers, and highest in
people who have never smoked. The average SWEMWBS subjective wellbeing score is
higher in ex-smokers than current smokers or people who have never smoked. These
scores are not age standardised, so will be confounded by the fact that ex-smokers are older
on average than smokers, and smokers are more likely to come from deprived areas than
people who have never smoked.
Figure 1. Average EQ-5D general health related quality of life score, and average
SWEMWBS Score.
Source: Raw data from Wirral wellbeing survey, 2009.
27
27.2
27.4
27.6
27.8
28
28.2
28.4
0.72
0.73
0.74
0.75
0.76
0.77
0.78
0.79
0.8
0.81
current smoker ex smoker never smoked
Average SWEMWBS
Average EQ-5D
Category
EQ-5D SWEMWBS

Page 11 Cost effectiveness of smoking services in Wirral. Brendan Collins. October 2012 v1.5
1.8 Targets and Key Performance Indicators
The local targets and KPIs for smoking are shown in Table 1. The achievement is for all of
Wirral’s Stop Smoking Services, for 2011/12. Wirral has not met any of these targets for
2011/12. Wirral’s 4 week quit rate was 42%, which was less than the national average of
49%. The national range was from 34% in Blackpool to 71% in Leeds.
Recommendation 6: Wirral should consider contacting or visiting areas like Leeds where
smoking cessation rates are high to get ideas, taking into account that what works in one
population may not transfer to Wirral which has high levels of deprivation, and may have a
different smoking culture than other areas.
Table 1. Local targets and KPIs for smoking, shown with performance for 2011/12 financial year.
4 Week Quits: Achievement Target
4 week smoking quitters 3381 4500
Quit dates set 8134 NA
4 week quit rate (%) 42% 45%
12 month quit rate (%) 8% NA
% successful quitters CO-verified 69% 85%
Successful 4 week quitters who are pregnant 21 65
Successful 4 week quitters from 20% deprived areas 54% 70%
Successful 4 week quitters who have never worked, been
unemployed for over 1 year, retired or from a routine and manual
occupation
1804 2000
Successful 4 week quitters from Mental Health agency or setting
and/or who have a mental health condition 244 NA
Successful 4 week quitters referrals from
Secondary Care NA NA
Successful 4 week quitters aged 18-24 (from Quit Stop Wirral) 29 360
Source: Sue Morris, Wirral Community Trust.
It is commendable that Wirral has recognised that targeted interventions are needed for
specific groups like individuals with mental health problems, pregnant women and young
routine and manual workers. People with severe mental health problems are much more
likely to smoke than the general population particularly inpatients and people in institutions. 16 There has been a long term assumption that people with mental health problems use
cigarettes to self-medicate and that smoking cessation comes low down a list of priorities for
someone with a mental health problem. Moreover, people in institutional settings can face
barriers to accessing services. Having a high proportion of staff who smoke can also
contribute to a lack of buy-in to adhering to smokefree policies and trying to treat nicotine
dependence.17
Recommendation 7 : It is recommended that more is done to de-normalise smoking around
mental health settings.
16
Olivier D, Lubman DI, Fraser R. Tobacco smoking within psychiatric inpatient settings: biopsychosocial perspective. Aust & NZ J Psych 2007; 41: 572-580 17
ASH (2011) Smoking and Mental Health. http://www.ash.org.uk/files/documents/ASH_120.pdf
Page 12 Cost effectiveness of smoking services in Wirral. Brendan Collins. October 2012 v1.5
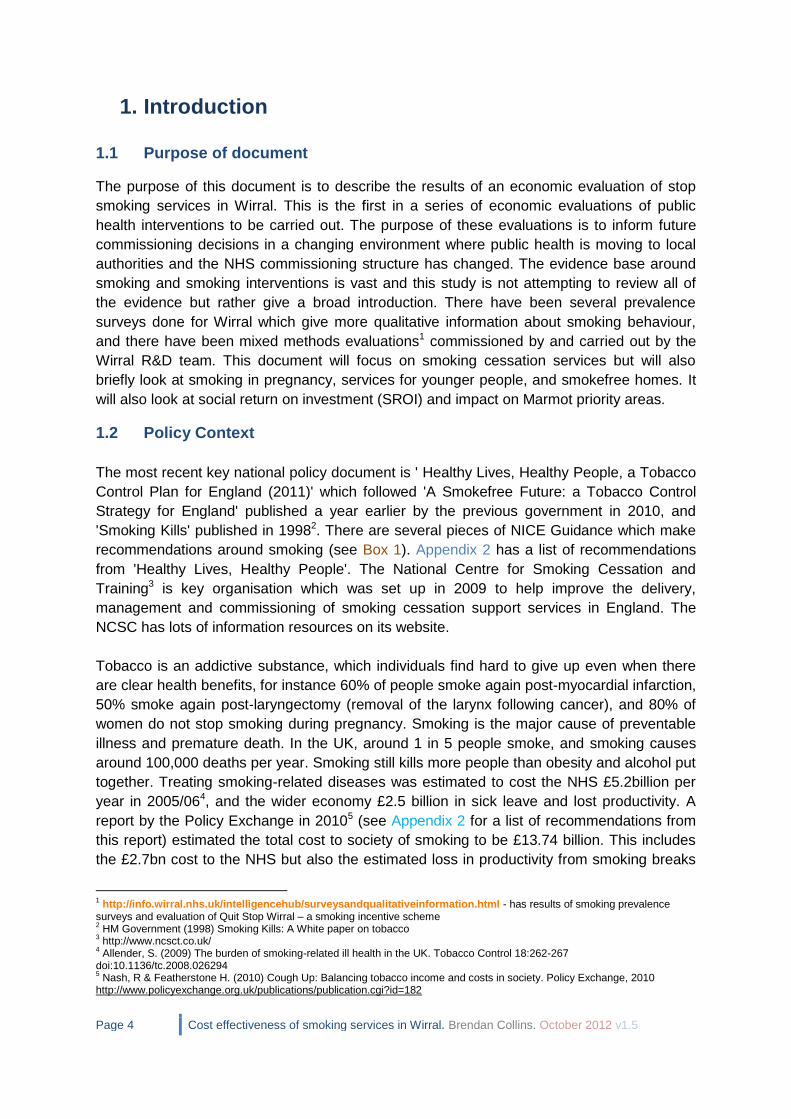
The target for quitters was set without the total number of smokers being known, and has
been revised down to 3,650 for 2012/13 based on work carried out to find out the total pool
of smokers and number of quitters for Wirral. Table 2 shows the number of four week
quitters achievable via different numbers attending services. Most services achieve
diminishing returns so there is a compromise between trying to get as many people as
possible through the door and trying to get a high proportion of quitters.
Table 2. Number of 4 week quitters achievable by number attending and percentage of quitters.
Number of 4 week quitters
Number attending smoking cessation services
4-w
eek q
uit ra
te
5000 5500 6000 6500 7000 7500 8000 8500 9000
35% 1750 1925 2100 2275 2450 2625 2800 2975 3150
36% 1800 1980 2160 2340 2520 2700 2880 3060 3240
37% 1850 2035 2220 2405 2590 2775 2960 3145 3330
38% 1900 2090 2280 2470 2660 2850 3040 3230 3420
39% 1950 2145 2340 2535 2730 2925 3120 3315 3510
40% 2000 2200 2400 2600 2800 3000 3200 3400 3600
41% 2050 2255 2460 2665 2870 3075 3280 3485 3690
42% 2100 2310 2520 2730 2940 3150 3360 3570 3780
43% 2150 2365 2580 2795 3010 3225 3440 3655 3870
44% 2200 2420 2640 2860 3080 3300 3520 3740 3960
45% 2250 2475 2700 2925 3150 3375 3600 3825 4050
Source: Chris Harwood, NHS Wirral.
The dataset used for the model has 11 fewer clients (8,123) and 3 fewer quitters (3,379)
than shown in Table 1. The most likely reason for this is due to clients being entered onto
the system after the extract for the model was made.

Page 13 Cost effectiveness of smoking services in Wirral. Brendan Collins. October 2012 v1.5
1.9 National Targets around smoking prevalence
The first Public Health Outcomes Framework was published in January 2012, which is a set
of indicators around public health and health inequalities which will be measured from 2013-
2016. In the Public Health Outcomes Framework there are three target domains around
smoking, wherein local authorities will be measured on their performance in reducing
smoking prevalence in 15 year olds, adults, and pregnant women. The domains are;
2.3 Smoking status at time of delivery per 100 maternities (National target is
to reduce from a 2010 baseline of 14% to 11% or less by 2015, most recent
for Wirral is 13.2%)
2.9 Prevalence of smoking among 15 year olds (National target is to reduce
from a 2010 baseline of 15% to 12% or less by 2015 – we do not currently
have a way of measuring this for Wirral)
2.14 Prevalence of smoking among persons aged 18 years and over (National
target is to reduce from a 2010 baseline of 21.2% to 18.5% or less by 2015,
currently for Wirral prevalence is 23%).
These targets came from ‘Healthy Lives, Healthy People, a Tobacco Control Plan for
England’ (2011)18. Significantly, it is not known whether numbers of 4-week smoking quitters,
which have previously been a target in the NHS Outcomes Framework, will be a target in
future. This may change smoking policy away from trying to hit the smoking quitters target
to other strategies like reducing uptake.
1.10 Smoking Prevalence in Wirral
Surveillance of health and risk factors are a key part of public health practice. Measuring
smoking uptake, prevalence and behaviour is important in understanding the needs of the
population regarding future prevalence of smoking-related diseases, need for smoking
cessation support, and understanding how successful population level policy measures have
been. For example one thing we know locally is that following the ban on smoking in public
places there was a big increase in the number of people quitting smoking. We know
nationally that while sales of cigarettes have halved in the past 15 years, sales of loose
tobacco have doubled. There was pressure to include a question about smoking in the most
recent Census but in the end it did not happen. There is evidence that surveys
underestimate the true prevalence of smoking in England by 2.8%.19
Historically, accurate information regarding the prevalence of smoking in Wirral has been
scarce. Since 2009, however, several surveys have been conducted looking at different
aspects of smoking in Wirral and these have produced useful information. There are now
several sources of data for smoking prevalence in Wirral. The main intelligence resource for
18
http://www.dh.gov.uk/en/Publicationsandstatistics/Publications/PublicationsPolicyAndGuidance/DH_132358 19
West, R., et al., (2007) Can we trust national smoking prevalence figures? Discrepancies between biochemically assessed
and self-reported smoking rates in three countries. Cancer Epidemiol Biomarkers Prev, 216(4): p. 820-2

Page 14 Cost effectiveness of smoking services in Wirral. Brendan Collins. October 2012 v1.5
Wirral is the Joint Strategic Needs Assessment (JSNA).20The main sources of prevalence
data are;
Local prevalence survey and panel survey – these have been carried out over the
last four years, focussing on the most deprived areas, with around 3,500
respondents. These have shown a fall in smoking prevalence in the most deprived
areas.
Local wellbeing survey – last carried out in 2009, this included questions on smoking
and also about cannabis use. This survey also included questions on general health
and wellbeing (including EQ-5D and WEMWBS) which can be measured against
smoking status.
Local lifestyle surveys – these have been carried out periodically over time, although
seem to underestimate smoking prevalence when compared to other surveys.
The Integrated Household Survey (IHS) – see Table 3. This has been carried out
nationally since April 2009 and measures smoking prevalence for adults aged 16 and
over. The most recent data is for January to December 2011, with data for 1,652
people from Wirral. The IHS will also contain smoking prevalence data for routine and
manual worker groups. The IHS is the largest social survey produced by ONS with
over 420,000 respondents nationally - the biggest pool of UK social data after the
census. All IHS statistics are designated as experimental at the moment, which
means they are new official statistics that are still being evaluated.
Smoking at delivery data - is collected by the NHS Information Centre, quarterly since
2002.
Quality and Outcomes Framework (QOF) Data – General Practitioners get paid
through QOF for having a record of smoking status for patients aged 15 and over,
and for having offered advice and support to quit smoking. This was previously only
collected for certain long term conditions, like CHD and diabetes.
Synthetic Estimates – synthetic estimates were last produced in 2010 based on
Health Survey for England data for 2006-08. These went down to MSOA level
(Middle-layer super output area, a statistical area with a population of c.7,500) so
were useful for estimating smoking at a small area level. Based on this, Wirral had a
total smoking prevalence of 21.5%, which varied at MSOA level between 7.6% and
44.4%. This is shown in Map 1. As is the case at a higher geographical level,
smoking is highly correlated with deprivation in Wirral.
HELP Survey – this is carried out on 10 and 11 year old children and includes a
question on smoking. The percentage of children identifying themselves as having
smoked in these surveys is low and subject to a lot of uncertainty.
Table 3. Smoking prevalence from IHS, January-December 2011.
Current smoker
Ex-smoker
Never smoked
Wirral (age 18+) 23.0% 33.7% 43.3%
Source: ONS, August 2012.
20
http://info.wirral.nhs.uk/ourjsna/

Page 15 Cost effectiveness of smoking services in Wirral. Brendan Collins. October 2012 v1.5
Map 1. Smoking prevalence by MSOA (Middle Layer Super Output Area) in Wirral, based on Health
Survey for England synthetic estimates from 2006-08 data.
Source: APHO (Association of Public Health Observatories) 2012.
1.11 Research Question
This paper is determining whether smoking services in Wirral represent a cost-effective use
of resources, when compared to a do-nothing alternative. A separate economic evaluation
was done of the Payment by Results (PbR) pilot, this is shown in Appendix 4.
1.12 Description of All Smoking Interventions
Figure 2 shows the interventions included in the smoking cessation programme for Wirral
2012-13. These are not necessarily the same as those included in this evaluation as this
evaluation is mainly looking retrospectively at services that have been provided in 2011/12
financial year. Most interventions are around smoking cessation, although there are
interventions around tobacco control (stopping sales of illegal and illicit tobacco, or sales to
under 18s), ASSIST (a peer-led intervention aimed at changing social norms amongst year 8
adolescents to reduce young people taking up smoking), smokefree homes (an intervention
to reduce smoking in the home, particularly for individuals with families). There are other
broad interventions like the Health Action Areas (HAAs) and Health Service in Schools
(HSIS) that include smoking cessation.

Page 16 Cost effectiveness of smoking services in Wirral. Brendan Collins. October 2012 v1.5
Figure 2. Interventions in smoking cessation programme for Wirral, 2012/13 financial year.
Source: Kim Ozano
1.13 Stop Smoking Services – Description of interventions
In 2011/12 the main categories of stop smoking services (i.e. services to help smokers to
give up) are the core Stop Smoking Service (SSS) provided by Wirral Community Trust,
which includes the pharmacy and primary care service, the 16-24 programme provided by
ARCH Initiatives, the PbR (Payment by Results) pilot provided by Solutions for Health (S4H),
the Third Sector services, and the smoking in pregnancy service provided by S4H.
Referrals came from several sources including GPs and hospitals. The biggest sources of
referral were self-referral (77% of clients) and Quit Stop Wirral (17% of clients). General
Practitioners and Practice Nurses were recorded as accounting for around 2.5% of referrals.
GPs and Quit Stop Wirral had a slightly higher proportion of referrals from the most deprived
areas than the other routes of referral. A social marketing campaign has been commissioned
to change social norms in Wirral University Hospital Trust so that the hospital is associated
with non-smoking for patients, staff and visitors. The hospital also have been provided with
NRT on the wards, which can have benefits even in people stopping smoking for short
periods of time, such as following surgery.

Page 17 Cost effectiveness of smoking services in Wirral. Brendan Collins. October 2012 v1.5
Stop smoking interventions used a mixture of settings; these were closed groups; drop in;
family/couples; one to one; open groups; telephone support. The most used were one to one
and drop in; this is shown in Table 4.
Table 4. Proportion of clients by type of intervention.
Type of intervention Proportion of clients
One To One 64.61%
Drop In 23.27%
Telephone Support 5.97%
Closed Groups 2.93%
Open Groups 2.71%
Family/Couples 0.52%
Total 100.00%
Source: Quit With Us database.
A variety of pharmacological agents were used, namely NRT, bupropion (Zyban), and
varenicline (Champix). Over the past few years, Zyban prescribing rates have fallen while
Champix prescribing has increased. NICE recommend Champix as being the best drug
currently on the market, saying “over a lifetime horizon varenicline dominated bupropion and
NRT – that is, it was cheaper and more effective”. Nationally in 2011/12 60% of clients who
used Champix quit compared to 47% with Champix and NRT, or 46% with NRT alone.
Champix was used by around 22% of clients in Wirral in 2011/12. Table 5 shows proportion
of clients by quit method for 2011/12. It is not clear how accurately this is recorded.
Table 5. Proportion of clients by quit method.
Agent used Proportion of clients
Bupropion (Zyban) 0.21%
Nicotine Replacement Therapy (NRT) 73.05%
NRT and Bupropion (Zyban) 0.05%
NRT and Varenicline (Champix) 1.81%
Support Only 3.63%
Unknown 1.30%
Varenicline (Champix) 19.94%
Total 100.00%
Source: Quit With Us database.
Recommendation 8: It is recommended that pharmacists are allowed to prescribe Champix
directly to increase quit rates in the most deprived areas.
Page 18 Cost effectiveness of smoking services in Wirral. Brendan Collins. October 2012 v1.5
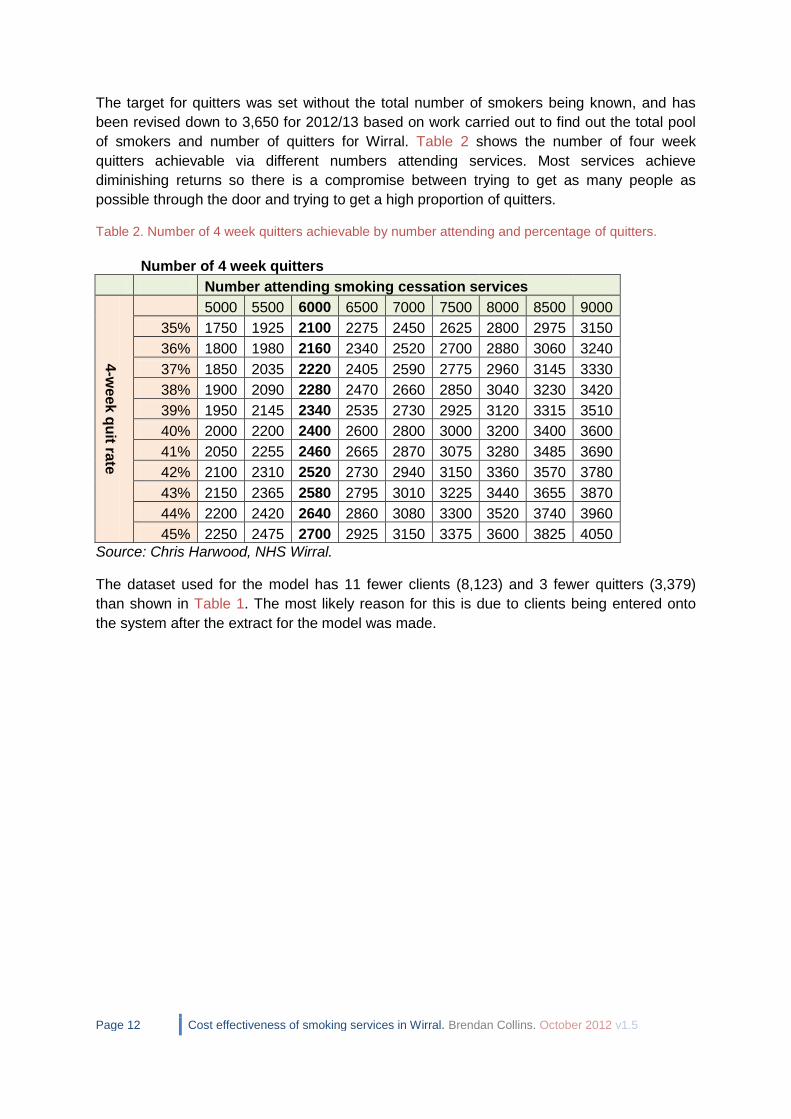
1.14 National Trend in Spend on Quit Methods
Figure 3 shows trend in spend on different quit methods. It is clear from this that NRT spend
has been quite constant over the last few years, Zyban use is falling, and Champix use
peaked in 2010 but then fell slightly. Pharmacological agents are priced differently with
Champix being the most expensive, so spend is not directly proportion to number of items.
Figure 3. UK Trend in spend on pharmacological agents 2000/01-2009/10 financial year, 2010-2011
calendar year.
Data from http://www.ash.org.uk/files/documents/ASH_667.pdf
1.14.1 People using Champix more than once
There is anecdotal evidence that people who use Champix once and do not successfully quit
find the experience unpleasant in terms of nausea or sleep or mood problems and do not
wish to use Champix again. In the Quit and Win database, of those people making multiple
quit attempts, 44% of people who were using Champix were using it for a second, third or
fourth time (427 people) so this suggests that a reasonable proportion of people can tolerate
attempting to quit with Champix more than once. Overall the proportion of quitters using
Champix seems to have fallen from around 25% to level out at around 15% (see Figure 4).
Although it is not known how reliably this information is collected. This could be due to
people who have tried Champix once not wanting to try again, or could be a word of mouth
effect where acquaintances or people in the service are putting people off trying Champix, or
could be due to some other cause.
0
10
20
30
40
50
60
70
80
90
Sp
en
d (
£m
)
Time period
Zyban
Champix
NRT
Total spend

Page 19 Cost effectiveness of smoking services in Wirral. Brendan Collins. October 2012 v1.5
Figure 4. Proportion of quit attempts using Champix by month, January 2010 – July 2012, data for all
Wirral stop smoking services.
0%
5%
10%
15%
20%
25%
30%
35%
40%
45%
1 2 3 4 5 6 7 8 9 10 11 12 1 2 3 4 5 6 7 8 9 10 11 12 1 2 3 4 5 6 7
2010 2011 2012
Source: Quit With Us database.
1.15 Demographics of Service Users
Table 6 shows the proportion of clients who were male and female and in each age group.
Females make up more clients than males, with 25-44 being the biggest age group. The
proportion of clients from younger age groups is quite low, suggesting more needs to be
done to help younger smokers to quit. The smoking service for younger people uses new
technologies like text messaging and BBM, which has been shown to be very cost effective.
For example a trial of txt2stop, a text message programme of motivational messages and
behavioural-change support had quit rates of 10% compared to 4% for controls. 21 The 16-24
smoking cessation is targeted at colleges where people are training for routine and manual
occupations.
1.15.1 Cannabis, Age and Smoking
There is a subgroup of smokers, mainly aged 16-24, who also smoke cannabis, with the
dependency on nicotine and cannabis having a combined effect where it is more difficult for
clients to quit smoking or quit cannabis22. Evidence suggests that this group are more likely
to have psychosocial problems23. Results from the Wirral wellbeing survey, carried out in
2009, showed that people who had smoked cannabis in the last 30 days (nearly all of whom
were also smokers) had a significantly lower EQ-5D health-related quality of life score than
the general population (0.68 vs 0.78), but it is not clear which way the causation lies, i.e.
people who have a poor quality of life may be more likely to use cannabis, or people who
use cannabis may have a poorer quality of life. But either way it shows there is a need for
the health status of this group of people to be improved. The current smoking database does
21
Free C, Knight R, Robertson S, Whittaker R, Edwards P, Zhou W, Rodgers A, Cairns J, Kenward MG, Roberts I. (2011)
Smoking cessation support delivered via mobile phone text messaging (txt2stop): a single-blind, randomised trial. Lancet.
378(9785):49-55. 22
Bélanger, R.E. Akre, C. Kuntsche, E. Gmel, G. Suris, J.C. (2011)Adding Tobacco to Cannabis—Its Frequency and Likely
Implications. Nicotine & Tobacco Res (2011) 13(8): 746-750 23
Degenhardt, L. Coffey, C. Carlin, J.B. Swift, W. Moore, E. Patton, G.C. (2010) Outcomes of occasional cannabis use in adolescence: 10-year follow-up study in Victoria, Australia. British Journal of Psychiatry 196:290-295

Page 20 Cost effectiveness of smoking services in Wirral. Brendan Collins. October 2012 v1.5
not record cannabis use but the next smoking prevalence survey will include a question on
cannabis. Figure 5 shows average EQ-5D scores by age group and cannabis category.
Figure 5. Average EQ-5D Index Score, by age group and cannabis use category; never used, used in
last 30 days, or used but not in the last 30 days. There were no individuals who said they had used in
last 30 days in the 16-17 and 65+ age group.
Source: Raw data from Wirral wellbeing survey, 2009.
Recommendation 9: It is recommended that services are tailored to meet the needs of
young people and use new technologies.
Recommendation 10: It is recommended that joint interventions that target cannabis and
tobacco smoking at the same time are considered.
Table 6. Proportion of clients by age group and gender, 2011/12.
Gender
Age group Female Male Total
Under 18 2.83% 2.50% 5.33%
18-24 6.61% 5.12% 11.73%
25-44 24.06% 18.86% 42.92%
45-59 14.93% 10.86% 25.79%
60 and over 8.29% 5.95% 14.23%
Total 56.72% 43.28% 100.00%
Source: Quit With Us database.
Table 7 shows clients by socio-economic classification. The biggest groups are unemployed
and routine and manual workers, who are also the groups most likely to smoke. 3.52% of
clients were classed as unpaid carers, who may find it hard to get time out to attend smoking
cessation.
0
0.1
0.2
0.3
0.4
0.5
0.6
0.7
0.8
0.9
1
16 – 17 18 – 24 25 – 39 40 – 54 55 – 64 65 Plus
Average EQ-5D
Index Score
Age group
Never used Used in the last 30 days Used, but not in the last 30 days

Page 21 Cost effectiveness of smoking services in Wirral. Brendan Collins. October 2012 v1.5
Recommendation 11: It is recommended that services are tailored to meet the needs of
carers who may find it hard to attend smoking cessation services, and may need additional
help in finding alternative ways of coping with stress.
Table 7. Proportion of clients by socio-economic classification, 2011/12.
Socio-economic classification Proportion of clients
Full Time Student 6.50%
Home Carers (unpaid) 3.52%
Intermediate Occupation 7.09%
Managerial and Professional Occupations 8.86%
Never Worked or Unemployed For Over 1 Year 20.53%
Prison 0.02%
Retired 10.13%
Routine and Manual Occupation 23.27%
Sick/Disabled and Unable To Return To Work 4.55%
Unable to code 15.51%
Total 100.00%
Source: Quit With Us database.
Table 8 shows the proportion of clients by ethnic group. The majority of clients are ‘White
British’, with the biggest minority ethnic groups being ‘Other White Background’ and ‘Asian
or British Bangladeshi’.
Table 8. Proportion of clients by ethnic group.
Ethnicity Proportion
of clients
White British 87.42%
Not Stated 6.04%
Any Other White Background 2.35%
Asian or Asian British Bangladeshi
1.43%
White Irish 0.74%
Any other Asian background 0.62%
Other Ethnic Groups Chinese 0.26%
Any Other Ethnic Group 0.23%
Any Other Mixed Background 0.21%
Mixed White and Black African 0.16%
Mixed White and Black Caribbean
0.12%
Black or Black British - Caribbean 0.11%
Any other Black background 0.09%
Asian or Asian British Indian 0.09%
White and Asian 0.09%
Black or Black British - African 0.04%
Asian or Asian British Pakistani 0.01%
Total 100.00%
Source: Quit With Us database.

Page 22 Cost effectiveness of smoking services in Wirral. Brendan Collins. October 2012 v1.5
Table 9 shows the proportion of clients by deprivation group. People from the most deprived
areas make up roughly 57% of clients which is encouraging as one of the drivers behind the
smoking service is to narrow health inequalities. People in the most deprived areas make up
32% of the population in Wirral.
Table 9. Proportion of clients by deprivation.
National deprivation quintile (IMD 2010)
Proportion of clients
1 – most deprived 56.64%
2 18.40%
3 9.07%
4 7.66%
5 – least deprived 5.79%
Unknown 2.44%
Total 100.00%
Source: Quit With Us database.
1.15.2 Nicotine dependence and deprivation
There is evidence that individuals from deprived areas have a higher level of nicotine
dependency than less deprived individuals. This is shown in national data through higher
average numbers of cigarettes consumed and higher plasma cotinine levels24. In Wirral
Fagerstrom nicotine dependence levels were measured for 50% of smoking cessation
clients (3942 people). In Wirral there does not seem to be much of a pattern although the
least deprived group have a lower proportion of high dependence and very high dependence
than the other groups (Figure 6).
Figure 6. Proportion of smoking clients by dependence category and deprivation quintile 2011/12.
Source: Quit With Us database.
24
Jarvis M, Wardle J. (1999) Social patterning of individual health behaviours: the case of cigarette smoking. In: Marmot M, Wilkinson R, eds. Social determinants of health. Oxford: Oxford University Press,
0% 20% 40% 60% 80% 100%
1 - most deprived
2
3 - average
4
5 - least deprived
All
Very low dependence
Low dependence
Medium dependence
High dependence
Very high dependence

Page 23 Cost effectiveness of smoking services in Wirral. Brendan Collins. October 2012 v1.5
1.16 Spend Data
The spend data for smoking is shown in Table 10. The total spend is around £2.2million. The
majority of spend is on smoking cessation and pharmacological support. Where previously
pharmaceutical agents were part of the general pharmacy budget, in the future they will be
managed under the public health function. This table does not include all management and
overhead costs, or all evaluation costs. It does not include environmental health and trading
standards teams, who spend some of their budget on smoking enforcement. Behind these
figures we have attempted to classify spend as staff, marketing/research, overheads,
training and drugs; and also classify each type of costs as fixed (i.e. they would stay the
same if the programme was expanded or contracted slightly) or variable (they are in general,
proportional to the amount of activity that a service is doing, so for example if the number of
clients doubled then the number of advisors needed would roughly double, as would the
number of NRT prescriptions). One potential disadvantage to having more activity as
Payment by Results is that costs are essentially uncapped, and so any increases in activity
could make the smoking budget go beyond what is expected. Pharmacological support costs
are also essentially uncapped like this too.
Table 10. Summary of spend on stop smoking activity for Wirral, 2011/12.
Totals 2011/12 Spend
Strategic Commissioning Plan £401,472
Wirral Community Trust (Core service) £888,529
Drug costs
-NRT voucher scheme £512,837
-Other NRT costs £136,941
-Vanrenicline (Champix) £290,928
-Bupropion(Zyban) £3,221
Total £2,233,928
Source: Data from Kim Ozano/Barry Graham/Wirral CT/Viki Jenkins

Page 24 Cost effectiveness of smoking services in Wirral. Brendan Collins. October 2012 v1.5
2. Smoking Economic Model (WHELCS model)
2.1 About the model
Models are a simplification of the real world; they are used where there is uncertainty about
the effects of different parameters, or to project the long term impact of an intervention
where only short term impact data is available. Local population, smoking prevalence and
mortality data for Wirral was combined with a risk-based cohort simulation model (the Wirral
Health Economic Life Cohort Smoking [WHELCS] model) to produce anticipated cost
savings and QALYs (quality adjusted life years) gained as a result of the smoking quitters
that had been achieved in Wirral in 2011/12 financial year. The central model assumed that
8% of 4 week quitters would become lifetime quitters and would thus have a reduced risk of
diseases and death over the next 20 years. This is consistent with local data for conversion
rates from 4 week to 12 month quitters (see Table 1) and with data from Scotland, which
have varied from 6% to 8%25. Appendix 1 has a full description of the economic model. The
baseline model is a ‘do nothing’ model which attempts to describe the state of smoking,
mortality and disease prevalence as is in Wirral, into which the impact of different types of
interventions can be entered. The ambition is that the model can be re-used to answer
questions about smoking in Wirral and refreshed over several years.
2.2 Results of the Baseline Model
The baseline model applied age-specific risks for Wirral's current population of smokers,
non-smokers and ex-smokers to die or to get certain diseases. Smoking is associated with
increased risk of more than 200 diseases; this model only includes some of the biggest
causes of morbidity and mortality. These risks were based on data used in the NICE model
(2008). The results are shown in Table 11. We have attempted to validate this model against
other data sources.
2.2.1 Baseline Model Validation
The number of smokers is similar to that obtained by using Mosaic Public Sector, a software
package which gives estimated characteristics of a population by combining administrative
data with other data sources such as shopping habits and house prices. The number of
smokers is also in the same ballpark as the synthetic estimate for Wirral which was 53,916
smokers aged 18 and over. The national health profiles have 680 smoking related deaths
per year for Wirral for 2009-11, a rate of 256 per 100,000 people aged 35 and over, which is
21% higher than the England rate. This ties in with the number of deaths in the model. The
number of deaths in ex-smokers is much higher than for smokers because ex-smokers are
older and make up a greater proportion of the population.
For validating lung cancer prevalence, cancer prevalence is not often recorded (incidence,
survival and mortality are recorded more reliably) as new cancer cases can be uncertain in
what type of cancer it is, and it can be difficult to say when someone in remission actually no
longer has cancer. A paper by Forman and colleagues (2003) looked at cancer prevalence 25
http://www.scotpho.org.uk/downloads/scotphoreports/scotpho120529_smokingcessationstatistics2011.pdf

Page 25 Cost effectiveness of smoking services in Wirral. Brendan Collins. October 2012 v1.5
for England and found a crude lung cancer prevalence of 55 people per 100,000 which
would equate to 170 people for Wirral which is much lower than this estimate.
The CHD prevalence is higher than the GP-measured QOF (Quality and Outcomes
Framework) prevalence. The GP QOF prevalence is based on known disease prevalence,
but there are also estimates produced by the Association of Public Health Observatories
which predict CHD prevalence to be 19,177 cases so the model estimate lies in the middle
of these two figures. Stroke prevalence is similar to the QOF data, although the QOF data
includes individuals who have had transient ischemic attacks (TIAs) which are milder, ‘mini
strokes’.
The COPD prevalence is lower than the QOF-measured prevalence, and much lower than
the APHO estimated prevalence which is 14,417 (nearly twice the QOF measured
prevalence of 7,396). This may be partly because NICE's COPD definition was extended in
2011 to include more people as having mild COPD who would be previously seen as pre-
clinical. This extending of the criteria for diagnosing COPD means that individuals are getting
a diagnosis earlier in their lives and hopefully some of them are shocked into quitting
smoking before their COPD gets more severe. The data we have used in the model is from
2004 so would have been before this extended definition of COPD was introduced.
Overall, the model seems to tie in reasonably well with other data that is available about the
Wirral population. The model is not specifically weighted for higher disease prevalence
associated with deprivation, although does take into account the effects of higher mortality
and smoking rates which are a consequence of deprivation.
Table 11. Results of the baseline model for Wirral. Source: WHELCS Model.
Predicted totals - baseline model
All 16+ All 16+ All 16+ Comparator Ratio of Model to Comparator
Source of comparison data
Males Females Persons
Population 117510 132623
250,133
Smokers 30259 29968
60,228
57,577 1.05 Mosaic Public
Sector
Ex smokers 38416 42247
80,663
Never smoked 48835 60407
109,242
Smokers (%) 26% 23% 24% 24% 1.0 Integrated
Household Survey
Lung cancer prevalence 297 135
432
CHD prevalence 9671 7379
17,050 13,769 1.24 QOF Data
MI prevalence 4496 1986
6,482
COPD prevalence 2781 3622
6,403
7,396 0.87 QOF Data
Stroke prevalence 3420 3502
6,922
7,359 0.94 QOF Data (Stroke
& TIA)
Deaths - current smoker 454 457
911
Deaths - ex smoker 834 820
1,654
Deaths - never smoked 493 726
1,219

Page 26 Cost effectiveness of smoking services in Wirral. Brendan Collins. October 2012 v1.5
2.2.3 Example of predicted survival from the model
Figure 7 shows an example of outputs that can be calculated from the model. It shows
survival over the next 30 years for 40 year old smokers and ex-smokers. You can see that
for 40 year male old smokers, probability of surviving to 70 is around 55%, while for female
ex-smokers it is around 80%. Interestingly female smokers have a similar probability of
surviving to age 70 as male ex-smokers, at around 71%. This chimes with evidence from a
Scottish cohort study, where it was found that smoking cancelled out the survival advantage
that women have over men26.
Figure 7. Probability of surviving next 30 years for male and female smokers and ex-smokers in
Wirral, as predicted by the model.
Source: WHELCS Model.
2.2.4 Predicted Smoking prevalence from the model
Figure 8 and Figure 9 show the proportion of males and females predicted by the model to
be smokers, ex-smokers and never smoked. There are some clear quantisation effects,
where the data has been grouped into age groups rather than having data for each age.
Male smoking rates are highest in 24 to 35 year olds whereas female smoking rates are
highest in 35 to 50 year olds. Interestingly smoking in women is lower in 20 to 24 year olds
than in the two age groups either side, women aged 16 or 20, or 25 to 30, which suggests
that girls under 16 are taking up smoking more. This age structure is almost the opposite of
what would be expected given that young women who are from more affluent backgrounds,
26
Gruer, L., et al. (2009) Effect of tobacco smoking on survival of men and women by social position: a 28 year cohort study. BMJ. 338:b480.
0
0.1
0.2
0.3
0.4
0.5
0.6
0.7
0.8
0.9
1
40 42 44 46 48 50 52 54 56 58 60 62 64 66 68 70
Pro
po
rtio
n s
till
aliv
e
Age
male smoker
male ex smoker
female smoker
female ex smoker

Page 27 Cost effectiveness of smoking services in Wirral. Brendan Collins. October 2012 v1.5
who are less likely to smoke, are more likely to leave Wirral in their early twenties to go away
to university.
Figure 8. Male smoking behaviour by age for Wirral as predicted by economic model, showing
proportion of total population who are current smokers, ex-smokers and never smoked, Ages 16 to
90.
Figure 9. Female smoking behaviour by age for Wirral as predicted by economic model, showing
proportion of total population who are current smokers, ex-smokers and never smoked, Ages 16 to
90.
Source: WHELCS Model.
2.3 Outcomes Data
The WHELCS model was adjusted to take into account the effect of the 3,379 quitters in all
services for 2011/12. The quitters were aged through 20 years and the impact over those 20
years was recorded, measuring reduced prevalence of disease, reduced healthcare costs,
reduced deaths, and increased quality of life. The central model used a long term quit rate of
8% of 4 week quitters. This is quite a conservative estimate with some models using nearer
to 15%. But in this model we have not deducted a background population quit rate, i.e.
people who have quit with services who may have quit on their own anyway. Overall the
inputs in the economic model can be considered to be logical and conservative. The impact
of reduced morbidity and mortality over 20 years was discounted at 3.5% a year, which is
0.0%
10.0%
20.0%
30.0%
40.0%
50.0%
60.0%
70.0%
80.0%
90.0%
100.0%
16 20 24 28 32 36 40 44 48 52 56 60 64 68 72 76 80 84 88
Age
Male current smoker
Male ex smoker
Male never smoked
0.0%
10.0%
20.0%
30.0%
40.0%
50.0%
60.0%
70.0%
80.0%
90.0%
100.0%
16 20 24 28 32 36 40 44 48 52 56 60 64 68 72 76 80 84 88
Age
Female current smoker
Female ex smoker
Female never smoked

Page 28 Cost effectiveness of smoking services in Wirral. Brendan Collins. October 2012 v1.5
the standard UK Treasury rate used in economic evaluations. This has a big impact on the
results; it means that the value of reduced morbidity in someone who has quit now, in 20
years would be 50.2% of what it is now. Discounting is used to take into account time
preference, - that people prefer to receive benefits now than in the future, and also that there
is more uncertainty around outcomes that occur in the future.
Figure 10 shows the net result of smoking quitters over 20 years. The biggest change in
number of cases is in CHD, followed by MI. Although ex-smokers have a lower risk of
disease than smokers, they also have a lower risk of dying which means that more of them
live to an older age to get diseases. So in terms of total disease prevalence this cancels out
some of the effect of people quitting smoking. This is true for the cost savings as well, while
people quitting smoking generates considerable cost savings, some of these costs are
delayed or offset, so for instance people who quit smoking are more likely to live to an older
age where they get dementia and generate costs to the health and social care system.
Figure 10. Net discounted fall in number of disease cases over 20 years, as a result of smoking
quitters, showing 6%, 8% and 10% long term quit rates.
Source: WHELCS Model.
0
20
40
60
80
100
120
Lung cancerprevalence CHD
prevalence MIprevalence COPD
prevalence Strokeprevalence
6% quit rate 8% quit rate 10% quit rate

Page 29 Cost effectiveness of smoking services in Wirral. Brendan Collins. October 2012 v1.5
2.4 Cost Effectiveness Results
The results for the WHELCS model are shown in Table 12. The central model produces a
benefit of 160 QALYs (quality adjusted life years) and £204,755 in NHS cost savings from
reduced prevalence of CHD, MI, stroke, COPD and lung cancer as well as reduced risk of
infection in babies of pregnant women who quit smoking. Overall the cost per QALY is
£11,590 which compares favourably with a cost per QALY threshold of less than £20,000 or
£30,000 which is used by NICE. The results are higher than cost per QALYs for smoking
interventions that are often quoted in the evidence, this may be due to the model being more
conservative in using an 8% long term quit rate, the model only including five disease
groups, and also due to the model including a lot of costs related to the smoking programme
which may not always be included in economic models.
Table 12. Results of economic model of smoking quitters.
Net effect over 20 years
6% quit rate
8% quit rate (main scenario)
10% quit rate
NHS disease costs saved £147,723 £196,964 £246,205
QALYs gained through reduced smoking related disease
80 107 134
Additional child QALYs through 21 pregnant mothers quitting
0.42 0.42 0.42
Additional cost savings from pregnant mothers quitting £7,791 £7,791 £7,791
Total life years gained 57 75 94
Total QALYs through life years gained (valued at 0.7) 40 53 66
Total QALYs gained 120 160 200
Total NHS cost savings £155,514 £204,755 £253,996
Total 4 week quitters 3379 3379 3379
Cost of programme £2,060,481 £2,060,481 £2,060,481
Net cost per QALY £15,849 £11,590 £9,030
Cost:benefit ratio 1.24 1.65 2.07
Source: WHELCS Model.
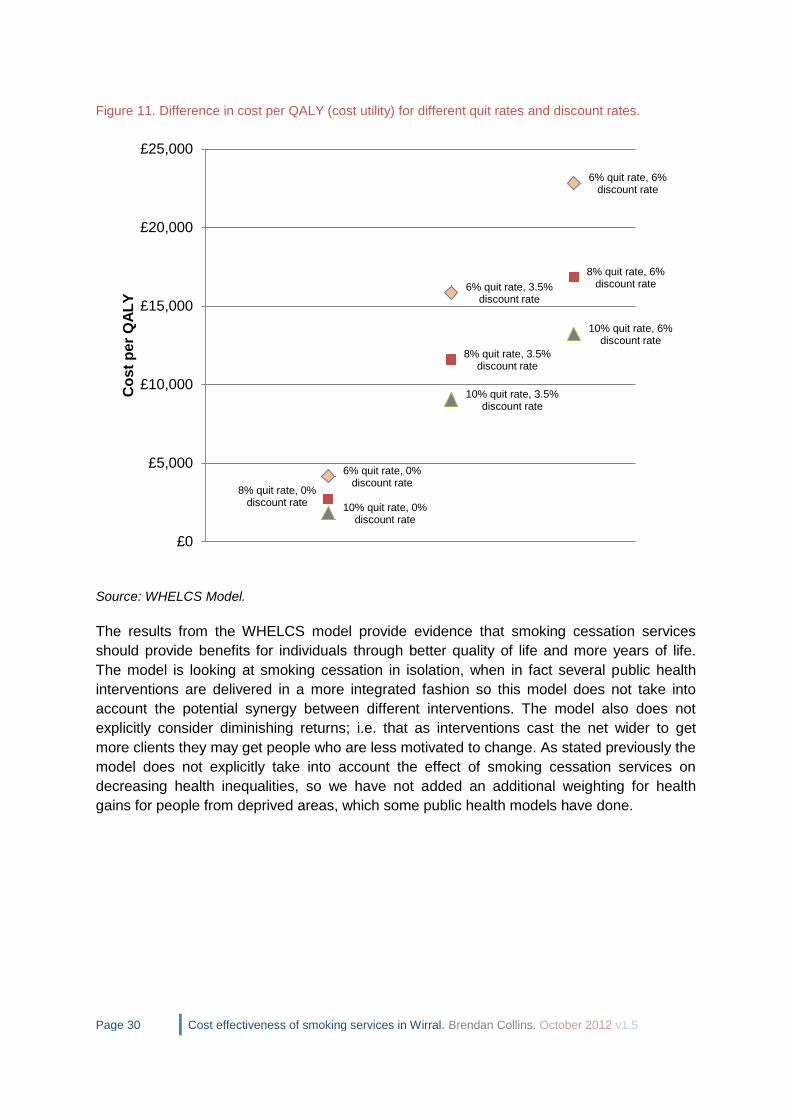
2.4.1 Sensitivity Analysis
Varying the parameters in a model to see how they affect the results is called a sensitivity
analysis. In this case the net cost per QALY (the cost per QALY after NHS cost savings) is
heavily impacted by the quit rate and discounting rate chosen for the model. In their
guidance for economic evaluation of public health interventions, NICE have stated that any
sensitivity analysis should vary the discount rate between 0% and 6%. In the best case
scenario (with discount rate at 0%, long term quit rate at 10%) the cost per QALY is £1,263
while in the worst case scenario (discount rate 6%, long term quit rate 6%), the cost per
QALY is £19,070. The number of QALYs gained varies from 64 in the worst case scenario to
460 in the best case scenario. The distribution of cost per QALYs gained for different quit
rates and discount rates shown in Figure 11. Smoking is a good example of how public
health interventions that have a long payback time are very sensitive to the effects of
discounting.
Page 30 Cost effectiveness of smoking services in Wirral. Brendan Collins. October 2012 v1.5
Figure 11. Difference in cost per QALY (cost utility) for different quit rates and discount rates.
Source: WHELCS Model.
The results from the WHELCS model provide evidence that smoking cessation services
should provide benefits for individuals through better quality of life and more years of life.
The model is looking at smoking cessation in isolation, when in fact several public health
interventions are delivered in a more integrated fashion so this model does not take into
account the potential synergy between different interventions. The model also does not
explicitly consider diminishing returns; i.e. that as interventions cast the net wider to get
more clients they may get people who are less motivated to change. As stated previously the
model does not explicitly take into account the effect of smoking cessation services on
decreasing health inequalities, so we have not added an additional weighting for health
gains for people from deprived areas, which some public health models have done.
6% quit rate, 0% discount rate
6% quit rate, 3.5% discount rate
6% quit rate, 6% discount rate
8% quit rate, 0% discount rate
8% quit rate, 3.5% discount rate
8% quit rate, 6% discount rate
10% quit rate, 0% discount rate
10% quit rate, 3.5% discount rate
10% quit rate, 6% discount rate
£0
£5,000
£10,000
£15,000
£20,000
£25,000
Co
st
per
QA
LY

Page 31 Cost effectiveness of smoking services in Wirral. Brendan Collins. October 2012 v1.5
2.5 Comparison of Outputs with Other Tools
2.5.1 NICE Return on Investment (ROI) Tool
The Health Economics Research Group (HERG) at Brunel University was commissioned by
NICE to develop a return on investment tool for smoking cessation services. This tool was
published in October 2012 (after the first draft of this report had been completed). 27 The
tool uses a Markov model to generate QALYs gained, net present value, and cost benefit
achieved from a package of different tobacco interventions. The assumptions behind the tool
are very comprehensive, including many disease areas. The possible interventions are;
1 Over the counter NRT 13 One-to-one + bupropion
2 Prescription mono NRT 14 Drop-in + mono NRT
3 Rx Combo NRT 15 Drop-in + combo NRT
4 Rx Varenicline 16 Drop-in + varenicline
5 Rx Bupropion 17 Drop-in + bupropion
6 Closed and Rolling group combined + mono NRT
18 Text to Stop
7 Closed and Rolling group combined + NRT 19 Pharmacy one-to-one support
8 Closed and Rolling group combined + varenicline
20 Self-help books and booklets
9 Closed and Rolling group combined + bupropion
21 Proactive telephone support
10 One-to-one + mono NRT 22 Internet support
11 One-to-one + combo NRT 23 GP advice
12 One-to-one + varenicline 24 Comprehensive Sub-national Tobacco Control Program
The tool gives a default package which is a mixture of different interventions. Based on the
default package of interventions for Wirral, the tool estimates that this should cost
approximately £2.1million (see Appendix 5 for full results which include the impact of sub-
national programmes which are estimated to increase quit rates by 3%) which is remarkably
close to Wirral’s actual spend on smoking cessation. The tool estimates that the actual
spread of interventions in Wirral cost £1.7million, which is less than the actual cost. The tool
estimates that 16.58% of smokers will have interventions (excluding GP brief advice), which
equates to 9,222 smokers for Wirral, higher than the actual number of stop smoking clients
for Wirral for 2011/12 which was 8,123.
The tool was completed based on activity data for Wirral for 2011/12. The tool does not allow
clients to have ‘support only’ with no pharmacotherapy so these clients were assigned to
mono NRT. The Wirral data does not distinguish clearly between mono and combination
NRT so the NRT clients were split evenly between mono and combination NRT. The tool
estimates cost per QALY over 5 years, 10 years, and the lifetime of smoking clients (Table
13). The cost per QALY of the default package of interventions is estimated to be £4,139
over a 10 year time horizon or cost saving over a lifetime time horizon. This is a lower cost
27
Pokhrel, S., Owen, L., Lester-George, A., Coyle, K., Coyle D., Trapero-Bertran M. (2012 ). Tobacco Control Return on
Investment Tool. London: National Institute for Health and Clinical Excellence.

Page 32 Cost effectiveness of smoking services in Wirral. Brendan Collins. October 2012 v1.5
per QALY than the results of the WHELCS model which is partly because the cost of
interventions in Wirral is higher than estimated by the NICE model, and will also be because
the effectiveness of interventions as estimated in the WHELCS model is an underestimate
compared to the NICE model. Most of the estimates of effectiveness in the NICE model are
higher than the central figure in the WHELCS model of 8% of 4 week quitters becoming long
term quitters. This cost per QALY is a lot lower than that estimated by the WHELCS model,
with smoking activity estimated to produce a net NHS saving in the long term.
Table 13. Cost per QALY Results from NICE ROI Tool. Based on Wirral activity data for 2011/12.
Total number QALYs gained
(for all smokers) Incremental cost to NHS per QALY gained
Package B vs Baseline (NHS)
2 years
5 years 10 years Lifetime 2 years 5 years
10 years Lifetime
44.95 107.91 213.18 737.77 £30,790 £10,900 £4,139
Package B dominates Baseline (i.e.cost saving)
Figure 12 shows the difference in total healthcare costs, as well as costs from lost work days
per year, based on the Wirral quitting data for 2011/12. The total annual difference in costs is
estimated to be £250,741.
Figure 12. Estimated smoking-related healthcare and other costs based on NICE model, shown with
baseline (no stop smoking services) vs.Package B (actual 2011/12 stop smoking services).
£189,999
£188,012
£1,355,684
£1,777,854
£2,194,339
£4,102,165
£6,901,199
£193,783
£191,752
£1,382,655
£1,813,284
£2,238,031
£4,183,961
£7,038,324
£0
£1,0
00,0
00
£2,0
00,0
00
£3,0
00,0
00
£4,0
00,0
00
£5,0
00,0
00
£6,0
00,0
00
£7,0
00,0
00
£8,0
00,0
00
Passive smoking
Practice nurseconsultations
Prescriptions
Outpatient visits
GP consultations
Lost work days
Admissions
(£2012)
Baseline
Package B

Page 33 Cost effectiveness of smoking services in Wirral. Brendan Collins. October 2012 v1.5
2.5.2 NSMC Value for Money (VfM) Tool
The NSMC (National Social Marketing Centre) Value for Money (VfM) tool28, ‘Stop Smoking:
for love or money’ was produced by Prof Graham Lister as a ready reckoner to measure and
benchmark the cost effectiveness of stop smoking services. These estimates are based on
applying WHO (World Health Organisation) burden of disease data around the burden of ill
health (years lived in disability or YLD) and mortality (years of life lost) that are due to
smoking. These summary DALYs (disability adjusted life years) lost through smoking are
converted to QALYs (quality adjusted life years). These are calculated based on individuals
achieving a behaviour change and moving from being high to low risk of experiencing
smoking-related illnesses. Long term persistence from year 2 to 10 years is assumed to be
90%, i.e. one in ten remaining quitters reverts to smoking each year for 10 years, this is
based on a paper by Hughes and colleagues (2008)29. One year and long term persistence
may be improved further by measures such as support groups and follow up calls.
The Value for Money Tool has been validated and is broad in that it includes cost savings to
local authorities in terms of reduced need for social care (for people who have smoking
related ill health that requires care), and reduced fires, savings on street cleaning, as well as
savings to individual quitters and to employers. This model is not as specific to Wirral as the
WHELCS cohort economic model we constructed but it is useful to see how close the results
are. Table 14 shows the cost per QALY results. The number of QALYs gained is 178 which
is a similar result to the WHELCS model, which had 160 QALYs gained as the central
assumption. Both of these are much lower than the 738 QALYs estimated by the NICE ROI
tool. This is good evidence that the results from the WHELCS model can be regarded as
reliable. The cost savings to the NHS are greater than predicted from the WHELCS model,
at £565,470 compared to £204,755. The method for calculating cost savings in the Value for
Money tool was apportioned from the total cost of smoking to the NHS, from a paper by
Callum and colleagues, 201030, whereas the method in the WHELCS model was based on
annual costs and quality of life decrements through five specific diseases associated with
smoking.
Savings to local authorities and other local services in the tool include reduced spend on
social care, street cleaning, and fires. In 2008/09, £7.8 billion was spent nationally on social
care for adults with health related problems. Because long term costs relate closely to the
number of people requiring support the full costs are taken into account in estimating
potential savings. These savings are allocated on the basis of weighted years lived with
disability attributable to smoking. These figures are in inflated to 2011/12 prices. For street
cleaning, total expenditure on street cleaning for England in 2008/9 was reported by ONS as
£858million. Estimates quoted by Robert Nash and Henry Featherstone in Policy Exchange
Research Note of March 2010,"Cough Up" show £342million as the cost of cigarette litter for
the UK. Potential savings are calculated on the basis of 25% of this figure recognising that
street cleaning costs involve a lot of fixed costs. The consequent cost saving is allocated on
the basis of reductions in smoking years. For Fire and Emergency services, total spend for
28
NSMC Value for Money Tools. Available at: http://www.thensmc.com/resources/vfm 29
Hughes, J.R. Peters, E. and Naud, S. (2010) "Relapse to Smoking After 1 Year of Abstinence: A Meta-analysis "Addict Behav. 2008 December; 33(12): 1516–1520 30
Callum C, Boyle S, Sandford A. (2010) Estimating the cost of smoking to the NHS in England and the impact of declining prevalence. Health Economics Policy & Law. doi:10.1017/S1744133110000241

Page 34 Cost effectiveness of smoking services in Wirral. Brendan Collins. October 2012 v1.5
England in 2008/9 was reported by ONS as £2.2billion. The estimated total cost of fires in
2004 was £7billion for England and Wales, of which £507million was attributed to smoking in
domestic buildings. Allocating fire service costs on the same basis as overall fire costs
suggests a cost relating to smoking of £160 per smoker per year. In the long term 50% of fire
service costs are assumed to relate to incidence of fires. This is reduced in line with the
reduction in smoking years. Overall the estimated average savings to local authorities from
smoking quitters across social care, street cleaning, and fire & emergency is £130,726.
Table 14. Outcomes Results from NSMC Value for Money Tool, based on 8% long term quit rate.
Smoking 4 week quitters 3379
QALYs gained 177.81
NHS cost savings £565,470
Local authority cost savings (Total) £130,726
-Social Care £116,269
-Street Cleaning £6,888
-Fires & Emergency £7,569
Net cost/QALY (NHS Perspective) £8,408
Net cost/QALY (Public Sector perspective) £7,673
Source: NSMC Value for Money Tool.
Table 15 shows estimated benefits to individuals, which include reduced spend on
cigarettes, reduced informal care- i.e. friends and family giving up their time to take care of
people who are ill with smoking-related diseases, costs from passive smoking, and reduced
costs of fires caused by cigarettes. The total is nearly £5million.
Table 15. Benefits to individuals who quit, from NSMC Value for Money Tool, based on 8% long term
quit rate.
Reduced expenditure on cigarettes £3,379,445
Reduced informal care £391,041
Increased employment income and pension, less tax and reduced benefit payments
£869,218
Passive smoking £248,929
Reduced costs of fires £82,724
Total net benefit to individuals £4,971,356
Source: NSMC Value for Money Tool.
Table 16 shows benefits to employers from reduced absences with smoking-related
illnesses, increased productivity, and reduced fire-related costs. This is assuming 50% of
quitters are in employment; in the Quit with Us database 44% of clients for 2011/12 were
recorded as being in employment, but employment status was not coded for 16% of clients.

Page 35 Cost effectiveness of smoking services in Wirral. Brendan Collins. October 2012 v1.5
Table 16. Benefits to employers (based on 50% of quitters being in employment), from NSMC Value for Money Tool, based on 8% long term quit rate.
Reduced absenteeism £194,066
Improved productivity £215,628
Reduced fire-related costs £8,086
Total net benefit to employers £417,780 Source: NSMC Value for Money Tool.
In summary the results from the Value for Money tool give a lot of evidence for the impact of
smoking cessation on wider society. This information can be used to sell the benefits of
smoking cessation interventions to local authorities and employers.
2.5.1 Social Return on Investment
The Social Value Act (2012) requires “public authorities to have regard to economic, social
and environmental well-being in connection with public services contracts; and for connected
purposes.”31 This means that public bodies need to consider Social Return on Investment
(SROI), which is the benefit generated to society through commissioned services. This can
include benefits which are not always considered when evaluating services. SROI is often
presented as a ratio which is similar to a cost:benefit ratio except the SROI ratio usually
takes a broader perspective than traditional cost benefit analysis. Based on the results from
the Value for Money tool, the SROI (Social Return on Investment) based on human value of
the QALYs gained is a ratio of 1 to 2.43 or £2.43 in value generated for every pound spent.
Or the SROI based on return to stakeholders in £1.71 for every £1 spent. A more detailed
SROI analysis may be carried out in future.
Recommendation 12: Wirral should preserve its investment in smoking cessation services,
which have a good cost effectiveness profile through increased quality and length of life for
quitters, reducing health inequalities and producing cost savings to the NHS, local
authorities, employers and individuals.
2.6 Summary of Impact on Marmot32 priorities The Marmot review ‘Fair Society, Healthy Lives’ identified eight priority areas for improving health and reducing health inequalities. The impact of smoking and tobacco interventions on each of these areas is as follows;
1. Child development – Sudden Infant Death Syndrome (SIDS) and other childhood
illnesses such as asthma and glue ear are correlated with parents smoking 33. Also
children of smokers are more likely to smoke themselves. So parents quitting
smoking will benefit their children. 90% of smokers start before the age of 18 so
interventions that target uptake in teenagers will address this.
31
http://www.legislation.gov.uk/ukpga/2012/3/introduction/enacted 32
Marmot, M. Fair Society, Healthy Lives: The Marmot review [online]. 2010. Available from: www.marmotreview.org/AssetLibrary/pdfs/Reports/FairSocietyHealthyLives.pdf 33
British Medical Association (2007) Breaking the cycle of children’s exposure to cigarette smoke. London: British Medical Association.

Page 36 Cost effectiveness of smoking services in Wirral. Brendan Collins. October 2012 v1.5
2. Schooling – Children of parents who smoke are more likely to miss school through
sickness. Teenagers leaving school premises to smoke can cause disciplinary
problems which put a burden on teacher time. So reducing smoking prevalence will
help schools.
3. Employment - Smoking interventions benefit employers and employees through
improved productivity, reduced absenteeism through smoking related diseases
(particularly long term sick) and reduced fire risk.
4. Minimum income and benefits – Smoking has an effect on people’s incomes in the
money they spend on cigarettes, and also lost potential income as smokers are more
likely to be ill and off work. So helping people to quit should increase the number of
people who earn a minimum income needed for healthy living.
5. Healthy environment and green spaces – Reducing smoke and smoking-related litter
promotes a healthy environment. A large proportion of litter is tobacco related, so
reducing smoking prevalence will reduce the amount of this litter and also will reduce
the amount spent on street cleaning which would free up cash to be spent on
improving the living environment in other ways. On a global level, the tobacco
industry uses land, primarily in developing countries, that could be used to feed 20
million people, or could be used for wildlife or parkland, and uses a lot of pesticides
and wood and paper in the production process. Although tobacco is a ‘cash crop’ the
majority of profits go to the big tobacco companies and not to the local tobacco
growers, who put themselves at risk of illness through pesticides or from green
tobacco sickness, where high amounts of nicotine are absorbed through the skin.
6. Transport - There is some evidence that smoking while driving can contribute to
traffic accidents, and that people who smoke are less likely to wear seatbelts. The
BMA has called for smoking in cars to be banned. Smoking on public transport is
banned.
7. Safety and crime - Around 1 in 10 (11%) cigarettes are smuggled illegally and the
figure is much higher for hand rolled tobacco so reducing smoking prevalence should
reduce the amount that needs to be spent on policing illegal tobacco. Selling tobacco
to people under the age of 18 is illegal so helping young people to quit or not take up
smoking may eventually reduce the amount of money that needs to be spent on
policing sales to young people.
8. Reducing health and social inequalities – Smoking is the biggest single cause of
health inequalities, so reducing smoking prevalence in the most deprived groups,
through pricing, through national smoking policy measures, through changing social
norms and through supporting people to quit smoking, will reduce health and social
inequalities in a massive way.

Page 37 Cost effectiveness of smoking services in Wirral. Brendan Collins. October 2012 v1.5
2.7 Cost effectiveness of smoking in pregnancy service
Smoking in pregnancy is related closely to deprivation, and being single, or having a partner
who also smokes34. Smoking while pregnant increases the risk of ectopic pregnancy,
spontaneous abortion, placenta previa, abruptio placenta, preterm premature rupture of
membranes, although decreases risk of preeclampsia and gestational hypertension. It also
increases the risk for the infant of low birthweight, infant mortality, infections, asthma, and
sudden infant death syndrome (SIDS). Smoking also runs in families so when parents quit it
helps to break the cycle. Champix and Zyban are not licensed for use during pregnancy, but
some NRT products can be used (80 out of 90 pregnant clients for Wirral were recorded as
using NRT). Interventions for smoking in pregnancy need to focus on partners if they smoke
as well35. A Cochrane review in 2011 36 found that the evidence around incentives for
smoking cessation was mixed. Financial incentives have been found to be successful in
some trials in helping pregnant women to quit smoking37.
A paper by the Public Health Research Consortium (PHRC)38 published in 2010 put the NHS
costs of maternal increased complication risk as a result of smoking at £8-64million, and
infant increased illness risk as £12-23.5million. This paper estimated that spending between
£13.60-£37.00 per pregnant smoker would yield positive cost savings for the NHS. However
this is not particularly useful as real costs of smoking cessation are likely to be a lot higher
than this. Based on NICE’s model39, accounting for early mortality, the child of a quitting
mother is likely to experience 23.56 discounted QALYs, compared to 23.54 for the child of a
non-quitting mother. This difference is purely accounted for by the total number of life years
lost due to premature death. Also the child of a smoking mother is estimated to cost around
£371 more on average in health costs than the child of a quitting mother. The NICE model
estimated that an expectant mother quitting would produce on average £371 in cost savings
and 0.02 incremental QALYs gained. That means that to be considered cost effective (at a
cost per QALY of less than £30,000) any intervention would need to cost less than £971 per
quitting mother, not taking into account any additional weighting for deprivation. These
averted costs and QALYs gained were included in the WHELCS model results as well as the
benefits to the mother if they continue to quit smoking.
Figure 13 shows the trend in smoking at time of delivery in Wirral, the North West and
England for the last 5 years up to 2011/12. As stated previously, reducing smoking at time of
delivery is a target in the Public Health Outcomes Framework. Wirral has a similar rate to
England for 2011/12 at 13.2%. The stop smoking services saw 90 pregnant women in
2011/12, 21 (23%) of whom successfully quit at 4 weeks. This quit rate of 23% compares
34
O’Gorman C. (2010) Smoking in pregnancy: comparisons between data from the Infant Feeding Survey 2000 and 2005. Evidence Based Midwifery 8(4): 136-42 35
Park EW, Schultz JK, Tudiver FG, Campbell T, Becker L.(2004) Enhancing partner support to improve smoking cessation. Cochrane Database of Systematic Reviews 2004, Issue 3. [DOI: 10.1002/14651858.CD002928.pub2] 36
Cahill K, Perera R. Competitions and incentives for smoking cessation. Cochrane Database of Systematic Reviews 2011, Issue 4. Art. No.: CD004307. DOI: 10.1002/14651858.CD004307.pub4. 37
Donatelle RJ, Prows SL, Champeau D. Randomised controlled trial using social support and financial incentives for high risk pregnant smokers: significant other supporter (SOS) program. Tobacco Control 2000. 9 Suppl 3:III67-9.
38
Godfrey C, Pickett KE, Parrot S. (2010) Estimating the costs to the NHS of smoking in pregnancy for pregnant women and infants. Department of Health Sciences, The University of York: York. 39
Taylor, M. (2009) Economic Analysis of Interventions for Smoking Cessation Aimed at Pregnant Women.

Page 38 Cost effectiveness of smoking services in Wirral. Brendan Collins. October 2012 v1.5
poorly to the North West where the quit rate was 40%, and England where the quit rate was
45%.
Recommendation 13: Wirral should do more to improve the quit rate for pregnant smokers,
which in 2011/12 was 23% compared to 45% nationally.
Figure 13. Trend in percentage of women smoking at time of delivery, Wirral, North West & England,
2007/08 to 2011/12.
Source: NHS Information Centre.
2.8 Cost Effectiveness of Services for Younger People
NICE have produced guidance on school based interventions for smoking (see Box 4). The
key issues are delivering anti-smoking messages, making schools and the surrounding
areas smokefree, and integrating smoking messages into normal teaching i.e. science
classes. Smoking cessation services for adolescents in Wirral are mainly provided as part of
Health Services in Schools (HSIS). In 2011/12 financial year there were 96 smoking
cessation clients aged 14-15 years and 26 clients aged less than fourteen years. Four week
quit rates for under 16s were 50% which is higher than the average quit rate for all ages.
A review for NICE found that in general, school-based smoking prevention interventions
reduced uptake by between 9% and 24%40. However most of these studies were in a non-
UK population and the longer term effect on uptake was less well established. Some
evidence suggests that school based smoking prevention interventions only delay smoking
uptake rather than reducing adult prevalence. However delaying uptake still makes it more
likely that someone will quit successfully in the future as this is related to age of initiating
smoking, where people who started at a younger age find it harder to quit. As stated earlier,
if the national performance target around smoking quitters is removed then more investment
can move to population-level approaches, or interventions to reduce uptake like ASSIST (A
Stop Smoking in Schools Trial). ASSIST has been shown to reduce uptake significantly by
25% after one year, and by 15% after 2 years (although not statistically significantly).
40
http://www.nice.org.uk/nicemedia/live/12827/47624/47624.pdf
0.0%
5.0%
10.0%
15.0%
20.0%
25.0%
2007/08 2008/09 2009/10 2010/11 2011/12
Wirral PCT (5NK)
North West (Q31)
England

Page 39 Cost effectiveness of smoking services in Wirral. Brendan Collins. October 2012 v1.5
The ASSIST programme is a peer-based intervention which takes students aged 12-13 out
of classrooms, starting with a minimum of 80 students for the first session, then identifying
approximately 18% as the most influential opinion leaders to continue and be trained as peer
educators. Young people are more likely to smoke if their peers smoke, this is because of
peer selection – selecting friends who smoke, and peer pressure – taking up similar
behaviour to one’s peers to fit in with the group. The intervention aims to change the social
norms in the school community to be that of a non-smoking environment. ASSIST was
based on the ‘Popular Opinion Leader (POL)’ initiative for the promotion of sexual health.
ASSIST was piloted in Wales and shown to be effective across different settings, although
more effective in rural locations.
Wirral are currently trialling ASSIST in ten secondary schools. Year 8s are being recruited
into the ASSIST programme and smoking prevalence is to be measured for them when they
are in year 9. In the future with spend and outcomes data from ASSIST we will be able to
model the potential economic and health impact of ASSIST using the WHELCS model.
Box 4. Recommendations from NICE PH23 (2010); School-based interventions to prevent
smoking.
The smoking policy should support both prevention and stop smoking activities and
should apply to everyone using the premises (including the grounds).
Information on smoking should be integrated into the curriculum. For example,
classroom discussions could be relevant when teaching biology, chemistry, citizenship
and maths.
Anti-smoking activities should be delivered as part of personal, social, health and
economic (PHSE) and other activities related to Healthy Schools or Healthy Further
Education status.
Anti-smoking activities should aim to develop decision-making skills and include
strategies for enhancing self-esteem. Parents and carers should be encouraged to get
involved and students could be trained to lead some of these programmes.
All staff involved in smoking prevention should be trained to do so.
Educational establishments should work in partnership with outside agencies to
design, deliver, monitor and evaluate smoking prevention activities.

Page 40 Cost effectiveness of smoking services in Wirral. Brendan Collins. October 2012 v1.5
2.9 Cost Effectiveness of Smokefree Homes Interventions
The proportion of adults in England reporting their homes as smokefree environments
increased from 61% in 2006 to 78% in 2009. Overall in the Quit with Us database, 44.6% of
clients had answers recorded for questions on whether or not they lived with children and
whether or not they smoked at home. Of these, 24.4% said they smoked in the home. The
proportion of clients who smoked in the home was much higher for people living with
children (62.8%, see Table 17). Some of these individuals could be siblings or other relatives
but a big proportion will be parents. Smoking in the home is shown to cause harm to
children41 so this is particularly concerning and suggests that more needs to be done to
educate parents about the risks of smoking in the home. The evidence on smokefree homes
interventions is mixed. A paper by Robinson & Kirkcaldy (2007) looked at mothers in
Liverpool who smoked in the home, and showed that many believed that environmental
factors outside the home or genetics were more likely to be linked to childhood illnesses than
their own smoking.42 Smokefree homes interventions need to tackle this denial with
measures like measuring environmental, urine or saliva cotinine levels to give parents proof
of the effect their smoking is having on their children’s health. This could start by targeting
smoking parents of children with asthma or other smoking related illnesses. An Italian study
demonstrated that urine cotinine levels are directly related to parents smoking43.
Recommendation 14: It is recommended that any future smokefree homes interventions
targeted at families consider the use of clinical markers like cotinine levels to counter smoker
denial about the effect of their smoking on family members.
Table 17. Numbers of smoking cessation clients by whether live with children and smoke in the home,
2011/12 data.
Live With Children
Smoke In Home False True
False 2906 165
True 716 279
Total 3622 444
% who smoke at home
19.8% 62.8%
No data = 4057
Source: Quit with Us database.
41
Scientific Committee on Tobacco and Health (SCOTH) (2004) Secondhand Smoke: Review of evidence since 1998;
Update of evidence on health effects of secondhand smoke. 42
Robinson J and Kirkcaldy A (2007) 'You think I'm smoking and they're not': why mothers still smoke in the home. Social
Science & Medicine vol 65 pp 641-652. 43
Olivieri M, Bodini A, Peroni DG, Costella S, Pacifici R, Piacentini GL, Boner AL, Zuccaro P. (2006) Passive smoking in
asthmatic children: effect of a "smoke-free house" measured by urinary cotinine levels. Allergy Asthma Proc. 2006 Jul-
Aug;27(4):350-3.

Page 41 Cost effectiveness of smoking services in Wirral. Brendan Collins. October 2012 v1.5
2.10 Cost effectiveness of Payment by Results Trial – see Appendix 4 for full
report
A PbR (Payment by Results) smoking service pilot was commissioned in Wirral, provided by
Solutions 4 Health (S4H) from December 2011-March 2012. Payment by Results means the
service is paid per smoking quitter achieved rather than given a set budget. The PbR service
exceeded its targets of 150 four week quitters and 50 twelve week quitters. The PbR service
had a significantly higher proportion of its clients from target groups. The overall quit rate in
the PbR service was lower than other stop smoking services. See Appendix 4 for the full
economic evaluation of the PbR pilot. Qualitative evaluation work has also been carried out.
Recommendation 15: The PbR (Payment by Results) Stop Smoking Service was relatively
successful in attracting clients from target groups, so should be considered as a future
service model.
Recommendation 16: Future PbR services need to be able to prescribe Champix, which
has the highest quit rate, as this may be a lost opportunity otherwise.
2.11 Future Developments around Smoking
In future there may be more of a focus on electronic cigarettes which are being marketed as
a harm reduction aid, whereby individuals get the nicotine that they would get from tobacco
but with less toxic disease causing substances. The safety of electronic cigarettes is not
currently well regulated. The increase in electronic cigarette sales has been seen by some
as a distraction, or an attempt by tobacco companies to hold on to their market. Those in
favour of electronic cigarettes have pointed to Sweden, where snus44 (a less harmful, oral
tobacco) has replaced smoked tobacco for many men, with a concomitant drop in lung
cancer and COPD rates. Snus is banned in the European Union but is bought by some
people in other countries by mail order from Sweden and Norway where it is legal. If snus
were to be legal in the UK at some point in the future then it may be an option for harm
reduction, though probably not through public health funded services. Although snus is less
harmful than smoked tobacco it still causes dependence and possibly causes some heart
problems, although much less so than smoked tobacco. Electronic cigarettes and snus have
the potential to deliver a lot more nicotine than cigarettes and therefore be more addictive.
NICE (the National Institute for Health & Clinical Excellence) are currently looking at
producing guidance around harm reduction for smokers (expected May 2013), the theory of
which goes against previous convention which was to focus mainly on interventions to help
people to quit smoking altogether rather than reduce their risk of harm. This new guidance
will include recommendations around electronic cigarettes.
We have previously mentioned potential future policy measures like banning smoking in
cars, having plain packaging for tobacco, and increasing availability of NRT products, as well
as banning smoking near schools.
44
Foulds, J. Ramstrom, L. Burke, M. Fagerström, K. (2003) Effect of smokeless tobacco (snus) on smoking and public health in Sweden. Tobacco Control 2003;12:4 349-359 doi:10.1136/tc.12.4.349

Page 42 Cost effectiveness of smoking services in Wirral. Brendan Collins. October 2012 v1.5
There have been several attempts to produce a nicotine vaccine that blocks the pleasurable
effects from smoking, either for children to reduce uptake, or to help smokers to quit. This is
still several years away.
Recommendation 17: Senior officers in Wirral should use their voice with national
organisations to lobby for more smoking legislation to create an environment that further
decreases the social acceptability of smoking.
Recommendation 18: Wirral should investigate measures to discourage outdoor smoking
particularly near schools, in parks, and in other areas where young people are likely to be.
Recommendation 19: Quitting smoking should be part of public sector culture.
Appendix 1. WHELCS Economic Modelling-Study Methods
1.1 Hypothesis – The hypothesis is that the smoking services provided in
Wirral are a cost effective use of public resources.
1.2 Location This study looks at Wirral, a peninsula in North West England,
with a population of 319,800 as at the 2011 Census.
1.3 Time horizon – The outcomes data was for one year. Most smoking is
only measured as whether someone has quit successfully at 4 weeks,
although 12 week data was recorded for some clients. The outcomes
were modelled for 20 years, based on a baseline assumption that 8% of
four week quitters become lifetime quitters.
1.4 Participants and procedures
The data was for 3,379 smokers who quit with services in Wirral in
2011/12. The types of interventions are shown in Table 4 and Table 5.
1.5 Randomisation and method of randomisation – There was no
randomisation used and no control group data as such.
1.6 Costs and source of cost data Costs were derived from service line
reporting, measured in GBP, 2012.
1.6.1 Describe which costs are fixed costs and which are
variable
This is shown in Table 10. Only staff, overheads and drugs
costs were included in the model.
1.7 Outcomes measured
Number of people engaging with services, number of quitters, prevalence
of diseases, QALYs, costs, life years gained.
1.8 Long term outcomes modelling-
Long term outcomes were modelled using an individual cohort model,
where the baseline model looked at prevalence, QALYs lost and
healthcare costs from smoking-related diseases. These diseases were
lung cancer, COPD (chronic obstructive pulmonary disease), CHD
(coronary heart disease), MI (myocardial infarction or heart attack), and
stroke. The baseline model was adjusted by applying the age and gender

Page 43 Cost effectiveness of smoking services in Wirral. Brendan Collins. October 2012 v1.5
of each smoking quitter for 2011/12 and switching individuals from being
smokers to be ex-smokers, and ageing them through 20 years, applying
the age-specific mortality rates for non-smokers and measuring the
discounted cost savings and QALY gains when compared to the baseline
model. The rest of the model was kept constant over the 20 years, i.e. no
assumptions were made about demographic change or background
smoking prevalence changing. This was to isolate the effect of the
intervention. 20 years was chosen because with discounting and
background mortality the net effect became very small after 20 years. The
model did not take into account knock on effects such as reduced
morbidity and mortality through second hand smoke.
1.8.1. Choice of model – The model was chosen as a good fit based on
the data available.
1.8.2 Model parameters drawn from evidence
Populations Single year of age (SYOA) population estimates for males and females for Wirral, ONS 2010. The Census data for 2011 showed that the population of Wirral had been underestimated by around 3%, however refreshed SYOA population estimates were not available at the time of constructing this model.
Mortality Average of mortality by single year of age for Wirral, 2007-2011 (5 years pooled) from ONS. Five years data was used to smooth out random fluctuations which may occur, particularly in age groups where deaths are rare.
Smoking prevalence
Smoking prevalence by age (16+) was taken from the Wirral smoking prevalence survey September 2011. This data is for the most deprived areas of Wirral where smoking prevalence is higher than the whole of Wirral. The proportions of men and women in three groups (current smoker, ex-smoker and never smoked) was adjusted by a factor from the IHS (Integrated Household Survey) smoking prevalence data, October 2010-September 2011, until the total smoking prevalence for males and females matched to the nearest 1%.
Disease prevalence
This was from NICE model (2007) which had disease prevalence by single year of age for smokers, ex-smokers and never smoked. n.b. the COPD prevalence came out slightly lower than the measured prevalence, this may be partly because COPD definition was extended in 2011 to include more people as having mild COPD. The NICE model is from 2007. The prevalence of lung cancer was based on Peto R, Darby S, Deo H, Silcocks P, Whitley E, Doll R. Smoking, Smoking Cessation, and Lung Cancer in the UK Since 1950: Combination of National Statistics with Two Case-Control Studies. British Medical Journal. 2000; 321 323-329. The prevalence of the other diseases was based on Department of Health and Human Services, National Center for Chronic Disease Prevention and Health Promotion, Office on Smoking and Health, Washington DC. The Health Consequences of Smoking: A Report by the Surgeon General. 2004.
Utility scores
This was from NICE model for disease groups, and Wirral wellbeing survey for smokers and non-smokers – we have used additive utility which may overestimate the lost utility due to smoking, as most surviving older smokers will have more than

Page 44 Cost effectiveness of smoking services in Wirral. Brendan Collins. October 2012 v1.5
one disease due to smoking. The utility scores are shown in the table in the next section. Life years gained were given a utility score of 0.7 which was the average utility score for people aged 55 and over in Wirral, based on the 2009 wellbeing survey.
Risk of death
This is from Doll (1994). It is assumed that under the age of 35, the relative risk ratio of deaths of smokers/non-smokers/ex-smokers is 1:1:1.
1.8.3 Source of cost estimates
Disease costs are from the NICE (2007) model. They have been inflated
to 2012 prices using the Hospital & Community Health Services (HCHS)
inflation index (PSSRU, 2011). The costs are only for disease prevalence,
not for acute events, or for deaths. They are health costs and do not
include social care and other consequential costs.
Comorbidity Utility Cost per year 2006
Cost per year 2011 Data source
Lung cancer 0.58 £5,501 £6,077.97 NICE model
CHD 0.8 £1,063 £1,174.49 NICE model
MI 0.8 £2,175 £2,403.12 NICE model
COPD 0.73 £926 £1,023.12 NICE model
Stroke 0.48 £2,061 £2,277.17 NICE model
Current smoker 0.75 NICE model
Former smoker 0.78 NICE model
Current smoker 0.75013169
Wirral wellbeing survey
Former smoker 0.78597945
Wirral wellbeing survey
Non smoker 0.80193229
Wirral wellbeing survey
1.8.4 Discounting
Change in longer term costs and benefits as a result of smoking quitters
were discounted at 3.5% per year. This is the standard discount rate
recommended by the UK treasury. Discounting costs and benefits is
standard in economic modelling to take into account time preference (that
people prefer to receive benefits now than in the future) and that events in
the future are subject to more uncertainty.
1.8.5 Parameter sensitivity analysis
A parameter sensitivity analysis was carried out where the quit rate was
varied between 6% and 10%. Also the discount rate was varied between
0% and 6%.

Page 45 Cost effectiveness of smoking services in Wirral. Brendan Collins. October 2012 v1.5
1.8.6 Structural sensitivity analysis
A structural sensitivity analysis (where the model type or structure is
varied) was not carried out, but the results were compared to the results
from the Value for Money tool, which is another economic model for
estimating the impact of smoking cessation.
Appendix 2. Recommendations from Cough Up (2010) by Robert Nash & Henry
Featherstone, Policy Exchange
In order to re-balance tobacco income and expenditure in our society we propose the following
measures:
Tobacco taxation should be increased by 5% in the next Budget. This would see the price of a
pack of cigarettes rise by 23 pence from £6.13 to £6.36 per packet and generate over £400
million for HM Treasury.
The tobacco duty escalator should be re-introduced to increase the cost of tobacco over the
course of the next Parliament to ensure tobacco use becomes revenue neutral to our society.
Currently, cigarettes are being under-taxed by £1.29 per packet which amounts to £2.82 billion in
lost revenue for HM Treasury. Detailed cost and revenue changes over time would need further
modelling.
To prevent people from switching from packets of cigarettes to hand-rolled tobacco (HRT) as a
means of avoiding tax increases, the duty on HRT should be increased to a level commensurate
with cigarettes, since HRT is under-taxed in comparison with other forms of tobacco.
Only a tiny fraction of smokers wanting to quit use the NHS Stop Smoking Service. To increase
referral rates to this highly cost-effective service, funding of mass media campaigns should be
increased by £10 million per annum to both continually educate the public and encourage higher
levels of self-referral.
Encouraging smokers to quit needs to become part of NHS culture. Every patient that expresses
an interest in stopping smoking to an NHS professional should automatically be referred to the
NHS Stop Smoking Service.
Varenicline is the most cost-effective treatment option in the NHS Stop Smoking Service. Studies
consistently demonstrate it to be superior to any other therapy, but it is only used in 20% of cases.
Varenicline should be offered as first line drug treatment for all patients wishing to quit smoking –
this would cost £36 million.
All forms of Nicotine Replacement Therapy (NRT) are comparably expensive and much less
prevalent than cigarettes, despite not having the substantial tax burden of tobacco. Perversely,
NRT is regulated to a greater degree than tobacco, despite it being a much safer product. We
recommend moving to light-touch regulation of NRT in order to encourage a more competitive
market with lower prices.
It should become a legal obligation for NRT to be prominently stocked in all retailers that sell also
tobacco products. This would help those people attempting to stop smoking, who may suffer from
cravings and be near to a cigarette retailer, but not an NRT retailer.
Smoking is a socially inherited disease: a smoking mother increases the chances of a child
smoking.
Drug treatments are not licensed for use in pregnancy, and NRT is only minimally effective.
Therefore, a specialist stop smoking service for pregnant mothers should be established
throughout the country, as part of either maternity units, or the current NHS Stop Smoking
Services. Direct financial incentives to stop smoking of £10 per week have been found to be

Page 46 Cost effectiveness of smoking services in Wirral. Brendan Collins. October 2012 v1.5
effective in limited trials and therefore should be offered to all pregnant women of, or below, the
age of 20 – this would cost £36 million annually.
Prevention of addiction is the crucial next step in reducing smoking prevalence. A body of
evidence demonstrates the effectiveness of mass media campaigns targeted at young adults to
prevent tobacco addiction. Independent research shows these media campaigns would cost £10
million per year to implement.
Appendix 3. Recommendations from ‘Healthy Lives, Healthy People: A
Tobacco Control Plan for England’
Local authorities will take a leading role in improving tobacco control in their communities.
The following recommendations for good practice in local tobacco control are informed by
the experience that the Department of Health’s National Support Team has gained by
working with local areas:
• Address tobacco control through strategic multi-agency partnership working, senior
level accountability and a dedicated, co-ordinating resource.
• Promote compliance with tobacco legislation, for example activities to stop underage
sales of tobacco, to promote smokefree legislation and to reduce the availability of illicit
tobacco.
• Develop and communicate a clear understanding of the harm caused by tobacco,
and understanding of the benefits of supporting smokers to quit, particularly by frontline staff.
• Provide local stop smoking services in ways that maximise accessibility and
outreach, particularly for groups with high rates of smoking prevalence. These services
should be provided in a way that maximises value for money.
• Get the most out of commissioning by developing and supporting existing and
potential markets. Build in processes to ensure robust performance monitoring and
management of commissioned service providers.
• Use local data and intelligence to develop a local tobacco control strategy and action
plan that has appropriate and measurable outcomes.
• Encourage community engagement and development so that local people can get
involved and become advocates if they wish to.
• Develop a co-ordinated local communication strategy.
• Encourage local people to make their homes and cars smokefree.
Appendix 4. Cost Effectiveness Review of PbR Smoking Service in Wirral.

Page 47 Cost effectiveness of smoking services in Wirral. Brendan Collins. October 2012 v1.5
Cost Effectiveness of PbR (Payment by Results) Smoking
Service in Wirral: Initial Results
August 2012
Author: Brendan Collins
Version: 1.1
Version
Number
Date Author Reviewer Actions
0.6 2nd June 2012 Brendan Collins First Draft
0.7 12th June 2012 Brendan Collins Kim Ozano Second draft with amended costs
0.8 15th June
2012
Brendan Collins Kim Ozano Third draft with info and changes requested by Kim
0.95 9th July Brendan Collins Includes more NRT cost comparisons
1.0 20th July Brendan Collins Will Sopwith/
Kim Ozano
Includes adjusted quit rates as suggested by WS
Amended 2011/12 SSS figures
1.1 10TH
August Brendan Collins Kim Ozano Amended costs and added in section on impact of
Champix
Summary
A PbR (Payment by Results) smoking service pilot was commissioned in Wirral, provided by Solutions 4 Health (S4H) from December 2011-March 2012. Payment by Results means the service is paid per smoking quitter achieved rather than given a set budget.
The PbR service exceeded its targets of 150 four week quitters and 50 twelve week quitters.
The PbR service had a significantly higher proportion of its clients from target groups.
The overall quit rate in the PbR service was lower than other stop smoking services.
The PbR service came out as cost effective when data was entered into a Value for Money tool; the service had a cost per QALY of £493 per QALY (including NRT).

Page 48 Cost effectiveness of smoking services in Wirral. Brendan Collins. October 2012 v1.5
1. Background
This document is to summarise initial results around the pilot of a Payment by Results (PbR)
service for smoking cessation in Wirral. PbR services differ from traditional stop smoking
services because instead of a whole service being commissioned and funded (with targets
for numbers of quitters), services will be paid by a tariff for results, in this case the outcome
being whether a client has successfully quit. This approach will hopefully stimulate the
market meaning that more innovative and flexible services will be provided, and that services
can be provided by a range of providers who are safe in knowing how they will be paid for
the outcomes they achieve. In this way local commissioners can tailor the tariff they pay to
incentivise providers to target their service at certain groups. In Wirral the target groups
were;
1. BME (People from black and minority ethnic groups)
2. Routine and Manual Workers
3. Individuals living in the 20% most deprived areas
4. Under 25’s
5. Unemployed
6. Offenders
7. Severe and Enduring Mental Health
8. Deaf, hard of hearing, blind or partially sighted
The PbR approach also means that results can be given different tariffs, for example
targeted groups can attract a higher tariff, and successful 12 week quitters (and potentially
longer term quitters) can attract a higher tariff than 4 week quitters. The evidence is that
many 4 week quitters relapse into smoking again before they reach 6 months, so any tariff
for 12 week quitters would have to be set to incentivise a quit rate that was over and above
what would be expected given the 4 week quit rate, and expected rates of persistence
between 4 weeks and 12 weeks.
A pilot in the Midlands of PbR smoking cessation services which began in April 2010 was
successful in increasing supply and reducing health inequalities. Since then the DH has said
it supports the "introduction of a non-mandatory currency for smoking cessation services
under the payment by results (PbR) framework in 2011/12, following the positive evaluation
of the ongoing pilot of this approach in the West Midlands".45
There were risks identified in the Midlands pilot around the budget for PbR effectively being
uncapped, so while increasing uptake of what is a very cost-effective intervention is a good
thing, it could potentially destabilise the commissioner’s budget plans. Similar issues are
observed with hospital inpatient activity which has been mostly Payment by Results since
2003/04. These issues are overcome partly by close monitoring of patterns of patient activity
through the year.
45DH (2011) Healthy lives, healthy people: a tobacco control plan for England
http://www.dh.gov.uk/en/Publicationsandstatistics/Publications/PublicationsPolicyAndGuidance/DH_124917

Page 49 Cost effectiveness of smoking services in Wirral. Brendan Collins. October 2012 v1.5
One action that the pilot recommended was that PbR behaviour change interventions should
be commissioned on a regional scale so that potential new providers are attracted by the
scale of the market and so that there are economies of scale in responding to challenges.
Unfortunately this has not been possible yet for Wirral.
Wirral commissoned Solutions 4 Health (S4H) to deliver a PbR pilot from December 2011.
the PbR service directly supplied clients with NRT (nicotine replacement) but not Zyban
[bupropion] or Champix [vanrenicline], whereas the Stop Smoking Service would issue
vouchers for NRT or could prescribe Zyban and Champix too.The evidence is that Champix
is shown to be more effective at helping individuals to quit than NRT or so any comparison
between services needs to take this into account.The choice to use Zyban, NRT and
Champix is made based on the clients wishes and is not a random one, so while for instance
Champix alone may appear to be the most successful option, this does not mean that say for
people who have used NRT alone this was not the option with the most potential for success
for them based on their circumstances.
This paper is looking at initial results around four week quitters. 12 week quitters data is
collected under the PbR service but not generally collected by the other services so some
assumptions would have to be made around comparing outcomes for a longer time period.
2. Data Sources
The data was taken from the Quit With Us online database, as of 23/05/12. This data was
matched to PbR service based on quit venue, as there was not any easy way to match
clients to service and there were some inconsistencies in the database. Any duplicate clients
were taken out, but any clients who have had more than one quit attempt in the time period
(20th December 2011 – 31st March 2012) will be included for each attempt. There were some
inconsistencies in the data, such as clients where type of intervention setting was down as
‘stop smoking service’ but then based on venue they were using the PbR service. There
were also several clients recorded as using Champix and NRT, or Zyban and Champix,
which are not likely combinations of interventions. The numbers of clients retrieved from the
database differed slightly from the numbers provided by S4H in their evaluation plan as
shown in Table 1.
The final version of data sent by S4H had 257 four week quitters and 70 twelve week
quitters. This included some clients who were not present in the data when it was extracted
and some who had not been labelled as using the PbR service. There are some clients in
the database who are recorded as successfully quitting with more than one service in the
time period.
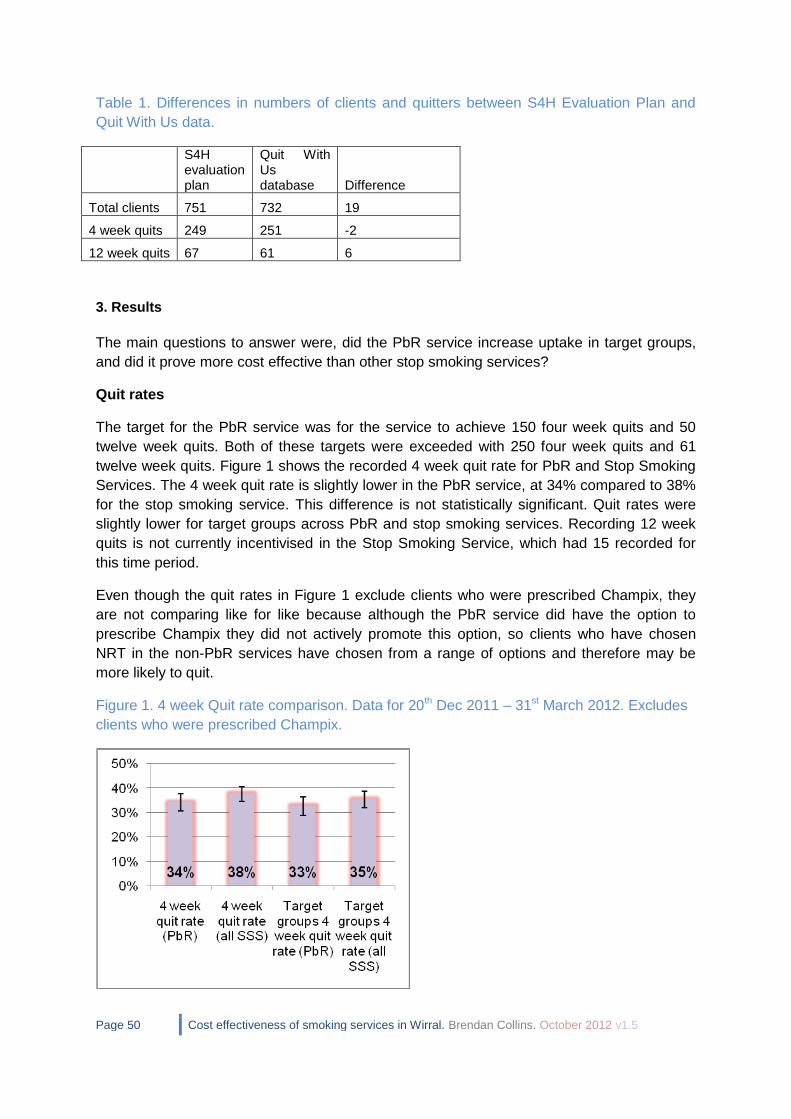
Page 50 Cost effectiveness of smoking services in Wirral. Brendan Collins. October 2012 v1.5
Table 1. Differences in numbers of clients and quitters between S4H Evaluation Plan and
Quit With Us data.
S4H evaluation plan
Quit With Us database Difference
Total clients 751 732 19
4 week quits 249 251 -2
12 week quits 67 61 6
3. Results
The main questions to answer were, did the PbR service increase uptake in target groups,
and did it prove more cost effective than other stop smoking services?
Quit rates
The target for the PbR service was for the service to achieve 150 four week quits and 50
twelve week quits. Both of these targets were exceeded with 250 four week quits and 61
twelve week quits. Figure 1 shows the recorded 4 week quit rate for PbR and Stop Smoking
Services. The 4 week quit rate is slightly lower in the PbR service, at 34% compared to 38%
for the stop smoking service. This difference is not statistically significant. Quit rates were
slightly lower for target groups across PbR and stop smoking services. Recording 12 week
quits is not currently incentivised in the Stop Smoking Service, which had 15 recorded for
this time period.
Even though the quit rates in Figure 1 exclude clients who were prescribed Champix, they
are not comparing like for like because although the PbR service did have the option to
prescribe Champix they did not actively promote this option, so clients who have chosen
NRT in the non-PbR services have chosen from a range of options and therefore may be
more likely to quit.
Figure 1. 4 week Quit rate comparison. Data for 20th Dec 2011 – 31st March 2012. Excludes
clients who were prescribed Champix.
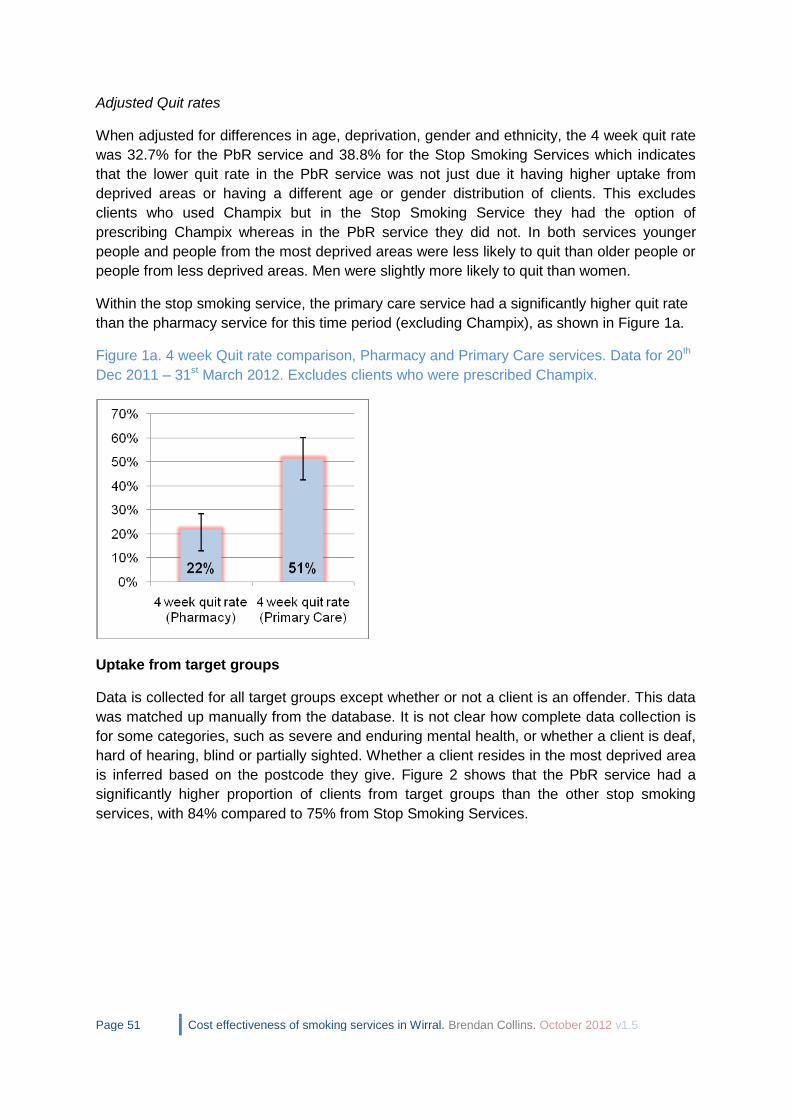
Page 51 Cost effectiveness of smoking services in Wirral. Brendan Collins. October 2012 v1.5
Adjusted Quit rates
When adjusted for differences in age, deprivation, gender and ethnicity, the 4 week quit rate
was 32.7% for the PbR service and 38.8% for the Stop Smoking Services which indicates
that the lower quit rate in the PbR service was not just due it having higher uptake from
deprived areas or having a different age or gender distribution of clients. This excludes
clients who used Champix but in the Stop Smoking Service they had the option of
prescribing Champix whereas in the PbR service they did not. In both services younger
people and people from the most deprived areas were less likely to quit than older people or
people from less deprived areas. Men were slightly more likely to quit than women.
Within the stop smoking service, the primary care service had a significantly higher quit rate
than the pharmacy service for this time period (excluding Champix), as shown in Figure 1a.
Figure 1a. 4 week Quit rate comparison, Pharmacy and Primary Care services. Data for 20th
Dec 2011 – 31st March 2012. Excludes clients who were prescribed Champix.
Uptake from target groups
Data is collected for all target groups except whether or not a client is an offender. This data
was matched up manually from the database. It is not clear how complete data collection is
for some categories, such as severe and enduring mental health, or whether a client is deaf,
hard of hearing, blind or partially sighted. Whether a client resides in the most deprived area
is inferred based on the postcode they give. Figure 2 shows that the PbR service had a
significantly higher proportion of clients from target groups than the other stop smoking
services, with 84% compared to 75% from Stop Smoking Services.

Page 52 Cost effectiveness of smoking services in Wirral. Brendan Collins. October 2012 v1.5
Figure 2. Uptake from target groups. Data for 20th Dec 2011 – 31st March 2012.
Table 4 shows that quit rates were slightly lower for target groups and non-target groups for
the PbR service compared to the Stop Smoking Service. The PbR service had 80% of
quitters from target groups compared to 71% of quitters in the Stop Smoking Service.
Table 2. Quit rate by target groups.
PbR SSS
Target group quit rate 33% 35%
Non target group quit rate 42% 45%
Uptake by gender and age group
Uptake by gender was similar for the PbR and non-PbR services, with a greater proportion
of females than males using the service.
Table 3. Proportion of uptake by gender. Data for 20th Dec 2011 – 31st March 2012.
Gender PbR SSS Total
Female 58% 56% 57%
Male 42% 44% 43%
Quit rates in the PbR group were lower for both males and females, with the gap between
PbR and non-PbR being wider in males.
Table 4. Quit ratesby gender. Data for 20th Dec 2011 – 31st March 2012.
Quit rate Gap between PbR and SSS PbR SSS
Female 35% 39% 4%
Male 32% 41% 9%
In terms of uptake by age group, the PbR service had a greater proportion of people aged
18-24 and fewer people aged over 55 than the Stop Smoking Service.

Page 53 Cost effectiveness of smoking services in Wirral. Brendan Collins. October 2012 v1.5
Figure 3. Uptake by age group. Data for 20th Dec 2011 – 31st March 2012.
Uptake by ethnicity
Minority ethnic groups are not a priority for the Stop Smoking Service because Wirral
Change is commissioned to specifically offer smoking cessation services to minority ethnic
groups. Overall the PbR pilot had a greater proportion of clients from BME groups, classed
as not 'White British'. The PbR pilot achieved significantly higher uptake in Bangladeshi
groups than the Stop Smoking Service, but had fewer people from Chinese and ‘any other
White background’.
Figure 4. Uptake by minority ethnic groups, includes all groups except ‘White British’ and
‘not stated’. Data for 20th Dec 2011 – 31st March 2012.

Page 54 Cost effectiveness of smoking services in Wirral. Brendan Collins. October 2012 v1.5
Uptake by Routine & Manual Groups and Unemployed
The PbR service had a slightly higher proportion of clients from routine and manual groups,
but slightly lower proportion of unemployed clients. The PbR service had a higher proportion
of sick or disabled, home carers and full time students than the Stop Smoking Service.
Figure 5. Uptake by socio economic classification. Data for 20th Dec 2011 – 31st March
2012.
The stop smoking service had higher quit rates than the PbR service for clients who were
unemployed, sick or disabled, or home carers. The service PbR had a higher quit rate for
intermediate occupations (Figure 6). Some of these groups have quite small numbers so it
would be wrong to try to infer too much from these differences.
Figure 6. Quit rate by socio economic classification. Data for 20th Dec 2011 – 31st March
2012.

Page 55 Cost effectiveness of smoking services in Wirral. Brendan Collins. October 2012 v1.5
Uptake by Deprivation
The PbR and Stop Smoking Service had similar levels of uptake from the areas of Wirral that
fall into the 3% most deprived nationally, based on the Index of Multiple Deprivation (IMD)
2010. The PbR service had significantly higher uptake from the areas that fall into the 20%
most deprived nationally (which also includes the 3% areas).
Table 5. Uptake by Deprivation category. Data for 20th Dec 2011 – 31st March 2012.
PbR SSS
Proportion of clients from
20% Most Deprived 66% 53%
Proportionof clients from
3% Most Deprived 21% 22%
The quit rates were higher in the stop smoking service for clients from the 20% and 3% most
deprived, with the gap in quit rates being greater for the 3%.
Table 6. Quit rate by Deprivation category. Data for 20th Dec 2011 – 31st March 2012.
PbR SSS
Gap between PbR and SSS
Quit rate (20% national) 32% 35% 3%
Quit rate (3% national) 27% 33% 6%
Cost effectiveness of PbR Service
Table 7. Summary of cost data, PbR service.
Total targeted 4 week quitters 194
Total other 4 week quitters 57
Total targeted 12 week quitters 51
Total other 12 week quitters 10
PbR Spend 4 week targeted (£136) £26,384
PbR Spend 4 week non targeted (£94) £5,358
PbR Spend 12 week targeted (£271) £13,821
PbR Spend 12 week non targeted (£128) £1,280
Total PbR spend £46,843
Total cost of NRT/Champix/Zyban £52,166
Total cost £98,241
Total cost / quitter £394
Cost / quitter excluding NRT £187
In the PbR service, a tariff is only paid per quitter, so even if the PbR service has a lower quit
rate it can still represent a more cost effective solution than a more costly service with a

Page 56 Cost effectiveness of smoking services in Wirral. Brendan Collins. October 2012 v1.5
higher quit rate. However if the quit rate in a PbR service was particularly low, it could be
argued that the service was wasting opportunities for individuals who may quit more
successfully in other services.
Table 7 shows estimates of the cost of the PbR service. This includes the tariff paid for 4
week and 12 week quitters from target and non-target groups, as well the cost of NRT. The
overall cost per 4 week quitter comes out as £391 including NRT and Champix costs. The
published cost per quitter for smoking services are submitted to the NHS Information Centre
each year, but they do not always quantify costs correctly. The North West average cost per
for 2010/11 was £194 and the England average was £220 per quitter.
The cost per quitter for the PbR service excluding pharmacotherapy is £187 which is lower
than this, which suggests that the PbR service is a cost-effective alternative, and in addition
the PbR service had a higher uptake from target groups than the SSS.
Table 8 shows spend on NRT for stop smoking services and the PbR service. Despite the
PbR service having direct supply of NRT products, it does not incur higher spend on NRT.
The data in Table 8 uses whole financial year data for the Stop Smoking Service because
the spend data is not easy to disaggregate within year.
Table 8. Comparison of cost per quitter data.
SSS (2011/12 FY)
PbR (Dec 2011-Apr 2012)
Total clients 6546 732
4 Week Quitters 2648 251
Clients using NRT 4131 607
% using NRT 63% 83%
Total cost of service excl. Pharmacological agents £684,469 £46,843
Additional spend on NRT £512,837 £50,101
Additional spend on Champix £278,327 £2,045
Additional spend on Zyban £3,056 £20
Additional spend on pharmacy NRT £43,377.89 Total cost of service £1,522,067 £99,009
Cost per client who used NRT £124 £83
NRT Spend per client (all clients) £78 £68
Cost per quitter excluding pharmacological agents £258 £187
Total cost per quitter £575 £394
Estimating the impact of Champix
As stated previously, the PbR service was not able to prescribe Champix whereas the Stop
Smoking Service was able to. The unit cost for each client using Champix was around £220
per client. There would also be some additional indirect costs for Champix regarding GP’s
time in checking, signing and returning the prescriptions. In the Stop Smoking Service,
18.7% of clients for 2011/12 were issued with Champix which resulted in a total quit rate that
was an estimated 5.6% higher than it would be without Champix. If this was applied to the
PbR service, then this would have increased the number of quits by 14 from 251 to 265, and

Page 57 Cost effectiveness of smoking services in Wirral. Brendan Collins. October 2012 v1.5
increased the total cost per quitter from £394 to £478. The incremental cost per QALY for
adding Champix to the PbR service is quite high at around £16,500 per additional QALY
gained. But there may also be an effect of getting more people into using stop smoking
services when there are more options available to help clients to quit, which cannot be
directly estimated. Also because clients in the database selected how they wanted to quit it
is wrong to attribute outcomes in the same way you would in a randomised controlled trial,
because for instance smokers with lots of previous quit attempts may be more likely to try
Champix but not succeed, which may make it seem like it has a lower success rate, but
actually has a good success rate for those who use it compared to how many would quit
without it. It may be that to make Champix more cost effective it should be targeted towards
clients who are most likely to benefit from it.
Cost utility
Cost utility (cost per QALY) is a summary measure of how much it costs to increase individuals’ quality of life, length of life, or a combination of both. The costs of the PbR service and numbers of quitters were entered into the NSMC Value for Money tool46, a quick ready reckoner type tool for estimating the cost effectiveness of smoking services. These cost effectiveness estimates are based on applying WHO (World Health Organisation) burden of disease data around the burden of ill health (years lived in disability or YLD) and mortality (years of life lost) that are due to smoking. These summary DALYs (disability adjusted life years) lost through smoking are converted to QALYs (quality adjusted life years) gained through quitting smoking. These are calculated based on individuals achieving a behaviour change and moving from being high to low risk of experiencing smoking-related illnesses. If the intervention is not successful in producing persistent behaviour change, then individuals will not benefit in the same way as predicted by the tool.
Table 9 shows the costs and number of quits for the PbR service. It shows the number of
QALYs gained and NHS cost savings based on inputting these data into the NSMC Value for
Money tool. These costs and benefits are based on a lifetime model but are discounted at
3.5% per annum to take account of social time preferences, i.e. that people prefer to receive
benefits in the present than to wait until the future, and also that costs and benefits in the
future are subject to more uncertainty than those in the present. The QALYs gained, and
cost savings to the NHS, are from reduced morbidity and mortality from cardiovascular
disease, COPD, and cancer, particularly lung cancer. Overall the NSMC tool indicated that
the PbR intervention prevented between 2 and 3 deaths from smoking related disease, and
had an overall cost per QALY of £742, compared to no intervention, using a health service
perspective, or £35 using a health service and local authority perspective.
46
NSMC Value for Money Tool available at: http://thensmc.com/resources/vfm

Page 58 Cost effectiveness of smoking services in Wirral. Brendan Collins. October 2012 v1.5
Table 9. Summary of cost utility of PbR Smoking Service
Cost of service £99,009
N of 4 week quitters 251
QALYs gained 25.66
NHS Cost savings £79,963
Local Authority Cost Savings £18,145
Net cost after cost savings £900
Net cost/QALY gained (Health Perspective) £742
Net cost/QALY gained (Health & Local Authority Perspective) £35
Cost savings to the NHS and Local Authorities
Savings to the NHS in the tool are based on reduced incidence of smoking related diseases
like CVD, COPD and cancer47. Savings to local authorities and other local services in the
tool include reduced spend on social care, street cleaning, and fires. In 2008/09, £7.8 billion
was spent nationally on social care for adults with health related problems. These savings
are allocated on the basis of weighted years lived with disability attributable to smoking.
These figures are inflated to 2011/12 prices. For street cleaning, total expenditure on street
cleaning for England in 2008/9 was reported by ONS as £858million. Estimates quoted by
Robert Nash and Henry Featherstone in Policy Exchange Research Note of March
2010,"Cough Up" show £342million as the cost of cigarette litter for the UK. Potential
savings are calculated on the basis of 25% of this figure, recognising that street cleaning
costs involve a lot of fixed costs.The consequent cost saving is allocated on the basis of
reductions in smoking years. For Fire and Emergency services, total spend for England in
2008/9 was reported by ONS as £2.2billion. The estimated total cost of fires in 2004 was
£7billion for England and Wales of this £507million was attributed to smoking in domestic
buildings. Allocating fire service costs on the same basis as overall fire costs suggests a cost
relating to smoking of £160 per smoker per year. In the long term 50% of fire service costs
are assumed to relate to incidence of fires. This is reduced in line with the reduction in
smoking years. Overall the estimated average savings to local authorities from smoking
quitters across social care, street cleaning, and fire & emergency is £18,145 for the PbR
service.
47
Callum C, Boyle S, Sandford A. (2010) Estimating the cost of smoking to the NHS in England and
the impact of declining prevalence. Health Economics Policy & Law. doi:10.1017/S1744133110000241

Page 59 Cost effectiveness of smoking services in Wirral. Brendan Collins. October 2012 v1.5
Appendix 5. NICE Return on Investment tool for Tobacco Control
v1.0. Headline Figures for Wirral (based on default parameters).
Return on Investment tool for Tobacco Control v1.0
Headline Figures
Wirral
Model run on 19-Oct-2012 11:19
Summary of your input parameters
Your selected area is Wirral where the adult population (18+ years) is 242,037, of whom roughly 55,626 (22.98%) are current smokers. Wirral has an ex-smoking population of 33.73%. The average hourly wage rate in Wirral is assumed to be £11.68.
The following headline figures summarise the expected impact of implementing both a package of local interventions alone and local interventions plus a sub-national tobacco control strategy.
50.86% of smokers are allocated to smoking cessation interventions.
A breakdown of your selected package of interventions is as follows:
16.58% of smokers received NHS SSS;
17.01% received other, non-NHS interventions.
You have chosen to include GP brief advice in your intervention package.
Therefore, 17.27% received GP brief advice.
The current burden of smoking in Wirral
How much is smoking costing in Wirral?
The total annual cost of smoking in Wirral is £17,047,716*, which can be broken down as:
NHS Costs: £12,664,046
Costs to businesses (productivity losses): £4,183,961
Passive smoking costs: £193,783 (adults: £137,700; children: £56,083)
How does this relate to NHS events (e.g. number of hospital admissions?)
The £12,664,046 in annual NHS costs are the result of:
60,140 GP consultations;
16,864 practice nurse consultations;
11,540 outpatient visits;
2,857 hospital admissions; and
33,439 prescriptions.

Page 60 Cost effectiveness of smoking services in Wirral. Brendan Collins. October 2012 v1.5
*Total annual costs include £5,925 in social care costs arising from 2.51 care episodes due to smoking-attributable strokes. This calculation assumes that only about 3% of all smoking attributable conditions are stroke, of which a small proportion need Local Authority care (see Technical Report for further details).
Investing in interventions
How much will you be required to invest in Wirral for your chosen package of interventions?
In the first year**, you will need to invest a sum of £2,163,646 to implement your selected package of local interventions. This can be broken down as:
NHS SSS running costs: £1,477,069
Other non-NHS interventions running costs: £538,660 GP brief advice running costs: £147,917
Establishing a sub-national tobacco control programme would cost Wirral an additional £91,748, giving an overall implementation cost of £2,255,394 for a local plus sub-national combined strategy.
**The benefits that follow are based on a one-off cost and one year quit rate of interventions.
Top Level Parameters
Selected area: Wirral Smoking
prevalence: 22.98%
(North West)
Ex-smoking prevalence: 33.73%
Adult population: 242,037 Average wage
rate: £11.68 Smoking
population: 55,626 Days of absence
/ year: 1.63
Cost per QALY: £20,000 Receiving GP Advice: 26.00% of otherwise unallocated smokers
(17.27% of all smokers)
Intervention-Specific Parameters
Allocation of smokers to NHS
SSS interventions: 16.58%
Allocation of smokers to other
interventions: 17.01%
Total allocation of smokers to
interventions: 33.59%
Name Allocation Effectiveness Cost
Mono NRT + group support 3.34% 18.13% £114.17
Combo NRT + group support 0.05% 22.89% £134.93
Varenicline + group support 0.01% 26.66% £222.60
Bupropion + group support 1.90% 20.55% £126.24
Mono NRT + one-to-one 8.34% 13.93% £177.48

Page 61 Cost effectiveness of smoking services in Wirral. Brendan Collins. October 2012 v1.5
support
Combo NRT + one-to-one support 0.14% 18.13% £198.25
Varenicline + one-to-one support 0.04% 21.34% £285.91
Bupropion + one-to-one support 0.95% 15.63% £189.56
Mono NRT + drop-in support 1.67% 10.42% £177.48
Combo NRT + drop-in support 0.05% 13.93% £198.25
Varenicline + drop-in support 0.01% 17.30% £285.91
Bupropion + drop-in support 0.09% 12.19% £189.56
OTC Mono NRT 9.10% 3.92% £0.00
Prescription Mono NRT 2.00% 6.76% £79.24
Prescription Combo NRT 1.70% 9.52% £100.00
Varenicline 2.80% 11.31% £187.67
Bupropion 0.60% 7.69% £91.31
Pharmacy one-to-one support 0.01% 2.96% £197.77
Proactive telephone support 0.30% 7.69% £178.22
Internet support 0.20% 7.69% £5.00
Text to Stop 0.10% 8.61% £16.56
Self help books and booklets 0.20% 4.88% £5.00
Your return portfolio
What is the extent of return on your investment in Wirral for your chosen package of interventions? In the short term (first 2 years), you will save a total of £1,561,150 with a local plus sub-national strategy combined or £909,227 with a local only strategy. These are a gross savings and do not include the cost of implementing the packages. The model assumes that the sub-national programme increases the quit rate by 3% at a cost of 40p per head of population i.e. for Wirral this would cost an additional £127,920.
The potential savings can be broken down as†:
Local plus sub-national Local only
5,509 GP consultations; 3,209 GP consultations;
1,544 practice nurse consultations; 899 practice nurse consultations;
1,058 outpatient visits; 616 outpatient visits;
261 hospital admissions; and 152 hospital admissions; and
3,061 presciptions. 1,783 presciptions.
With a cost saving to the NHS of £1,159,147
With a cost saving to the NHS of £674,929
792 passive smoking related treatment cases. 461 passive smoking related treatment cases.
With a cost saving to the NHS of £17,754
With a cost saving to the NHS of £5,171
4,315 lost days due to smoking. 2,513 lost days due to smoking.
With a cost saving to businesses (public, private and voluntary sectors) of £383,708
With a cost saving to businesses (public, private and voluntary sectors) of £223,640

Page 62 Cost effectiveness of smoking services in Wirral. Brendan Collins. October 2012 v1.5
† Gross savings include unlisted savings to social care costs due to reductions in smoking-related
strokes. These savings amount to £5,654 for Local plus sub-national and £5,768 for Local only.
Overview of the metrics
The return*** on investment for the local plus subnational strategy combined can be summarised by the following ROI metrics:
Metric 2 years 5 years 10 years Lifetime
Number of QALYS gained per 1,000 smokers
1.89 4.62 9.19 31.98
Incremental costs to NHS per smoking related death averted
£83,767 £16,794 £3,087 Package is
dominant****
Incremental costs to NHS per life year gained
£290,587 £25,547 £2,880 Package is
dominant****
Incremental costs to NHS per QALY gained
£16,116 £4,646 £944 Package is
dominant****
Benefit-cost ratio (NHS savings) 0.22 0.45 0.78 1.92
Benefit-cost ratio (NHS savings and the value of health gains)
1.19 1.80 3.43 11.07
Net present value (NPV) of NHS cost-savings
-£31 -£21 -£9 £36
Net present value (NPV) of NHS cost-savings and the value of health gains
£7 £71 £175 £675
The return*** on investment for the local only strategy can be summarised by the following ROI metrics:
Metric 2 years 5 years 10 years Lifetime
Number of QALYS gained per 1,000 smokers
1.11 2.62 5.16 17.78
Incremental costs to NHS per smoking related death averted
£144,639 £37,159 £12,669 Package is
dominant****
Incremental costs to NHS per life year gained
£501,754 £55,707 £11,709 Package is
dominant****
Incremental costs to NHS per QALY gained
£28,900 £10,273 £3,855 Package is
dominant****
Benefit-cost ratio (NHS savings) 0.18 0.31 0.49 1.12
Benefit-cost ratio (NHS savings and the value of health gains)
0.75 1.66 3.14 10.27
Net present value (NPV) of NHS cost-savings
-£32 -£27 -£20 £5
Net present value (NPV) of NHS cost-savings and the value of health gains
-£10 £26 £83 £360
*** The term ‘return’ refers to the fact that both the costs of implementing your package of interventions and the benefits (health and non-health, including NHS cost-savings from smoking attributable diseases) are included in the metrics.

Page 63 Cost effectiveness of smoking services in Wirral. Brendan Collins. October 2012 v1.5
**** A package dominates when it is both less costly and produces more benefits, compared to the baseline.
In Summary
Compared with the baseline (i.e., no intervention) your selected package of interventions is expected to:
1) Result in a gain of 1.11, 2.62, 5.16 and 17.78 QALYs per 1,000 population over 2 years, 5 years, 10 years and lifetime respectively (local only strategy).
- The inclusion of a subnational strategy would increase these figures to 1.89, 4.62, 9.19 and 31.98 respectively.
2) Cost an additional £144,639 over 2 years, £37,159 over 5 years and £12,669 over 10 years per smoking-related death averted but cost less and save more lives over lifetime (local strategy only).
- The inclusion of a subnational strategy would reduce these costs to £83,767 over 2 years, £16,794 over 5 years and £3,087 over 10 years and would start to cost less and save more lives than baseline by the lifetime time horizon.
3) Cost an additional £501,754 over 2 years, £55,707 over 5 years and £11,709 over 10 years per life year gained but cost less and save more lives over lifetime (local strategy only).
- The inclusion of a subnational strategy would reduce these costs to £290,587 over 2 years, £25,547 over 5 years and £2,880 over 10 years and would start to cost less and save more lives than baseline by the lifetime time horizon.
4) Cost an additional £28,900 over 2 years, £10,273 over 5 years and £3,855 over 10 years per QALY gained but cost less and save more lives over lifetime (local strategy only).
- The inclusion of a subnational strategy would reduce these costs to £16,116 over 2 years, £4,646 over 5 years and £944 over 10 years and would start to cost less and save more lives than baseline by the lifetime time horizon.
5) Give a return of £0.18, £0.31, £0.49 and £1.12 over 2 years, 5 years, 10 years and lifetime respectively, for each pound spent on implementing the package, if only NHS savings are considered (local strategy only).
- The inclusion of a subnational strategy would increase these returns to £0.22, £0.45, £0.78 and £1.92 respectively.
6) Give a saving of £0.75, £1.66, £3.14 and £10.27 over 2 years, 5 years, 10 years and lifetime respectively, for each pound spent on implementing the package, if both NHS savings and the value of health gains are considered (local strategy only).
- The inclusion of a subnational strategy would increase these savings to £1.19, £1.80, £3.43 and £11.07 respectively.
7) Cost an additional £32, £27 and £20 per smoker over 2 years, 5 years and 10 years respectively but give a saving of £5 per smoker over lifetime, net of package implementation costs if only NHS savings are considered (local strategy only).
- The inclusion of a subnational strategy would reduce costs at 2 years, 5 years and 10 years (£31, £21 and £9 respectively), generating a saving of £36 over lifetime.
8) Cost an additional £10 per smoker over 2 years but give a saving of £26, £83 and £360 per smoker over 5 years, 10 years and lifetime respectively, net of package implementation costs if both NHS savings and the value of health gains are considered (local strategy only).
- The inclusion of a subnational strategy would generate savings of £7, £71, £175 and £675 respectively.