cost effectiveness analysis - amfar, the foundation effectiveness analysis • costs and resource...
TRANSCRIPT

Cost‐Effectiveness Analysis
Benjamin P. Linas, MD, MPH and Callie A. Scott, MScMassachusetts General Hospital
TREAT Asia Annual MeetingOctober 17, 2010
Outline
1. Overview of cost‐effectiveness analysis (CEA) and the questions it can answer
2. A closer look at the components of a CEA3. Guidance on how to critically examine CEA
in the literature4. A consideration of the limitations of CEA and
the ethical implications of cost‐effectiveness research
2

Consider an ART program in 2010
• Limited resources and growing demand for care.
• Many options for improving outcomes:1. Expand eligibility from CD4<200/ul to <350/ul?
2. Change first‐line ART to Tenofovir‐based regimen?
3. Provide additional lines of ART?
4. Use routine HIV RNA to monitor therapy?
3
What should you do?
• Each option will likely improve outcomes.
• Each option will come with increased cost.
• Given that you cannot adopt all of these options, which ones should you prioritize?
4
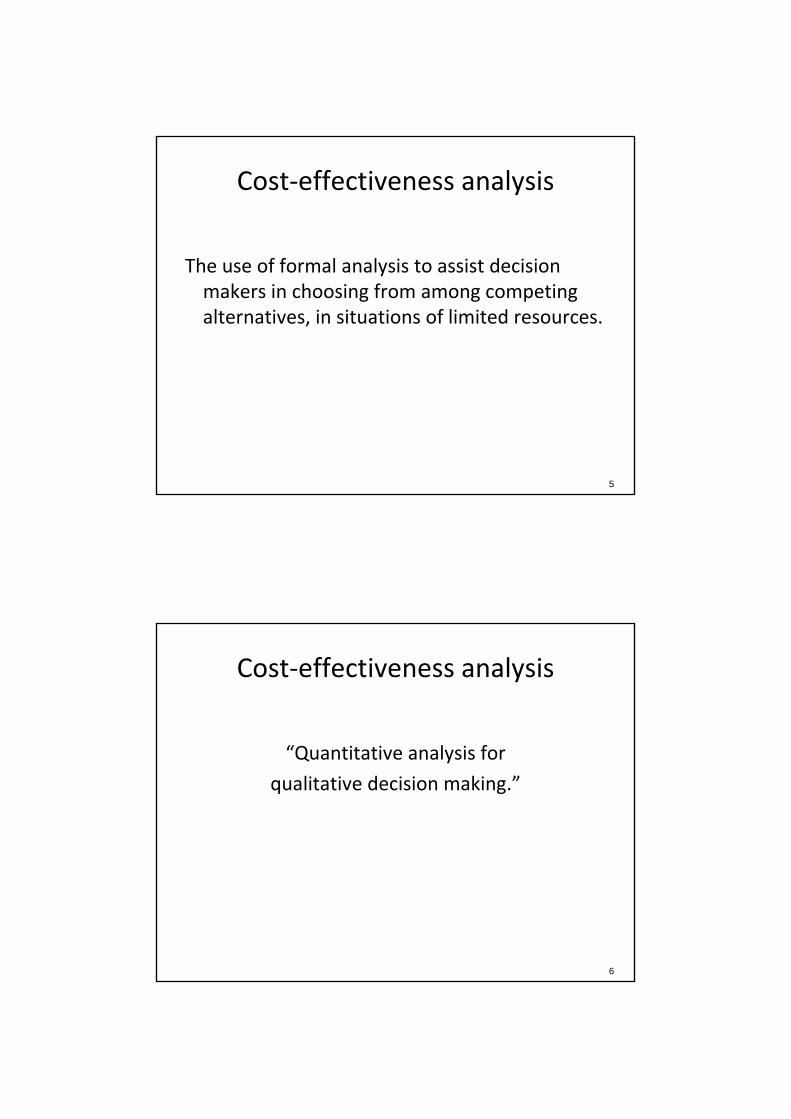
Cost‐effectiveness analysis
The use of formal analysis to assist decision makers in choosing from among competing alternatives, in situations of limited resources.
5
Cost‐effectiveness analysis
“Quantitative analysis for
qualitative decision making.”
6

Cost‐effectiveness analysis
• An assessment of “value for money.”
• Money = net resources consumed in providing an intervention
• Value = improvement in health outcome
7
Cost‐effectiveness analysis
• Guides maximization of total aggregate health benefits under a given level of available resources.
8

Outline
1. Overview of cost‐effectiveness analysis (CEA) and the questions it can answer
2. A closer look at the components of a CEA3. Guidance on how to critically examine CEA
in the literature4. A consideration of the limitations of CEA and
the ethical implications of cost‐effectiveness research
9
Cost‐effectiveness analysis
• Costs and resource savings are valued in monetary terms.
• Consequences are valued in terms of a single measure of health outcome (cases prevented, lives saved, years of life gained, quality‐adjusted years of life gained).
• Results are reported as an incremental cost‐effectiveness ratio, or ICER.
10

What is an ICER?
• ICER =
11
Net change in cost
Net change in health effect
What is an ICER?
• An ICER values interventions by examining the benefits they confer compared to the benefits that might be obtained if resources were allocated to another intervention.
• Incremental is the critical concept.
• An ICER is a comparison between two options, not a measure of the average cost per unit of clinical benefit.
12
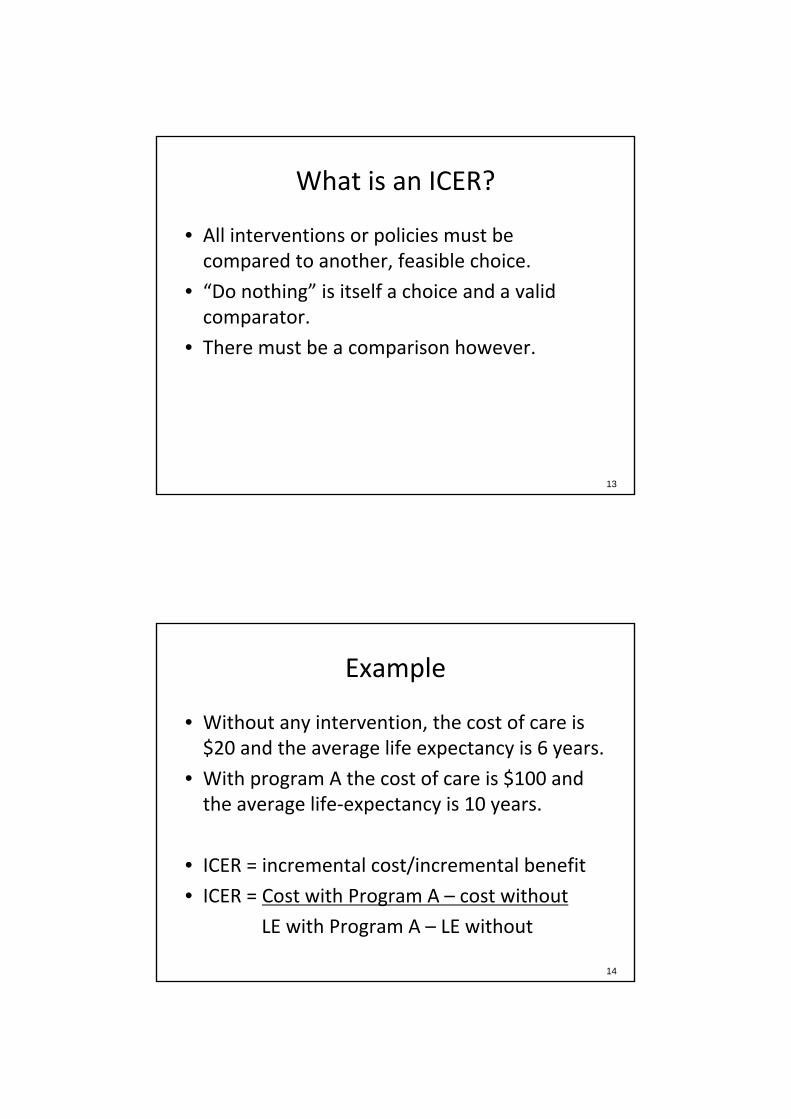
What is an ICER?
• All interventions or policies must be compared to another, feasible choice.
• “Do nothing” is itself a choice and a valid comparator.
• There must be a comparison however.
13
Example
• Without any intervention, the cost of care is $20 and the average life expectancy is 6 years.
• With program A the cost of care is $100 and the average life‐expectancy is 10 years.
• ICER = incremental cost/incremental benefit
• ICER = Cost with Program A – cost without
LE with Program A – LE without
14

Example
• ICER = 100‐20/10‐6
• ICER = $20/life‐year saved
15
ICER is NOT
• Program A costs $100/person.
• Program A results in an individual life expectancy of 10 years.
• Therefore the cost‐effectiveness of program A is cost/life expectancy = 100/10 = $10/life‐year.
• This is NOT a comparison
16

Exercise
• Do exercise 1a – simple ICER without dominance
17
Exercise 1a
18
Strategy Mean lifetime cost ($)
LE (years) ∆ Cost ∆ LE
ICER ($/LY gained)
No ART 2,500 4 ‐‐‐ ‐‐‐ ‐‐‐
1 line ART, CD4 <200/μl 5,000 9
1 line ART, CD4 <350/μl 7,000 10
2 lines ART, CD4 <200/μl 10,000 11
2 lines ART, CD4 <350/μl 13,000 11.5

Exercise 1a
19
Strategy Mean lifetime cost ($)
LE (years) ∆ Cost ∆ LE
ICER ($/LY gained)
No ART 2,500 4 ‐‐‐ ‐‐‐ ‐‐‐
1 line ART, CD4 <200/μl 5,000 9 2,500 5 500
1 line ART, CD4 <350/μl 7,000 10 2,000 4 2,000
2 lines ART, CD4 <200/μl 10,000 11 3,000 1 3,000
2 lines ART, CD4 <350/μl 13,000 11.5 3,000 0.5 6,000
Is it worth it?
+
−
+ −
IncrementalHealth Effect
Incremental Cost
Yes
NoEvaluate
C/ERatio
EvaluateC/ERatio
20

Exercise 1b
• Do exercise 1b with strong dominated option
21
Exercise 1b – Step 1
22
Strategy Mean lifetime cost ($)
LE (years) ∆ Cost ∆ LE
ICER ($/LY gained)
No ART 2,500 4 ‐‐‐ ‐‐‐ ‐‐‐
1 line ART, CD4 <200/μl 5,000 9
“Cureavir”, CD4<200/μl 6,000 7
1 line ART, CD4 <350/μl 7,000 10
2 lines ART, CD4 <200/μl 10,000 11
2 lines ART, CD4 <350/μl 13,000 11.5

Exercise 1b – Step 1
23
Strategy Mean lifetime cost ($)
LE (years) ∆ Cost ∆ LE
ICER ($/LY gained)
No ART 2,500 4 ‐‐‐ ‐‐‐ ‐‐‐
1 line ART, CD4 <200/μl 5,000 9 2,500 5
“Cureavir”, CD4<200/μl 6,000 7 1,000 ‐2 DOM*
1 line ART, CD4 <350/μl 7,000 10 1,000 3
2 lines ART, CD4 <200/μl 10,000 11 3,000 1
2 lines ART, CD4 <350/μl 13,000 11.5 3,000 0.5
*Strong dominance: A strategy is excluded by strong dominance if it costs more but provides less life years gained than an alternative strategy.
Is it worth it?
+
−
+ −
IncrementalHealth Effect
Incremental Cost
Yes
NoEvaluate
C/ERatio
EvaluateC/ERatio
24

Exercise 1b – Step 2
25
Strategy Mean lifetime cost ($)
LE (years) ∆ Cost ∆ LE
ICER ($/LY gained)
No ART 2,500 4 ‐‐‐ ‐‐‐ ‐‐‐
1 line ART, CD4 <200/μl 5,000 9 2,500 5
1 line ART, CD4 <350/μl 7,000 10 2,000 4
2 lines ART, CD4 <200/μl 10,000 11 3,000 1
2 lines ART, CD4 <350/μl 13,000 11.5 3,000 0.5
Exercise 1b – Step 2
26
Strategy Mean lifetime cost ($)
LE (years) ∆ Cost ∆ LE
ICER ($/LY gained)
No ART 2,500 4 ‐‐‐ ‐‐‐ ‐‐‐
1 line ART, CD4 <200/μl 5,000 9 2,500 5 500
1 line ART, CD4 <350/μl 7,000 10 2,000 4 2,000
2 lines ART, CD4 <200/μl 10,000 11 3,000 1 3,000
2 lines ART, CD4 <350/μl 13,000 11.5 3,000 0.5 6,000

Exercise 1c
• Do exercise 1c with extended dominance option
27
Exercise 1c – Step 1
28
Strategy Mean lifetime cost ($)
LE (years) ∆ Cost ∆ LE
ICER ($/LY gained)
No ART 2,500 4 ‐‐‐ ‐‐‐ ‐‐‐
1 line ART, d4T <200/μl 5,000 8
1 line ART, Cureavir <350/μl 6,000 7
1 line ART, TDF <350/μl 7,000 10
2 lines ART, d4T <350/μl 12,000 12
2 lines ART, TDF <350/μl 13,000 13

Exercise 1c – Step 1
29
Strategy Mean lifetime cost ($)
LE (years) ∆ Cost ∆ LE
ICER ($/LY gained)
No ART 2,500 4 ‐‐‐ ‐‐‐ ‐‐‐
1 line ART, d4T <200/μl 5,000 8 2,500 4
1 line ART, Cureavir <350/μl 6,000 7 1,000 ‐1 DOM*
1 line ART, TDF <350/μl 7,000 10 1,000 3
2 lines ART, d4T <350/μl 12,000 12 5,000 2
2 lines ART, TDF <350/μl 13,000 13 1,000 1
*Strong dominance: A strategy is excluded by strong dominance if it costs more but provides less life years gained than an alternative strategy.
Exercise 1c – Step 2
30
Strategy Mean lifetime cost ($)
LE (years) ∆ Cost ∆ LE
ICER ($/LY gained)
No ART 2,500 4 ‐‐‐ ‐‐‐ ‐‐‐
1 line ART, d4T <200/μl 5,000 8 2,500 4
1 line ART, TDF <350/μl 7,000 10 2,000 2
2 lines ART, d4T <350/μl 12,000 12 5,000 2
2 lines ART, TDF <350/μl 13,000 13 1,000 1

Exercise 1c – Step 2
31
Strategy Mean lifetime cost ($)
LE (years) ∆ Cost ∆ LE
ICER ($/LY gained)
No ART 2,500 4 ‐‐‐ ‐‐‐ ‐‐‐
1 line ART, d4T <200/μl 5,000 8 2,500 4 625
1 line ART, TDF <350/μl 7,000 10 2,000 2 1,000
2 lines ART, d4T <350/μl 12,000 12 5,000 2 2,500
2 lines ART, TDF <350/μl 13,000 13 1,000 1 1,000
Exercise 1c – Step 2
32
Strategy Mean lifetime cost ($)
LE (years) ∆ Cost ∆ LE
ICER ($/LY gained)
No ART 2,500 4 ‐‐‐ ‐‐‐ ‐‐‐
1 line ART, d4T <200/μl 5,000 8 2,500 4 625
1 line ART, TDF <350/μl 7,000 10 2,000 2 1,000
2 lines ART, d4T <350/μl 12,000 12 5,000 2 Dom*
2 lines ART, TDF <350/μl 13,000 13 1,000 1 1,000
*Extended (weak) dominance: A strategy is excluded by extended dominance if its ICER relative to the next less costly, undominated alternative is greater than that of a more costly alternative.
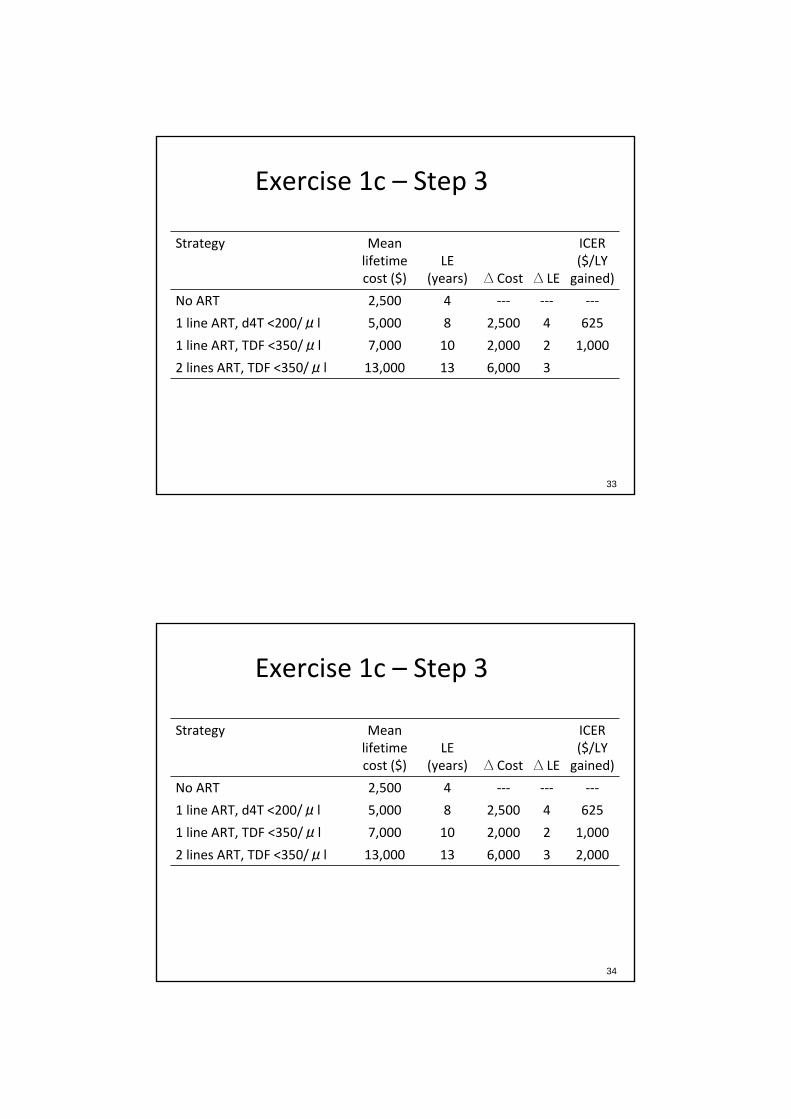
Exercise 1c – Step 3
33
Strategy Mean lifetime cost ($)
LE (years) ∆ Cost ∆ LE
ICER ($/LY gained)
No ART 2,500 4 ‐‐‐ ‐‐‐ ‐‐‐
1 line ART, d4T <200/μl 5,000 8 2,500 4 625
1 line ART, TDF <350/μl 7,000 10 2,000 2 1,000
2 lines ART, TDF <350/μl 13,000 13 6,000 3
Exercise 1c – Step 3
34
Strategy Mean lifetime cost ($)
LE (years) ∆ Cost ∆ LE
ICER ($/LY gained)
No ART 2,500 4 ‐‐‐ ‐‐‐ ‐‐‐
1 line ART, d4T <200/μl 5,000 8 2,500 4 625
1 line ART, TDF <350/μl 7,000 10 2,000 2 1,000
2 lines ART, TDF <350/μl 13,000 13 6,000 3 2,000

ICER lessons learned
• ICER must be a comparison!
• All cost‐effectiveness ratios are incremental cost‐effectiveness ratios.
• It is very important to know what you are comparing to.
35
The importance of the comparator
36
Strategy Mean lifetime cost ($)
LE (years) ∆ Cost ∆ LE
ICER ($/LY gained)
No ART 2,500 4 ‐‐‐ ‐‐‐ ‐‐‐
1 line ART, d4T <200/μl 5,000 8 2,500 4 625
1 line ART, TDF <350/μl 7,000 10 2,000 2 1,000
2 lines ART, TDF <350/μl 13,000 13 6,000 3 2,000
Return to Exercise 1c:

The importance of the comparator
37
Strategy Mean lifetime cost ($)
LE (years) ∆ Cost ∆ LE
ICER ($/LY gained)
No ART 2,500 4 ‐‐‐ ‐‐‐ ‐‐‐
2 lines ART, TDF <350/μl 13,000 13 10,500 9 1,167
Return to Exercise 1c:
Common errors to avoid
• Reporting ratios of total cost to total life years
• Reporting a negative ICER– Decreased cost for increased benefit = cost saving
– Increased cost for decreased benefit = strongly dominated
• Failing to exclude strongly or weakly dominated strategies
• Claiming that the strategy with the lowest ICER is the best choice
38

Which strategy is the best choice?
39
Strategy Mean lifetime cost ($)
LE (years) ∆ Cost ∆ LE
ICER ($/LY gained)
No ART 2,500 4 ‐‐‐ ‐‐‐ ‐‐‐
1 line ART, d4T <200/μl 5,000 8 2,500 4 625
1 line ART, TDF <350/μl 7,000 10 2,000 2 1,000
2 lines ART, TDF <350/μl 13,000 13 6,000 3 2,000
Which strategy is the best choice?
• Correct approach is to choose the most effective strategy whose ICER is less than the threshold cost/LY after excluding dominated strategies
40
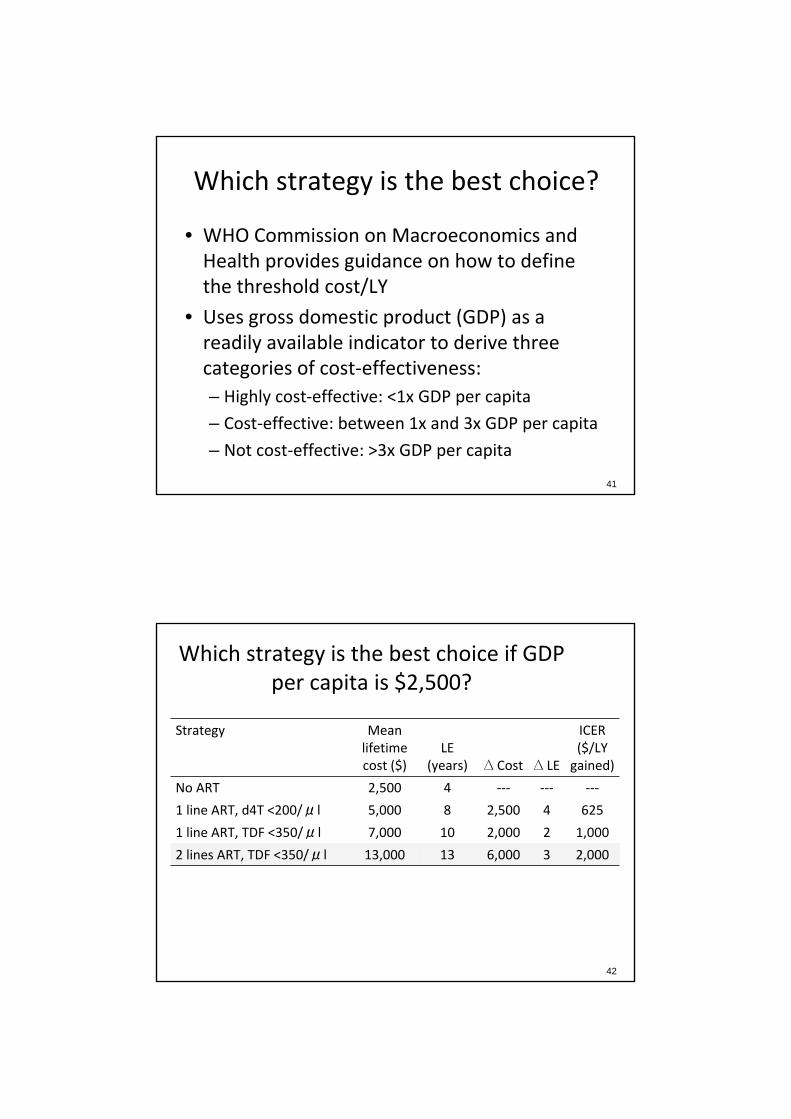
Which strategy is the best choice?
• WHO Commission on Macroeconomics and Health provides guidance on how to define the threshold cost/LY
• Uses gross domestic product (GDP) as a readily available indicator to derive three categories of cost‐effectiveness:– Highly cost‐effective: <1x GDP per capita
– Cost‐effective: between 1x and 3x GDP per capita
– Not cost‐effective: >3x GDP per capita
41
Which strategy is the best choice if GDP per capita is $2,500?
42
Strategy Mean lifetime cost ($)
LE (years) ∆ Cost ∆ LE
ICER ($/LY gained)
No ART 2,500 4 ‐‐‐ ‐‐‐ ‐‐‐
1 line ART, d4T <200/μl 5,000 8 2,500 4 625
1 line ART, TDF <350/μl 7,000 10 2,000 2 1,000
2 lines ART, TDF <350/μl 13,000 13 6,000 3 2,000

Which strategy is the best choice if GDP per capita is $300?
43
Strategy Mean lifetime cost ($)
LE (years) ∆ Cost ∆ LE
ICER ($/LY gained)
No ART 2,500 4 ‐‐‐ ‐‐‐ ‐‐‐
1 line ART, d4T <200/μl 5,000 8 2,500 4 625
1 line ART, TDF <350/μl 7,000 10 2,000 2 1,000
2 lines ART, TDF <350/μl 13,000 13 6,000 3 2,000
Common misconceptions
1. Cost‐effective = saves money
2. Cost‐effective = cheap
3. Cost‐effective = policy must or even should be adopted
44

Questions
45
Outline
1. Overview of cost‐effectiveness analysis (CEA) and the questions it can answer
2. A closer look at the components of a CEA3. Guidance on how to critically examine CEA
in the literature4. A consideration of the limitations of CEA and
the ethical implications of cost‐effectiveness research
46

Methods for CEA
1. Data collected alongside a randomized clinical trial
2. Decision trees
3. Markov models
47
Data collected with an RCT
• RCT can collect information about costs at the same time that they collect data about effectiveness.
• ICER is a simple calculation using prospectively collected data.
• In some sense the gold standard.
• BUT…
48

Data collected with an RCT
• What if the end‐point of the trial is not death?
• What if the trial ends at 48 weeks and you are interested in outcomes that occur over a longer time horizon?
• What if there are too many options to be able to study all with an RCT?
• What if the net effect you expect to see would require an RCT with N=millions?
49
Model‐based decision analysis
• Decision analysis methods address many of the shortcomings of the RCT design.
• Allow for linking short or intermediate term outcomes from RCT to long‐term mortality.
• Allow for investigation of many options.
• Allow for studying questions for which the RCT would simply be too large and expensive.
• Allow synthesis of many data sources.
50

Decision analysis
• Core concept – “the decision has to be made.”
• Whether or not the data are perfect. We have to do something. Doing “nothing” is a choice. We must make a choice, so let’s make the best one we can.
51
Decision analysis
1. Decision tree
2. Markov model

Decision trees
• You are trying to decide how to manage TB diagnosis in your ART program. The prevalence of HIV/TB co‐infection in your program is 10%.
• Option 1 – check a CXR and treat if positive
• Option 2 – check a “new diagnostic” and treat if positive
53
Costs and outcomes
54
Patient dispositionMean LE (yrs)
Mean life‐time cost
Diagnosed and treated (true positive)
9 15,000
Missed TB (false negative)
1 20,000
False diagnosis(false positive)
7.5 4,000
No TB(true negative)
10 2,000

Test Characteristics
Test Sensitivity Specificity Cost
CXR 0.7 0.95 $10
New diagnostic 0.9 0.99 $200


ICER of new test vs. CXR
Strategy Cost LE ΔCost
Δ LEICER
($/LYS)
Screen CXR $2,605 9.55 ‐ ‐ ‐
Screen new test
$3,568 9.80 $963 0.25 $3,852
Decision Tree Limitations
1. What if the benefits and consequences of various strategies do not all occur at the same time?
2. What if probabilities change with time?
3. What if there is the possibility of recurring events?
4. What if the decision is complicated and the tree becomes very “bushy”
60

Markov Model
• Model life expectancy as a series of transitions between health states.
• The model advances time in fixed increments, and with each movement of the clock there is a probability of moving between states
• By tabulating the amount of time spent in each state, the model estimates LE
• By attaching a cost to each state, the model estimates lifetime costs.
• By modeling various strategies , we can compare Costs and LE and generate ICER.
61
Markov Model
62
SICKWELL
DEAD

Models, in summary
• While different types of models may be chosen to accommodate the complexity of the problem, all rely on mathematical analysis to compare the expected outcomes under different alternatives.
63
Coffee Break

Components of a CEA
1. Health consequences
2. Costs
65
Specifying health consequences
• To be cost‐effective, an intervention needs to be effective!
• Measures of effectiveness– Life years gained
– Quality‐adjusted life years (QALYs) gained
– Clinical outcomes
• The appropriate measure of effectiveness depends on the expected impact of the intervention and the outcomes that are of interest to decision makers
66
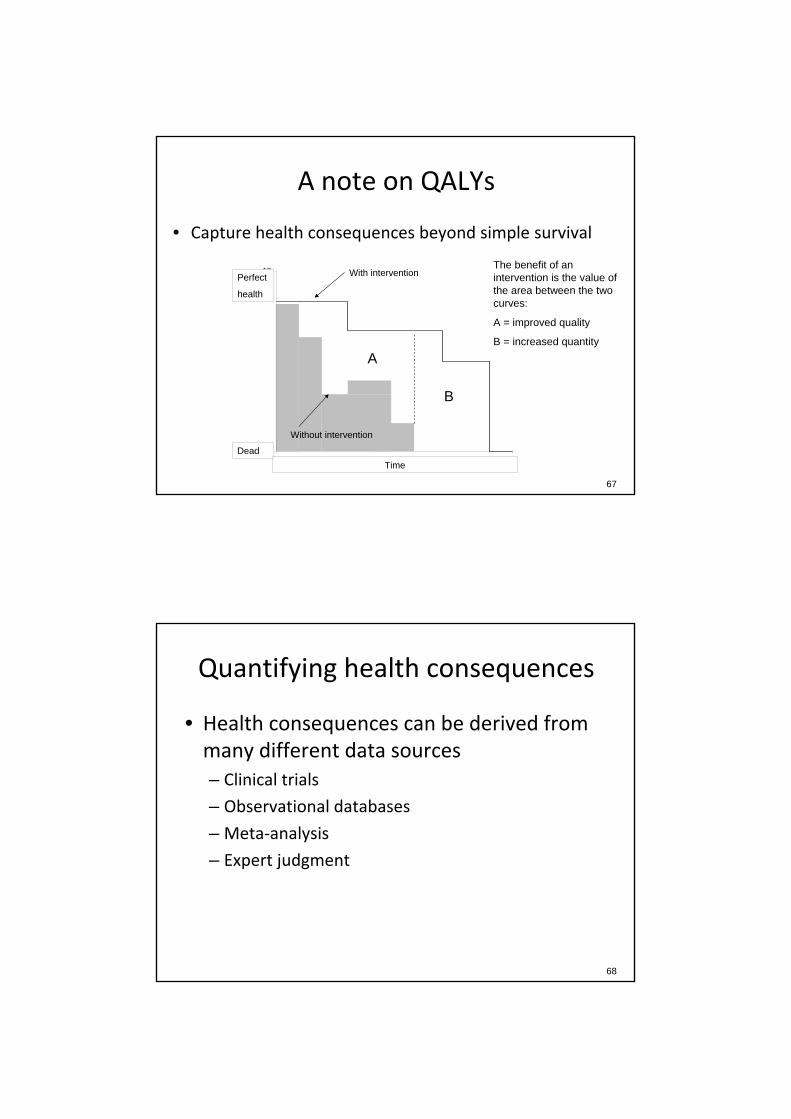
A note on QALYs
• Capture health consequences beyond simple survival
0
12
0 10
Perfect
health
DeadTime
A
B
The benefit of an intervention is the value of the area between the two curves:
A = improved quality
B = increased quantity
With intervention
Without intervention
67
Quantifying health consequences
• Health consequences can be derived from many different data sources– Clinical trials
– Observational databases
– Meta‐analysis
– Expert judgment
68

Quantifying health consequences
• Models combine information from these different data sources by making explicit assumptions about the incidence and/or prognosis of a disease and the magnitude and duration of intervention risks and benefits
69
Example 1
• A randomized evaluation of a nutritional intervention provides Hg and HCT as endpoints, but not mortality.
• A model must incorporate assumptions about the link between Hg and HCT and mortality in order to estimate the life expectancy associated with the intervention.
70
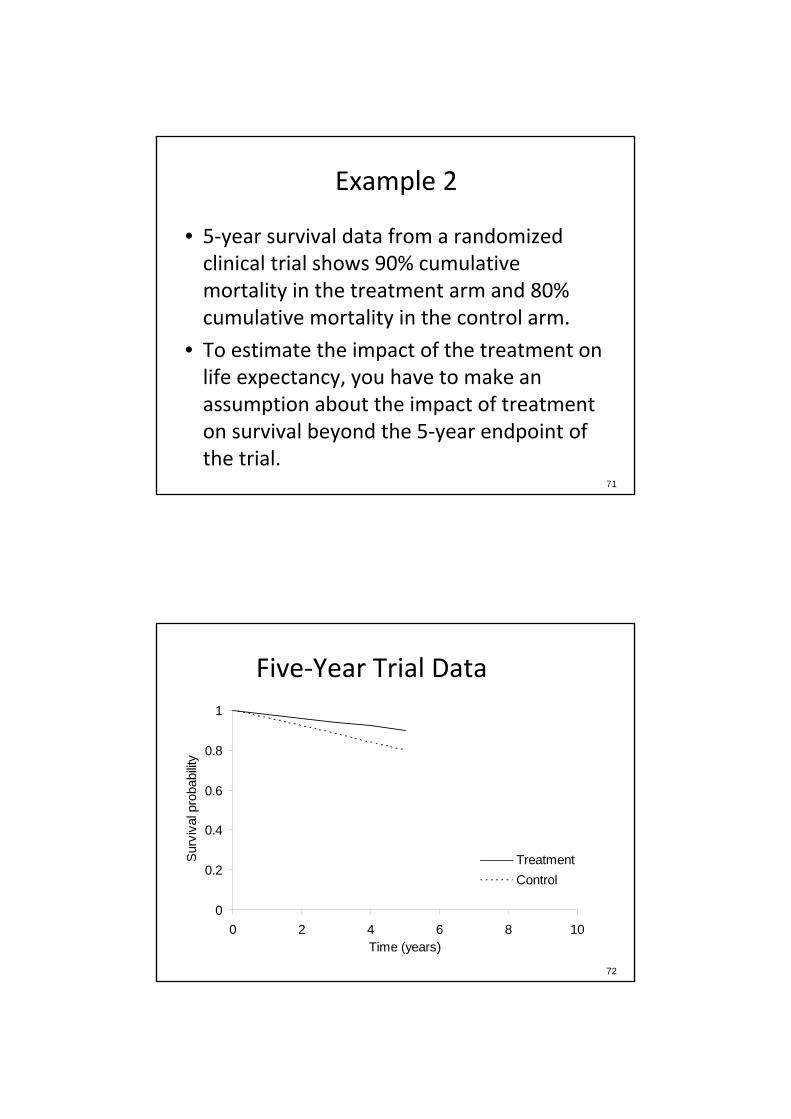
Example 2
• 5‐year survival data from a randomized clinical trial shows 90% cumulative mortality in the treatment arm and 80% cumulative mortality in the control arm.
• To estimate the impact of the treatment on life expectancy, you have to make an assumption about the impact of treatment on survival beyond the 5‐year endpoint of the trial.
71
Five‐Year Trial Data
72
0
0.2
0.4
0.6
0.8
1
0 2 4 6 8 10Time (years)
Surv
ival
pro
babi
lity
TreatmentControl
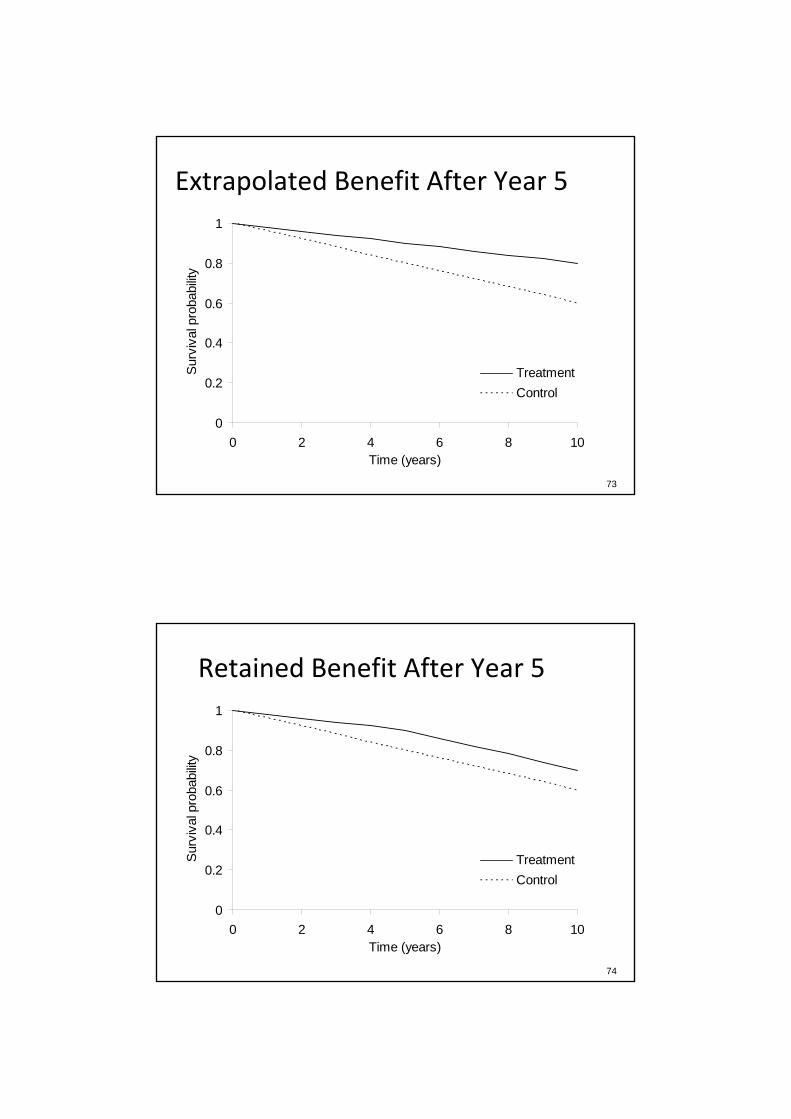
Extrapolated Benefit After Year 5
73
0
0.2
0.4
0.6
0.8
1
0 2 4 6 8 10Time (years)
Surv
ival
pro
babi
lity
TreatmentControl
Retained Benefit After Year 5
74
0
0.2
0.4
0.6
0.8
1
0 2 4 6 8 10Time (years)
Surv
ival
pro
babi
lity
TreatmentControl

No Benefit After Year 5
75
0
0.2
0.4
0.6
0.8
1
0 2 4 6 8 10Time (years)
Surv
ival
pro
babi
lity
TreatmentControl
Specifying costs
• Potential costs to include in a CEA– Health sector costs (e.g., drugs, labs, diagnostics)– Other sector costs (e.g., provision of ART may increase workforce participation and lead to less reliance on government grants for food)
– Patient/family costs (e.g., cost of travelling to clinic)
– Lost productivity
• Which costs are included depends on the perspective of the analysis
76

Costs depend on perspective
• Travel costs are a cost to the patient and society, but not to the ministry of health
• Food grants are a cost to the government, but a benefit to the individual patient
• Hospitalization costs are a cost to the government or the patient, but not to a program that provides ART but does not pay for other care
77
Costs depend on perspective
• Possible perspectives– Individual– Employer– Agency paying for a health program–Ministry of health– Society
• There is not a “right” perspective, but the perspective must be made clear
• When in doubt, use the societal perspective78
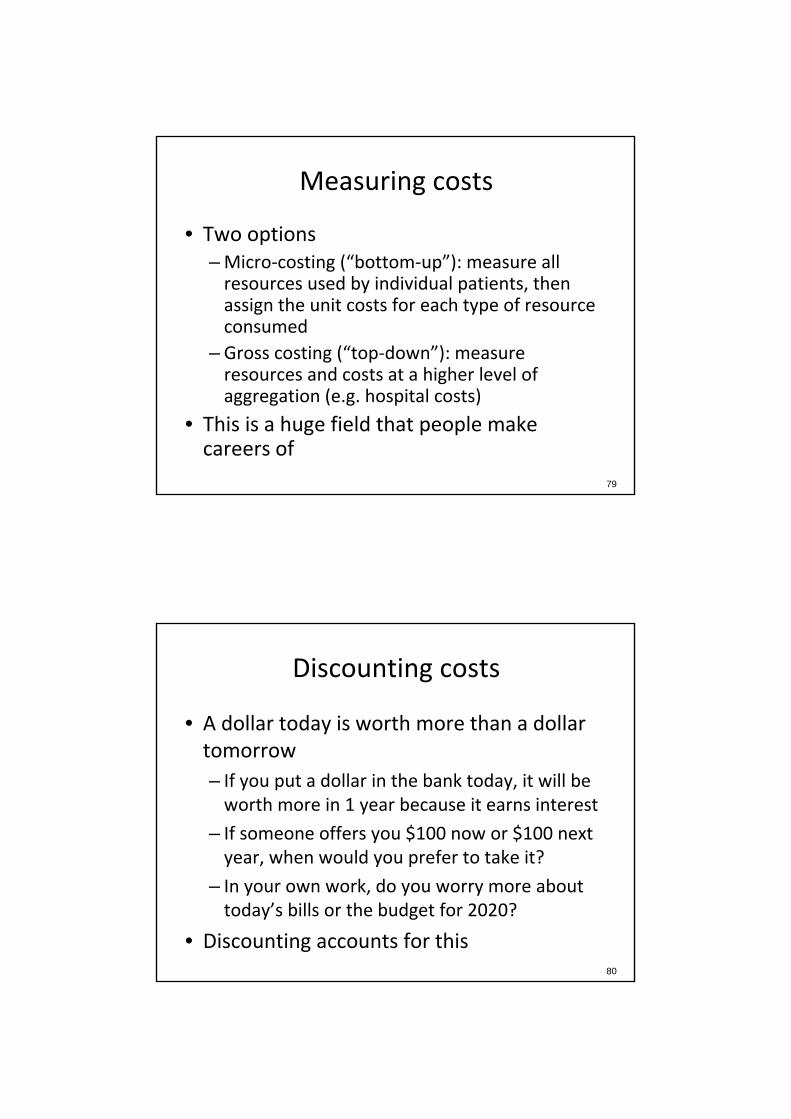
Measuring costs
• Two options–Micro‐costing (“bottom‐up”): measure all resources used by individual patients, then assign the unit costs for each type of resource consumed
– Gross costing (“top‐down”): measure resources and costs at a higher level of aggregation (e.g. hospital costs)
• This is a huge field that people make careers of
79
Discounting costs
• A dollar today is worth more than a dollar tomorrow– If you put a dollar in the bank today, it will be worth more in 1 year because it earns interest
– If someone offers you $100 now or $100 next year, when would you prefer to take it?
– In your own work, do you worry more about today’s bills or the budget for 2020?
• Discounting accounts for this80

Discounting example
• Calculating future value (FV) from present value (PV): How much real value will we obtain if we invest $100 for 20 years at a real rate of return of 3%?
FV = PV * (1 + r)n
= $100 * (1 + .03)20
= $181• Present value can be calculated by doing the reverse: PV = FV/(1 + r)n
81
Discounting health consequences
• If we discount future costs, we have to discount future life expectancy.
• Not because we value life less in the future, but because if you do not, you create a paradox whereby it always seems cost‐effective to delay an intervention.
82

Accounting for uncertainty
• There is always uncertainty in a CEA– Parameter uncertainty (e.g. data quality)
–Methodologic uncertainty (e.g., discount rate)
–Model structure uncertainty (e.g., extrapolating long‐term outcomes from clinical trials)
• Sensitivity analysis can identify the impact of uncertainty on study conclusions
83
One‐way sensitivity analysis
84Kimmel et al., JAIDS 2010
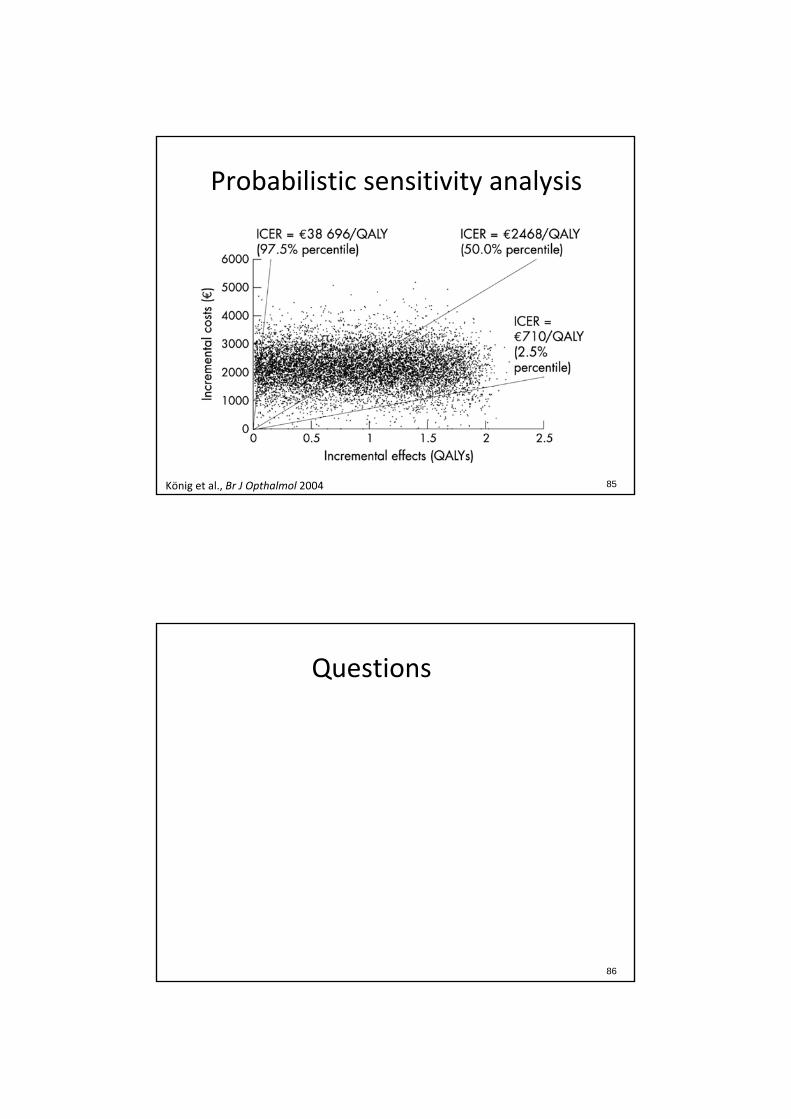
Probabilistic sensitivity analysis
85König et al., Br J Opthalmol 2004
Questions
86

Outline
1. Overview of cost‐effectiveness analysis (CEA) and the questions it can answer
2. A closer look at the components of a CEA3. Guidance on how to critically examine CEA
in the literature4. A consideration of the limitations of CEA and
the ethical implications of cost‐effectiveness research
87
Case study
88Bendavid et al., Arch Intern Med 2008

Case study
• Bendavid et al. (Arch Intern Med 2008) examine the cost‐effectiveness of 3 types of HIV monitoring strategies for initiation, change, and discontinuation of HIV treatment in infected individuals in southern Africa:1. Symptom‐based strategies
2. CD4‐based strategies
3. CD4 and viral load‐based strategies
89
Case study
90Bendavid et al., Arch Intern Med 2008

Case study conclusions
• Symptom‐based strategies are more expensive but less effective than CD4‐based strategies. CD4 monitoring is therefore “cost‐saving” compared to symptom‐based strategies.
• CD4 monitoring with ART initiated at CD4 <350/µl is cost‐effective compared to CD4 monitoring with ART initiated at CD4 <200/µl.
• The cost‐effectiveness of viral load monitoring compared to CD4 monitoring depends on viral load test costs and rates of virologic failure.
91
Do you believe the conclusions?
• What are the strengths and weaknesses of the study?
• Is the methodology appropriate?
• Are the results valid?
92

Evaluating the CEA literature
1. Was a well‐defined question posed in an answerable form?2. Was a comprehensive description of the competing alternatives given?3. Was there evidence that the program’s effectiveness had been
established?4. Were all the important and relevant costs and consequences for each
alternative identified?5. Were costs and consequences measured accurately in appropriate
physical units?6. Were costs and consequences valued credibly?7. Were costs and consequences adjusted for differential timing?8. Was an incremental analysis of costs and consequences of alternatives
performed?9. Was allowance made for uncertainty in the estimates of costs and
consequences?10. Did the presentation and discussion of study results include all issues of
concern to users?
Drummond et al., Methods for the economic evaluation of health care programmes, 2005. 93
1. Was a well‐defined question posed in an answerable form?
• In this study, the authors examine the costs, effectiveness, and cost‐effectiveness of 3 types of strategies for initiation, change, and discontinuation of HIV treatment:1. Symptom‐based strategies
2. CD4‐based strategies
3. CD4 and viral load‐based strategies
• The setting is South Africa
• The authors adopt a societal perspective
94

2. Was a comprehensive description of the competing alternatives given?
• The authors examine 10 strategies: 2 symptom‐based strategies and 4 versions each of CD4 only and CD4 and viral load strategies in which ART was started at 200/µl or 350/µl, and monitoring frequency was 3 or 6 months
• Strategies are described in Table 2
95
2. Was a comprehensive description of the competing alternatives given?
96Bendavid et al., Arch Intern Med 2008

2. Was a comprehensive description of the competing alternatives given?
• Were any important alternatives omitted?– Combined CD4 and immunological criteria for
switching?
– Targeted viral load testing?
• Was a “do nothing” alternative considered?– Standard of care: CD4/VL every 6mo, ART <200/µl
97
3. Was there evidence that the program’s effectiveness had been established?
• The model makes several assumptions based on observational and clinical trial data:
– The risk of developing an OD or dying from an OD or other HIV‐related cause is inversely related to CD4
– Off suppressive ART, CD4 declines at a monthly rate based on viral load
– On suppressive ART, viral load decreased and CD4 increases, on average (but the model allows for discordance between viral load and CD4)
98
3. Was there evidence that the program’s effectiveness had been established?
• Do you agree with the assumptions used to establish effectiveness?
• Do the assumptions introduce any bias into the results?
99
3. Was there evidence that the program’s effectiveness had been established?
• Implications of the model structure:– Compared to symptom‐based monitoring alone, CD4
monitoring leads to initiation of ART at higher CD4s and prevention of severe opportunistic diseases
– The impact of CD4 monitoring on time to switch from 1st‐ to 2nd‐line ART is not described
– Viral load monitoring prevents switching from 1st‐ to 2nd‐line ART too early (before true virologic failure) or too late (after CD4 has already declined and the patient is at increased risk of mortality)
100
4. Were all the important and relevant costs and consequences for each alternative identified?
• Recall the 4 types of costs that can be included in a CEA:
– Health sector costs– Other sector costs– Patient/family costs– Lost productivity
• The authors include all direct costs of HIV care including inpatient costs, outpatient costs, ART costs, and testing costs
101
4. Were all the important and relevant costs and consequences for each alternative identified?
• The authors do not include:– Other, non‐HIV‐related health sector costs
– Other sector costs
– Patient/family costs
– Lost productivity
• Does this make a difference to the cost‐effectiveness comparisons? ‐ hard to tell
102

4. Were all the important and relevant costs and consequences for each alternative identified?
• The authors consider consequences to the individual alone
• They do not consider other value created by the strategies
– For example, viral load monitoring could reduce transmission and the accumulation of resistance mutations
– Omitting these benefits leads to an underestimate of the value of viral load monitoring
103
5. Were costs and consequences measured accurately in appropriate physical units?
• Inpatient/outpatient costs – utilization based approach.
• ART costs were applied on a monthly basis and depended on whether an individual was on 1st‐ or 2nd‐line ART
• Monitoring test costs were applied on a per‐test basis as indicated by the strategy
104
5. Were costs and consequences measured accurately in appropriate physical units?
• The authors measure the consequences of the intervention in terms of life expectancy from the time of presentation to care
• The authors do not consider quality‐adjusted life expectancy
– QALYs capture consequences beyond simple survival (e.g., a decrease in morbidity could result in improved quality of life in addition to a decrease in mortality)
105
6. Were costs and consequences valued credibly?
• Unit costs are provided in Table 1• All costs were in 2007 USD (this removes the
effects of inflation from the analysis)• The cost of inpatient days and outpatient
visits included costs of non‐clinical staff such as counselors, clinical staff, non‐ART medications, and capital costs
• Costs of 1st‐ and 2nd‐line ART were from MSF and depended on the specific drugs used
106

6. Were costs and consequences valued credibly?
• The cost of testing included the cost of reagents, labor, parts, data management, maintenance, and the cost of CD4 or viral load enumeration equipment
• The allocation of an up‐front fixed cost of purchasing diagnostic equipment did not substantially impact overall testing costs so the authors include only a single per‐test cost in the base case
107
7. Were costs and consequences adjusted for differential timing?
• Costs and health consequences were discounted at a rate of 3% per year
• This is consistent with the recommendations of the Panel on Cost‐Effectiveness in Health and Medicine*
108*Weinstein et al., JAMA 1996
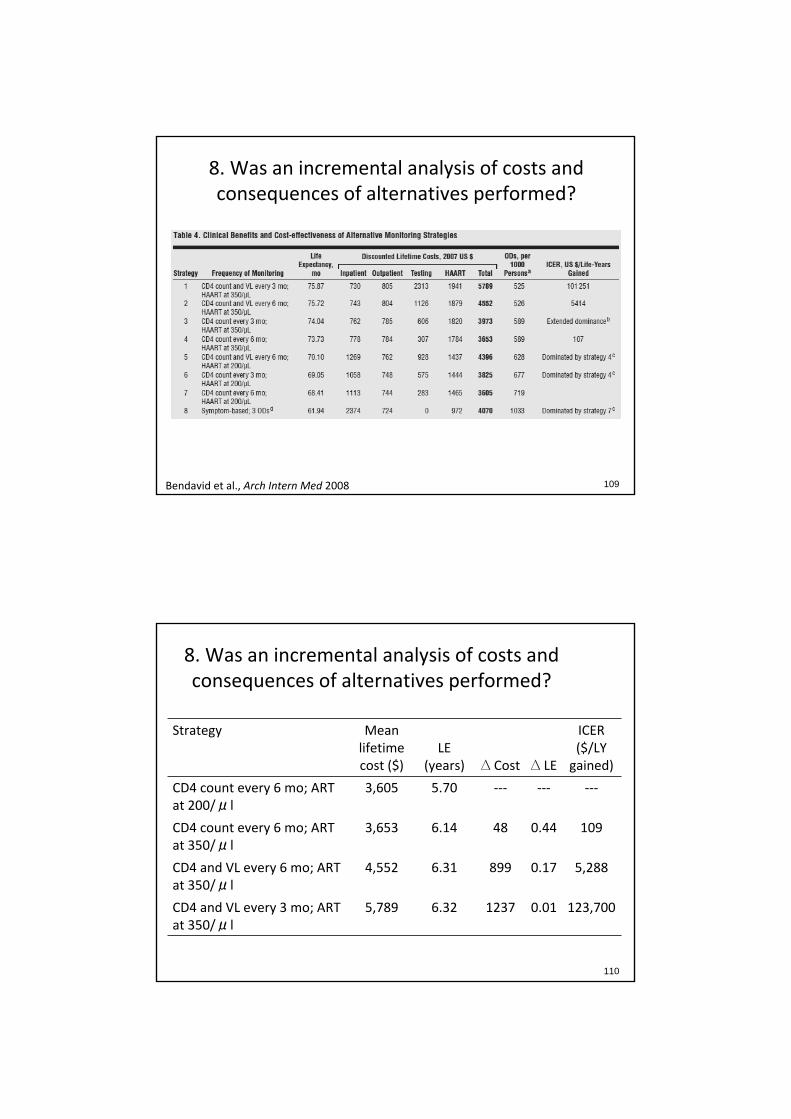
8. Was an incremental analysis of costs and consequences of alternatives performed?
109Bendavid et al., Arch Intern Med 2008
8. Was an incremental analysis of costs and consequences of alternatives performed?
110
Strategy Mean lifetime cost ($)
LE (years) ∆ Cost ∆ LE
ICER ($/LY gained)
CD4 count every 6 mo; ART at 200/μl
3,605 5.70 ‐‐‐ ‐‐‐ ‐‐‐
CD4 count every 6 mo; ART at 350/μl
3,653 6.14 48 0.44 109
CD4 and VL every 6 mo; ART at 350/μl
4,552 6.31 899 0.17 5,288
CD4 and VL every 3 mo; ART at 350/μl
5,789 6.32 1237 0.01 123,700

9. Was allowance made for uncertainty in the estimates of costs and consequences?
• Sensitivity analyses included:– Rates of virologic failure, rates of treatment
discontinuation due to ART toxicity, rates of opportunistic diseases, and mortality risks associated with opportunistic diseases
– Inpatient costs, outpatient costs, ART costs, and CD4 and viral load test costs
• Ranges for most (but not all) of the sensitivity analyses are provided in Table 1
111
9. Was allowance made for uncertainty in the estimates of costs and consequences?
• Results are reported for sensitivity analyses on the cost of inpatient care, viral load test cost, and rate of virologic failure
• The authors note that other sensitivity analyses did not change their results substantively
112
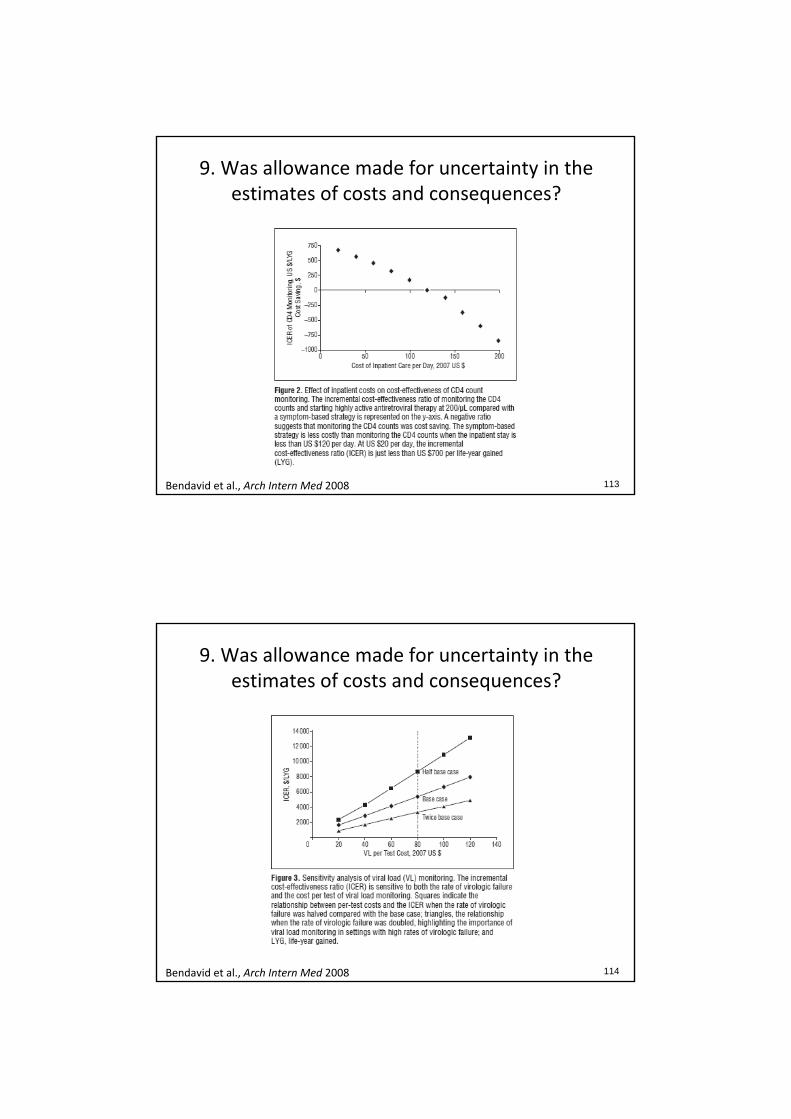
9. Was allowance made for uncertainty in the estimates of costs and consequences?
113Bendavid et al., Arch Intern Med 2008
9. Was allowance made for uncertainty in the estimates of costs and consequences?
114Bendavid et al., Arch Intern Med 2008

10. Did the presentation and discussion of study results include all issues of concern to
the users?
• Based on ICERs, the authors conclude:– CD4 monitoring is “cost‐saving” compared to symptom‐based strategies
– CD4 monitoring with ART initiated at CD4 <350/µl is cost‐effective compared to CD4 monitoring with ART initiated at CD4 <200/µl
– The cost‐effectiveness of viral load monitoring compared to CD4 monitoring depends on viral load test costs and rates of virologic failure
115
10. Did the presentation and discussion of study results include all issues of concern to
the users?
• The authors do not compare their results to others who have investigated the same question
• The authors discuss the feasibility of adopting CD4 monitoring in resource‐limited settings given the required initial investment in CD4 technology and infrastructure
116

10. Did the presentation and discussion of study results include all issues of concern to
the users?
• The authors address the generalizabilility of their conclusions to other settings
• They cite 2x per capita GDP as an acceptable CE threshold and conclude that CD4 monitoring and ART at CD4 <350/µl are cost‐effective by this standard in all parts of southern Africa
– However, costs and the risk of opportunistic diseases may vary by country so generalization to other settings may not hold
117
Do you believe the conclusions?
• What are the strengths and weaknesses of the study?
• Is the methodology appropriate?
• Are the results valid?
118
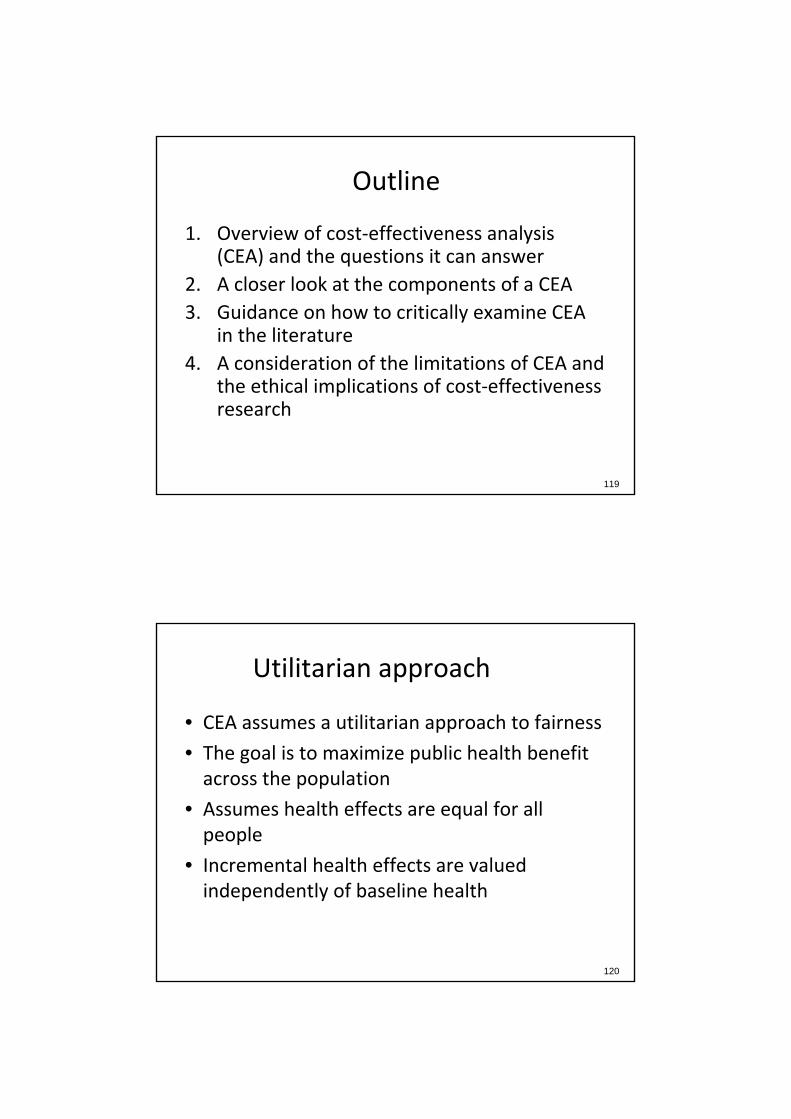
Outline
1. Overview of cost‐effectiveness analysis (CEA) and the questions it can answer
2. A closer look at the components of a CEA3. Guidance on how to critically examine CEA
in the literature4. A consideration of the limitations of CEA and
the ethical implications of cost‐effectiveness research
119
Utilitarian approach
120
• CEA assumes a utilitarian approach to fairness
• The goal is to maximize public health benefit across the population
• Assumes health effects are equal for all people
• Incremental health effects are valued independently of baseline health
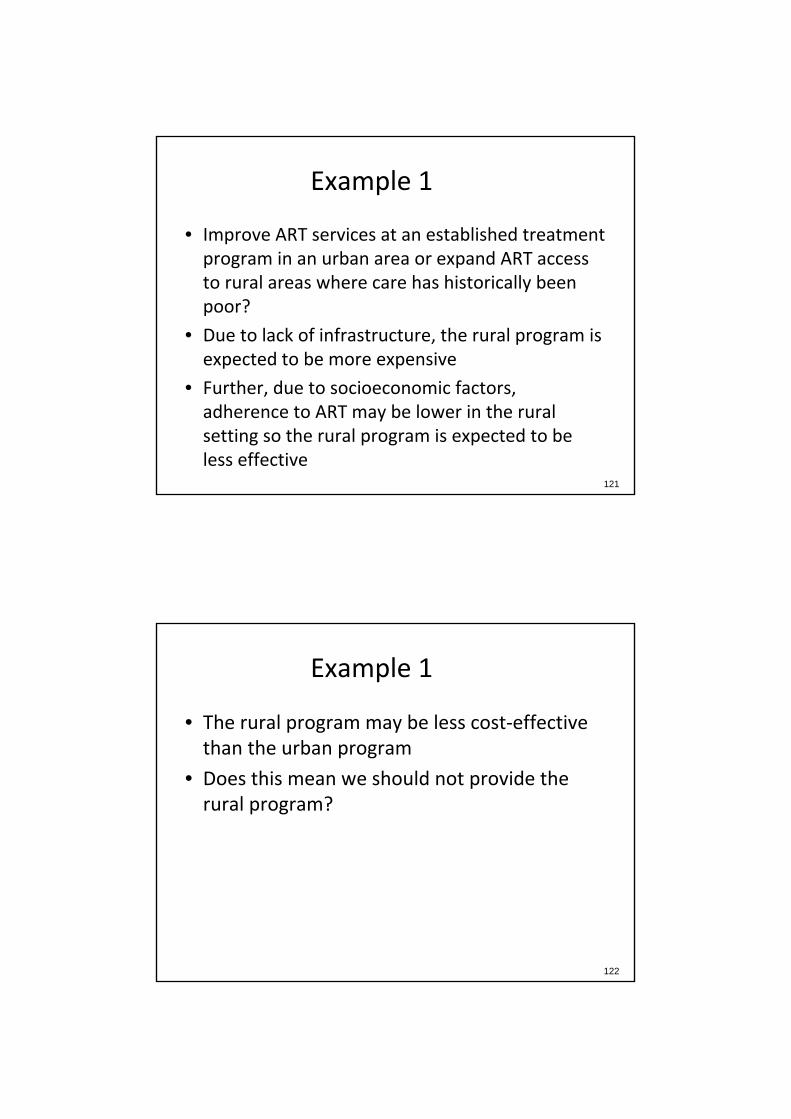
Example 1
121
• Improve ART services at an established treatment program in an urban area or expand ART access to rural areas where care has historically been poor?
• Due to lack of infrastructure, the rural program is expected to be more expensive
• Further, due to socioeconomic factors, adherence to ART may be lower in the rural setting so the rural program is expected to be less effective
Example 1
122
• The rural program may be less cost‐effective than the urban program
• Does this mean we should not provide the rural program?

Example 2
123
• An historically disadvantaged group has very poor life expectancy even without HIV infection
• Providing ART to this group may result in less total life expectancy gain than providing ART to an historically privileged group because the disadvantaged group has less life expectancy to save
• Does this mean we should not provide services to the disadvantaged group?
Limitations of CEA
124
• CEA provides a common language to debate resource allocation, but value for money, or efficiency, is only one consideration when making decisions about health policy
• The relative attractiveness of different alternatives also depends on equity considerations and political or social acceptability
• CEA alone does not provide the answer, but it provides additional information useful for decision making