cost benefit analysis of the community patent (eu...
TRANSCRIPT

Cost-Benefit Analysis of the Community Patent (EU Patent)
4th Workshop on “The Output of R&D activities: Harnessing the Power of Patents Data”
Seville, 24-25 May 2012
Université libre de Bruxelles (ULB) Solvay Brussels School of Economics and Management (SBS-EM) European Center for Advanced Research in Economics and Statistics (ECARES)
Jérôme Danguy and Bruno van Pottelsberghe

Filing at NPO 3 & Grant ?
Filing at EPO & Grant? EP
NPO 1
NPO 2 NPO 3 NPO 4
...
Validation at different NPO’s Translation costs
Maintenance through national yearly renewal
fees
Filing at NPO 1 & Grant ?
Filing at NPO 2 & Grant ?
Filing at NPO 4 & Grant ?
Filing at NPO ... & Grant ?
National Priority Filings Decentralized
European Application Centralized
Enforcement Decentralized
Complexity: multiple routes
Costly: multiple (high) fees
Uncertainty: multiple litigation
Motivation Budgetary consequences for PO
Implications on patenting cost
Discussion of the total impact Conclusions
A fragmented European patent system
COMPAT – Danguy & van Pottelsberghe 2

Filing at NPO 3 & Grant ?
Filing at EPO & Grant?
EP
COMPAT
NPO 1
NPO 2 NPO 3 NPO 4
...
Validation at different NPO’s Translation costs
Maintenance through national yearly renewal
fees
Maintenance through COMPAT yearly
renewal fees
English, French, German & machine translation
Filing at NPO 1 & Grant ?
Filing at NPO 2 & Grant ?
Filing at NPO 4 & Grant ?
Filing at NPO ... & Grant ?
National Priority Filings Decentralized
European Application Centralized
Enf
orce
men
t D
ecen
tral
ized
E
nfor
cem
ent
Cen
tral
ized
Motivation Budgetary consequences for PO
Implications on patenting cost
Discussion of the total impact Conclusions
A fragmented European patent system
COMPAT – Danguy & van Pottelsberghe 3
Need for a new unified route
Complexity: multiple routes
Costly: multiple (high) fees
Uncertainty: multiple litigation

Outline
COMPAT – Danguy & van Pottelsberghe 4
Objective: Understand the economic consequences of the COMPAT
I. What would be the budgetary consequences in terms of renewal fees’ income for patent offices (EPO and NPOs) ?
– Simulation of renewal fee – Implications for patent offices
II. What would be the implications for applicants in terms of absolute and
relative patenting cost?
III. What would be the total impact on other stakeholders, including translators, attorneys, lawyers and the business sector?

Simulation of renewal fees income
COMPAT – Danguy & van Pottelsberghe 5
Focus on renewal fees income generated by the COMPAT which depend on: – the renewal fee structure – the maintenance rate over time – the distribution key
Methodological approach:
(1) Compute the total renewal fees income generated by a current ‘average’ European patent in the 27 EU NPOs
(2) Understand the factors that influence the maintenance rate of patents in national jurisdictions
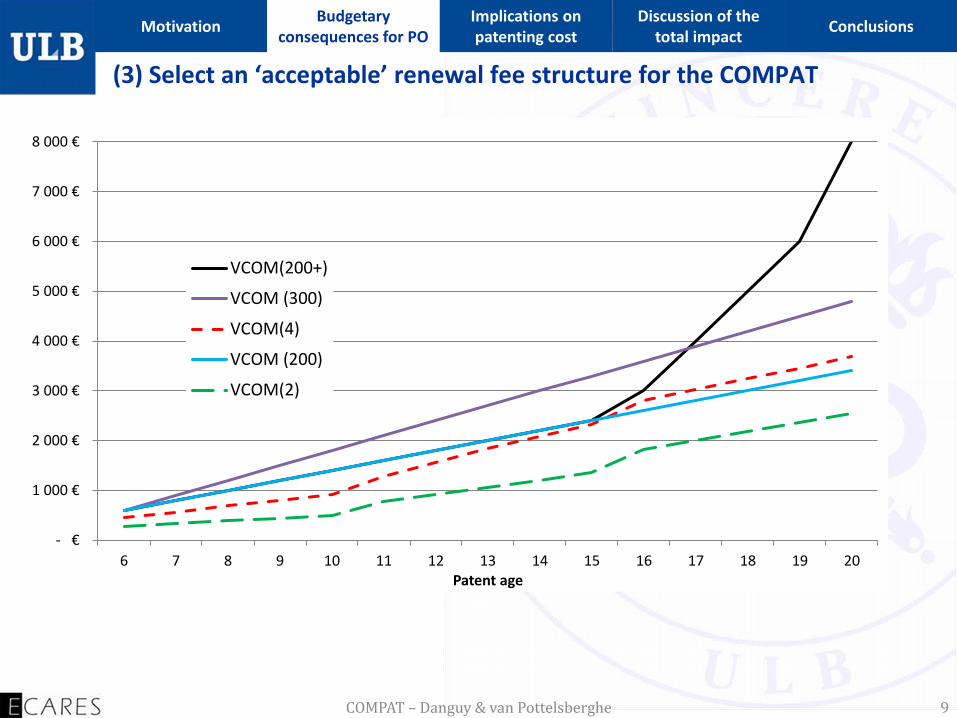
(3) Select an ‘acceptable’ renewal fee structure for the COMPAT (4) Simulate the maintenance rate of the COMPAT (5) Compute the renewal fees income generated by the COMPAT
Simulations performed at the patent level
Assessing whether an average Community Patent would generate more or less revenue than a current average European patent over its entire life span.
Motivation Budgetary consequences for PO
Implications on patenting cost
Discussion of the total impact Conclusions

(1) Total renewal fees income generated by a current European Patent
COMPAT – Danguy & van Pottelsberghe 6
Total renewal fees’ income generated by an average European patent in the national patent office of country i:
𝑉𝑉𝑉𝑉𝑖 = ∑ 𝜋𝑖 20𝑡=6 1 − 𝛿𝑖𝑡 𝐹𝑖𝑡 (1)
Where: 𝜋𝑖 = the validation rate of EP in country i 𝛿𝑖𝑡 = the drop-out rate of EP in country i and year t 𝐹𝑖𝑡 = the renewal fees in country i and year t Total for all EU (EPO+NPOs):
𝑉𝑉𝑉𝑉 = ∑ 𝑉𝑉𝑉𝑉𝑖27𝑖=1 (2)
Total renewal fees’ income for an average COMPAT:
𝑉𝑉𝑉𝑉 = ∑ (1 − 𝛿𝐶𝑡20𝑡=6 ) 𝐹𝐶𝑡 (3)
Motivation Budgetary consequences for PO
Implications on patenting cost
Discussion of the total impact Conclusions

Validation/Maintenance rates of patents in selected countries
COMPAT – Danguy & van Pottelsberghe 7
Motivation Budgetary consequences for PO
Implications on patenting cost
Discussion of the total impact Conclusions
0%
10%
20%
30%
40%
50%
60%
70%
80%
90%
100%
6 7 8 9 10 11 12 13 14 15 16 17 18 19 20
[P(v
alid
atio
n)*(
1-dr
op ra
te)]
Patent age
USAGermanyJapanSpainBelgiumFinland
Source: own calculation from data provided by the EPO and NPOs and trilateral statistical report

Simple econometric model: 1 − 𝛿𝑖𝑡 = 𝑉 + 𝛽 𝐺𝐺𝑉𝑖 + 𝜃 𝑉𝑉𝑉𝑁𝐺𝑁𝑖 + 𝛾 𝐼𝑉𝐼𝑖 + 𝜎 𝑉𝑁𝑃𝑁𝐺𝑁𝑡 + 𝛼 𝐹𝑖𝑡 + 𝜀𝑖𝑡
Sample: EU 15 + JP + US Variable (1) (2) (3)
Intercept 0.229 *** 0.536 *** -0.256 (0.041) (0.038) (0.207)
GDP ( '000 billion €) 0.104 *** 0.072 *** 0.064 *** (0.008) (0.007) (0.007)
Fees ('000 €) -0.350 *** -0.112 *** -0.119 *** (0.028) (0.027) (0.026)
Age of membership 0.007 *** 0.007 *** 0.008 *** (0.002) (0.001) (0.001)
Age of the patent -0.030 *** -0.029 *** (0.002) (0.002)
Intellectual Property Index 0.172 *** (0.044)
Adjusted R-Square (%) 53.9 74.1 75.6
Number of observations 243 243 243 Note: *, ** and *** indicate significance at the 10%, 5% and 1% level, respectively; standard errors are in parentheses.
COMPAT – Danguy & van Pottelsberghe 8
(2) Understand the determinants of the maintenance rate of patents
Motivation Budgetary consequences for PO
Implications on patenting cost
Discussion of the total impact Conclusions
Market attractiveness
Life cycle of technology
Renewal fees
- €
1 000 €
2 000 €
3 000 €
4 000 €
5 000 €
6 000 €
7 000 €
8 000 €
6 7 8 9 10 11 12 13 14 15 16 17 18 19 20Patent age
VCOM(200+)
VCOM (300)
VCOM(4)
VCOM (200)
VCOM(2)
COMPAT – Danguy & van Pottelsberghe 9
(3) Select an ‘acceptable’ renewal fee structure for the COMPAT
Motivation Budgetary consequences for PO
Implications on patenting cost
Discussion of the total impact Conclusions

COMPAT – Danguy & van Pottelsberghe 10
(4) Simulate the maintenance rate of the COMPAT
Motivation Budgetary consequences for PO
Implications on patenting cost
Discussion of the total impact Conclusions
0%
10%
20%
30%
40%
50%
60%
70%
80%
90%
100%
6 7 8 9 10 11 12 13 14 15 16 17 18 19 20
Mai
nten
ance
rate
of a
pat
ent
Patent age
JapanVCOM(2)VCOM(200)GermanyWorstVCOM(300)VCOM(200+)VCOM(4)

COMPAT – Danguy & van Pottelsberghe 11
(5) Compute the total renewal fees’ income generated by the COMPAT
Motivation Budgetary consequences for PO
Implications on patenting cost
Discussion of the total impact Conclusions
11 168 € 9 936 €
13 662 €
15 832 € 16 548 €
14 883 €
11 328 € 11.373 €
0 €
2 000 €
4 000 €
6 000 €
8 000 €
10 000 €
12 000 €
14 000 €
16 000 €
18 000 €
VNPO VCOM(2) VCOM(4) VCOM(200) VCOM(300) VCOM(200+) WORST(200+)
Validation fee
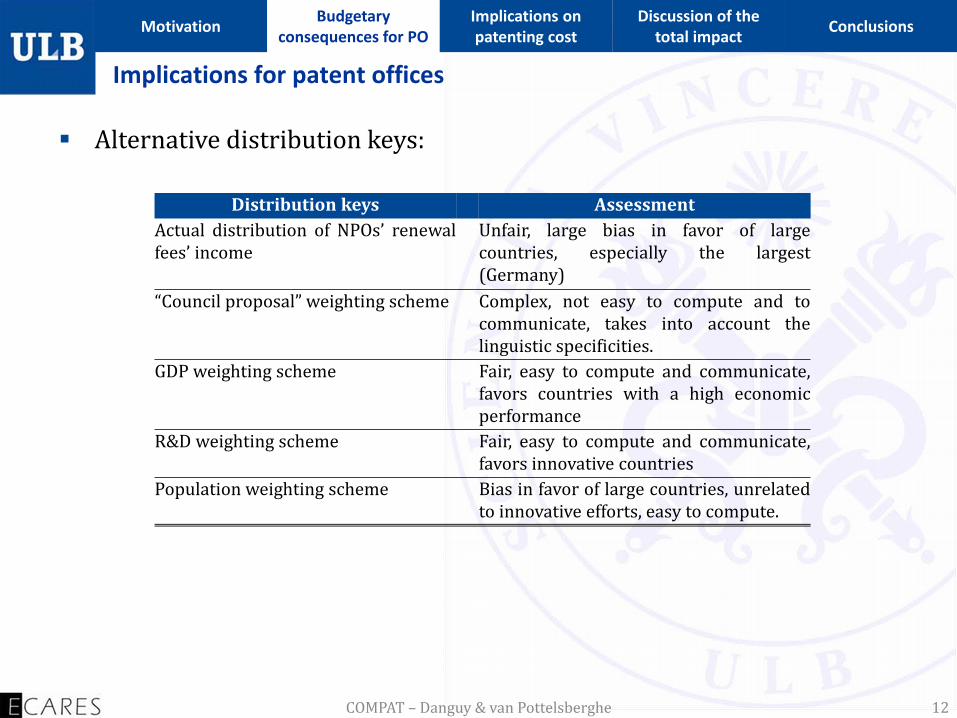
Alternative distribution keys:
Distribution keys Assessment Actual distribution of NPOs’ renewal fees’ income
Unfair, large bias in favor of large countries, especially the largest (Germany)
“Council proposal” weighting scheme Complex, not easy to compute and to communicate, takes into account the linguistic specificities.
GDP weighting scheme Fair, easy to compute and communicate, favors countries with a high economic performance
R&D weighting scheme Fair, easy to compute and communicate, favors innovative countries
Population weighting scheme Bias in favor of large countries, unrelated to innovative efforts, easy to compute.
COMPAT – Danguy & van Pottelsberghe 12
Implications for patent offices
Motivation Budgetary consequences for PO
Implications on patenting cost
Discussion of the total impact Conclusions

COMPAT – Danguy & van Pottelsberghe 13
Implications for patent offices with VCOM(200+)
Motivation Budgetary consequences for PO
Implications on patenting cost
Discussion of the total impact Conclusions
VNPO Level (€) Relative net differences (%) € Proposed GDP Pop. R&D Proposed GDP Pop. R&D
EPO 5686 7441 7441 7441 7441 31 31 31 31 Germany 2386 1957 1483 1236 2032 -18 -38 -48 -15 France 802 819 1155 953 1309 2 44 19 63 United Kingdom 597 729 1222 915 1175 22 105 53 97 Netherlands 332 551 345 246 320 66 4 -26 -4 Austria 227 424 164 125 218 87 -27 -45 -4 Italy 576 677 946 888 581 18 64 54 1 Spain 230 454 628 669 408 97 173 190 77 Sweden 111 260 200 137 405 135 81 23 265 Denmark 71 193 141 81 187 173 98 14 164 Belgium 88 201 202 159 206 129 130 81 135 Ireland 55 104 113 65 80 88 104 17 44 Finland 70 104 107 80 199 49 52 14 184 Portugal 31 127 99 159 54 302 216 406 71 Greece 21 112 136 168 42 424 539 690 98 Luxembourg 13 37 22 8 19 193 70 -41 53 Hungary 15 67 58 152 31 D D D D Cyprus 10 45 9 12 2 D D D D Estonia 5 52 8 20 5 D D D D Czech Republic 17 60 73 155 61 D D D D Romania 6 89 62 325 15 D D D D Slovakia 8 52 28 81 7 D D D D Bulgaria 6 60 16 116 4 D D D D Slovenia 4 30 20 30 17 D D D D Lithuania 1 52 15 51 7 D D D D Poland 3 119 174 572 52 D D D D

Source: van Pottelsberghe and Mejer (2010) and own calculations for the COMPAT figures
COMPAT – Danguy & van Pottelsberghe 14
Motivation Budgetary consequences for PO
Implications on patenting cost
Discussion of the total impact Conclusions
International comparison of patenting costs
- €
5 000 €
10 000 €
15 000 €
20 000 €
25 000 €
30 000 €
35 000 €
Renewal fees (up to 10th)
Translation costs
Procedural costs
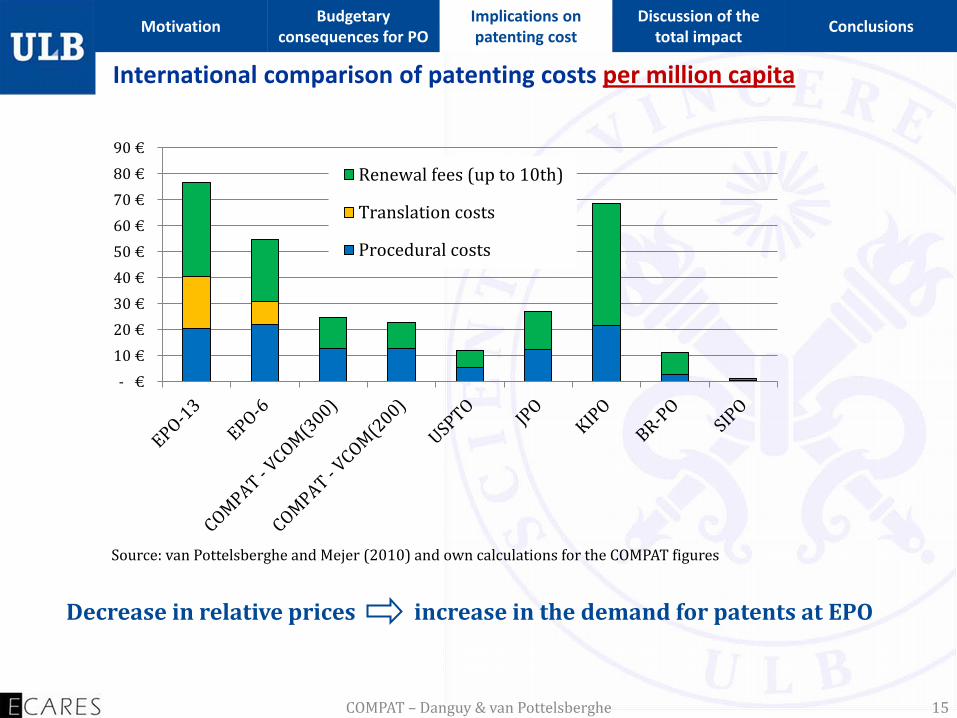
- € 10 € 20 € 30 € 40 € 50 € 60 € 70 € 80 € 90 €
Renewal fees (up to 10th)
Translation costs
Procedural costs
Source: van Pottelsberghe and Mejer (2010) and own calculations for the COMPAT figures
COMPAT – Danguy & van Pottelsberghe 15
Motivation Budgetary consequences for PO
Implications on patenting cost
Discussion of the total impact Conclusions
International comparison of patenting costs per million capita
Decrease in relative prices increase in the demand for patents at EPO

COMPAT – Danguy & van Pottelsberghe 16
Motivation Budgetary consequences for PO
Implications on patenting cost
Discussion of the total impact Conclusions
Total impact by type of actors considering 50,000 patents (in € millions)
EPO NPOs Business
sector
Translators &
Attorneys Lawyers
FEES
Renewal fees + 88 + 88 - 176
Designation fees EPO - 25 + 40 - 15
Validation fees NPOs - 10 + 10
POST-GRANT COSTS
Translation costs* - 20 + 149 - 129
Intermediary costs* + 126 - 126
Unified European patent litigation system** + 121 - 121
Total + 43 + 78 + 270 - 270 - 121 Source: own calculations ,* van Pottelsberghe & Mejer (2010) and ** Harhoff (2009)

COMPAT – Danguy & van Pottelsberghe 17
Motivation Budgetary consequences for PO
Implications on patenting cost
Discussion of the total impact Conclusions
I. What would be the budgetary consequences in terms of renewal fees’ income for patent offices (EPO and NPOs) ? EPO and most NPOs would actually gain from the COMPAT if an appropriate
fee schedule is adopted
II. What would be the implications for applicants in terms of absolute and relative patenting cost? Increase in absolute renewal fees BUT for a larger market of protection Decrease in relative patenting cost Decrease in intermediary costs
III. What would be the total impact on other stakeholders, including translators, attorneys,
lawyers and the business sector? Gain for the business sector and POs Loss for intermediary
The COMPAT would not only have monetary consequences but it would also simplify the system and reduce the uncertainty
to improve the attractiveness of European market for technology

18
Thank you
Questions ?

19
Back-up slides

COMPAT – Danguy & van Pottelsberghe 20
Appendix – Maintenance rates over the entire patent’s lifetime
0%
10%
20%
30%
40%
50%
60%
70%
80%
90%
100%
1 2 3 4 5 6 7 8 9 10 11 12 13 14 15 16 17 18 19 20
Mai
nten
ance
rate
Patent age
Germany
Spain
Belgium
Finland
Pending at the EPO

COMPAT – Danguy & van Pottelsberghe 21
Appendix – Distribution keys
Actual Proposed GDP Population R&D Germany 31.60% 26.30% 19.90% 16.60% 27.30% France 13.10% 11.00% 15.50% 12.80% 17.60% United Kingdom 11.60% 9.80% 16.40% 12.30% 15.80% Netherlands 8.00% 7.40% 4.60% 3.30% 4.30% Austria 6.70% 5.70% 2.20% 1.70% 2.90% Italy 8.60% 9.10% 12.70% 11.90% 7.80% Spain 5.40% 6.10% 8.40% 9.00% 5.50% Sweden 3.60% 3.50% 2.70% 1.80% 5.40% Denmark 2.60% 2.60% 1.90% 1.10% 2.50% Belgium 2.50% 2.70% 2.70% 2.10% 2.80% Ireland 1.40% 1.40% 1.50% 0.90% 1.10% Finland 1.30% 1.40% 1.40% 1.10% 2.70% Portugal 1.10% 1.70% 1.30% 2.10% 0.70% Greece 0.90% 1.50% 1.80% 2.30% 0.60% Luxembourg 0.50% 0.50% 0.30% 0.10% 0.30% Hungary 0.20% 0.90% 0.80% 2.00% 0.40% Cyprus 0.20% 0.60% 0.10% 0.20% 0.00% Estonia 0.10% 0.70% 0.10% 0.30% 0.10% Czech Republic 0.10% 0.80% 1.00% 2.10% 0.80% Romania 0.10% 1.20% 0.80% 4.40% 0.20% Slovakia 0.10% 0.70% 0.40% 1.10% 0.10% Bulgaria 0.10% 0.80% 0.20% 1.60% 0.10% Slovenia 0.10% 0.40% 0.30% 0.40% 0.20% Lithuania 0.00% 0.70% 0.20% 0.70% 0.10% Latvia 0.00% 0.60% 0.10% 0.50% 0.10% Poland 0.10% 1.60% 2.30% 7.70% 0.70% Malta 0.00% 0.50% 0.00% 0.10% 0.00%

COMPAT – Danguy & van Pottelsberghe 22
Appendix – Implications for patent offices with VCOM(200)
VNPO Level (€) Relative net differences (%) € Proposed GDP Pop. R&D Proposed GDP Pop. R&D
EPO 5686 7916 7916 7916 7916 39 39 39 39 Germany 2386 2082 1578 1315 2162 -13 -34 -45 -9
France 802 871 1229 1013 1392 9 53 26 74 United Kingdom 597 776 1300 973 1250 30 118 63 110
Netherlands 332 586 367 262 340 77 11 -21 2 Austria 227 451 175 133 232 99 -23 -42 2
Italy 576 720 1006 945 618 25 75 64 7 Spain 230 483 668 711 434 110 190 209 88
Sweden 111 277 213 145 430 150 92 31 288 Denmark 71 206 150 86 199 190 111 22 180 Belgium 88 214 215 169 219 143 145 93 150 Ireland 55 111 121 69 85 100 117 24 53 Finland 70 111 114 85 212 58 62 21 202 Portugal 31 135 106 169 57 327 236 438 82 Greece 21 119 145 179 45 457 580 740 111
Luxembourg 13 40 23 8 21 211 81 -37 63 Hungary 15 71 61 161 33 ∆ ∆ ∆ ∆ Cyprus 10 47 10 13 2 ∆ ∆ ∆ ∆ Estonia 5 55 9 21 6 ∆ ∆ ∆ ∆
Czech Republic 17 63 77 165 65 ∆ ∆ ∆ ∆ Romania 6 95 66 345 16 ∆ ∆ ∆ ∆ Slovakia 8 55 30 86 8 ∆ ∆ ∆ ∆ Bulgaria 6 63 17 123 4 ∆ ∆ ∆ ∆ Slovenia 4 32 21 32 18 ∆ ∆ ∆ ∆
Lithuania 1 55 16 54 7 ∆ ∆ ∆ ∆ Poland 3 127 185 609 56 ∆ ∆ ∆ ∆