cosc 122 - dr. ramon lawrence key points computer fluency
TRANSCRIPT

COSC 122 Computer Fluency
Spreadsheets
Dr. Ramon LawrenceUniversity of British Columbia Okanagan
Dr. Ramon LawrenceUniversity of British Columbia Okanagan
Page 2
COSC 122 - Dr. Ramon Lawrence
Key Points1) Spreadsheets are programs for storing and manipulating data that is represented as a table of cells.
2) Each cell has a row number and column label which combine to represent its address.
3) Spreadsheets allow you to organize data and write formulas to do computations. They are a powerful tool for data storage and analysis.
Page 3
COSC 122 - Dr. Ramon Lawrence
Spreadsheet OverviewA spreadsheet organizes information into a two-dimensional array of cells (a table).
A cell has two components:
an address - specified given a row and column number
a location - that can store a number, text, or formula
The power of a spreadsheet is that we can write simple formulas (commands) to perform calculations and immediately see the results of those calculations.
Spreadsheets are very common in accounting and reporting applications.
Page 4
COSC 122 - Dr. Ramon Lawrence
Spreadsheet AddressingA cell is identified by a row number and column letter.
columns
rows
cell at E11
formula in cell
Page 5
COSC 122 - Dr. Ramon Lawrence
Spreadsheet AddressingThe rows in a spreadsheet are numbered starting from 1.
The columns are represented by letters.
A is column 1, B is column 2, …, Z is column 26, AA is column 27, …
A cell is identified by putting the column letter first then the row number.
e.g. B3 is the 2nd column and the 3rd row.
Question: What column number is AD? How about BAD?
Page 6
COSC 122 - Dr. Ramon Lawrence
Spreadsheet Data EntryAn entry can be added to a cell by clicking on it and typing in the data. The data may be a number, text, or a date.
The spreadsheet attempts to detect the data type and format it accordingly. It is also possible to manually format the data.
format option
Page 7
COSC 122 - Dr. Ramon Lawrence
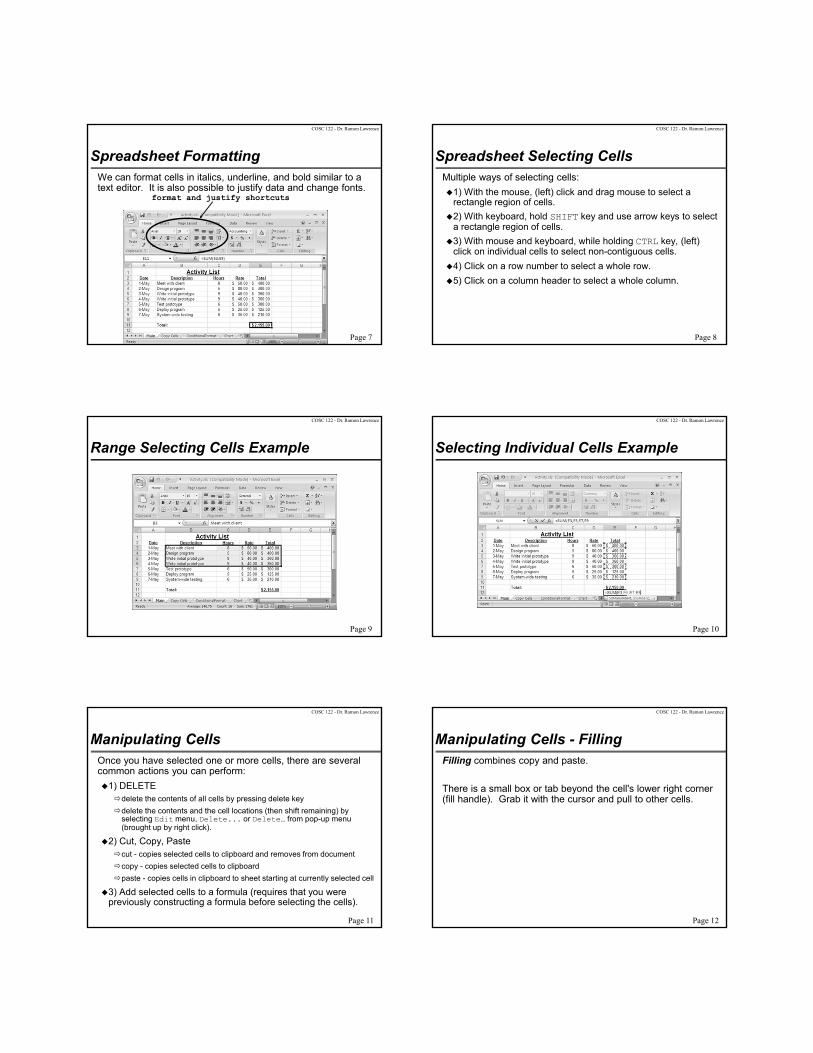
Spreadsheet FormattingWe can format cells in italics, underline, and bold similar to a text editor. It is also possible to justify data and change fonts.
format and justify shortcuts
Page 8
COSC 122 - Dr. Ramon Lawrence
Spreadsheet Selecting CellsMultiple ways of selecting cells:
1) With the mouse, (left) click and drag mouse to select a rectangle region of cells.
2) With keyboard, hold SHIFT key and use arrow keys to select a rectangle region of cells.
3) With mouse and keyboard, while holding CTRL key, (left) click on individual cells to select non-contiguous cells.
4) Click on a row number to select a whole row.
5) Click on a column header to select a whole column.
Page 9
COSC 122 - Dr. Ramon Lawrence
Range Selecting Cells Example
Page 10
COSC 122 - Dr. Ramon Lawrence
Selecting Individual Cells Example
Page 11
COSC 122 - Dr. Ramon Lawrence
Manipulating CellsOnce you have selected one or more cells, there are several common actions you can perform:
1) DELETEdelete the contents of all cells by pressing delete key
delete the contents and the cell locations (then shift remaining) by selecting Edit menu, Delete... or Delete… from pop-up menu (brought up by right click).
2) Cut, Copy, Pastecut - copies selected cells to clipboard and removes from document
copy - copies selected cells to clipboard
paste - copies cells in clipboard to sheet starting at currently selected cell
3) Add selected cells to a formula (requires that you were previously constructing a formula before selecting the cells).
Page 12
COSC 122 - Dr. Ramon Lawrence
Manipulating Cells - FillingFilling combines copy and paste.
There is a small box or tab beyond the cell's lower right corner (fill handle). Grab it with the cursor and pull to other cells.

Page 13
COSC 122 - Dr. Ramon Lawrence
Cut, Copy, Paste
cut, copy,paste
Page 14
COSC 122 - Dr. Ramon Lawrence
Hiding Columns and RowsYou can hide a column or row by right-clicking on the column or row header and selecting Hide. The column/row still exists but will not be displayed or printed unless unhidden.
Page 15
COSC 122 - Dr. Ramon Lawrence
Entering FormulasA formula is any expression that begins with an equal sign ("=").
The equal sign indicates to the spreadsheet that a calculation must be performed to compute the value of the cell.
formula
Page 16
COSC 122 - Dr. Ramon Lawrence
Formula ExpressionsA formula expression can consist of literals (numbers, text strings), operators, functions, and cell references.
Simple mathematical expressions:
= 1 + 5
= 1.5 * 3.14 + 42
Common functions:
= ROUND(PI,2) // Result is 3.14
= CONCATENATE("Hello", " World") // Hello World
Other common functions for trigonometry, dates, and financial.
Page 17
COSC 122 - Dr. Ramon Lawrence
Formula ExpressionsThe power of formulas comes from using cell references (similar to variable names in programming).
Cell reference examples:
= A1 + A2
= B1 + A3 - A4
Page 18
COSC 122 - Dr. Ramon Lawrence
SpreadsheetsSelecting Cells
Question: Which method allows you to select non-contiguous cells in a spreadsheet?
A) hold SHIFT key and use arrow keys
B) With the mouse left click on a cell and drag mouse
C) hold CTRL key and use arrow keys
D) hold CTRL key and left click on cells

Page 19
COSC 122 - Dr. Ramon Lawrence
SpreadsheetsFormulas
Question: A cell contains the following: =3+5*2 What is the value of the cell?
A) 13
B) 16
C) =3+5*2
Page 20
COSC 122 - Dr. Ramon Lawrence
SpreadsheetsFormulas
Question: A cell contains the following: 'ABC'+'DEF' What is the value of the cell?
A) error
B) ABCDEF
C) 'ABC'+'DEF'
Page 21
COSC 122 - Dr. Ramon Lawrence
Advanced Spreadsheet AddressingThe dollar sign "$" is a special symbol that indicates an absolute address.
By default, addresses are "relative" in the sense that if they are in a formula that is copied to another cell, they will be changed relative to where they were copied from their origin.
Example:
Cell A1 has the formula =A2+B1
Copy contents of cell A1 to cell C4.
Formula changes to =C5+D4 because moved down three rows and over two columns.
If cell A1 had the formula =$A$2+$B$1, then the same formula would be in cell C4.
Question: What if formula was =$A2+B$1?Page 22
COSC 122 - Dr. Ramon Lawrence
SpreadsheetsFormulas and References
Question: Cell A1 contains the following: =$B2+D$4 What is the formula if the cell is copied to cell D3?
A) error
B) =$B2+D$4
C) =$B4+F$4
D) =$B4+G$4
Page 23
COSC 122 - Dr. Ramon Lawrence
Naming CellsInstead of referring to cells by their address, you can give a cell a name and use that name in cell formulas.
This makes it easier to read and understand formulas.Like programming variables where we use names instead of addresses
to refer to data locations.
Example: Refer to columns by name Hours and Rate.name box named cells use names in formula
Page 24
COSC 122 - Dr. Ramon Lawrence
Aggregate FormulasAn aggregate formula computes a summary function over a range of cells. The values can either be literals or cell locations.
Common functions are:
MIN(<value list>) - returns minimum value in list
MAX(<value list>) - returns maximum value in list
SUM(<value list>) - returns sum of all values in list
AVERAGE(<value list>) - returns average of values in list
COUNT(<value list>) - returns count of values in list
MEDIAN(<value list>) - returns median value of list
If specifying a cell rectangle, give the upper left and lower right corners, separated by a colon.
e.g. =average(A3:E6) - rectangle of 4 rows and 5 columns

Page 25
COSC 122 - Dr. Ramon Lawrence
Aggregate Formula Examplebuilding formula by selection
Page 26
COSC 122 - Dr. Ramon Lawrence
Sorting Data
Data can be sorted by selecting the Sort option under the Data menu.
Select the column(s) to sort on.
Page 27
COSC 122 - Dr. Ramon Lawrence
SpreadsheetsAggregate Formulas
Question: Assume the three cells in the range A1:C1 contain numbers. Which of these formulas is ALWAYS the largest?
A) MAX(A1:C1)
B) MIN(A1:C1)
C) COUNT(A1:C1)
D) SUM(A1:C1)
E) none of the above are always guaranteed to be the largestPage 28
COSC 122 - Dr. Ramon Lawrence
ChartsA chart is a graphical representation of spreadsheet data.
A chart is of a particular type (line, bar, etc.) and requires the user to supply the data that will be displayed in the chart.
Page 29
COSC 122 - Dr. Ramon Lawrence
Chart: Step #1 - Select Data and TypeSelect Insert, then click Chart Icon, and pick the chart type.
chart shortcut
Page 30
COSC 122 - Dr. Ramon Lawrence
Chart OptionsChart design tools allows you to modify the data in the chart, change the chart type, and move the chart in the Worksheet.

Page 31
COSC 122 - Dr. Ramon Lawrence
Chart: Step #2 - Verify DataYou may modify the data displayed in the chart using the Select Data option. This includes adding legends.
Page 32
COSC 122 - Dr. Ramon Lawrence
Chart: Step #3 - Chart OptionsUnder Layout (Chart Tools) you can set the title, legend, and colors. There are more format options under Format.
Page 33
COSC 122 - Dr. Ramon Lawrence
Chart: Step #4 - Chart LocationPut chart on an existing sheet or on its own sheet by selecting Move Chart in the Design area.
Page 34
COSC 122 - Dr. Ramon Lawrence
Final Chart
Page 35
COSC 122 - Dr. Ramon Lawrence
Other Formatting: Column WidthResizing columns:
Auto-resize by double clicking on border between columns or using the Format option.
May also right-click on column to get Format option in the pop-up menu.
Page 36
COSC 122 - Dr. Ramon Lawrence
Conditional FormattingConditional formatting allows you to change the cell format based on data values. This is accessible under Styles.
Other options: data bars, color scales
Page 37
COSC 122 - Dr. Ramon Lawrence
Conditional Formatting ResultThe paint format button allows you to copy formatting to many cells. Select the cell, click paint button, then highlight cells to have identical formatting.
paint formattingbutton
Page 38
COSC 122 - Dr. Ramon Lawrence
Spreadsheets for Data ManagementA spreadsheet is often used as a simple form of a "database". A database is an organized representation of information.Examples: schedules and calendars, timesheets, expenses and
finances, records, notes, and recipes, data research/analysis
We can use a spreadsheet as a database by:Using a row to store all the information about something we
want to represent.
Giving each column a meaningful name. A column represents a property or feature of the object stored in the row.
Using the formulas to calculate new facts from the data.
Using sorting to organize the data by key features.
Using simple filtering (querying) to only show the most important data or data of interest.
Page 39
COSC 122 - Dr. Ramon Lawrence
FilteringA filter shows a subset of the rows in the spreadsheet by only showing rows that pass a given condition (test).
For our purposes, the Auto Filter under the Data then Filter menu is sufficient.
Once you select Auto Filter, each column heading has a drop-down list. By selecting a filtering criteria from the list, you can limit the rows that are displayed.
It is possible to filter on more than one column at the same time.
Page 40
COSC 122 - Dr. Ramon Lawrence
Filter ExampleFilter on Total column: Can select a value, Top 10 items, or write a custom filter.
Page 41
COSC 122 - Dr. Ramon Lawrence
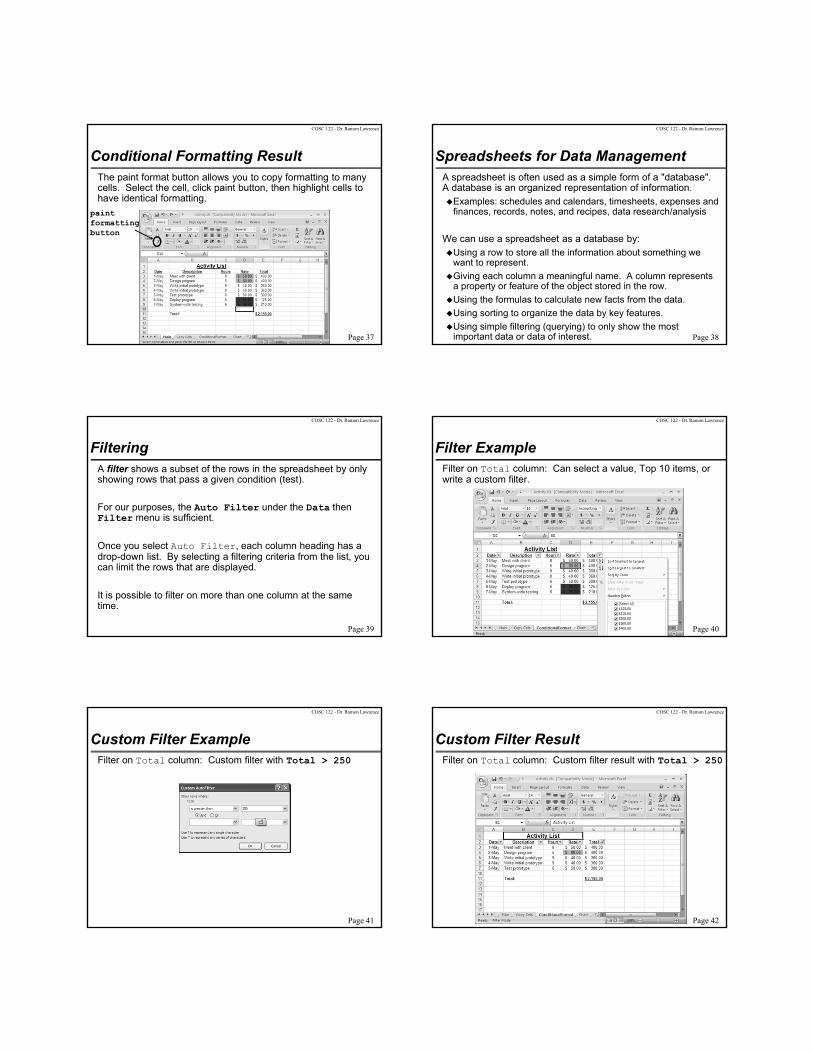
Custom Filter ExampleFilter on Total column: Custom filter with Total > 250
Page 42
COSC 122 - Dr. Ramon Lawrence
Custom Filter ResultFilter on Total column: Custom filter result with Total > 250

Page 43
COSC 122 - Dr. Ramon Lawrence
ConclusionSpreadsheets are programs for storing and manipulating data that is represented as a table of cells.
Each cell has a row number and column label which combine to represent its address. A cell can contain a number, text, date, or a formula that calculates its value.
Spreadsheets allow you to organize data and write formulas to do computations. They are a powerful tool for data storage and analysis.
Page 44
COSC 122 - Dr. Ramon Lawrence
ObjectivesDefine: spreadsheet
Explain how cells are addressed in a spreadsheet.
List some of the ways to select cells in a spreadsheet.
Explain: filling
Define and explain: formula
Explain how an aggregate function works. List some examples.
Explain the usefulness of charts.
Define: conditional formatting
Explain how spreadsheets can be used as a database.