corrosion of stainless steel 316 l with time in various ... of... · corrosion of stainless steel...
TRANSCRIPT
١
Corrosion of Stainless steel 316 L in Various Aqueous Salt Solutions
Nawal Muhammad Dawood Collage of Materials Engineering - Babylon University
Abstract
The change with time in the corrosion rate and corrosion current density on an austenitic stainless steel 316 L electrode in various aqueous salt solutions have been carried out using total immersion test and Tafel extrapolation curves. The concentration of salts taken is 5 g/liter. The relative behavior of these salts towards corrosion has also been studied. The total immersion test parameters vise weight loss; corrosion rate as well as Tafel extrapolation parameters, PH, electrical conductivity have been calculated by standard methods.
The results showed that NaCl and KCl are major contributors than MnSO4, Pb (NO3)2, KI, and KBr .The relative increase in corrosion is high in KBr, KI, NaNO3 CaCL2, and less in Pb(NO3)2, NaHCO3, and CaCO3 test solutions.
Key words: Stainless steel, Aqueous salt solution, Corrosion rate, Immersion test.
في محاليل ملحية مختلفة L 316تآكل الفوالذ المقاوم للصدأ
نوال محمد داود كلية هندسة المواد -جامعة بابل
الخالصة
باستخدام ملحية مختلفةفي محاليل L 316للفوالذ المقاوم للصدأ التآكلث قياس معدل تم في هذا البح باإلضافة ). 5g/liter(الملحية بتركيز لالمحالي ستخدمتا .ومنحنيات استكمال تافل الكلي للنماذجالغمر اختبار
تم قياس معامالت اختبـار . إلى ذلك جرى التعرف على سلوك هذه األمالح وتأثيرها على قيم معدالت التآكلوقيـاس ، كذلك معامالت استكمال تافـل ، معدل التآكل ،المفقودالتآكل بطريقة الغمر الكلي والتي تشمل الوزن
.والموصلية الكهربائية للمحاليل PHوجيني األس الهيدرـ NaCl ،KCL أمالحتأثير إنالنتائج أظهرت MnSO4، KBr, KI مـن أمـالح أثيراأكثـر ت
Pb(NO3) . ة يكون عاليا في المحاليل الملحي التآكلالنسبية في معدل الزيادة إن CaCL2، NaNO3، KI
KBr في المحاليل الملحية وأقلPb(NO3)2 ،NaHCO3 ، .CaCO3
.اختبار الغمر ،التآكلمعدل ، محاليل ملحية مائية ،للصدأالفوالذ المقاوم :الرئيسيةالكلمات
PDF created with pdfFactory Pro trial version www.pdffactory.com
٢
1. Introduction Stainless steel is widely used for potable water storage purposes beside other
metals. The extent and cost of damage caused by leakage in storage containers has been rising during recent years. The use of stainless steel in potable water storages, heat exchangers and steam turbines is now common. Within heat exchangers and steam turbines themselves stainless steel is now generally used for vanes, blades and shafts .The corrosion resistance of stainless steel is however better than many alloys. Various studies have been carried out for determination of corrosive behavior of stainless steel in acid and basic mediums , but it is corrosion resistance in salt aqueous solutions at high concentration of salts is a little bit limited (Stephen and others, 2005). Dissolved salts and oxygen (Ibrahim, 2005) mainly determine corrosive behavior of metals in aqueous solutions. In order to minimize corrosion problem in heat exchangers and steam turbine parts, it is important to identify the mechanism of corrosion rate of ions with stainless steel, the extent to which they contribute to corrosion in potable water as well as threshold limiting values to which the corrosion rate should be minimize in order to provide excellent corrosion resistance (Essam and Hussein, 2005).
Exposure to seawater introduces a number of factors not present largely in atmospheric exposure. Selection of a stainless steel grade for seawater immersion is for more complex than selection for atmosphere service. However in stagnant seawater (particularly badly contaminated harbor waters), stainless steel are likely to pit severely from befouling. Application of stainless steel in seawater includes structures, heat exchangers, piping and special items such as propellers (Shrier, 2000).
Many stainless steel -particularly the austenitic types like 316L- are used extensively for room and elevated temperature applications such as chemical processing equipment, heat exchangers and superheated tubes for power boilers. Further AISI 316L stainless steel are now common in the marine application, they are used for propeller shafts, and where high torque is present (Uhligs, 2000) 2. Experimental details
The material used in this work is (AISI 316L) stainless steel, it is machined and formed to discs of (20) mm in diameter and (4) mm thick. Analysis of these samples was carried out using (spectrometer DV. 4) in Al-Nasser company. Table1 shows the nominal (Peckner and Bernstein, 1977) and the analytical chemical composition of the (AISI 316L) stainless steel.
To ensure satisfactory service life, the surface condition of stainless steel must be given carefully attention .Smooth surface, plus freedom from surface imperfection, blemishes and all traces of scale and other foreign material reduce the probability of corrosion. Generally, a smooth, highly polished reflective surface has greater resistance to corrosion. Rough surfaces are more likely to catch dust, salts, and moisture, which tend to localize corrosion attack.
Acetone was used to remove oil and grease. Surface contamination may be caused by mechanical operation. Small particles of metal from tools become embedded in the steel surface and, unless removed, may cause localized galvanic corrosion.
Small hole of 2 mm diameter was drilled in each sample for holding. All surfaces, including the edges were wet ground using 120, 220, 320, 600, 800, 1000, and 1200 grit silicon carbide papers. These samples were then cleaned with water, and then ultrasonically cleaned for 30 minutes using ethanol as a medium. After drying, the samples were stored in polyethylene zip- lock bags. The dimensions of all samples were measured in three places along the length to a precision ± 0.0l mm using
PDF created with pdfFactory Pro trial version www.pdffactory.com

٣
calibrated micrometer. Measured dimensions were averaged to provide the sample diameter, and thickness to be used in surface area calculation. The weight of each sample was measured using Sartorius electronic balance with an accuracy of ± 0.1 mg. prior to weighing, all samples were held overnight in glass dessicator in order to eliminate any effect of humidity on the sample weight determination.
Because actual service conditions are difficult or impossible to reproduce in standard laboratory tests, results of such tests usually can serve only as a guide. Chemical conditions, temperature should parallel those in the process; therefore, field tests in existing equipment in a comparable process should be used wherever possible, in order to duplicate anticipated conditions.
Each sample was suspended by plastic hook in a beaker filled with test solution, for different duration of immersion: 3, 6, 9, 12, 15, 18, 21, 24, 27, and 30 day. The specimens are weighted again after the specified period of exposure to the corrosive medium. The weighting is carried out after the specimens are cleaned with alcohol, and drying them carefully with drying paper.
This process is repeated several times to get several readings. Thus, diagram can be made to show weight loss with time and with corrosive mediums. The related laws are applied to find corrosion rate. Microstructure examinations are made often every specimen before and after the given tests. Result of weight loss measurement for corrosive mediums have been carried out for NaCl , KCl, Na2SO4, CaCO3, CaCl2, MgSO4 , NaNO3 , MnSO4 ,Pb (NO3)2 , KBr , and KI salts using (5g /liter ) for each salt, in order to determine the average contribution of each salt to the corrosion rate. Distilled water was used in the preparation of all test solution. All chemical used were of analytical grade.
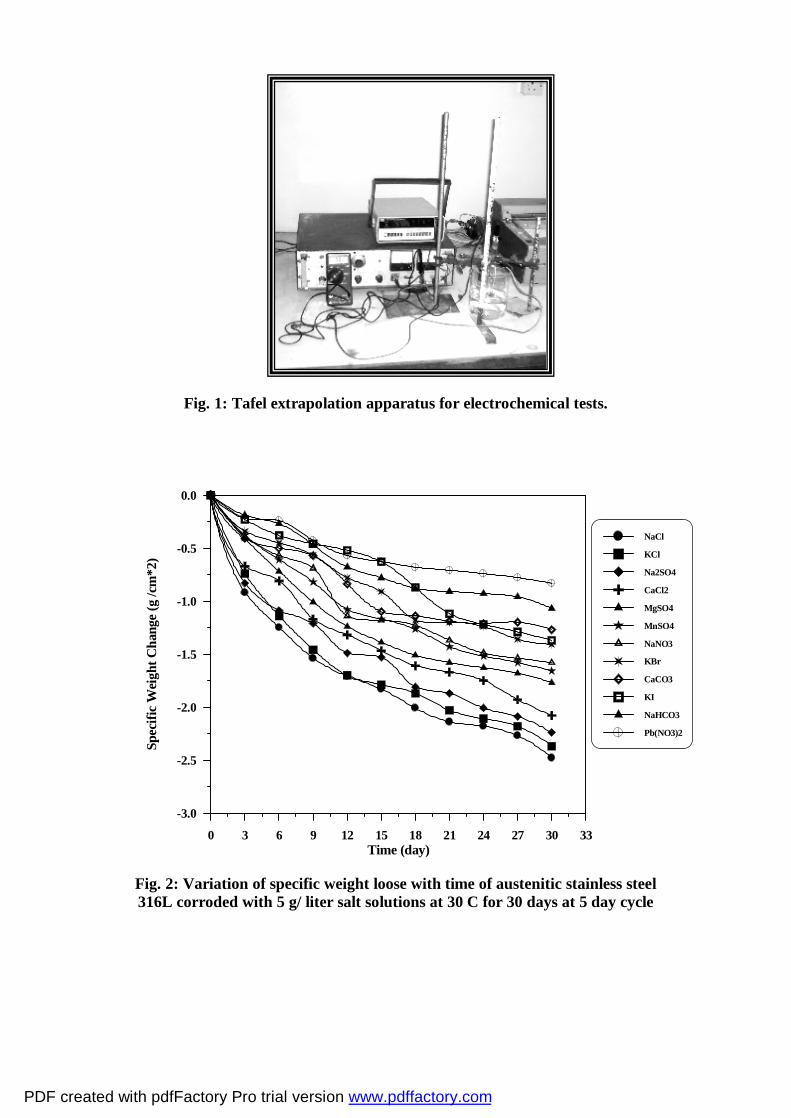
Fig. 1 illustrates Tafel extrapolation apparatus which used to measure corrosion currents in this work. This apparatus consisted of power supplier type PRT which supplied DC current at the range (0- 500 mA). Digital voltmeter to measure voltage difference between auxiliary electrode type (Tagussel Pt- FO 5/ 30) and calomel electrode type (Tagussel Ca- F 10/ 15 bridged by laggin- Haber Probe), and to measure the passed current in these electrodes, digital milliamp type Hewlett Packard, USA, 3466 A.
PH and electrical conductivity for test solutions were measured. PH values were measured by PH meter type Beckman model (A1 Tex), whereas electrical conductivity values were obtained by digital conductivity meter type Bisschof model (L11). 3. Results and Discussion
The corrosion rate of stainless steel in the test solutions is calculated from decrease in weight observed in samples in weight loss tests using following formula (Orubite and Oforka, 2004):
Corrosion rate (mpy) = 534 w/ DAT Where: mpy: mils penetration per Year, 1 mils 10-3 inch W= weight loss (mg) D= density of sample g/cm3
A= area of sample (inch2) T= exposure time (hrs.) Fig. 2 shows the results of samples specific weight change obtained by
corrosion test for 316 L stainless steel for different durations of exposure in different
PDF created with pdfFactory Pro trial version www.pdffactory.com

٤
aqueous salt solutions. An increase in value of loss in weight was observed. Whereas Table 2 listed the corrosion rate values of stainless steel in various aqueous salt solutions are in the order of NaCl >KCL >Na2SO4 >CaCl2 > NaNO3> MgSO4> CaCO3> MnSO4> KI> NaHCO3> Pb (NO3)2> KBr for 30 day.
The two anions that are found to have a significant influence on the corrosion characteristics of stainless steel are chloride and sulphate ions. It is clear from Fig .2 and Table 2 that metal loss increases progressively with immersion time in salt solutions but corrosion rate dose not follow a definite trend for all test solutions and is not proportional with time. The corrosion rate of stainless steel in NaCl, KCl, Na2SO4, CaCl2, NaNO3, MgSO4, and KI increase continuously with immersion period while in the KBr ,Pb(NO3)2, NaHCO3, CaCO3, and MnSO4 test solutions, the corrosion rate increase is followed by a decrease after some period. This may be because of anions accelerator and inhibitor behavior caused by stability of chromium oxide film formed after corrosion reaction (Roberge, 2000). The relative increase in halide ions salts is found to be more than other ions because of corrosive nature of halide ions than sulphate and nitrate ions.
The initial rate of corrosion is high for NaCl and KCl and the relative increase in corrosion rate is less as the reaction proceeds, because there remains no direct contact between metal surface and corrosive ions by corrosion products and excess of cations near by the metal surface (Dillon, 2001).
Although chloride is known to be the primary agent of pitting attack, it is not possible to establish a single critical chloride limit for each grade. The corrosively of a particular concentration of chloride solution can be profoundly affected by the presence or absence of various other chemical species that may accelerate or inhibit corrosion. Chloride concentration may increase where evaporation or deposits occur. Because of the nature of pitting attack- rapid penetration with little total weight loss –it is rare that any significant amount of pitting will be acceptable in particular applications (Abiola, and Oforka, 2002).
Fig. 3a illustrates the effects of NaCl solution at concentration of (5g /liter) heights density of corrosion pittings and notches are the main characteristics on the metal surface, further un uniform corrosion appeared on the metal surface .The occurring of high pitting density leads to high corrosion rate on the metal surface.
Fig. 3b illustrates the effects of KCl solution at concentration of (5g /liter) where corrosion occurred as pitting and notches but a little bit smaller than in NaCl solution case where the portion of area damage was smaller besides of non-uniform corrosion.
Fig. 3c illustrates the effects of CaCl2 solution at concentration of (5g /liter) where corrosion appears as pittings and notches filled with corrosion products. In fact, the electrolyte solution was accumulated in these notches and become higher concentration than in the solution surrounded the sample, therefore this will leads to increase the corrosion rate in these pittings.
Halide salts, particularly chlorides, tend to promote localized attack such as pitting, crevice corrosion and stress corrosion cracking. In general, high molybdenum contents help to control pitting and crevice corrosion, and high nickel contents resist chloride – ion stress corrosion cracking (Kruger, 2000).
The corrosion resistance of stainless steel is believed, to result from the presence of thin hydrous oxide film on the surface of the metals. Russell (Russell, 2004) has stated that the passive film on type AISI 316L stainless steel is 4M3O4SiO2. nH2O, where the 12 metal atoms represented by 4M3 consist of about seven Fe plus 2Ni plus 3Cr and n is integer whose average value is about nine.
PDF created with pdfFactory Pro trial version www.pdffactory.com

٥
The film various in composition from alloy to alloy and with different temperatures. For any stainless steel, this film, stabilized by chromium, is considered continuous, nonporous, insoluble, passive and self-healing (Washington, 2001).
Passivity is the corrosion resistant behavior produced by the presence of (passive) oxide film. It is not a constant state: it exists only in certain environments or under certain conditions. Passivity may be destroyed by slight changes in conditions. Under circumstances favorable to passivity, stainless steel has solution potentials approaching those of noble metals. When passivity is destroyed. If that happens, stainless steel can fail by localized mechanisms such as pitting, crevice corrosion, intergranular corrosion or stress-corrosion cracking. Localized corrosion can be catastrophic. Usually a very small portion of the stainless steel area is involved, and the damage may be difficult to detect before failure (Smith et al., 2000).
Pitting is localized attack that can produce penetration of a stainless steel with almost negligible weight loss to the total structure. Pitting is associated with a local discontinuity of the passive film. It can be a mechanical imperfection, such as an inclusion or surface damage, or it can be a local chemical breakdown of the film. Chloride is the most common agent for initiation of pitting. Once a pit is formed, it in effect becomes a crevice; the local chemical environment is substantially more aggressive than the bulk environment (Callister, 2003).
The stability of the passive film with respect to resistance to pitting initiation is controlled primarily by chromium and molybdenum. Minor alloying elements can also have an important effect by influencing the amount and type of inclusions (for example, sulfides) in the steel that can act as pitting sites (Callister, 2003).
Stainless steel has the active –passive behavior when immersed in corrosive mediums where Cr2O3 was formed on the metal surface, which tends to minimize the corrosion action. This oxide layer gives the passivity property, i.e formation of active oxide layer against corrosion but the occurring of cracks in protected layer tends to make the metals surface active. This makes the surface more active and the crack will proceeds and the corrosion will continue (Kutz, 2002).
Halogen salts, especially chlorides easily penetrate this passive film and will allow corrosive attack to occur. Chlorides are one of the most common elements in nature and if that is not bad enough, they are also soluble, active ions; the basic for good electrolytes, the best conditions for corrosion or chemical attack (Talbot and Lames, 1998).
Fig. 3d illustrates the effects of Na2SO4 solution on the metal surface, in facts the effects of corrosion in this case are smaller than previous cases. However, the corrosion pittings were also obvious and this in agreement with corrosion rate values listed in Table 2.
On the other hand, in the KBr and KI test solutions the initial corrosion rate is less due to non-availability of anions at the metal surface. After initiation of reaction, the rate increases continuously and is not hindered by corrosion as in the case of KCl, NaCl, and CaCl2. The negative increase in CaCO3 and less increase in NaHCO3 of corrosion rate indicates the non-corrosive behavior of CaCO3 and NaHCO3 because of less mobility of Ca+2 and HCO3
- ions (Even, 1997). Fig. 3e illustrates the effects of MgSO4 solution where corrosion pittings
appeared on the metal surface with small dimensions. Fig. 3f illustrates the effects of MnSO4 solution where corrosion pittings
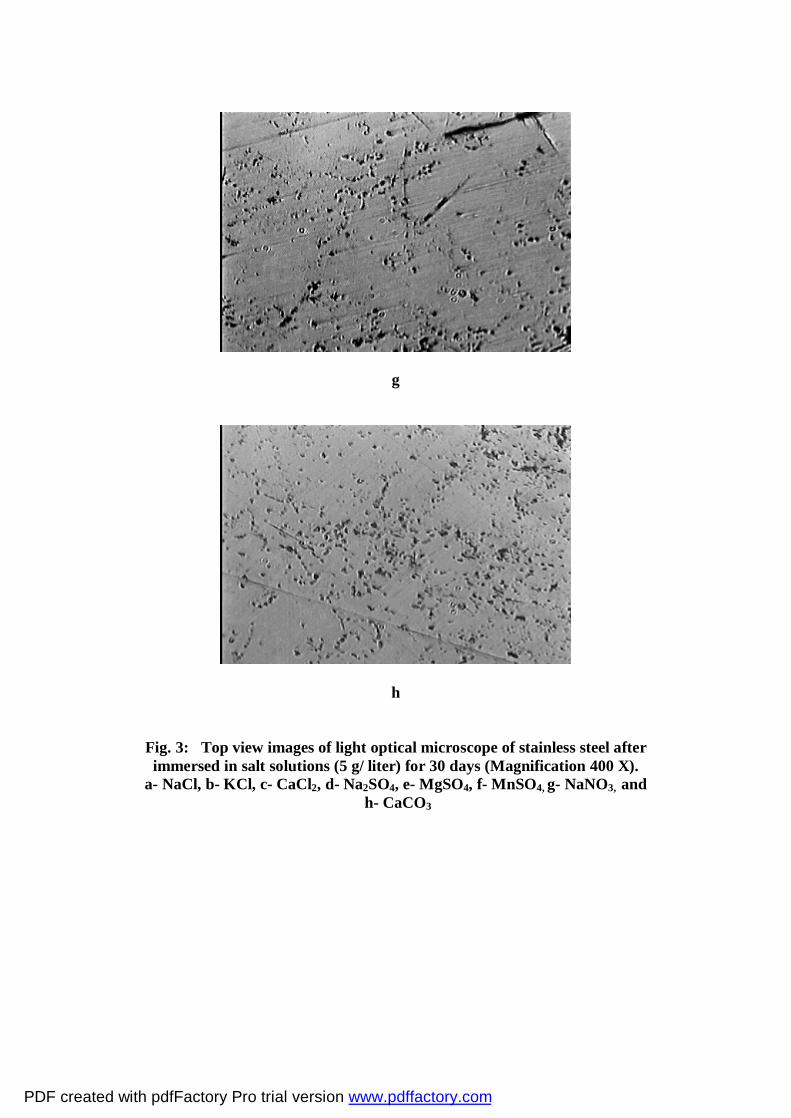
appeared on the metal surface but with smaller density in comparison with Fig. 2e. Fig. 3g illustrates the effects of NaNO3 solution where corrosion pittings
appeared on the metal surface with different densities.
PDF created with pdfFactory Pro trial version www.pdffactory.com
٦
Except for halide salts, the corrosively of a salt is based primarily on its oxidizing strength and on whether it hydrolyzes to an acid or a base. For example, materials, that are resistant to nitric acid most likely are resistant to nitrates, include both sodium nitrate and ferric nitrate. These nitrate salts have high oxidizing strength and will readily hydrolyze to form nitric acid (Even, 1997).
Fig. 3h illustrates the effects of CaCO3 solution where corrosion pittings occurred with different sizes and densities.
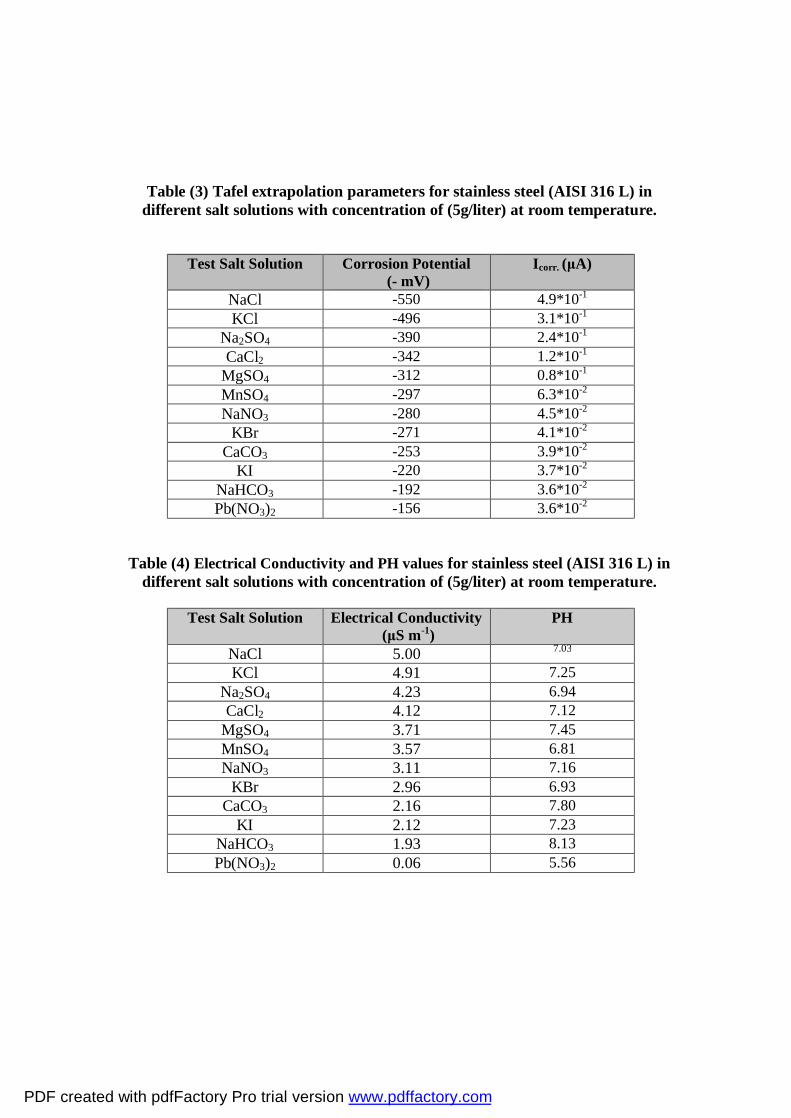
The samples immersed in the different test solutions develop the corrosion potential as - 550 mV for NaCl, - 496 mV for KCl, -390 mV for Na2SO4, -342 mV for CaCl2, -312 mV for MgSO4, -297 mV for MnSO4, -280 mV for NaNO3, -271 mV for KBr, -253 mV for CaCO3, -220 mV for KI, -192 mV for NaHCO3, -156 mV for Pb (NO3)2.
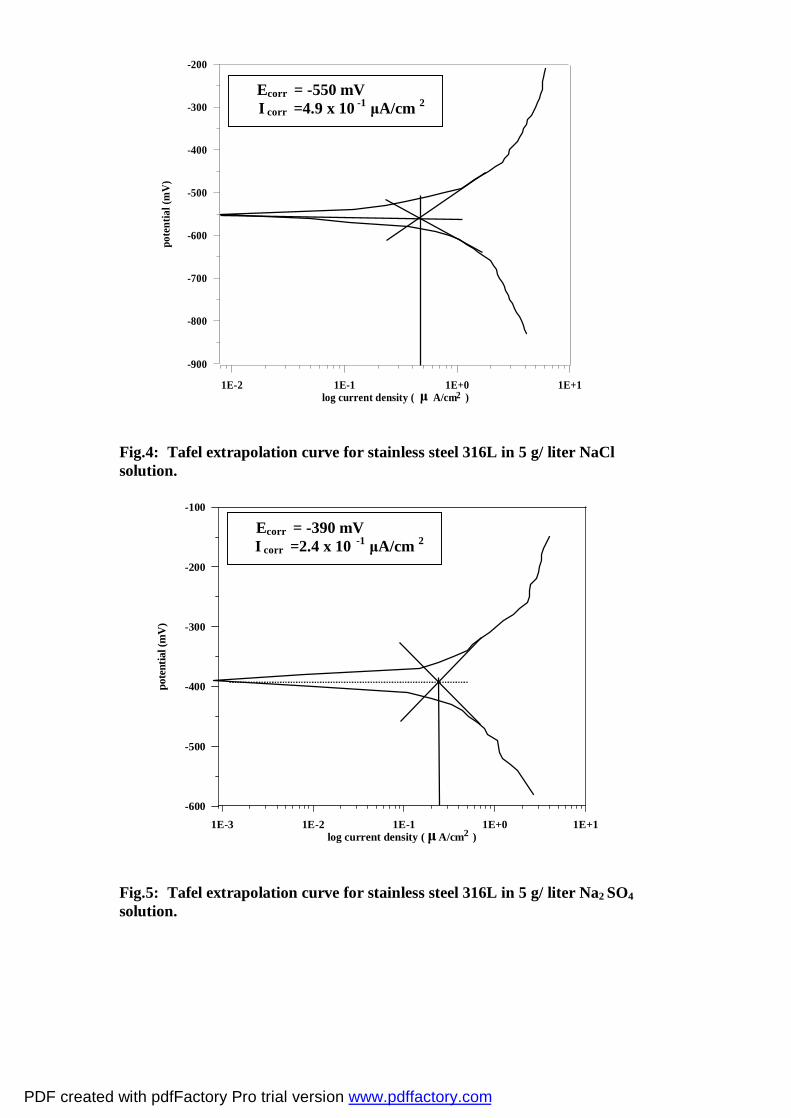
Anodic and catholic polarization plots for stainless steel 316 L in 5 g / liter of NaCl, Na2SO4, NaNO3, and KI test solutions are shown in figures 4, 5, 6, and 7 respectively. The values of Icorr. and corrosion potential for various test solutions calculated from Tafel extrapolation curves have been given in Table 3. The trend of corrosion rates for stainless steel 316 L in different test solutions observed by weight loss and Tafel extrapolation curves is in a good agreement. These observed results can be correlated with the small concentration of ions and small values of corrosion rates as compared to earlier studies (Koshel et. al., 1988)
Table 4 listed electrical conductivity and PH values of test solutions at room temperature. Electric conductivity values indicate to the ability of the electrolyte mediums to transfer electrical current. These values depend on the concentration, valence of electrolyte ions and the test temperature. For example, the electric conductivity of potable water increased by 2% as the test temperature increased by 1 oC. Generally all salts which tend to form ions in their aqueous solutions have good electrical conductivity values. For example, NaCl solution has higher electrical conductivity values, because of smallness of chlorine ions, and this tends to make the transmitted and diffusivity of ions easy. Whereas the low conductivity of salt solutions belongs to low ability of solutions to be in ionic conditions, and to lower movement of ions. However the electrical conductivity depends on many factors like ions size, ions weight, ions charges, and solution test temperature (Roberge, P. R., 2000). The values of electrical conductivity of salt test solutions listed in Table 4 are consistent with corrosion rates values listed in Table 2 and the values of Icorr. and corrosion potential for stainless steel 316 L in different test solutions.
According to Fontana (Fontana, 1986) for the more commonly used low C steel and steel alloy , < 1 mpy is outstanding corrosion rate , 1-5 mpy is excellent ,5-20 mpy is good and can be used with caution , 20-50 mpy is fair and can be used for short exposure, 50-200 mpy is poor and above 200 mpy completely unacceptable. However, corrosion rates calculated in Table 2 are acceptable and classified in the first class (< 1 mpy). 4. Conclusions
From the above results it is clear that anions play a decisive role in determining the ease with which stainless steel (AISI 316L) undergoes dissolution upon application of some anodic current density. The order of corrosion in various salt solutions is: NaCl>KCL>Na2SO4>CaCL2>MgSO4>MnSO4>NaNO3>KBr>CaCO3>NaHCO3> Pb (NO3)2 for 30 day, i.e. halide ions contribute significantly to the corrosion rate of stainless steel in potable water, sulphate and nitrate ions have intermediate effect and
PDF created with pdfFactory Pro trial version www.pdffactory.com

٧
carbonate and bicarbonate have minimum contribution to corrosion of stainless steel in potable water. 5. References
• Abiola, O. K., and Oforka, N. C., 2002, Corrosion Science and Engineering, http:// www.umist.au.uk.
• Callister W. D., Jr., 2003, Materials Science and Engineering an Introduction Sixth Edition, John Wiley &Sons, lnc.
• Dillon, C. P., 2001, Forms of Corrosion, MPE Engineers Inc. • Essam Hussein and Hussein A., 2005, Erosion – Corrosion of Duplex
Stainless Steel Under Kuwait Marine Condition , Kuwait Collage of Technological Studies, Automotive and Marine Engineering Department, www. elsevier. com/ locate/desal.
• Even, J., 1997, Corrosion in Stainless Steel, in: Advanced Materials Technology, vol. 151, No. 4.
• Fontana, M. G., 1986, Corrosion Engineering, London: McGraw Hill Publication) 3 rd edition.
• Hand Book of Material Selection, 2002, Edited by Myer Kutz, Associates, Inc Copyright by John Wiley &Sons, New York.
• Ibrahim Saeed L., 2005, Corrosion of Boiler Steel Pipes Under Given Operating Conditions in Presence and Absence of Some O2 Scavengers , College of Engineering , University of Baghdad , Chemical Engineering Department.
• Koshel, K. C.; Bhatia, J. S.; Shailendra, K. and Samant, A. K.; 1988, ONGC Bulletin , Vol.25, No.115.
• Kruger, J., 2000, Basics of Corrosion Science and Engineering, McGraw-Hill. • Orubite; Okorosaye, K, and Oforka, N. C.; 2004, Corrosion Inhibition of zinc
on HCL using Nypa fruticans Wurmb extract and 1, 5 Diphenel carbazone, J.appl. Sci.; Vol. 8; No.1; pp. 57-61.
• Peckner, D. and Bernstein, I. M., 1977, Hand Book of Stainless Steels, McGraw-Hill.
• Roberge, P. R., 2000, Hand Book of Corrosion Engineering, McGraw-Hill. • Russell, M., 2004, Chemical Surface Treatments on Stainless Steel, Public
Relations Coordinator ASSDA, and Email: max- r@assda. Asn.an. • Shrier, L. L., 2000, Corrosion Metal / Environment reaction, Volume 1,
printed and bound in Great Britain, Butterworth Hejne Mann. • Smith et al., 2000, A Guide line to the Successful Use of Duplex Stainless
Steels for Flow Lines, Duplex 2000 conference, Houston. • Stephen M. M and others, 2005, Metallurgical Examination of Cooling Water
Equipment Failures, Ashland Specialty Chemical Company, Drew Industrial, The ANALYST.
• Talbot, D. and Lames T., 1998, Corrosion Science and Technology, CRC Press LLC.
• Uhlig, R. W., Corrosion Handbook, 2nd Edition, John Wiley and Sons Inc.
• Washington, D. C.; 2001; Report on the Corrosion of Certain Alloys, United States Environmental Protection Agency.
PDF created with pdfFactory Pro trial version www.pdffactory.com
٨
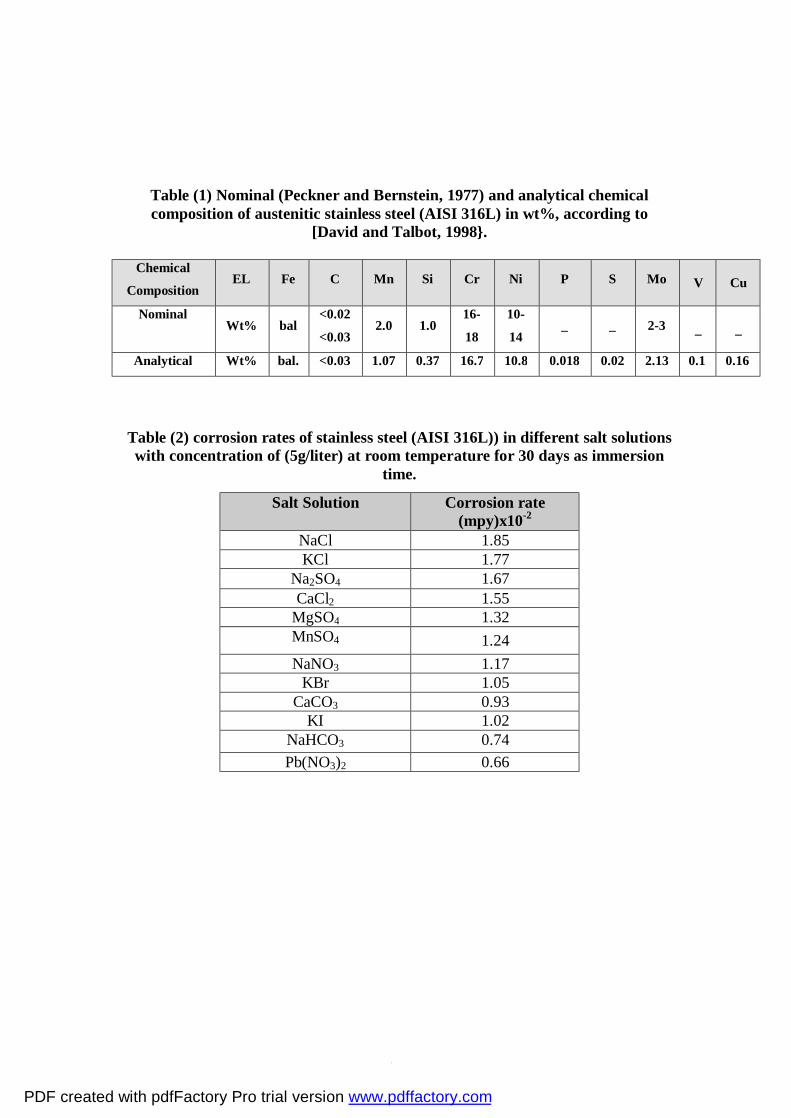
Table (1) Nominal (Peckner and Bernstein, 1977) and analytical chemical composition of austenitic stainless steel (AISI 316L) in wt%, according to
[David and Talbot, 1998}.
Chemical
Composition EL Fe C Mn Si Cr Ni P S Mo V Cu
Nominal Wt% bal
<0.02
<0.03 2.0 1.0
16-
18
10-
14 _ _ 2-3 _ _
Analytical Wt% bal. <0.03 1.07 0.37 16.7 10.8 0.018 0.02 2.13 0.1 0.16
Table (2) corrosion rates of stainless steel (AISI 316L)) in different salt solutions with concentration of (5g/liter) at room temperature for 30 days as immersion
time.
Corrosion rate (mpy)x10-2
Salt Solution
1.85 NaCl 1.77 KCl 1.67 Na2SO4 1.55 CaCl2 1.32 MgSO4 1.24 MnSO4
1.17 NaNO3 1.05 KBr 0.93 CaCO3 1.02 KI 0.74 NaHCO3 0.66 Pb(NO3)2
PDF created with pdfFactory Pro trial version www.pdffactory.com
٩
Table (3) Tafel extrapolation parameters for stainless steel (AISI 316 L) in different salt solutions with concentration of (5g/liter) at room temperature.
Test Salt Solution Corrosion Potential (- mV)
Icorr. (μA)
NaCl -550 4.9*10-1
KCl -496 3.1*10-1 Na2SO4 -390 2.4*10-1 CaCl2 -342 1.2*10-1
MgSO4 -312 0.8*10-1 MnSO4 -297 6.3*10-2 NaNO3 -280 4.5*10-2
KBr -271 4.1*10-2 CaCO3 -253 3.9*10-2
KI -220 3.7*10-2 NaHCO3 -192 3.6*10-2 Pb(NO3)2 -156 3.6*10-2
Table (4) Electrical Conductivity and PH values for stainless steel (AISI 316 L) in different salt solutions with concentration of (5g/liter) at room temperature.
Test Salt Solution Electrical Conductivity
(μS m-1) PH
NaCl 5.00 7.03
KCl 4.91 7.25 Na2SO4 4.23 6.94 CaCl2 4.12 7.12
MgSO4 3.71 7.45 MnSO4 3.57 6.81 NaNO3 3.11 7.16
KBr 2.96 6.93 CaCO3 2.16 7.80
KI 2.12 7.23 NaHCO3 1.93 8.13 Pb(NO3)2 0.06 5.56
PDF created with pdfFactory Pro trial version www.pdffactory.com
١٠
Fig. 1: Tafel extrapolation apparatus for electrochemical tests.
Fig. 2: Variation of specific weight loose with time of austenitic stainless steel 316L corroded with 5 g/ liter salt solutions at 30 C for 30 days at 5 day cycle
0 3 6 9 12 15 18 21 24 27 30 33Time (day)
-3.0
-2.5
-2.0
-1.5
-1.0
-0.5
0.0
Spec
ific
Wei
ght C
hang
e (g
/cm
*2)
NaCl
KCl
Na2SO4
CaCl2
MgSO4
MnSO4
NaNO3
KBr
CaCO3
KI
NaHCO3
Pb(NO3)2
PDF created with pdfFactory Pro trial version www.pdffactory.com


١٣
g
h
Fig. 3: Top view images of light optical microscope of stainless steel after immersed in salt solutions (5 g/ liter) for 30 days (Magnification 400 X).
a- NaCl, b- KCl, c- CaCl2, d- Na2SO4, e- MgSO4, f- MnSO4, g- NaNO3, and h- CaCO3
PDF created with pdfFactory Pro trial version www.pdffactory.com
١٤
Fig.4: Tafel extrapolation curve for stainless steel 316L in 5 g/ liter NaCl solution.
Fig.5: Tafel extrapolation curve for stainless steel 316L in 5 g/ liter Na2 SO4 solution.
Ecorr = -550 mV I corr
=4.9 x 10 -1 μA/cm 2
μ 1E-2 1E-1 1E+0 1E+1
log current density ( A/cm )
-900
-800
-700
-600
-500
-400
-300
-200
pote
ntia
l (m
V)
2
μ
Ecorr = -390 mV I corr
=2.4 x 10 -1 μA/cm 2
1E-3 1E-2 1E-1 1E+0 1E+1log current density ( A/cm )
-600
-500
-400
-300
-200
-100
pote
ntia
l (m
V)
2
PDF created with pdfFactory Pro trial version www.pdffactory.com

١٥
Fig.6: Tafel extrapolation curve for stainless steel 316L in 5 g/ liter Na NO3 solution.
Fig.7: Tafel extrapolation curve for stainless steel 316L in 5 g/ liter KI solution.
Ecorr = -280 mV I corr
=4.5x 10 -2 μA/cm 2
μ 1E-2 1E-1 1E+0 1E+1
log current density ( A/cm )
-600
-500
-400
-300
-200
-100
0
pote
ntia
l (m
V)
2
1E-3 1E-2 1E-1 1E+0log current density ( A/cm )
-500
-400
-300
-200
-100
0
pote
ntia
l (m
V)
2μ
Ecorr = -220 mV I corr
=3.7 x 10 -2 μA/cm 2
PDF created with pdfFactory Pro trial version www.pdffactory.com