corrosion of al-sn-bi alloys in alcohol at high … have been newly developed as substitutes for...
TRANSCRIPT
Instructions for use
Title Corrosion of Al-Sn-Bi alloys in alcohol at high temperatures. Part I: Effects of the metallurgical structure of the alloysand the metal salt additions to alcohol
Author(s) Kikuchi, Tatsuya; Hara, Yasuhito; Sakairi, Masatoshi; Yonezawa, Tetsu; Yamauchi, Akira; Takahashi, Hideaki
Citation Corrosion Science, 52(4), 1482-1491https://doi.org/10.1016/j.corsci.2009.12.007
Issue Date 2010-04
Doc URL http://hdl.handle.net/2115/42757
Type article (author version)
File Information kikuchi_CS52.pdf
Hokkaido University Collection of Scholarly and Academic Papers : HUSCAP
1
Corrosion of Al-Sn-Bi Alloys in Alcohol at High Temperatures I. Effect of the Metallurgical Structure of the Alloys and the Metal Salt Additions
to Alcohol
Tatsuya Kikuchia,*, Yasuhito Haraa, Masatoshi Sakairia, Tetsu Yonezawaa, Akira Yamauchib, and Hideaki Takahashic
aGraduate School of Engineering, Hokkaido University, N13-W8, Kita-Ku, Sapporo, 060-8628, Japan
bCenter for Advanced Research of Energy Conversion Materials, Hokkaido University N13-W8, Kita-Ku, Sapporo, 060-8628, Japan CAsahikawa National College of Technology,
Syunkohdai, 2-2, 1-6, Asahikawa, 071-8142, Japan *Corresponding author: Tatsuya Kikuchi TEL: +81-11-706-7112 FAX: +81-11-706-7881 E-mail: [email protected] Key words: Aluminum alloy; Corrosion; alkoxide reaction; alcohol Abstract Corrosion of free machining Al alloys that contain Sn and Bi was investigated at 391–415K in 2-(2-(2-methoxyethoxy)ethoxy)ethanol (MEEE) and 2-(2-(2-butoxyethoxy)ethoxy)ethanol (BEEE) with/without SnCl2, Sn(OC2H5)4, FeCl3, and CuCl2. The Al-Sn-Bi alloy displayed severe pitting corrosion in MEEE as did the Al-Sn alloy in BEEE at 415K, and Sn and Sn/Bi were enriched on the surface of pits. Immersion tests of pure Al in MEEE containing Sn/Cu-salts at 415K also showed severe corrosion and the deposition of metallic Sn and Cu on the surface. The corrosion mechanisms are discussed in terms of the electro-catalytic activity of the Sn enriched on the surface. 1. INTRODUCTION Aluminum and its alloys corrode in alcohols at high temperature by the following reaction.
2Al + 6ROH = 2Al(OR)3 + 3H2 (1) The reaction leads to the formation of Al alkoxide, Al(OR)3, with hydrogen gas evolution, H2, and is well known as the “alkoxide reaction”. Tsuchida examined the effect of alcohol-mixing on the corrosion of pure Al for 72 h at 353 – 393 K, and found that the corrosion of Al was accelerated by mixing different kinds of alcohols [1]. Corrosion behavior of Al in water-organic solvent mixtures containing HCl was reported by Abd-El-Nabey et al., and they showed that the corrosion rate depends on the structure of the water-alcohol mixtures [2]. Zaharieva et al. worked on the corrosion of Al and its alloys in ethylene glycol (EG)-water mixtures, and showed significant corrosive action of glycolic acid and a protective effect of sebacic acid on Al corrosion [3]. Both Al corrosion and hydrogen evolution in the alkoxide reaction has been investigated. A review by Wang et al. described that SnCl4 could be used as a catalyst in the process of the H2 production by equation (1) [4]. Free machining Al alloys containing Pb have been used as brake cylinders of automobiles after machining of extruded-alloy bars, and the typical alloys used for such purposes are Al2011 (Al-5.5%Cu-0.4%Pb-0.4%Bi) and Al6262

2
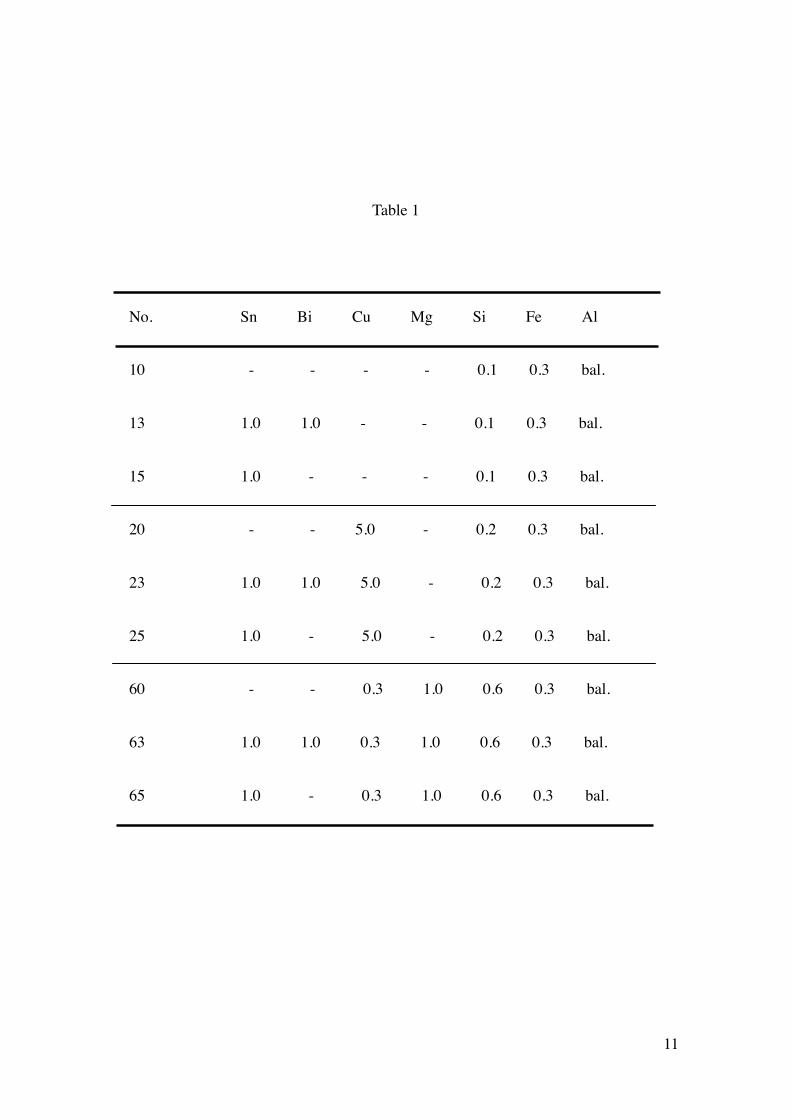
(Al-1.0%Mg-0.6%Si-0.6%-Pb-0.6%Bi) [5-6]. However, the directives of “End of Life Vehicles (ELV)” in 2000 and “Restriction of Hazardous Substances (RoHS)” in 2002 restrict the use of alloys containing Pb [7], and the development of new free machining alloys without Pb was required. Therefore, free machining Al alloys containing Sn and Bi have been newly developed as substitutes for Al-Pb-Bi alloys, and these new alloys are now used in many parts in vehicle and electronic products. The brake cylinder of vehicles contains brake-fluids, which are mixtures of different kinds of alcohol with high boiling temperatures. The chemical components of commercially available brake fluids depend on the supplier, but are mainly 2-(2-(2-methoxyethoxy)ethoxy)ethanol (MEEE, molecular weight, M = 164.2 g/mol, boiling point, Tb = 522 K), 2-(2-(2-butoxyethoxy)ethoxy)ethanol (BEEE, M = 206.3 g/mol, Tb = 551 K), 2-(2-(2-(2-methoxyethoxy)ethoxy)ethoxy)ethanol (M = 208.3 g/mol, Tb = 432 K at 5 torr.), and polyalkylene glycol (Maverage = 970 g/mol, Tb = unknown). They are heated during the operation of the brake systems, up to temperatures as high as 400 K, and are possibly involved in alkoxide reactions, resulting in the corrosion of the Al-alloy brake cylinders after long periods of operation. A research working-group on the corrosion of Al-Sn-Bi alloys in brake fluids was set up at the Corrosion Protection Committee of Japan Aluminum Association between 2005 and 2008 [8]. In the project, a survey of the corrosion of Al-Sn-Bi alloys in commercially available brake-fluids was carried out as the preliminary experimental work. Hatta et al. examined the corrosion of 15 kinds of Al-Sn-Bi extruded-alloys in two kinds of brake-fluids, obtained from different suppliers, for 120 - 240 h at temperatures between 353 K and 403 K [9]. Corrosion rates increased with more addition of Sn and Sn/Bi to the Al alloys and by immersion in the fluids at higher temperatures, and further, there was a tendency for decreases in corrosion rates with specimens in the order of pure Al > Al-Mg-Si alloy > Al-Cu alloy. Anodizing affected the corrosion behavior to some extent, and the effect depended on the chemical composition of the specimens. The research working-group next implemented further experimental work on the corrosion of selected Al-Sn-Bi alloys in MEEE and BEEE, and a series of experiments were conducted as in the following: 1) a corrosion survey of 9 kinds of specimens in MEEE and BEEE at different temperatures, 2) a survey of the effects of metal salt addition into MEEE on the corrosion of pure Al, 3) the anodizing effects on corrosion of 9 kinds of specimens in MEEE and BEEE, and 4) an evaluation of crack formation in anodic oxide films during immersion in MEEE by the Cu-modification method [10 – 12]. The results of Experiments 1) and 2) are described in the present investigation, and those of experiments 3) and 4) will be described in a subsequent paper. 2. EXPERIMENTAL 2.1 Specimens and pretreatments Nine kinds of Al alloy disk specimens, 24 mm diameter and 3 mm thick, were supplied by Showa Denko Ltd., and the chemical compositions of the specimens are shown in Table 1. Specimen-10 was industrial pure Al, including small amounts of Fe and Si, and Specimens-13 and -15 were obtained by adding 1.0%Sn-1.0%Bi and 1.0%Sn to Specimen-10. Specimens-10, -13, and -15 were prepared by extrusion and machining. Specimen-20 was an Al-Cu alloy, including 5.0%Cu as well as small amounts of Fe and Si, and Specimens-23 and -25 were obtained by adding 1.0%Sn-1.0%Bi and 1.0%Sn to Specimen-20. Specimens-20, -23, and -25 were prepared by extrusion, heating at 763 K, drawing, aging at 433 K for 24 h, and machining. Specimen-60 was an Al-Mg-Si alloy, including 1.0%Mg and 0.6%Si as well as small amounts of Fe.
3
Specimens-63 and -65 were obtained by adding 1.0%Sn-1.0%Bi and 1.0%Sn to Specimen-60. Specimens-60, -63, and -65 were prepared by extrusion, heating at 799 K, aging at 453 K for 24 h, drawing, and machining. All the specimens supplied were mechanically polished with wet SiC papers of #600, 1000, 1500, and 4000. The mechanically polished specimens were degreased ultrasonically in a C2H5OH solution for 10 min, and then kept in a silica gel desiccator prior to the immersion experiments. The mass of the specimens after the pretreatments, W1, was between 3.3 and 3.7 g, depending on the extent of the mechanical polishing. 2.2 Immersion tests and rest potential measurements in alcohols The mechanically polished specimens were immersed in 20 cm3 of MEEE and BEEE at 399 - 415 K for up to ti = 24 h (ti: immersion time). The temperature of the MEEE and BEEE was controlled with a silicone oil bath (PS-1000, Tokyo Rika-kikai). In the immersion tests, the mass of the specimens was measured with an ultra microbalance (MX5, METTLER TOLEDO) before (W1) and after immersion (W2), and the ratio of mass change, ΔW (= W2 – W1), against W1 was calculated to evaluate the corrosion coefficient, ΔW /W1. The structural changes of the specimen surfaces were examined by digital camera observations, scanning electron microscopy (SEM, Miniscope TM-1000, Hitachi), and electron probe microanalysis (EPMA, JXA-8900M WD/ED, JEOL). In the examination of the vertical cross-sections, specimens were embedded in epoxy resin and polished mechanically to expose a smooth surface of the specimen cross-section. Time-variations in the rest potential of the specimens, E vs. ti (E: rest potential), were measured during immersion in 100 cm3 of MEEE at 415 K with stirring. The upper half of the specimens were covered with a silicone resin, and then set in the electrochemical cell with a reference electrode of Pt wire (99.98 wt%, diameter = 0.5 mm, Nilaco). The rest potential of the specimens was measured by a potentiometer (PS-14, Toho Technical Research) during immersion up to ti = 24 h. Immersion tests of Specimen-10 were also carried out in MEEE containing a) 0.01 – 0.1 M SnCl2, b) 0.1 M Sn(OC2H5)4, c) 0.1 M FeCl3, and d) 0.1 M CuCl2 to better understand the corrosion mechanisms of Al alloys in alcohols. 3. Results 3.1 Corrosion behavior of Al alloys in MEEE and BEEE Table 2 shows the mass changes, ΔW (= W2 – W1), and corrosion coefficients, ΔW/W1, on nine kinds of Al alloys immersed in MEEE and BEEE at 415 K for 24 h. Specimens-13 and -15 show large mass losses in MEEE, while only Specimen-15 shows large mass losses in BEEE. In the immersion of the specimens which showed large mass losses of ΔW/W1 = -0.26 to -0.37, gas evolution started on the surface of the specimens at about ti = 1 h, and the transparent MEEE and BEEE changed to a brownish color, becoming darker with ti. After immersion in BEEE, Specimens-13 and -23 show a slight mass gain rather than a mass loss, and Specimen-23 in MEEE shows a slight mass gain. The ΔW/W1 of Specimens-10, -20, -25, -60, -63, and -65 in BEEE and MEEE is very slight or close to zero after immersion for ti = 24 h, and no gas evolution or color changes were observed on these specimens. The surface appearance of Specimens-13 and -15 after immersion for 24 h in MEEE and Specimen-15 in BEEE was gray and uneven, showing evidence of severe corrosion. Specimen-13 after immersion for 24 h in BEEE showed a black and slightly uneven surface, while Specimens-10, -20, -23, -25, -60, -63, and -65, after immersion in both alcohols showed a shining surface similar to that before the immersion tests. Specimen-13 immersed in BEEE may be covered with a
4
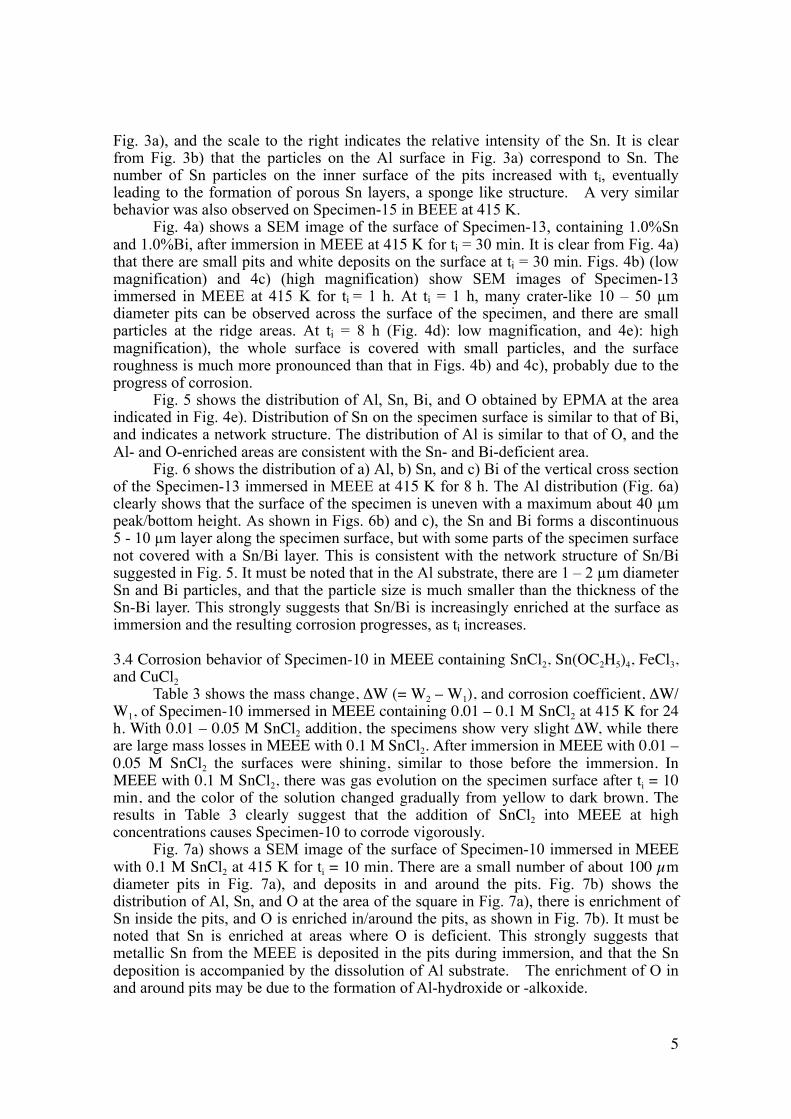
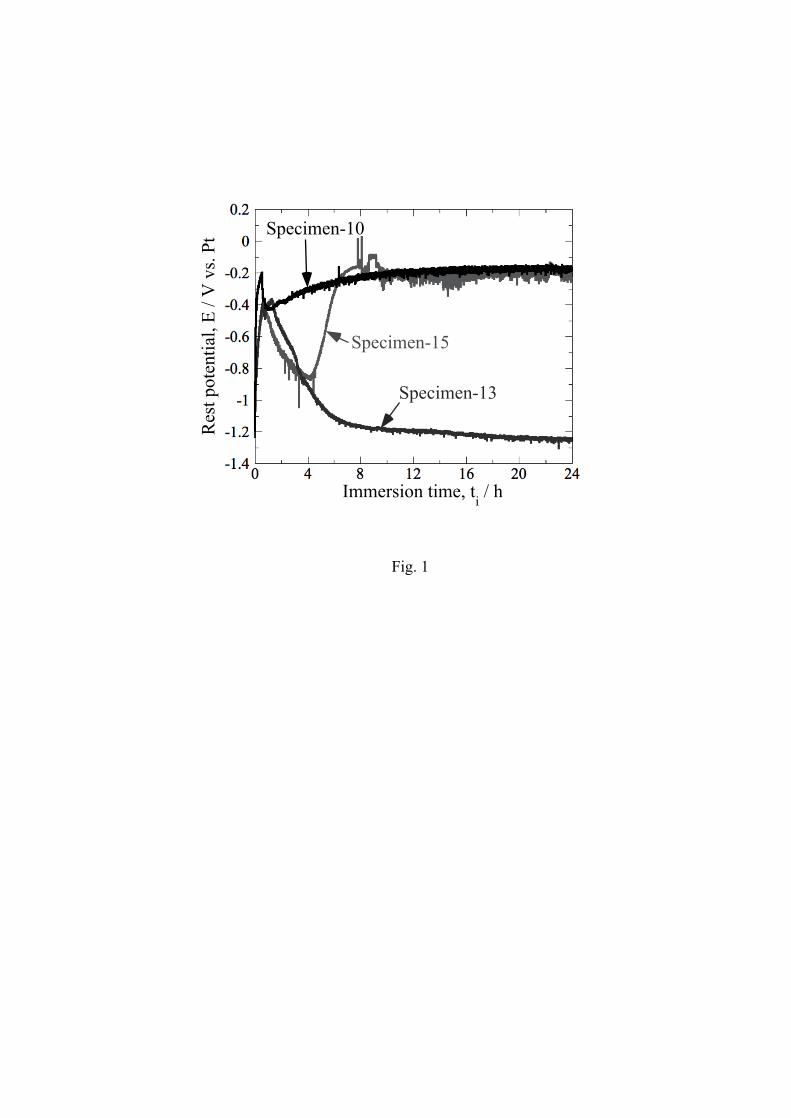
thin layer formed by a chemical reaction between the specimen and BEEE, as suggested by the small mass gain shown in Table 1. The appearance of Specimens-10, -20, -23, -25, -60, -63, and -65 after immersion in BEEE and MEEE was similar to that of the original surface, suggesting no corrosion. In the 24 h immersion tests in BEEE at 399 K, the surface of Specimens-13, -23, and -63 showed as black after the immersion and there was a slight mass gain of ΔW/W1 = 0.0001 – 0.0005, while other specimens showed no corrosion, with a very slight mass loss of ΔW/W1 < -0.0001 and the original surface structure remaining unchanged. After the 24 h immersion tests in MEEE at 408 K, Specimens-13 and -23 showed black surfaces and a ΔW/W1 = 0.0004 – 0.0006, while other specimens showed no corrosion. The results of the mass changes in the immersion tests at different temperatures in MEEE and BEEE suggest that there is a threshold in the corrosion of Al alloys around 415 K for less than ti = 24 h, and that the addition of Sn and Bi to pure Al enhances the corrosion. The addition of Sn and Bi to Al-Cu and Al-Mg-Si alloys does not influence the corrosion. It may be inferred that MEEE is more aggressive in corrosion of Al than BEEE, and that the color changes of the surfaces do not precede the corrosion. 3.2 Changes in the rest potential during immersion in MEEE Fig. 1 shows the time-variations in the rest potential, E, of Specimens-10, -13, and -15 during immersion in 100 cm3 of MEEE at 415 K with stirring. The E value of Specimen-10 gradually rises with immersion time, ti, to a steady value of -0.2 V (vs. Pt) at ti = 10 h. Specimen-10 after immersion for 24 h showed a shining surface, similar to that before the immersion test. The E of Specimen-13 rises with ti at the initial stage of immersion, and then drops with ti to reach a steady value of -1.2 to -1.3 V at ti = 8 h. Gas evolution was observed on Specimen-13 after ti = 1 h, and a large mass loss could be expected from the thinning of the specimen immersed for 24 h. The E of Specimen-15 rises and drops with ti at the initial stage, like with Specimen-13, and then rises to reach a steady value of -0.2 V at ti = 8 h. Severe corrosion of Specimen-15 was also suggested after 24 h immersion from the gas evolution and specimen thinning. The corrosion behavior of Specimens-10, -13, and -15 in MEEE at 415 K appears to be unaffected by the stirring (cf. 3.1). The time-variations in the rest potential of Specimens-10, -13, and -15 will be discussed in terms of the surface structure in the discussion section. 3.3 Changes in the surface structure of specimens during immersion in MEEE Fig. 2a) shows a SEM image of the surface of Specimen-15, containing 1.0%Sn, after mechanical polishing and degreasing. There is a slightly uneven surface, with many parallel grooves of a few µm width, formed by the mechanical polishing, and the depth of each groove was estimated to be less than 1 µm by depth profile measurements. The SEM images of the surface of Specimen-15 after immersion in MEEE at 415 K for ti = 50 min and 2 h are shown in Figs. 2b) and 2c). At ti = 50 min, there are a few scallop-shaped 20 – 150 µm diameter pits and the surface is uneven, due to local dissolution of the specimen in MEEE. At ti = 2 h, the whole surface of the specimen has scallop-shaped pits, which are separated by narrow ridges. A high magnification SEM image of the surface of Specimen-15 after immersion in MEEE at 415 K for ti = 2 h is shown in Fig. 3a). On the inner surface of the pits, there are small white 1 – 2 µm diameter particles. The Al substrate under the particles is hollow, concave, and this may be due to a preferential dissolution of Al substrate around the particles. Fig. 3b) shows the Sn distribution obtained by EPMA at the area shown in
5
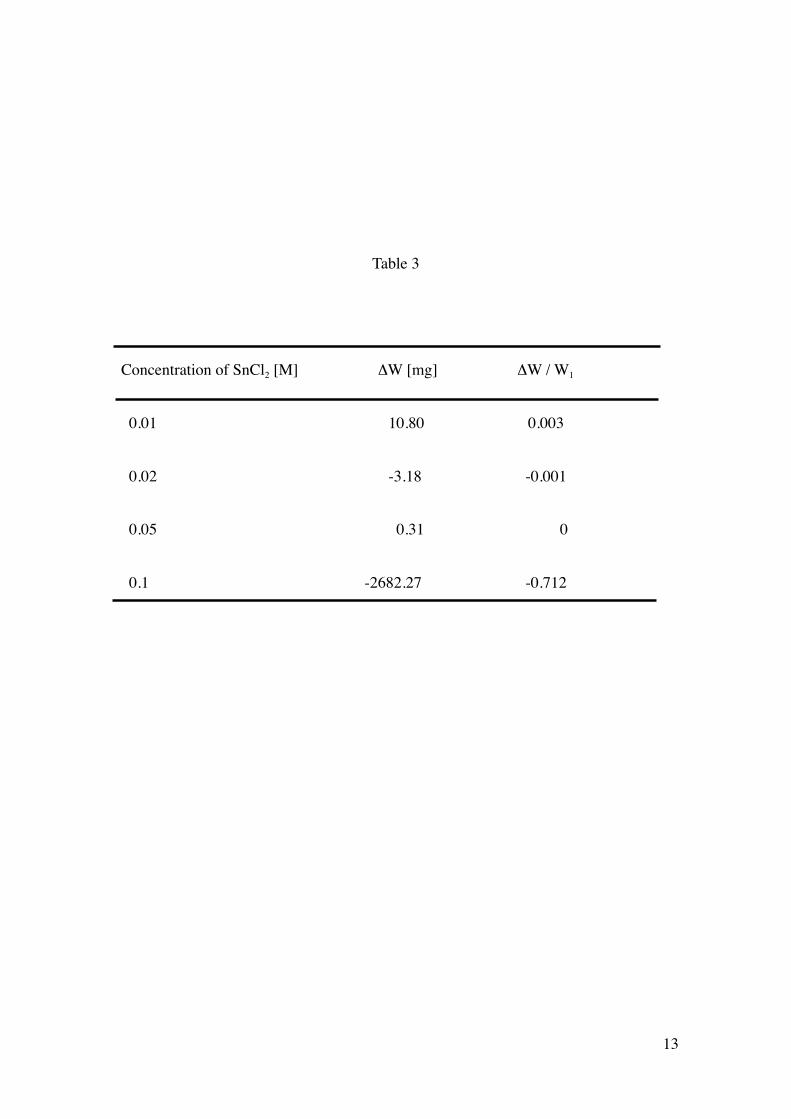
Fig. 3a), and the scale to the right indicates the relative intensity of the Sn. It is clear from Fig. 3b) that the particles on the Al surface in Fig. 3a) correspond to Sn. The number of Sn particles on the inner surface of the pits increased with ti, eventually leading to the formation of porous Sn layers, a sponge like structure. A very similar behavior was also observed on Specimen-15 in BEEE at 415 K. Fig. 4a) shows a SEM image of the surface of Specimen-13, containing 1.0%Sn and 1.0%Bi, after immersion in MEEE at 415 K for ti = 30 min. It is clear from Fig. 4a) that there are small pits and white deposits on the surface at ti = 30 min. Figs. 4b) (low magnification) and 4c) (high magnification) show SEM images of Specimen-13 immersed in MEEE at 415 K for ti = 1 h. At ti = 1 h, many crater-like 10 – 50 µm diameter pits can be observed across the surface of the specimen, and there are small particles at the ridge areas. At ti = 8 h (Fig. 4d): low magnification, and 4e): high magnification), the whole surface is covered with small particles, and the surface roughness is much more pronounced than that in Figs. 4b) and 4c), probably due to the progress of corrosion. Fig. 5 shows the distribution of Al, Sn, Bi, and O obtained by EPMA at the area indicated in Fig. 4e). Distribution of Sn on the specimen surface is similar to that of Bi, and indicates a network structure. The distribution of Al is similar to that of O, and the Al- and O-enriched areas are consistent with the Sn- and Bi-deficient area. Fig. 6 shows the distribution of a) Al, b) Sn, and c) Bi of the vertical cross section of the Specimen-13 immersed in MEEE at 415 K for 8 h. The Al distribution (Fig. 6a) clearly shows that the surface of the specimen is uneven with a maximum about 40 µm peak/bottom height. As shown in Figs. 6b) and c), the Sn and Bi forms a discontinuous 5 - 10 µm layer along the specimen surface, but with some parts of the specimen surface not covered with a Sn/Bi layer. This is consistent with the network structure of Sn/Bi suggested in Fig. 5. It must be noted that in the Al substrate, there are 1 – 2 µm diameter Sn and Bi particles, and that the particle size is much smaller than the thickness of the Sn-Bi layer. This strongly suggests that Sn/Bi is increasingly enriched at the surface as immersion and the resulting corrosion progresses, as ti increases. 3.4 Corrosion behavior of Specimen-10 in MEEE containing SnCl2, Sn(OC2H5)4, FeCl3, and CuCl2 Table 3 shows the mass change, ΔW (= W2 – W1), and corrosion coefficient, ΔW/ W1, of Specimen-10 immersed in MEEE containing 0.01 – 0.1 M SnCl2 at 415 K for 24 h. With 0.01 – 0.05 M SnCl2 addition, the specimens show very slight ΔW, while there are large mass losses in MEEE with 0.1 M SnCl2. After immersion in MEEE with 0.01 – 0.05 M SnCl2 the surfaces were shining, similar to those before the immersion. In MEEE with 0.1 M SnCl2, there was gas evolution on the specimen surface after ti = 10 min, and the color of the solution changed gradually from yellow to dark brown. The results in Table 3 clearly suggest that the addition of SnCl2 into MEEE at high concentrations causes Specimen-10 to corrode vigorously. Fig. 7a) shows a SEM image of the surface of Specimen-10 immersed in MEEE with 0.1 M SnCl2 at 415 K for ti = 10 min. There are a small number of about 100 µm diameter pits in Fig. 7a), and deposits in and around the pits. Fig. 7b) shows the distribution of Al, Sn, and O at the area of the square in Fig. 7a), there is enrichment of Sn inside the pits, and O is enriched in/around the pits, as shown in Fig. 7b). It must be noted that Sn is enriched at areas where O is deficient. This strongly suggests that metallic Sn from the MEEE is deposited in the pits during immersion, and that the Sn deposition is accompanied by the dissolution of Al substrate. The enrichment of O in and around pits may be due to the formation of Al-hydroxide or -alkoxide.

6
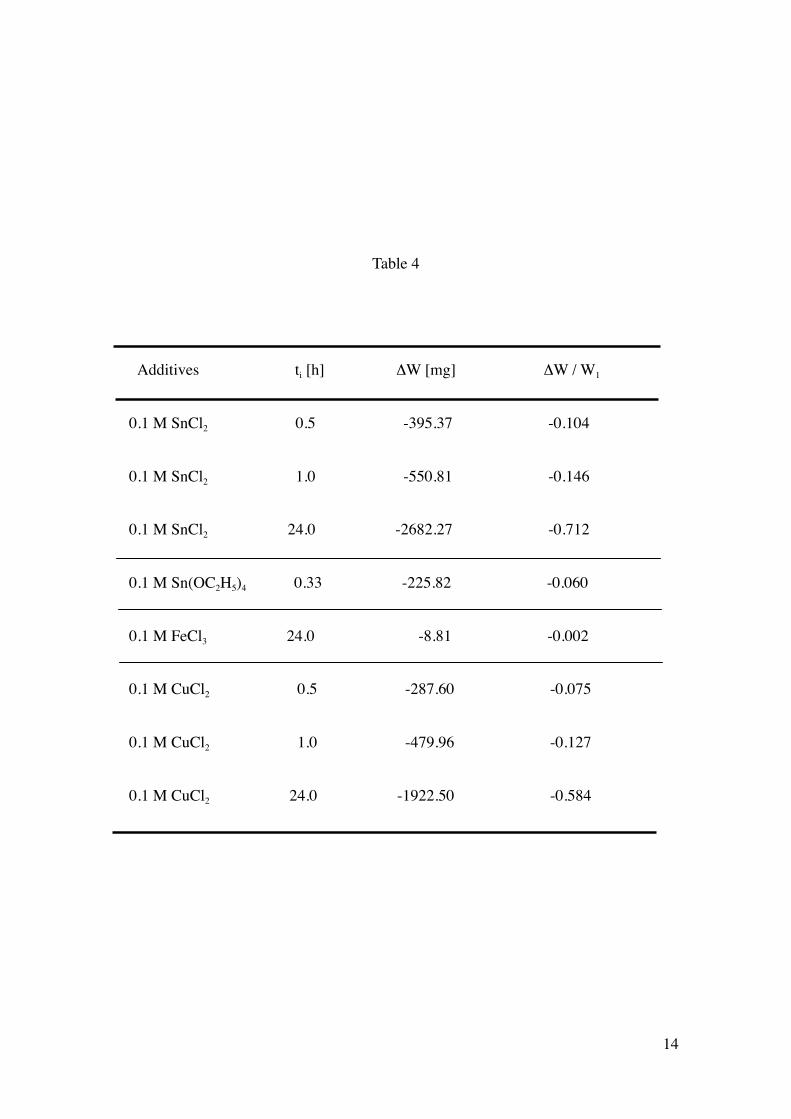
Fig. 8 shows a) SEM and b) EPMA images of the surface of Specimen-10 after immersion in MEEE containing 0.1 M SnCl2 at 415 K for 20 min. The size of the pits on the specimen surface is much larger than those of Fig. 7a), and the area occupied by pits is much larger than in Fig. 7a). Gray deposits with a sponge-like layer structure can also be observed on the pits, and it is clear from Fig. 8b) that these deposits are metallic Sn deposited from the solution phase. Table 4 shows the ΔW andΔW/W0 obtained after immersion of Specimen-10 in MEEE with 0.1 M SnCl2, Sn(OC2H5)4, FeCl3, and CuCl2 at 415 K for different periods. The results in Table 4 clearly suggest that the addition of 0.1 M SnCl2, Sn(OC2H5)4, and CuCl2 to MEEE enhances the corrosion of Specimen-10, while the addition of 0.1 M FeCl3 causes only a slight mass loss even after 24 h. The increase in corrosion by the addition of 0.1 M SnCl2, Sn(OC2H5)4, and CuCl2 appears even at the initial period of immersion, ti = 20 – 30 min. Fig. 9 shows SEM images of the surface of Specimen-10 immersed in MEEE containing 0.1 M Sn(OC2H5)4 at 415 K for a) 10 min and b) 20 min. The specimen corrodes vigorously like in MEEE with 0.1 M SnCl2, and EPMA clearly showed that metallic Sn was deposited on the pits formed by the corrosion. Fig. 10 shows a SEM image of a) the surface and b) a vertical cross-section of Specimen-10 immersed in MEEE with 0.1 M CuCl2 at 415 K for 30 min. The whole surface of the specimen is covered with a porous layer of Cu, and the surface is very uneven, showing larger than 100 µm peak/bottom height-differences. The SEM and EPMA images of Specimen-10 immersed in MEEE with 0.10 M-FeCl3 had a small number of shallow pits and 10 – 50 µm diameter Fe particles were observed on the surface. 4. Discussion 4.1 Formation of black film on Specimens-13 and -23 As described in 3.1, Specimens-13 and -23 were covered with a black film after immersion in MEEE and BEEE at 399 – 415 K for 24 h, and they showed slight mass gains, except for Specimen-13 in MEEE at 415 K which showed a considerable mass loss. To be able to discuss a formation mechanism for the black film, glow discharge optical emission spectroscopy (GDOES) was applied to Specimen-13 before and after immersion in MEEE at 408 K for 24 h. The specimen before immersion (Fig. 11a) shows steady values of Al, O, Sn, and Bi from about 20 s of sputtering time after the transient at the initial stage, suggesting a very thin oxide film containing small amounts of Sn and Bi on the specimen surface. After immersion for 24 h, it takes about 70 s of sputtering time for the Al, O, Sn, and Bi concentrations to reach steady values (Fig. 11b). Comparing Fig. 11b) with Fig. 11a), suggests that the surface film on the specimen is thicker after immersion, and Bi is enriched in the surface film. The x2,000 magnified SEM image of the vertical cross section of Specimen-13 after 24 h immersion at 408 K does not show evidence of such a film however. Therefore, it may be assumed that the black films formed on Specimens-13 and -23 are very thin and composed of Al-Bi oxide or Al-Bi alkoxide. 4.2 Corrosion mechanism of Al alloys in MEEE and BEEE The corrosion behavior of the mechanically polished Al alloys in MEEE and BEEE was described in section 3.1, and the main results were the following: 1) Pure Al (Specimen-10), Al-Cu alloy (Specimen-20), and Al-Mg-Si alloy (Specimen-60) do not corrode during immersion for 24 h in MEEE or BEEE at 399 – 415 K. 2) Alloying of Sn and Bi to pure Al (Specimens-13, and -15) enhances the corrosion in MEEE at 415 K strongly, while alloying of Sn and Bi to Al-Cu and Al-Mg-Si alloys (Specimens-23, -25,
7
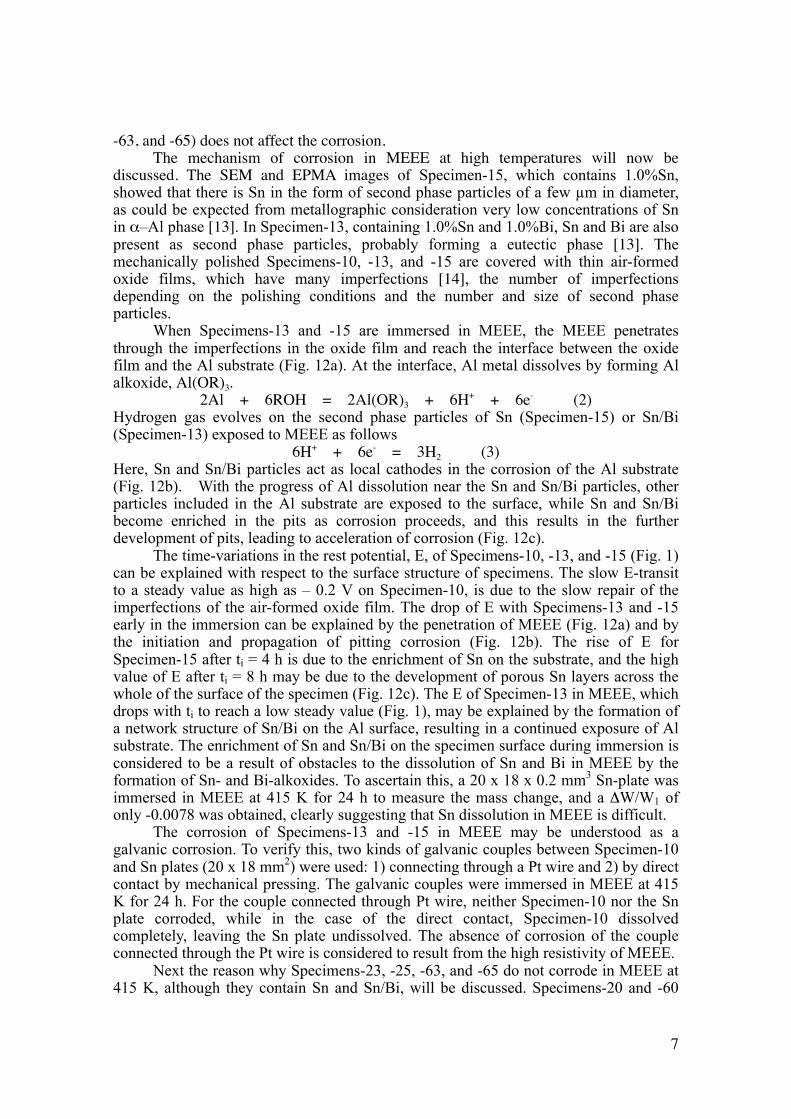
-63, and -65) does not affect the corrosion. The mechanism of corrosion in MEEE at high temperatures will now be discussed. The SEM and EPMA images of Specimen-15, which contains 1.0%Sn, showed that there is Sn in the form of second phase particles of a few µm in diameter, as could be expected from metallographic consideration very low concentrations of Sn in α–Al phase [13]. In Specimen-13, containing 1.0%Sn and 1.0%Bi, Sn and Bi are also present as second phase particles, probably forming a eutectic phase [13]. The mechanically polished Specimens-10, -13, and -15 are covered with thin air-formed oxide films, which have many imperfections [14], the number of imperfections depending on the polishing conditions and the number and size of second phase particles. When Specimens-13 and -15 are immersed in MEEE, the MEEE penetrates through the imperfections in the oxide film and reach the interface between the oxide film and the Al substrate (Fig. 12a). At the interface, Al metal dissolves by forming Al alkoxide, Al(OR)3.
2Al + 6ROH = 2Al(OR)3 + 6H+ + 6e- (2) Hydrogen gas evolves on the second phase particles of Sn (Specimen-15) or Sn/Bi (Specimen-13) exposed to MEEE as follows
6H+ + 6e- = 3H2 (3) Here, Sn and Sn/Bi particles act as local cathodes in the corrosion of the Al substrate (Fig. 12b). With the progress of Al dissolution near the Sn and Sn/Bi particles, other particles included in the Al substrate are exposed to the surface, while Sn and Sn/Bi become enriched in the pits as corrosion proceeds, and this results in the further development of pits, leading to acceleration of corrosion (Fig. 12c). The time-variations in the rest potential, E, of Specimens-10, -13, and -15 (Fig. 1) can be explained with respect to the surface structure of specimens. The slow E-transit to a steady value as high as – 0.2 V on Specimen-10, is due to the slow repair of the imperfections of the air-formed oxide film. The drop of E with Specimens-13 and -15 early in the immersion can be explained by the penetration of MEEE (Fig. 12a) and by the initiation and propagation of pitting corrosion (Fig. 12b). The rise of E for Specimen-15 after ti = 4 h is due to the enrichment of Sn on the substrate, and the high value of E after ti = 8 h may be due to the development of porous Sn layers across the whole of the surface of the specimen (Fig. 12c). The E of Specimen-13 in MEEE, which drops with ti to reach a low steady value (Fig. 1), may be explained by the formation of a network structure of Sn/Bi on the Al surface, resulting in a continued exposure of Al substrate. The enrichment of Sn and Sn/Bi on the specimen surface during immersion is considered to be a result of obstacles to the dissolution of Sn and Bi in MEEE by the formation of Sn- and Bi-alkoxides. To ascertain this, a 20 x 18 x 0.2 mm3 Sn-plate was immersed in MEEE at 415 K for 24 h to measure the mass change, and a ΔW/W1 of only -0.0078 was obtained, clearly suggesting that Sn dissolution in MEEE is difficult. The corrosion of Specimens-13 and -15 in MEEE may be understood as a galvanic corrosion. To verify this, two kinds of galvanic couples between Specimen-10 and Sn plates (20 x 18 mm2) were used: 1) connecting through a Pt wire and 2) by direct contact by mechanical pressing. The galvanic couples were immersed in MEEE at 415 K for 24 h. For the couple connected through Pt wire, neither Specimen-10 nor the Sn plate corroded, while in the case of the direct contact, Specimen-10 dissolved completely, leaving the Sn plate undissolved. The absence of corrosion of the couple connected through the Pt wire is considered to result from the high resistivity of MEEE. Next the reason why Specimens-23, -25, -63, and -65 do not corrode in MEEE at 415 K, although they contain Sn and Sn/Bi, will be discussed. Specimens-20 and -60

8
contain relatively large amounts of alloying elements: 5%Cu in Specimen-20 and 1.0%Mg-0.6%Si in Specimen-60, and the alloying elements are solutes in α-Al phase or as second phases of metals and metallic compounds like Al2Cu and Mg2Si. In the EPMA element-mapping of Specimen-25, Sn particles were located at a position very close to the Al2Cu particles and contained Cu, probably due to the formation of a solid solution and of metallic compounds like Sn2Cu [13]. The EPMA measurements of Specimen-65 showed that Sn particles are located at the same position as Mg, suggesting the formation of a solid solution or metallic compounds like Sn7Mg3 [13]. The formation of a solid solution and metallic compounds with the Sn and Cu or Mg can be considered to suppress the activity of Sn as a local cathode. 4.3 Effect of metal salt addition into MEEE on corrosion of Specimen-10 As described in section 3.4, metallic Sn was deposited on Specimen-10 after the immersion in MEEE solution containing SnCl2 and Sn(OC2H5)4 at 415 K, and corrosion proceeded with gas evolution during the immersion. Fig. 13 shows a schematic model of the corrosion of Specimen-10 in MEEE containing SnCl2 and Sn(OC2H5)4. Initially the specimen is covered with a thin air-formed oxide film, which has numerous imperfections, as described in section 4.2, and the Al substrate is exposed to MEEE at the bottom of the imperfections (Fig. 13a). The redox reactions in equations (4) and (5) are thermodynamically possible on the surface of the Al substrate due to differences in the redox potentials of Sn2+/Sn or Sn4+/Sn and Al3+/Al.
2Al + 3Sn2+ + 6ROH = 2Al(OR)3 + 3Sn + 6H+ (4) 4Al + 3Sn4+ + 12ROH = 4Al(OR)3 + 3Sn + 12H+ (5)
Hence, Sn is deposited at the imperfections in the oxide films (Fig. 10b), and the deposits act as a local cathode during the alkoxide reaction in MEEE (Eqs. (2) and (3)). With the progress of Al dissolution and with hydrogen gas evolution near the Sn deposits, a porous Sn layer is formed on the pits as immersion time lengthens, leading to an acceleration of the corrosion (Fig. 10c). The corrosion mechanism of Specimen-10 in MEEE with 0.1 M CuCl2 can be explained as similar to that in MEEE with 0.1 M SnCl2 or Sn(OC2H5)4, and involves the following equation rather than Eq. (4) or (5).
2Al + 3Cu2+ + 6ROH = 2Al(OR)3 + 3Cu + 6H+ (6) In the case of MEEE with 0.1 M FeCl3, only a small number of Fe particles are deposited and corrosion is slight (Table 4), maybe due to the weak electro-catalytic activity of Fe as a local cathode. It should be noted here that chloride ions are not the origin of the corrosion enhancement of Al in alcohols, although chloride ions easily cause pitting corrosion in aqueous solutions. This investigation established that free machining Al alloys containing Sn and Sn/Bi would corrode in the main components of brake-fluid when temperatures reach 415 K. Temperatures of brake fluids may only rarely rise to this value in the operation of brake systems in vehicles, but it does frequently rise to 403 K. The data obtained here is from immersion for only 24 h while operation of brake systems continues for years, still suggests that free machining Al alloys containing Sn and Sn/Bi should only be used with care in brake cylinders of vehicle. Suppression of the effects of alloying elements on the corrosion of Al alloys with Sn and Bi added should be further investigated. 5. Conclusions This investigation examined the corrosion of nine kinds of Al alloy in 2-(2-(2-methoxyethoxy)ethoxy)ethanol (MEEE) and 2-(2-(2-butoxyethoxy)ethoxy) ethanol (BEEE) at high temperatures, and the following conclusions may be drawn from

9
the investigation. 1) Addition of 1.0%Sn to pure Al causes severe corrosion in MEEE and BEEE at 415 K, while the addition of 1.0%Sn to Al-Cu and Al-Mg-Si alloys has no effect on corrosion. 2) Addition of 1.0%Sn-1.0%Bi to pure Al causes severe corrosion in MEEE at 415 K, but does not affect the corrosion in BEEE. Addition of Sn/Bi to Al-Cu and Al-Mg-Si alloys does not affect corrosion. 3) The increase in corrosion caused by adding Sn and Sn/Bi to pure Al is due to an enrichment of Sn and Sn/Bi at the alloy surface with the progress of corrosion. The enriched Sn and Sn/Bi act as local cathodes in galvanic corrosion, giving rise to an electro-catalytic effect. 4) Pure Al specimens corrode by immersion in MEEE containing 0.1 M SnCl2, Sn(OC2H5)4, and CuCl2 at 415 K, and the deposition of a Sn or Cu layer occurs on the specimen during immersion. Acknowledgements This work was financially supported by the Japan Aluminum Association. The authors express their appreciation to the members of the Working Group for Tin-containing Aluminum Alloys, for their work preceding this and for helpful discussion. The authors also thank Mr. Kazuhiko Minami (Showa Denko) for supplying the Al alloy rods. References [1] T. Tsuchida, Corros. Engr., 53 (2004) 44-49 [2] B. A. Abd-El-Nabey, N. Khalil, E. Khamis, Corr. Sci., 25 (1985) 225-232. [3] J. Zaharieva, M. Milanova. M. Mitov, L. Lutov, S. Manev, D. Todorovsky, J. Alloys Compd., 470 (2009) 397-403. [4] H. Z. Wang, D.Y.C. Leung, M. K. H. Leung, M. Nia, Renewable and Sustainable Energy Reviews, 13 (2009) 845-853 [5] J. M. Dasch, C. C. Ang, C. A. Wong, Y. T. Cheng, A. M. Weiner, L. C. Lev, E. Konca, Sur. Coat. Technol., 200 (2006) 2970-2977. [6] J. M. Dasch, C. C. Ang, C. A. Wong, R. A. Waldo, D. Chester, Y. T. Cheng, B. P. Powell, A. M. Weiner, E. Konca, J. Mater. Process Tech., 209 (2009) 4638-4644. [7] European Commission Statement, (2000) and (2002). [8] R. Shoji, K. Mori, Y. Shoji, H. Hatta, S. Yoshiwara, I. Iwai, N. Numata, and M. Asano, Abstract of 113th Biannual Meeting of Jpn. Inst. of Light Metals (2007) 199-200 [9] H. Hatta, Y. Shoji, Y. Kato, S. Yoshiwara, R. Shoji, K. Mori, I Iwai, K. Minami, Abstract of 113th Biannual Meeting of Jpn. Inst. of Light Metals, (2007) 201-202 [10] Y. Hara, T. Kikuchi, and H. Takahashi, Abstract of 113th Biannual Meeting of Jpn. Inst. of Light Metals, (2007) 203-204 [11] Y. Hara, T. Kikuchi, M. Sakairi, and H. Takahashi, Abstract of 114th Biannual Meeting of Jpn. Inst. of Light Metals, (2008) 103-104 [12] Y. Hara, T. Kikuchi, H. Takahashi, Abstract of 113th Biannual Meeting of Jpn. Inst. of Light Metals, (2008) 189-190 [13] T. Lyman, Metals Handbook (8th edition): metallography, structures and phase diagrams, American Science of Metals, Metals Park, Ohio, USA, 1973. [14] J. R. Davis, Corrosion of Aluminum and Aluminum Alloys, ASM international, Ohio, USA, 1999.
10
Captions Table 1 Chemical compositions of the Al alloys (mass%) in this investigation. Table 2 Mass change, ΔW (= W2 – W1), and corrosion coefficient, ΔW/W1, of mechanically polished Al alloys immersed in MEEE and BEEE at 415 K for 24 h. Table 3 Mass changes, ΔW (= W2 – W1), and corrosion coefficients, ΔW/W1, for Specimen-10 after immersion in MEEE containing 0.01 – 0.1 M SnCl2 at 415 K for 24 h. Table 4 ΔW andΔW/W0 for Specimen-10 after immersion in MEEE containing SnCl2, Sn(OC2H5)4, FeCl3, and CuCl2 at 415 K for different periods. Fig. 1 Changes in the rest potential, E, of Specimens-10, -13, and -15 with immersion time, ti, in MEEE at 415 K. The specimens were mechanically polished and decreased before the rest potential measurements. Fig. 2 SEM images of the surface of Specimen-15 after immersion in MEEE at 415 K for a) ti = 0 min, b) 50 min, and c) 2h. Fig. 3 a) High magnification SEM image and b) EPMA-determined Sn distribution at the surface of Specimen-15 after immersion in MEEE at 415 K for ti = 2 h. The scale to the right indicates the relative intensity of Sn. Fig. 4 SEM images of the surface of Specimen-13 after immersion in MEEE at 415 K for a) ti = 30 min, b) 1 h (low magnification), c) 1h (high mag.), d) 8 h (low mag.), and e) 8 h (high mag.). Fig. 5 EPMA-determined distributions of Al, Sn, Bi, and O on the surface of Specimen-13 after immersion in MEEE at 415 K for 8 h. Fig. 6 EPMA-determined distribution of Al, Sn, and Bi in a cross-section of Specimen-13 immersed in MEEE at 415 K for ti = 8 h. The lower right scale bars indicate the relative intensities of the Al, Sn, and Bi, respectively. Fig. 7 a) SEM image and b) EPMA-determined distribution of Al, O, and Sn of the surface of Specimen-10 after immersion in MEEE containing 0.1 M SnCl2 at 415 K for ti = 10 min. The lower right scale bars indicate the relative intensities of the Al, Sn, and O, respectively. Fig. 8 a) SEM image and b) EPMA-determined distribution of Al, O, and Sn in the surface of Specimen-10 after immersion in MEEE containing 0.1 M SnCl2 at 415 K for ti = 20 min. The lower right scale bars indicate the relative intensities of the Al, Sn, and O, respectively. Fig. 9 SEM images of the surface of Specimen-10 after immersion in MEEE containing 0.1 M Sn(OC2H5)4 at 415 K for a) ti = 10 min and b) 20 min. Fig. 10 SEM image of a) the surface and b) a vertical cross-section of Specimen-10 after immersion in MEEE with 0.1 M CuCl2 at 415 K for 30 min. Fig. 11 Depth profiles of Al, Sn, Bi, and O near the surface of Specimen-13, obtained by GDOES: a) before and b) after immersion in MEEE for 24 h at 408 K. Fig. 12 Schematic model illustrating the progress of corrosion of the mechanically polished Specimens-13 and -15 in MEEE at 415 K. Fig. 13 Schematic model illustrating the progress of corrosion of the mechanically polished Specimen-10 in MEEE containing SnCl2 and Sn(OC2H5)4 at 415 K.
11
Table 1
No. Sn Bi Cu Mg Si Fe Al
10 - - - - 0.1 0.3 bal.
13 1.0 1.0 - - 0.1 0.3 bal.
15 1.0 - - - 0.1 0.3 bal.
20 - - 5.0 - 0.2 0.3 bal.
23 1.0 1.0 5.0 - 0.2 0.3 bal.
25 1.0 - 5.0 - 0.2 0.3 bal.
60 - - 0.3 1.0 0.6 0.3 bal.
63 1.0 1.0 0.3 1.0 0.6 0.3 bal.
65 1.0 - 0.3 1.0 0.6 0.3 bal.

12
Table 2
MEEE BEEE
No. ΔW [mg] ΔW / W1 ΔW [mg] ΔW / W1
10 0.01 0 -0.02 0
13 -1237.57 -0.354 2.99 0.001
15 -1265.49 -0.371 -917.76 -0.262
20 0.02 0 -0.02 0
23 4.31 0.001 2.11 0.001
25 0.01 0 -0.04 0
60 0.03 0 -0.02 0
63 0.05 0 0.11 0
65 0.04 0 -0.04 0
13
Table 3
Concentration of SnCl2 [M] ΔW [mg] ΔW / W1
0.01 10.80 0.003
0.02 -3.18 -0.001
0.05 0.31 0
0.1 -2682.27 -0.712
14
Table 4
Additives ti [h] ΔW [mg] ΔW / W1
0.1 M SnCl2 0.5 -395.37 -0.104
0.1 M SnCl2 1.0 -550.81 -0.146
0.1 M SnCl2 24.0 -2682.27 -0.712
0.1 M Sn(OC2H5)4 0.33 -225.82 -0.060
0.1 M FeCl3 24.0 -8.81 -0.002
0.1 M CuCl2 0.5 -287.60 -0.075
0.1 M CuCl2 1.0 -479.96 -0.127
0.1 M CuCl2 24.0 -1922.50 -0.584
Immersion time, ti / h
Res
tpot
entia
l,E
/Vvs
.Pt
Specimen-13
Specimen-10
Specimen-15
Fig. 1

Fig. 2
a) ti = 0
b) ti = 50 min
c) ti = 2 h
100 µm
100 µm
100 µm
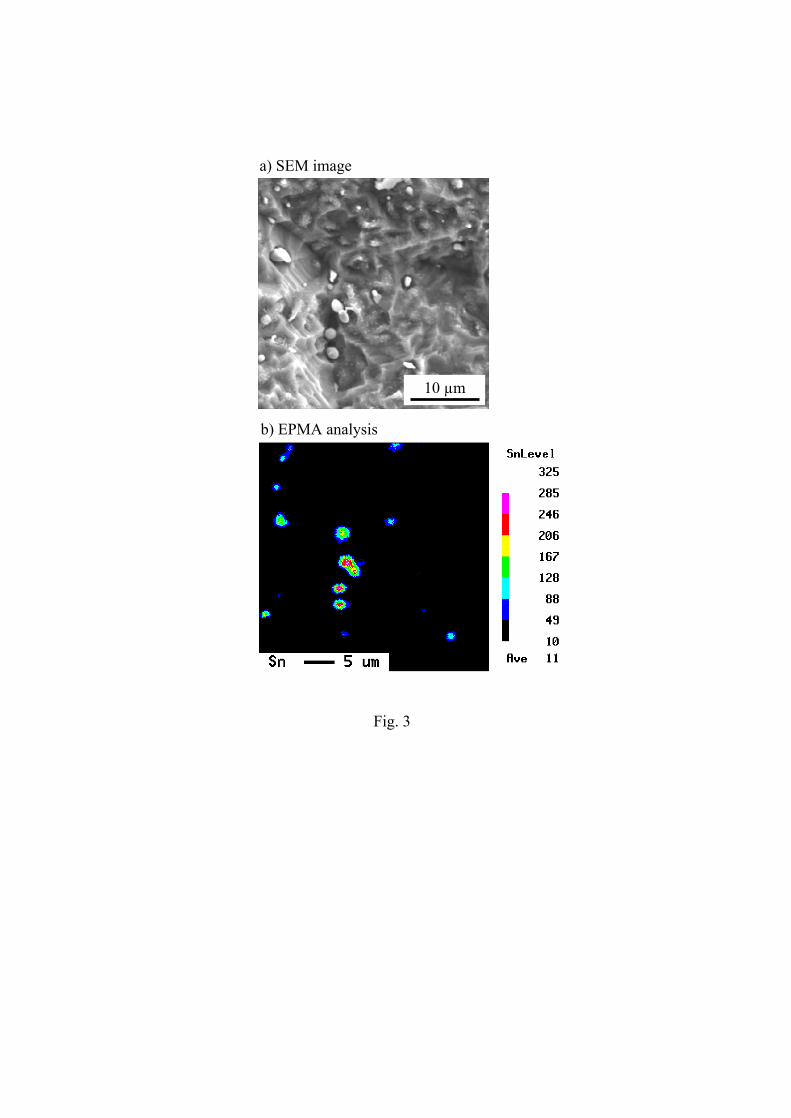
Fig. 3
a) SEM image
10 µm
b) EPMA analysis

Fig. 4
200 µm
200 µm
200 µm 20 µm
20 µm
a) ti = 30 min
b) ti = 1 h (low magnification) c) ti = 1 h (high magnification)
d) ti = 8 h (low magnification) e) ti = 8 h (high magnification)

Fig. 5
Al Sn
Bi O
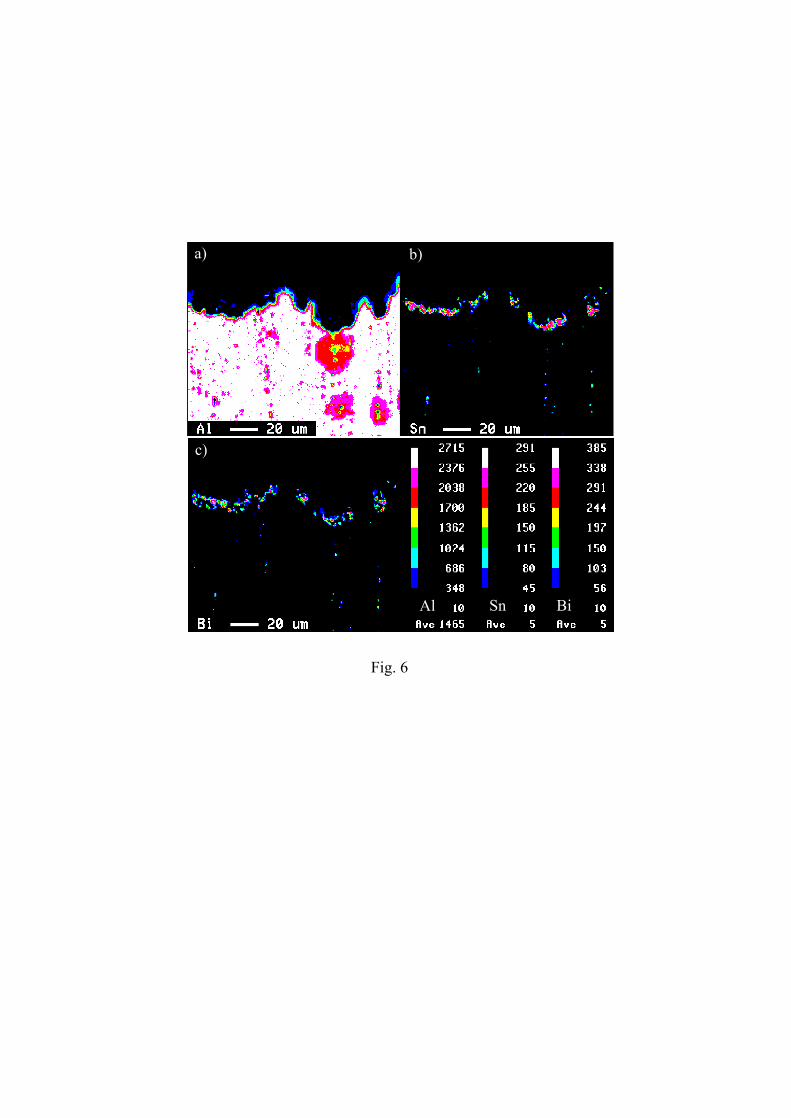
Fig. 6
a) b)
c)
Al Sn Bi

Fig. 7
a) SEM image
200 µm
b) EPMA image
Al Sn O

Fig. 8
a) SEM image
b) EPMA image
200 µm
Al Sn O
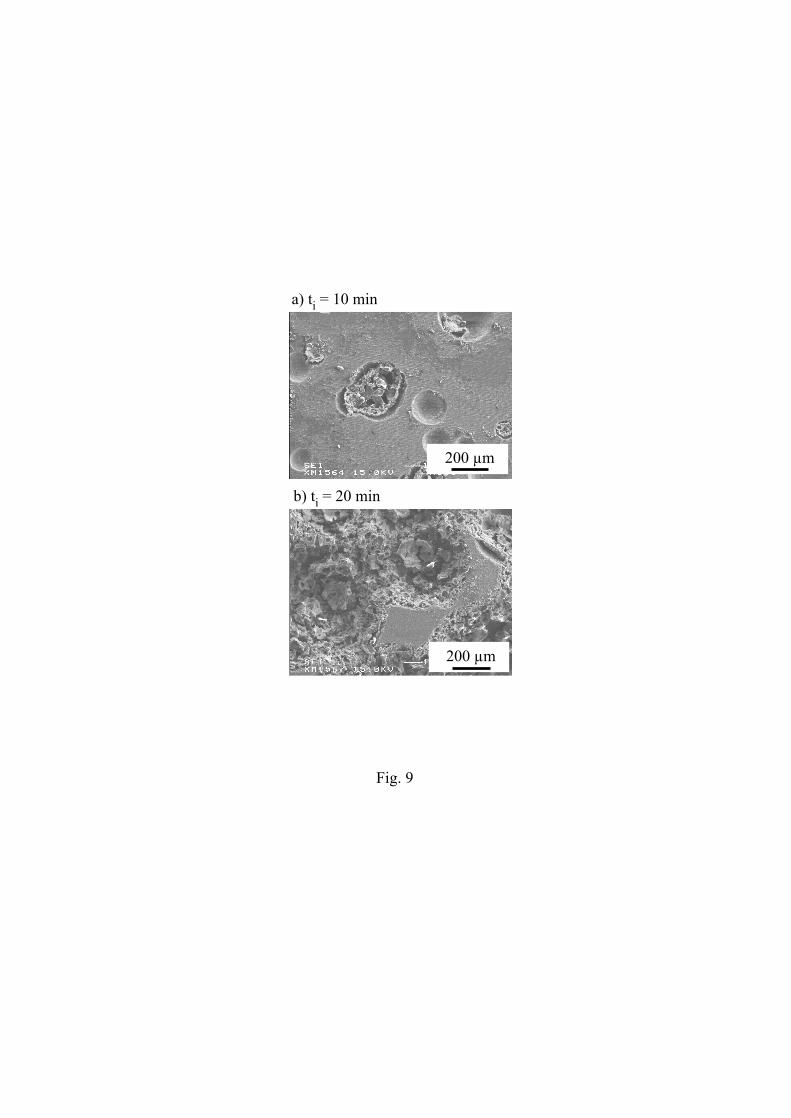
Fig. 9
200 µm
200 µm
a) ti = 10 min
b) ti = 20 min
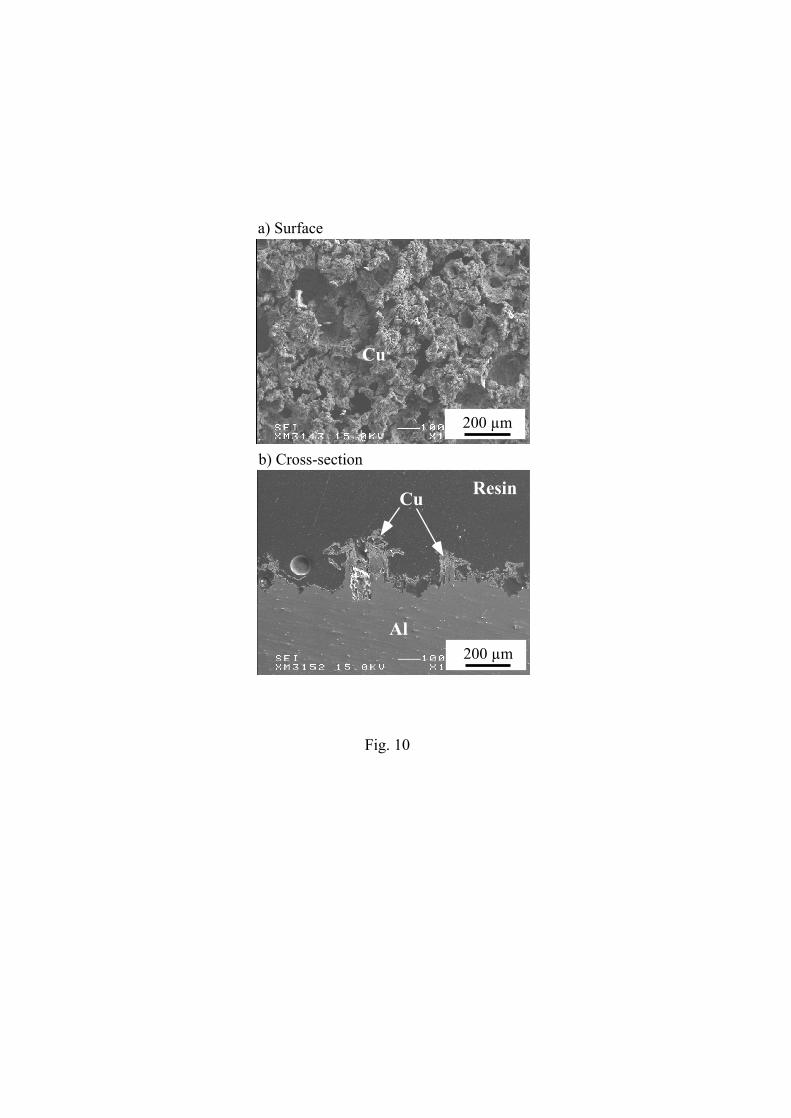
Fig. 10
a) Surface
b) Cross-section
200 µm
200 µm
Cu
Al
Cu Resin

Sputtering time / s
Inte
nsity
,E/a
.u.
Fig. 11
Sputtering time / s
Inte
nsity
,E/a
.u.
Al (/100)
O (x10) Bi Sn
Al (/100)O (x10)
Bi Sn
b) after immersion
a) before immersion

Fig. 12
a)Oxide film
Al substrate Sn/Bi
ROH ROH ROH
b)Al(OR)3Al(OR)3Al(OR)3
H2 H2 H2
c)Al(OR)3 + H2
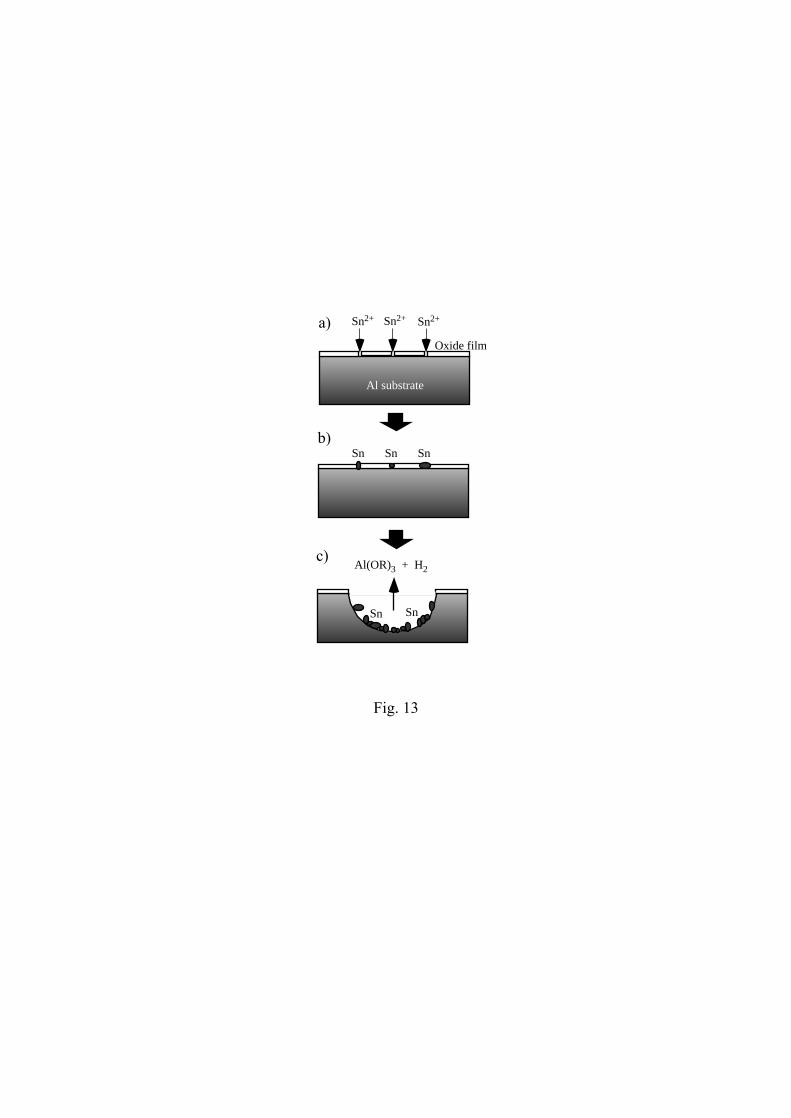
Fig. 13
a)Oxide film
Al substrate
Sn2+
b)
c)Al(OR)3 + H2
Sn2+ Sn2+
Sn Sn Sn
Sn Sn