corrosion and scaling in carbon steel casing and tubing and scaling in carbon steel casing and...
TRANSCRIPT

Corrosion and scaling in carbon
steel casing and tubingMarion Seiersten, Institute for Energy Technology

My background:
• Ensure safe use of C-steel, but use CRA when required
• Prediction models: Corrosion rate, risk of scaling, nucleation and
growth of solids
200 - 300°C
<150°C
10
00
-2
00
0 m
>300°C
Outline
Corrosion of carbon steel
• Fundamentals
• Modelling
• Inhibition
Scaling
• How corrosion my affect scaling
Geothermal and oil and gas synergies
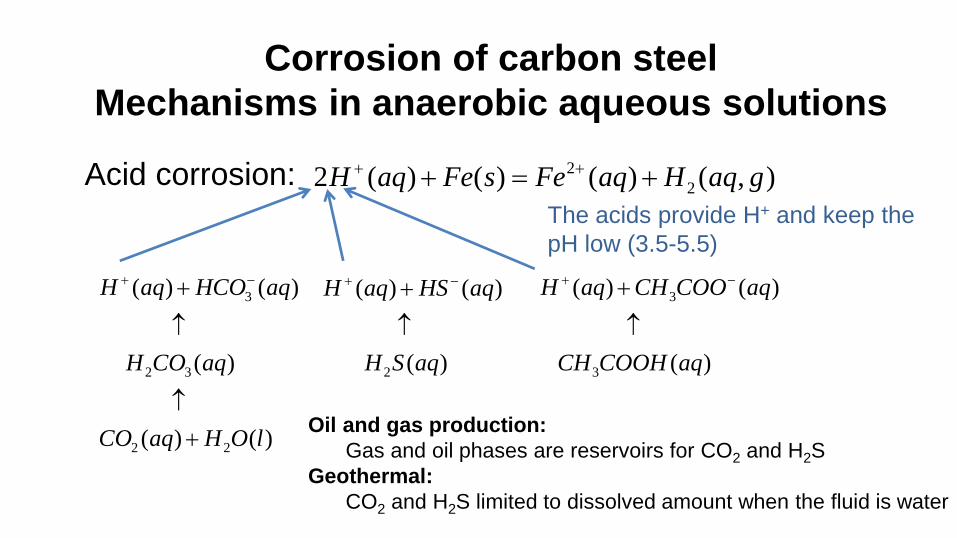
Corrosion of carbon steel
Mechanisms in anaerobic aqueous solutions
Acid corrosion: 2
22 ( ) ( ) ( ) ( , )H aq Fe s Fe aq H aq g
3
2 3
2 2
( ) ( )
( )
( ) ( )
H aq HCO aq
H CO aq
CO aq H O l
2
( ) ( )
( )
H aq HS aq
H S aq
3
3
( ) ( )
( )
H aq CH COO aq
CH COOH aq
The acids provide H+ and keep the
pH low (3.5-5.5)
Oil and gas production:
Gas and oil phases are reservoirs for CO2 and H2S
Geothermal:
CO2 and H2S limited to dissolved amount when the fluid is water

Corrosion prediction models
• Quite a number for CO2 corrosion
• Limited to temperature <150°C and
3.5<pH<6.5
• Most of them are OK on the primary
mechanism (H+ reduction with Fe
oxidation)
• The ability to predict secondary effects
varies
• Predicting H2S corrosion is a challenge
Secondary effects: Corrosion products on the
surface, steel quality, other effects of H2S than
contribution to pH buffering,
Norsok M-506 used on a
geothermal problemSeiersten and Nyborg, EUROCORR 2016,
Paper No. 67987
0.3
0.4
0.5
0.6
0.7
0.8
0.9
1.0
1.1
-1500 -1000 -500 0
Co
rro
sio
n r
ate
[m
m/y
]
Depth [m]
Estimated corrosion rate
High flow, high CO2 and Ca2+
Low flow, high CO2 and Ca2+
Low flow, low CO2 and Ca2+

Why is H2S corrosion less predictable than CO2 corrosion?
Solid corrosion products
• Can be protective if they
form a dense continuous
film
• Enhance localised corrosion
if the film is not dense
• There are a range of
sulphides, thermodynamics
not well known and kinetic
factors affect the formation
10 bar CO2, 10 bar H2S, 100 g/L
NaCl, 0.2 g/L NaHCO3, 14 days
Steel
110 °C
130 °C
Mackinawite
Fe(1+x)S +
Pyrrhotite
(Fe(1-x)S) /
troilite
(FeS)
Pyrrhotite/
troilite
Tjelta and
Kvarekvål,
EUROCORR
2016, Paper
No. 63777

H2S – Sulphide stress cracking (SSC)
Factors that affect the susceptibility
of metallic materials:
• Materials properties
• H2S partial pressure
• In situ pH
• Concentration of dissolved Cl- (or
other halide)
• Presence of elemental sulphur or
other oxidant
• Temperature
• Galvanic effects
• Mechanical stress
• Time of exposure

Inhibiting corrosion
Steel pipe wall
Polar head group
Hydrocarbon chain
Synergist
• Filmer: Organic molecules
with polar head group and
hydrocarbon chain
• Synergist
• Solvent
• Biodegradable
Inhibitor 1
Inhibitor 2
Baseline
0.1
1
10
100
80 °C100 °C
120 °C150 °C
Co
rro
sio
n r
ate
, mm
/y
Temperature
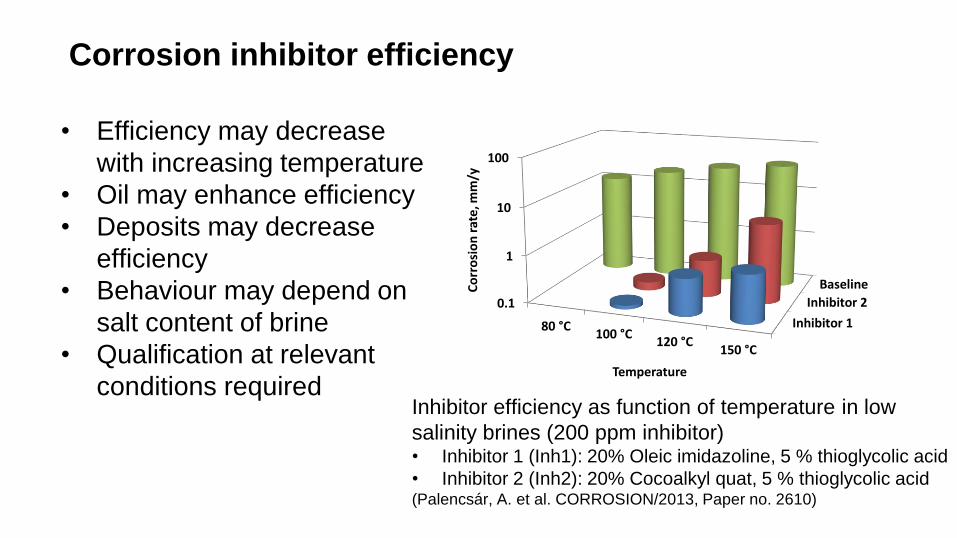
Corrosion inhibitor efficiency
Inhibitor efficiency as function of temperature in low
salinity brines (200 ppm inhibitor)• Inhibitor 1 (Inh1): 20% Oleic imidazoline, 5 % thioglycolic acid
• Inhibitor 2 (Inh2): 20% Cocoalkyl quat, 5 % thioglycolic acid(Palencsár, A. et al. CORROSION/2013, Paper no. 2610)
• Efficiency may decrease
with increasing temperature
• Oil may enhance efficiency
• Deposits may decrease
efficiency
• Behaviour may depend on
salt content of brine
• Qualification at relevant
conditions required
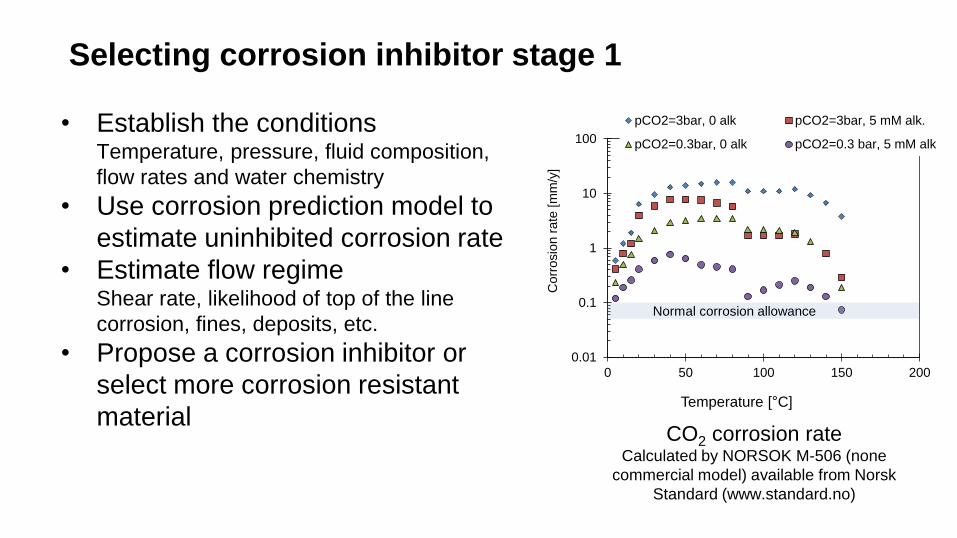
Selecting corrosion inhibitor stage 1
• Establish the conditions Temperature, pressure, fluid composition,
flow rates and water chemistry
• Use corrosion prediction model to
estimate uninhibited corrosion rate
• Estimate flow regime Shear rate, likelihood of top of the line
corrosion, fines, deposits, etc.
• Propose a corrosion inhibitor or
select more corrosion resistant
material
0.01
0.1
1
10
100
0 50 100 150 200
Co
rro
sio
n r
ate
[m
m/y
]
Temperature [ C]
Shear stress 5 PapCO2=3bar, 0 alk pCO2=3bar, 5 mM alk.
pCO2=0.3bar, 0 alk pCO2=0.3 bar, 5 mM alk
CO2 corrosion rate Calculated by NORSOK M-506 (none
commercial model) available from Norsk
Standard (www.standard.no)
Normal corrosion allowance

Selecting corrosion inhibitor (CI) stage 2
• Testing and qualification
• Define conditions – field
relevance vs. complexity
• Optimize CI concentration
• Determining inhibited corrosion
rate
• Based on uninhibited and inhibited
corrosion rate set inhibitor availability
and corrosion allowance
Measure corrosion rate
Bubble test

Selecting corrosion inhibitor (CI) stage 2
• Testing and qualification
• Define conditions – field
relevance vs. complexity
• Optimize CI concentration
• Determining inhibited corrosion
rate
• Based on uninhibited and inhibited
corrosion rate set inhibitor availability
and corrosion allowance
Measure corrosion rate
Autoclave testCorrosion loop

Effect of scale on corrosion
• Siderite (FeCO3) protects carbon
steel
• Require high HCO3- concentration to
form
• Proven to 150 °C, but above?
• Other scales as protective?
• Protective scale and scale inhibition?
• Scale and corrosion inhibition?
Steel
Cross-section pictured in SEM

Complex scaling
• Sulphate – chemistry and
temperature
• Carbonate –chemistry and pressure
(temperature)
• Silicate – chemistry and
temperature
• “Exotic” scale – sulphides, halite,
PbS, Pb,…
Scale and corrosion products retrieved
from geothermal well at Soultz- sur-
Foret (Cross-section pictured in SEM)
(Ba,Sr)SO4
Fe3O4
PbS +

Carbonate scale affected by corrosion
2
22 ( ) ( ) ( ) ( , )H aq Fe s Fe aq H aq g
3
2 3
2 2
( ) ( )
( )
( ) ( )
H aq HCO aq
H CO aq
CO aq H O l
pH
increase
Consumed by corrosion

Estimating CO2 corrosion rate and scaling in
geothermal wells
5.8
5.9
5.9
6.0
6.0
6.1
6.1
6.2
6.2
6.3
6.3
-1500 -1000 -500 0
pH
Depth [m]
pH
High flow, high CO2 and Ca2+
Low flow, high CO2 and Ca2+
Low flow, low CO2 and Ca2+
0.3
0.4
0.5
0.6
0.7
0.8
0.9
1.0
1.1
-1500 -1000 -500 0
Co
rro
sio
n r
ate
[m
m/y
]
Depth [m]
Corrosion
High flow, high CO2 and Ca2+
Low flow, high CO2 and Ca2+
Low flow, low CO2 and Ca2+
Corrosion pH Scale0.9
1.0
1.1
1.2
1.3
1.4
1.5
1.6
1.7
1.8
-1500 -1000 -500 0
SR
Depth [m]
CaCO3 saturation ratio
High flow, high CO2 and Ca2+
Low flow, high CO2 and Ca2+
Low flow, low CO2 and Ca2+
2 23
( )
Ca CO
SP
a aSR
K calcite

Some corrosion resistant alloys in brine with CO2 and H2S
Within in the blue and green areas: Corrosion rate ≤ 0.05 mm/y and no SSC or SCC
From Craig, B.D and Smith, L.:
Corrosion Resistant Alloys (CRAs) in the oil
and gas industry – selection guidelines
update, 3rd Edition, 2011

Monitoring corrosion and scale
• Produced water analysis
• Weight change coupons
• ER (Electrical Resistance)
probes
• FSM (Field Signature Method)
• Ultrasonic
• Radiography
• Electrochemical
measurements
• Calliper measurement –
intelligent pigging
• Tracer technology

Geothermal and oil and gas synergies in
corrosion and scaling – Modelling
• CO2 corrosion models have a proven record
within their limits
• Thermodynamic equilibrium models are able to
predict risk of scaling
• Challenges:
• Stochastic behaviour: Pitting corrosion,
nucleation and growth of solids
• High temperature
• Complex production fluids – high salt content
