corrosion 2001 final manuscript 2b
TRANSCRIPT
Performance of Commercial Alloys in Simulated Waste Incineration Environments
Brian A. Baker, Gaylord D. Smith and Lewis E. ShoemakerSpecial Metals Corporation
3200 Riverside DriveHuntington, WV 25705-1771
ABSTRACT
Commercial nickel-containing alloys have been exposed to simulated waste incineration conditions,comprising simulated flue gas and applied salt coatings, at 550° and 650°C using an inlet gas mixturecomprised of N2-10%O2-10%CO2-20%H2O-1500ppm HCl-300ppm SO2. Samples were tested at 550°and 650°C after application of salt mixtures to the sample surface. The first salt mixture contained 20%ZnCl2, 40.9% PbCl2, 21.9% KCl, and 17.2% NaCl by weight while the second mixture contained 4.7%ZnCl2, 9.7% PbCl2, 2% KCl, 2.6% NaCl, 6.1% K2SO4, 4.9% Na2SO4 and 70% Al2O3 by weight. Testingat 650° was conducted with and without application of the first salt mixture to the surface. Testing at550°C was conducted with application of each salt mixture, respectively. Corrosion performance hasbeen evaluated metallographically and related to alloy composition using multiple regression analysis.
INTRODUCTION
Utilization of waste incineration technology for disposal of municipal solid waste has become moreprevalent in many countries. In locations where population densities are high, the use of landfills forwaste disposal has become less feasible and waste incineration is a more attractive option. Anadditional advantage of incineration is the use of available heat for production of electricity. It is nowknown that chlorine-containing compounds are the primary corrosive species in waste incinerators,versus coal-fired boilers, where sulfur-containing compounds exacerbate corrosion.1 Continued use ofchlorinated plastic compounds and chloride salts such as NaCl by both industry and the general public
ensures the presence of appreciable HCl in the flue gas after combustion. The HCl in the flue gasbecomes incorporated into chloride salts via reaction with alkali sulfates and oxides as well as surfacesof waterwall and superheater tubing. For example, consider reaction of sodium oxide with HCl to formNaCl and water:
(1) Na2O + 2HCl = 2NaCl + H2O
Chlorides may then react with metal oxides and ultimately result in the release of chlorine2,3:
(2) 2NaCl + Cr2O3 + 2O2 = Na2Cr2O7 + Cl2
(3) NaCl + 1/2Fe2O3 + 1/4O2 = NaFeO2 + 1/2Cl2
The liberated chlorine can then begin a self-sustaining cycle in the presence of oxygen through reactionwith the metal surface, via the formation of and subsequent oxidation of, FeCl2 (or FeCl3 if HClpressures are sufficiently high):
(4) Fe + Cl2= FeCl2
(5) FeCl2 + 3/2O2 = Fe2O3 + 2Cl2
(6) 2FeCl2 + 2HCl + 1/2O2 = 2FeCl3 + 2H2O
(7) 2FeCl3 + 3/2O2 = Fe2O3 + 3Cl2
(8) 1/3Fe2O3 + 2HCl = 2/3 FeCl3 + H2O.
As shown in equation 8, FeCl3 can also possibly form through reaction of oxide scale with FeCl2.4 Whilesulfates are also present in waste incineration ash deposits, they are typically much lower inconcentration than chlorides and are not thought to play a primary role in the corrosion mechanismtaking place under the deposits. However, the presence of abundant SO2 in the flue gas could act toresult in conversion of chlorides to sulfates:
(8) 2NaCl + SO2 + 1/2O2 + H2O = Na2SO4+2HCl.
This could potentially slow ultimate corrosion rates if the SO2:HCl ratio in the flue gas is high enough.Krause's work has shown the effect of flue gas temperature and composition upon corrosion in wasteincinerators.5
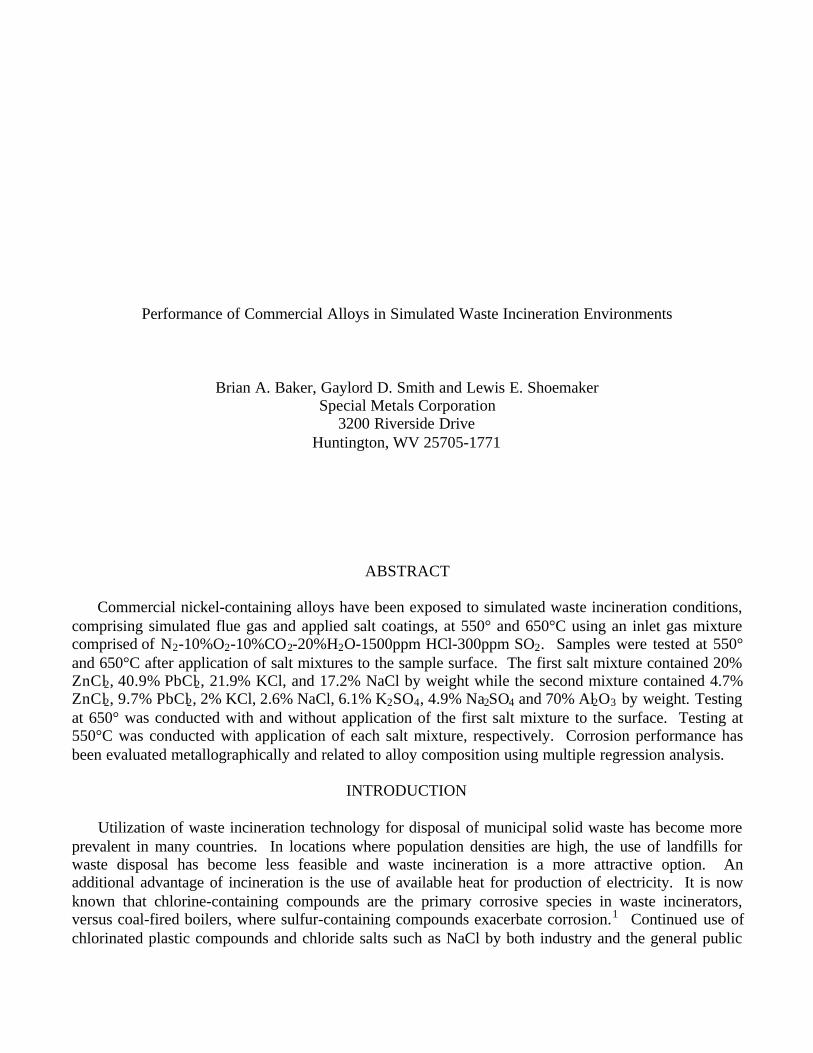
The common presence of heavy metals such as zinc and lead in the waste stream leads to theformation of low-melting and volatile chlorides. Table 1 shows melting and sublimation temperaturesfor metal chlorides and eutectics of metal chlorides as well as alkali sulfates. Figure 1 shows vaporpressure versus temperature for various metal chlorides. In addition to the composition of waste,increases in steam temperature in order to boost efficiency portend continued challenges for materialsused to combat corrosion in waste incinerators.8
In addition to gaseous chloridation attack, severe corrosion attack can result from salt depositswhich condense from the flue gas onto the metal surface. These deposits may be molten or partiallyfused, especially when heavy-metal chloride species are present, promoting dissolution of the metal
surface and dissolving protective oxides. Cathodic reduction of oxygen or steam would drive the anodicdissolution of the metal. Several electrochemical studies performed using chloride salt melts haveshown that additions of molybdenum can suppress the corrosion rate; in addition, such studies have alsoshown nickel additions were considered to be favorable due to formation of NiO which is less soluble ina basic chloride salt melt than oxides of chromium.9,10,11 Ishitsuka and Nose have recently shown thataddition of MoO3 to a synthetic waste incineration deposit has the effect of reducing the corrosion rateof 304 stainless steel partly by reducing the solubility of Cr2O3. Additions of tungsten or vanadium areexpected to exert the same effect.9 It would thus appear that alloying additions of nickel, chromium andmolybdenum/tungsten may act synergistically to suppress the corrosion rate.
EXPERIMENTAL
Testing was performed in a sealed electrically heated muffle furnace having a 100 mm diametermullite tube. To form the test gas mixtures, oxygen and nitrogen were passed through a constanttemperature water bath before the addition of CO2. The SO2 and HCl test gases, pre-mixed withnitrogen, were then added to the gas stream. All flow rates were measured using electronic mass flowcontrollers. The flow of the gas mixtures was 250 cc/min. The chemical composition of the alloystested is given in Table 2. Samples were taken from commercial plate and sheet and were exposed inthe as-produced annealed condition. Surfaces were ground to a 120 grit finish prior to testing forsamples obtained from thin sheet stock. Cylindrical samples were machined to a 32 micro-inch finish.Table 3 shows the inlet and predicted equilibrium percentages at 550°C and 650°C for the gas mixtureused. Samples were exposed in the flowing gas with and without application of one of two chlorideslurries. The compositions of the two mixtures are shown in Table 4. The slurry was prepared by firstgrinding the chloride salts into a fine powder using a mortar and pestle and then mixing with acetone.The slurry was then applied using a soft bristle brush. Mass gain resulting from application of thecoating averaged 40 mg/cm2. Samples painted with the slurry were cycled at one week intervals duringwhich loose scale was lightly removed mechanically and the slurry was re-applied. Samples werepushed into the hot zone of the furnace once the test atmosphere reached the desired temperature, usinga sealed mechanism. The test gases flowed through a nickel oxide catalyst before reaching the samplesto ensure equilibrium. Mass change results, measured and reported for samples exposed to simulatedflue gas only at 650°C, were obtained after mechanical removal of the friable scale. Samples wereprepared for depth of attack measurements by mounting in bakelite and polishing to a 0.05 µm aluminafinish. Metal loss and depth of attack measurements were performed at 6 locations for each sample.
RESULTS AND DISCUSSION
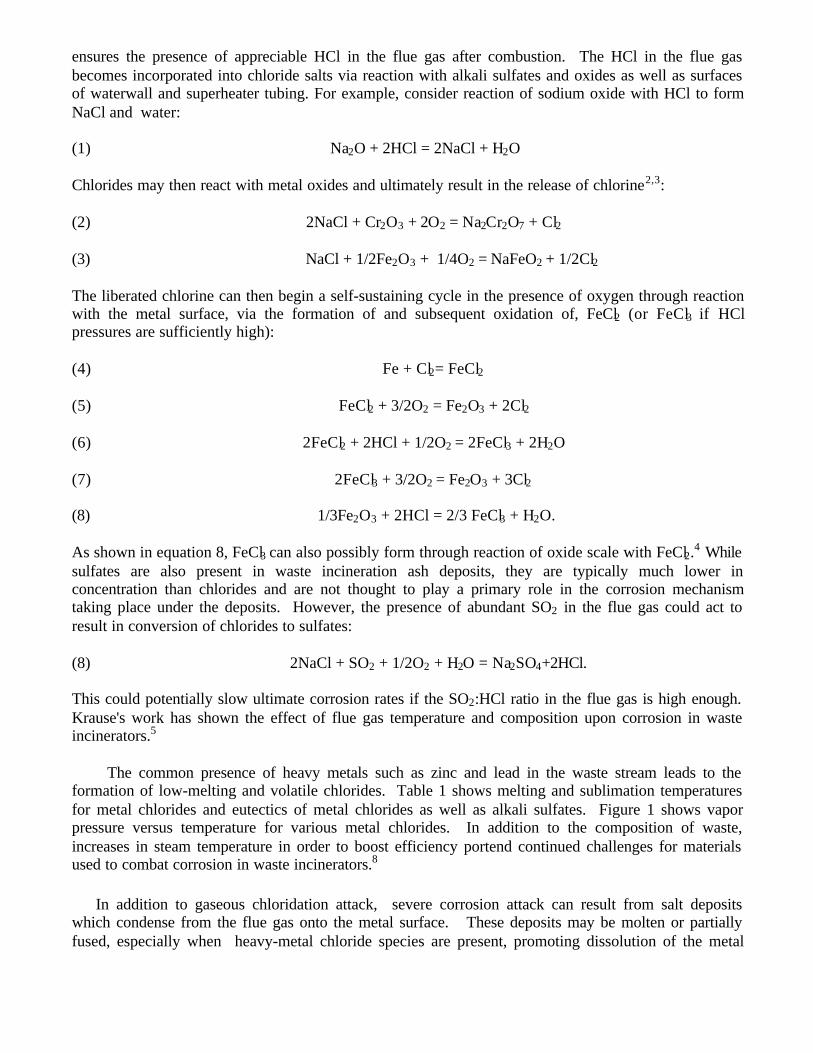
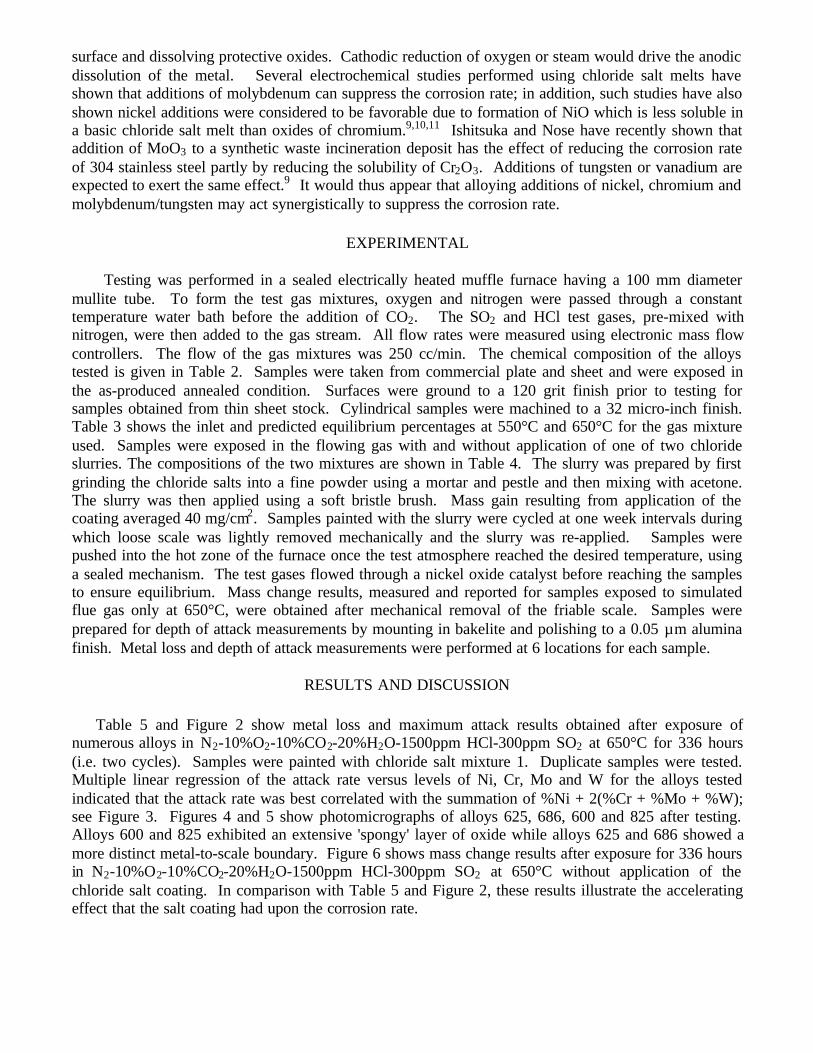
Table 5 and Figure 2 show metal loss and maximum attack results obtained after exposure ofnumerous alloys in N2-10%O2-10%CO2-20%H2O-1500ppm HCl-300ppm SO2 at 650°C for 336 hours(i.e. two cycles). Samples were painted with chloride salt mixture 1. Duplicate samples were tested.Multiple linear regression of the attack rate versus levels of Ni, Cr, Mo and W for the alloys testedindicated that the attack rate was best correlated with the summation of %Ni + 2(%Cr + %Mo + %W);see Figure 3. Figures 4 and 5 show photomicrographs of alloys 625, 686, 600 and 825 after testing.Alloys 600 and 825 exhibited an extensive 'spongy' layer of oxide while alloys 625 and 686 showed amore distinct metal-to-scale boundary. Figure 6 shows mass change results after exposure for 336 hoursin N2-10%O2-10%CO2-20%H2O-1500ppm HCl-300ppm SO2 at 650°C without application of thechloride salt coating. In comparison with Table 5 and Figure 2, these results illustrate the acceleratingeffect that the salt coating had upon the corrosion rate.
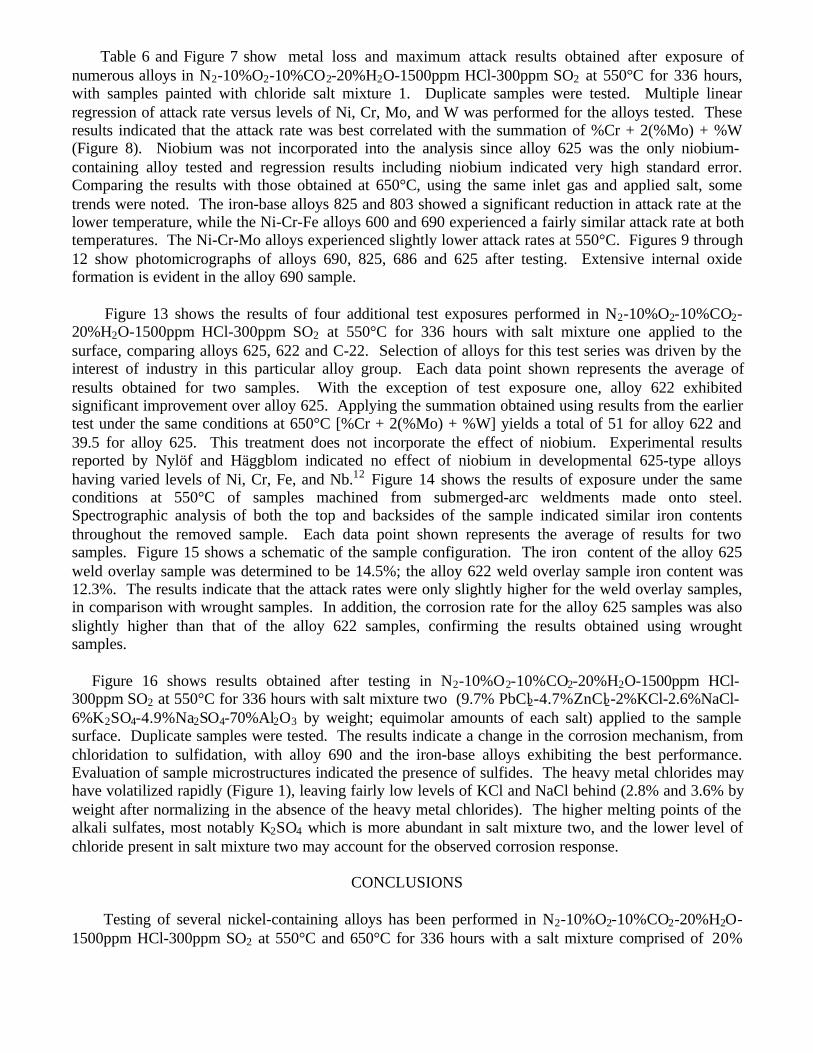
Table 6 and Figure 7 show metal loss and maximum attack results obtained after exposure ofnumerous alloys in N2-10%O2-10%CO2-20%H2O-1500ppm HCl-300ppm SO2 at 550°C for 336 hours,with samples painted with chloride salt mixture 1. Duplicate samples were tested. Multiple linearregression of attack rate versus levels of Ni, Cr, Mo, and W was performed for the alloys tested. Theseresults indicated that the attack rate was best correlated with the summation of %Cr + 2(%Mo) + %W(Figure 8). Niobium was not incorporated into the analysis since alloy 625 was the only niobium-containing alloy tested and regression results including niobium indicated very high standard error.Comparing the results with those obtained at 650°C, using the same inlet gas and applied salt, sometrends were noted. The iron-base alloys 825 and 803 showed a significant reduction in attack rate at thelower temperature, while the Ni-Cr-Fe alloys 600 and 690 experienced a fairly similar attack rate at bothtemperatures. The Ni-Cr-Mo alloys experienced slightly lower attack rates at 550°C. Figures 9 through12 show photomicrographs of alloys 690, 825, 686 and 625 after testing. Extensive internal oxideformation is evident in the alloy 690 sample.
Figure 13 shows the results of four additional test exposures performed in N2-10%O2-10%CO2-20%H2O-1500ppm HCl-300ppm SO2 at 550°C for 336 hours with salt mixture one applied to thesurface, comparing alloys 625, 622 and C-22. Selection of alloys for this test series was driven by theinterest of industry in this particular alloy group. Each data point shown represents the average ofresults obtained for two samples. With the exception of test exposure one, alloy 622 exhibitedsignificant improvement over alloy 625. Applying the summation obtained using results from the earliertest under the same conditions at 650°C [%Cr + 2(%Mo) + %W] yields a total of 51 for alloy 622 and39.5 for alloy 625. This treatment does not incorporate the effect of niobium. Experimental resultsreported by Nylöf and Häggblom indicated no effect of niobium in developmental 625-type alloyshaving varied levels of Ni, Cr, Fe, and Nb.12 Figure 14 shows the results of exposure under the sameconditions at 550°C of samples machined from submerged-arc weldments made onto steel.Spectrographic analysis of both the top and backsides of the sample indicated similar iron contentsthroughout the removed sample. Each data point shown represents the average of results for twosamples. Figure 15 shows a schematic of the sample configuration. The iron content of the alloy 625weld overlay sample was determined to be 14.5%; the alloy 622 weld overlay sample iron content was12.3%. The results indicate that the attack rates were only slightly higher for the weld overlay samples,in comparison with wrought samples. In addition, the corrosion rate for the alloy 625 samples was alsoslightly higher than that of the alloy 622 samples, confirming the results obtained using wroughtsamples.
Figure 16 shows results obtained after testing in N2-10%O2-10%CO2-20%H2O-1500ppm HCl-300ppm SO2 at 550°C for 336 hours with salt mixture two (9.7% PbCl2-4.7%ZnCl2-2%KCl-2.6%NaCl-6%K2SO4-4.9%Na2SO4-70%Al2O3 by weight; equimolar amounts of each salt) applied to the samplesurface. Duplicate samples were tested. The results indicate a change in the corrosion mechanism, fromchloridation to sulfidation, with alloy 690 and the iron-base alloys exhibiting the best performance.Evaluation of sample microstructures indicated the presence of sulfides. The heavy metal chlorides mayhave volatilized rapidly (Figure 1), leaving fairly low levels of KCl and NaCl behind (2.8% and 3.6% byweight after normalizing in the absence of the heavy metal chlorides). The higher melting points of thealkali sulfates, most notably K2SO4 which is more abundant in salt mixture two, and the lower level ofchloride present in salt mixture two may account for the observed corrosion response.
CONCLUSIONS
Testing of several nickel-containing alloys has been performed in N2-10%O2-10%CO2-20%H2O-1500ppm HCl-300ppm SO2 at 550°C and 650°C for 336 hours with a salt mixture comprised of 20%
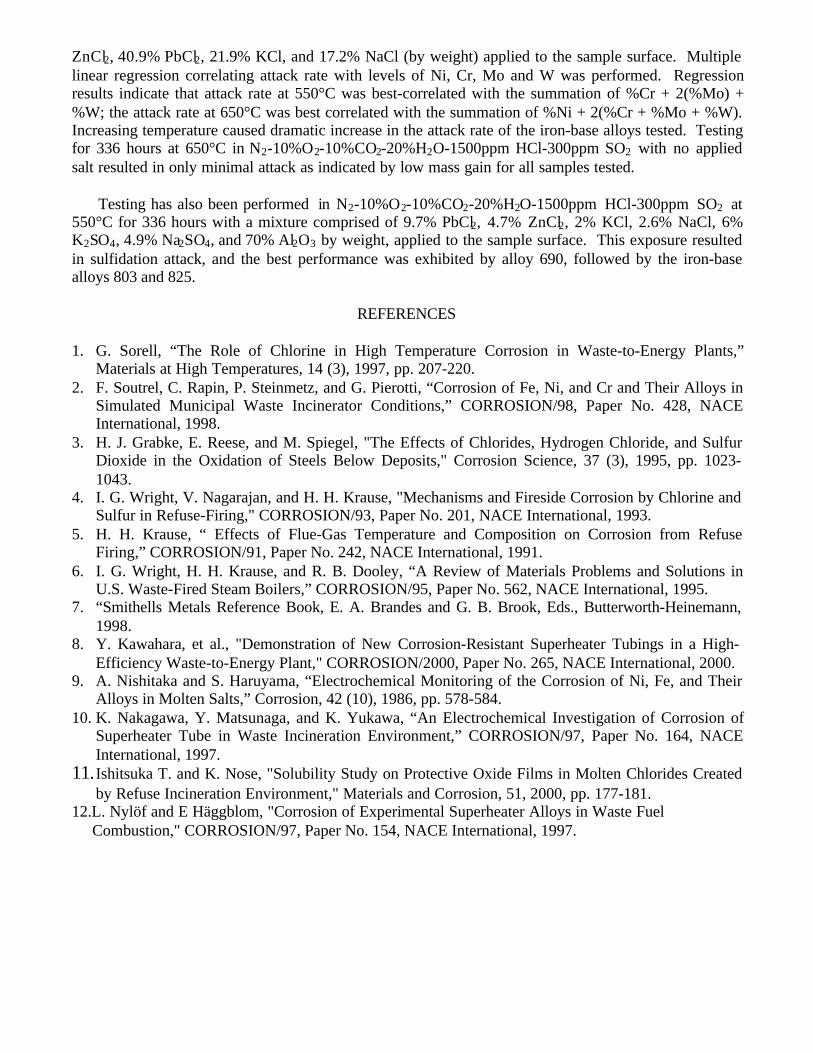
ZnCl2, 40.9% PbCl2, 21.9% KCl, and 17.2% NaCl (by weight) applied to the sample surface. Multiplelinear regression correlating attack rate with levels of Ni, Cr, Mo and W was performed. Regressionresults indicate that attack rate at 550°C was best-correlated with the summation of %Cr + 2(%Mo) +%W; the attack rate at 650°C was best correlated with the summation of %Ni + 2(%Cr + %Mo + %W).Increasing temperature caused dramatic increase in the attack rate of the iron-base alloys tested. Testingfor 336 hours at 650°C in N2-10%O2-10%CO2-20%H2O-1500ppm HCl-300ppm SO2 with no appliedsalt resulted in only minimal attack as indicated by low mass gain for all samples tested.
Testing has also been performed in N2-10%O2-10%CO2-20%H2O-1500ppm HCl-300ppm SO2 at550°C for 336 hours with a mixture comprised of 9.7% PbCl2, 4.7% ZnCl2, 2% KCl, 2.6% NaCl, 6%K2SO4, 4.9% Na2SO4, and 70% Al2O3 by weight, applied to the sample surface. This exposure resultedin sulfidation attack, and the best performance was exhibited by alloy 690, followed by the iron-basealloys 803 and 825.
REFERENCES
1. G. Sorell, “The Role of Chlorine in High Temperature Corrosion in Waste-to-Energy Plants,”Materials at High Temperatures, 14 (3), 1997, pp. 207-220.
2. F. Soutrel, C. Rapin, P. Steinmetz, and G. Pierotti, “Corrosion of Fe, Ni, and Cr and Their Alloys inSimulated Municipal Waste Incinerator Conditions,” CORROSION/98, Paper No. 428, NACEInternational, 1998.
3. H. J. Grabke, E. Reese, and M. Spiegel, "The Effects of Chlorides, Hydrogen Chloride, and SulfurDioxide in the Oxidation of Steels Below Deposits," Corrosion Science, 37 (3), 1995, pp. 1023-1043.
4. I. G. Wright, V. Nagarajan, and H. H. Krause, "Mechanisms and Fireside Corrosion by Chlorine andSulfur in Refuse-Firing," CORROSION/93, Paper No. 201, NACE International, 1993.
5. H. H. Krause, “ Effects of Flue-Gas Temperature and Composition on Corrosion from RefuseFiring,” CORROSION/91, Paper No. 242, NACE International, 1991.
6. I. G. Wright, H. H. Krause, and R. B. Dooley, “A Review of Materials Problems and Solutions inU.S. Waste-Fired Steam Boilers,” CORROSION/95, Paper No. 562, NACE International, 1995.
7. “Smithells Metals Reference Book, E. A. Brandes and G. B. Brook, Eds., Butterworth-Heinemann,1998.
8. Y. Kawahara, et al., "Demonstration of New Corrosion-Resistant Superheater Tubings in a High-Efficiency Waste-to-Energy Plant," CORROSION/2000, Paper No. 265, NACE International, 2000.
9. A. Nishitaka and S. Haruyama, “Electrochemical Monitoring of the Corrosion of Ni, Fe, and TheirAlloys in Molten Salts,” Corrosion, 42 (10), 1986, pp. 578-584.
10. K. Nakagawa, Y. Matsunaga, and K. Yukawa, “An Electrochemical Investigation of Corrosion ofSuperheater Tube in Waste Incineration Environment,” CORROSION/97, Paper No. 164, NACEInternational, 1997.
11. Ishitsuka T. and K. Nose, "Solubility Study on Protective Oxide Films in Molten Chlorides Createdby Refuse Incineration Environment," Materials and Corrosion, 51, 2000, pp. 177-181.
12.L. Nylöf and E Häggblom, "Corrosion of Experimental Superheater Alloys in Waste Fuel Combustion," CORROSION/97, Paper No. 154, NACE International, 1997.
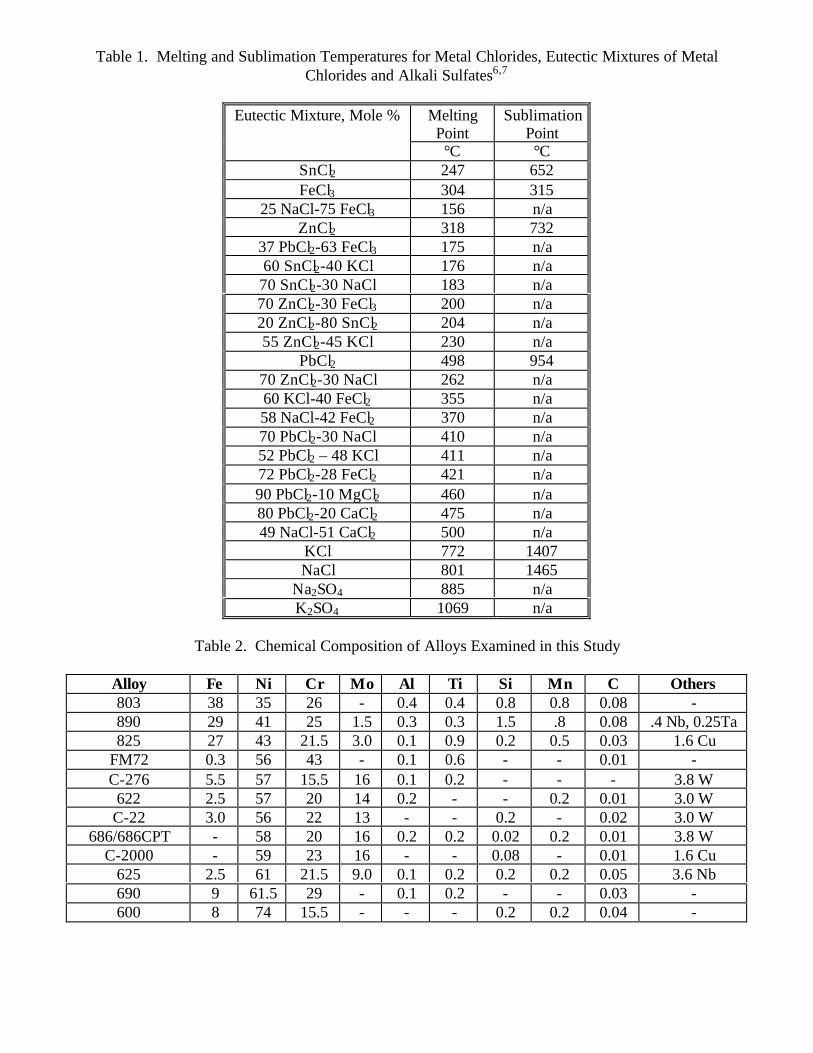
Table 1. Melting and Sublimation Temperatures for Metal Chlorides, Eutectic Mixtures of MetalChlorides and Alkali Sulfates6,7
MeltingPoint
SublimationPoint
Eutectic Mixture, Mole %
°C °CSnCl2 247 652FeCl3 304 315
25 NaCl-75 FeCl3 156 n/aZnCl2 318 732
37 PbCl2-63 FeCl3 175 n/a60 SnCl2-40 KCl 176 n/a70 SnCl2-30 NaCl 183 n/a70 ZnCl2-30 FeCl3 200 n/a20 ZnCl2-80 SnCl2 204 n/a55 ZnCl2-45 KCl 230 n/a
PbCl2 498 95470 ZnCl2-30 NaCl 262 n/a60 KCl-40 FeCl2 355 n/a58 NaCl-42 FeCl2 370 n/a70 PbCl2-30 NaCl 410 n/a52 PbCl2 – 48 KCl 411 n/a72 PbCl2-28 FeCl2 421 n/a90 PbCl2-10 MgCl2 460 n/a80 PbCl2-20 CaCl2 475 n/a49 NaCl-51 CaCl2 500 n/a
KCl 772 1407NaCl 801 1465
Na2SO4 885 n/aK2SO4 1069 n/a
Table 2. Chemical Composition of Alloys Examined in this Study
Alloy Fe Ni Cr Mo Al Ti Si Mn C Others803 38 35 26 - 0.4 0.4 0.8 0.8 0.08 -890 29 41 25 1.5 0.3 0.3 1.5 .8 0.08 .4 Nb, 0.25Ta825 27 43 21.5 3.0 0.1 0.9 0.2 0.5 0.03 1.6 Cu
FM72 0.3 56 43 - 0.1 0.6 - - 0.01 -C-276 5.5 57 15.5 16 0.1 0.2 - - - 3.8 W622 2.5 57 20 14 0.2 - - 0.2 0.01 3.0 WC-22 3.0 56 22 13 - - 0.2 - 0.02 3.0 W
686/686CPT - 58 20 16 0.2 0.2 0.02 0.2 0.01 3.8 WC-2000 - 59 23 16 - - 0.08 - 0.01 1.6 Cu
625 2.5 61 21.5 9.0 0.1 0.2 0.2 0.2 0.05 3.6 Nb690 9 61.5 29 - 0.1 0.2 - - 0.03 -600 8 74 15.5 - - - 0.2 0.2 0.04 -
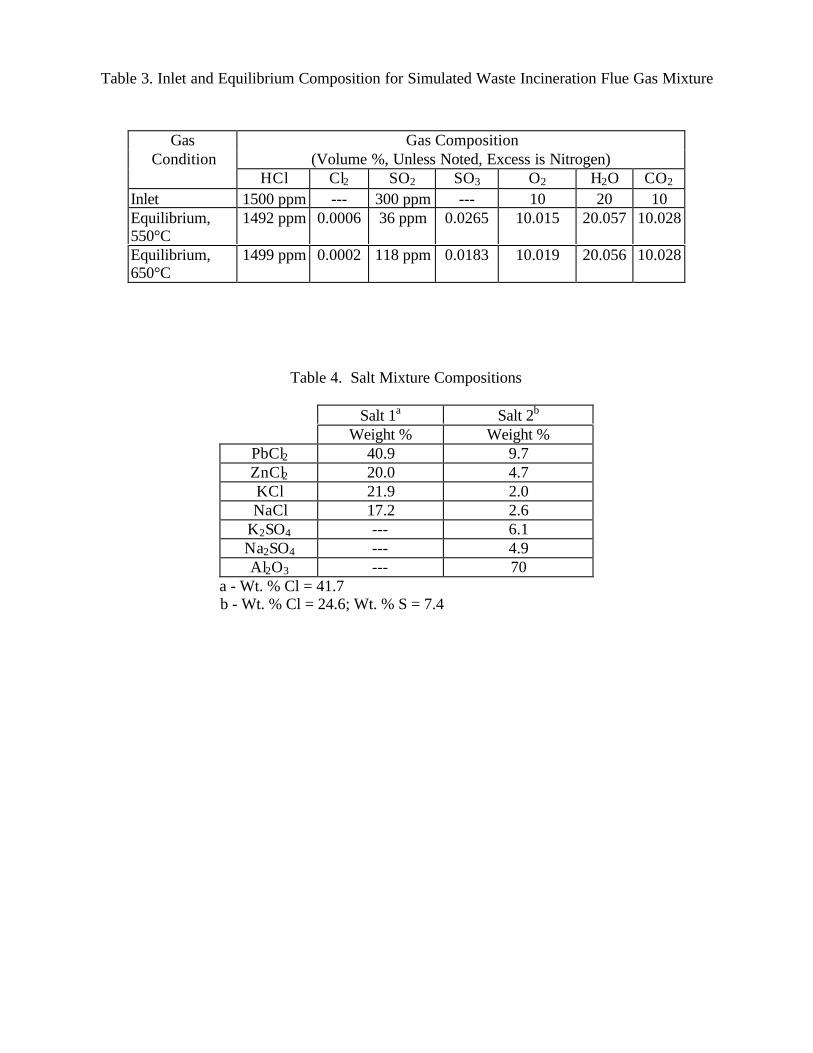
Table 3. Inlet and Equilibrium Composition for Simulated Waste Incineration Flue Gas Mixture
Gas Composition(Volume %, Unless Noted, Excess is Nitrogen)
GasCondition
HCl Cl2 SO2 SO3 O2 H2O CO2
Inlet 1500 ppm --- 300 ppm --- 10 20 10Equilibrium,550°C
1492 ppm 0.0006 36 ppm 0.0265 10.015 20.057 10.028
Equilibrium,650°C
1499 ppm 0.0002 118 ppm 0.0183 10.019 20.056 10.028
Table 4. Salt Mixture Compositions
Salt 1a Salt 2b
Weight % Weight %PbCl2 40.9 9.7ZnCl2 20.0 4.7KCl 21.9 2.0NaCl 17.2 2.6
K2SO4 --- 6.1Na2SO4 --- 4.9Al2O3 --- 70
a - Wt. % Cl = 41.7 b - Wt. % Cl = 24.6; Wt. % S = 7.4
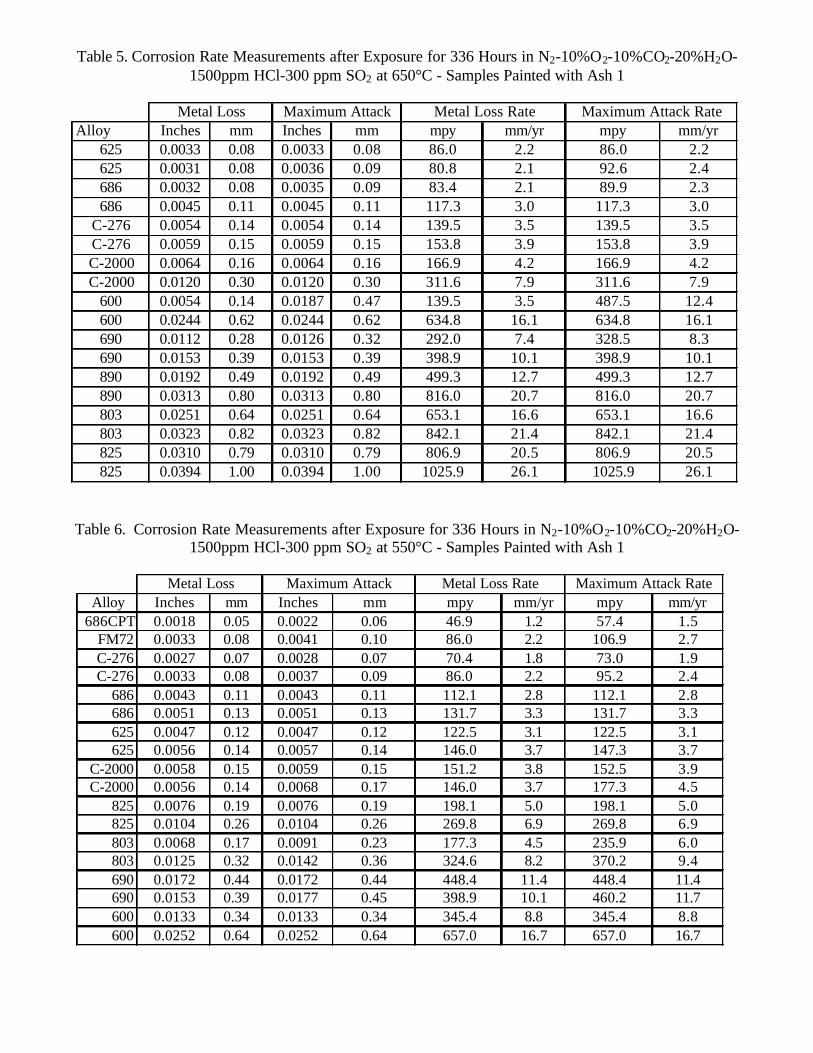
Table 5. Corrosion Rate Measurements after Exposure for 336 Hours in N2-10%O2-10%CO2-20%H2O-1500ppm HCl-300 ppm SO2 at 650°C - Samples Painted with Ash 1
Table 6. Corrosion Rate Measurements after Exposure for 336 Hours in N2-10%O2-10%CO2-20%H2O-1500ppm HCl-300 ppm SO2 at 550°C - Samples Painted with Ash 1
Alloy Inches mm Inches mm mpy mm/yr mpy mm/yr625 0.0033 0.08 0.0033 0.08 86.0 2.2 86.0 2.2625 0.0031 0.08 0.0036 0.09 80.8 2.1 92.6 2.4686 0.0032 0.08 0.0035 0.09 83.4 2.1 89.9 2.3686 0.0045 0.11 0.0045 0.11 117.3 3.0 117.3 3.0
C-276 0.0054 0.14 0.0054 0.14 139.5 3.5 139.5 3.5C-276 0.0059 0.15 0.0059 0.15 153.8 3.9 153.8 3.9C-2000 0.0064 0.16 0.0064 0.16 166.9 4.2 166.9 4.2C-2000 0.0120 0.30 0.0120 0.30 311.6 7.9 311.6 7.9
600 0.0054 0.14 0.0187 0.47 139.5 3.5 487.5 12.4600 0.0244 0.62 0.0244 0.62 634.8 16.1 634.8 16.1690 0.0112 0.28 0.0126 0.32 292.0 7.4 328.5 8.3690 0.0153 0.39 0.0153 0.39 398.9 10.1 398.9 10.1890 0.0192 0.49 0.0192 0.49 499.3 12.7 499.3 12.7890 0.0313 0.80 0.0313 0.80 816.0 20.7 816.0 20.7803 0.0251 0.64 0.0251 0.64 653.1 16.6 653.1 16.6803 0.0323 0.82 0.0323 0.82 842.1 21.4 842.1 21.4825 0.0310 0.79 0.0310 0.79 806.9 20.5 806.9 20.5825 0.0394 1.00 0.0394 1.00 1025.9 26.1 1025.9 26.1
Metal Loss Maximum Attack Metal Loss Rate Maximum Attack Rate
Alloy Inches mm Inches mm mpy mm/yr mpy mm/yr686CPT 0.0018 0.05 0.0022 0.06 46.9 1.2 57.4 1.5
FM72 0.0033 0.08 0.0041 0.10 86.0 2.2 106.9 2.7C-276 0.0027 0.07 0.0028 0.07 70.4 1.8 73.0 1.9C-276 0.0033 0.08 0.0037 0.09 86.0 2.2 95.2 2.4
686 0.0043 0.11 0.0043 0.11 112.1 2.8 112.1 2.8686 0.0051 0.13 0.0051 0.13 131.7 3.3 131.7 3.3625 0.0047 0.12 0.0047 0.12 122.5 3.1 122.5 3.1625 0.0056 0.14 0.0057 0.14 146.0 3.7 147.3 3.7
C-2000 0.0058 0.15 0.0059 0.15 151.2 3.8 152.5 3.9C-2000 0.0056 0.14 0.0068 0.17 146.0 3.7 177.3 4.5
825 0.0076 0.19 0.0076 0.19 198.1 5.0 198.1 5.0825 0.0104 0.26 0.0104 0.26 269.8 6.9 269.8 6.9803 0.0068 0.17 0.0091 0.23 177.3 4.5 235.9 6.0803 0.0125 0.32 0.0142 0.36 324.6 8.2 370.2 9.4690 0.0172 0.44 0.0172 0.44 448.4 11.4 448.4 11.4690 0.0153 0.39 0.0177 0.45 398.9 10.1 460.2 11.7600 0.0133 0.34 0.0133 0.34 345.4 8.8 345.4 8.8600 0.0252 0.64 0.0252 0.64 657.0 16.7 657.0 16.7
Metal Loss Maximum Attack Metal Loss Rate Maximum Attack Rate
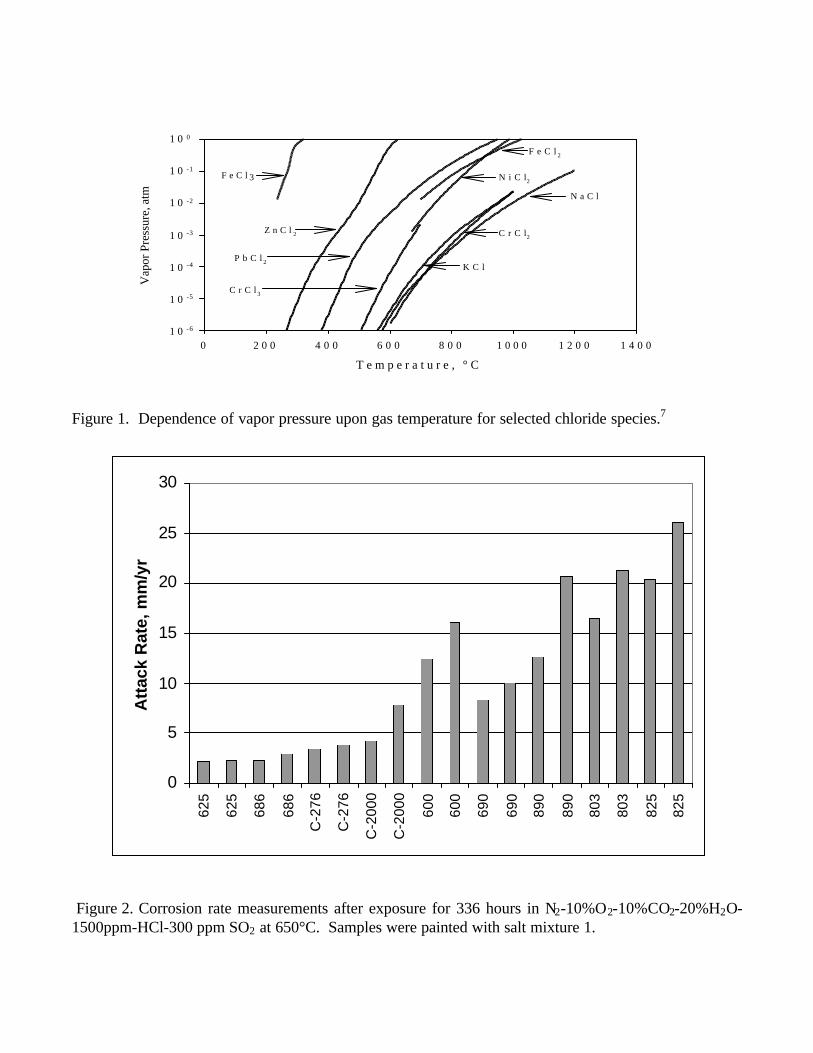
Figure 1. Dependence of vapor pressure upon gas temperature for selected chloride species.7
Figure 2. Corrosion rate measurements after exposure for 336 hours in N2-10%O2-10%CO2-20%H2O-1500ppm-HCl-300 ppm SO2 at 650°C. Samples were painted with salt mixture 1.
T e m p e r a t u r e , ° C
0 2 0 0 4 0 0 6 0 0 8 0 0 1 0 0 0 1 2 0 0 1 4 0 0
Vap
or P
ress
ure,
atm
1 0 -6
1 0 -5
1 0 -4
1 0 -3
1 0 -2
1 0 -1
1 0 0
F e C l 3
Z n C l 2
P b C l 2
C r C l 3
K C l
C r C l2
N a C l
N i C l2
F e C l 2
0
5
10
15
20
25
30
625
625
686
686
C-2
76
C-2
76
C-2
000
C-2
000
600
600
690
690
890
890
803
803
825
825
Att
ack
Rat
e, m
m/y
r
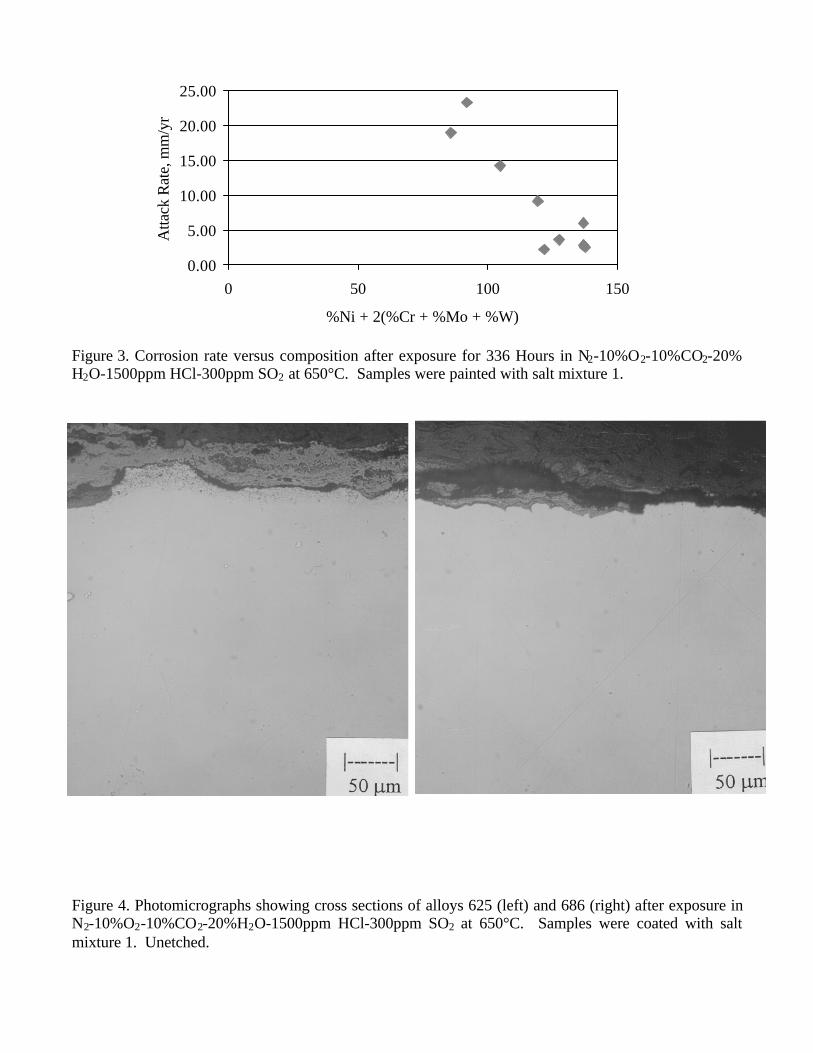
Figure 3. Corrosion rate versus composition after exposure for 336 Hours in N2-10%O2-10%CO2-20%H2O-1500ppm HCl-300ppm SO2 at 650°C. Samples were painted with salt mixture 1.
Figure 4. Photomicrographs showing cross sections of alloys 625 (left) and 686 (right) after exposure inN2-10%O2-10%CO2-20%H2O-1500ppm HCl-300ppm SO2 at 650°C. Samples were coated with saltmixture 1. Unetched.
0.00
5.00
10.00
15.00
20.00
25.00
0 50 100 150
%Ni + 2(%Cr + %Mo + %W)
Atta
ck R
ate,
mm
/yr
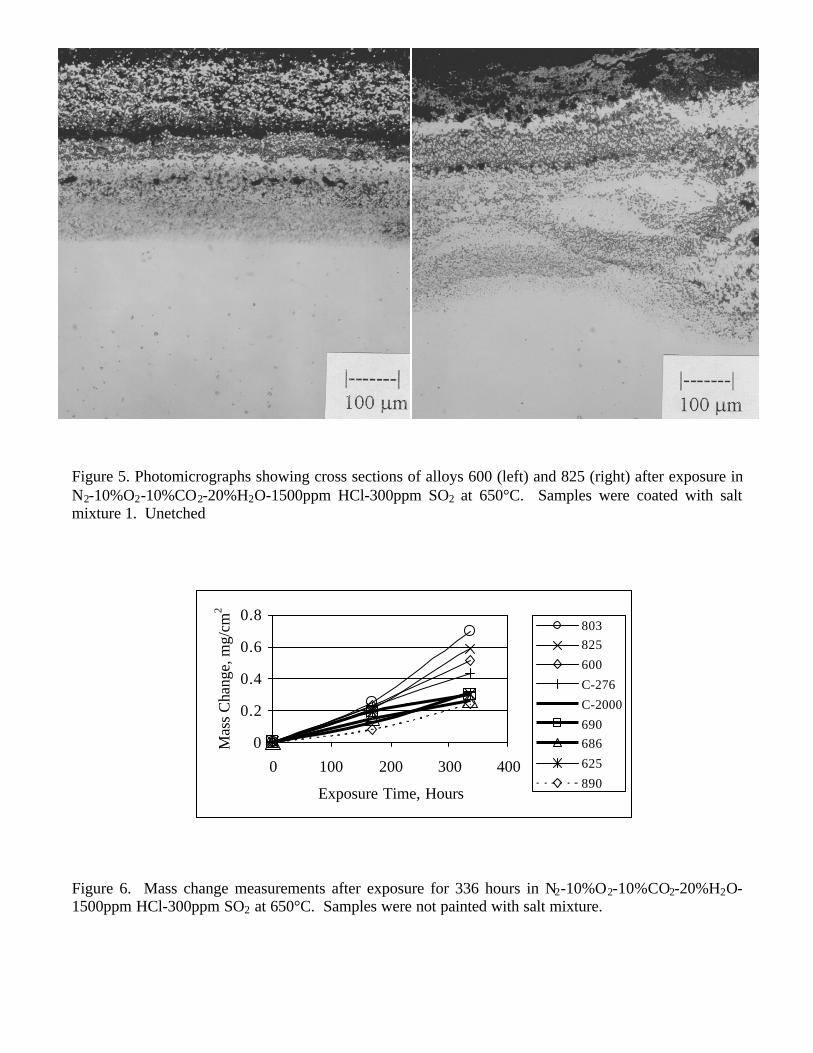
Figure 5. Photomicrographs showing cross sections of alloys 600 (left) and 825 (right) after exposure inN2-10%O2-10%CO2-20%H2O-1500ppm HCl-300ppm SO2 at 650°C. Samples were coated with saltmixture 1. Unetched
Figure 6. Mass change measurements after exposure for 336 hours in N2-10%O2-10%CO2-20%H2O-1500ppm HCl-300ppm SO2 at 650°C. Samples were not painted with salt mixture.
0
0.2
0.4
0.6
0.8
0 100 200 300 400
Exposure Time, Hours
Mas
s C
hang
e, m
g/cm
2
803825
600
C-276
C-2000
690686
625
890
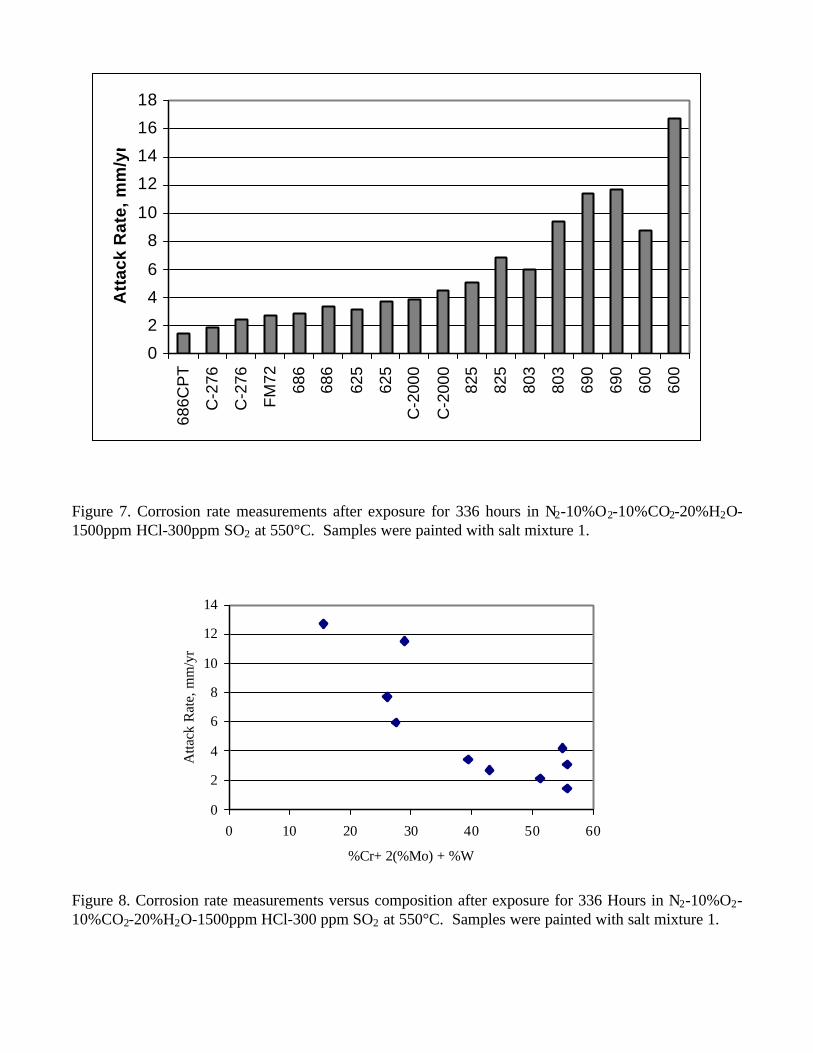
Figure 7. Corrosion rate measurements after exposure for 336 hours in N2-10%O2-10%CO2-20%H2O-1500ppm HCl-300ppm SO2 at 550°C. Samples were painted with salt mixture 1.
Figure 8. Corrosion rate measurements versus composition after exposure for 336 Hours in N2-10%O2-10%CO2-20%H2O-1500ppm HCl-300 ppm SO2 at 550°C. Samples were painted with salt mixture 1.
0
2
4
6
8
10
12
14
0 10 20 30 40 50 60
%Cr+ 2(%Mo) + %W
Atta
ck R
ate,
mm
/yr
0
2
4
6
8
10
12
14
16
18
686C
PT
C-2
76
C-2
76
FM
72 686
686
625
625
C-2
000
C-2
000
825
825
803
803
690
690
600
600
Att
ack
Rat
e, m
m/y
r
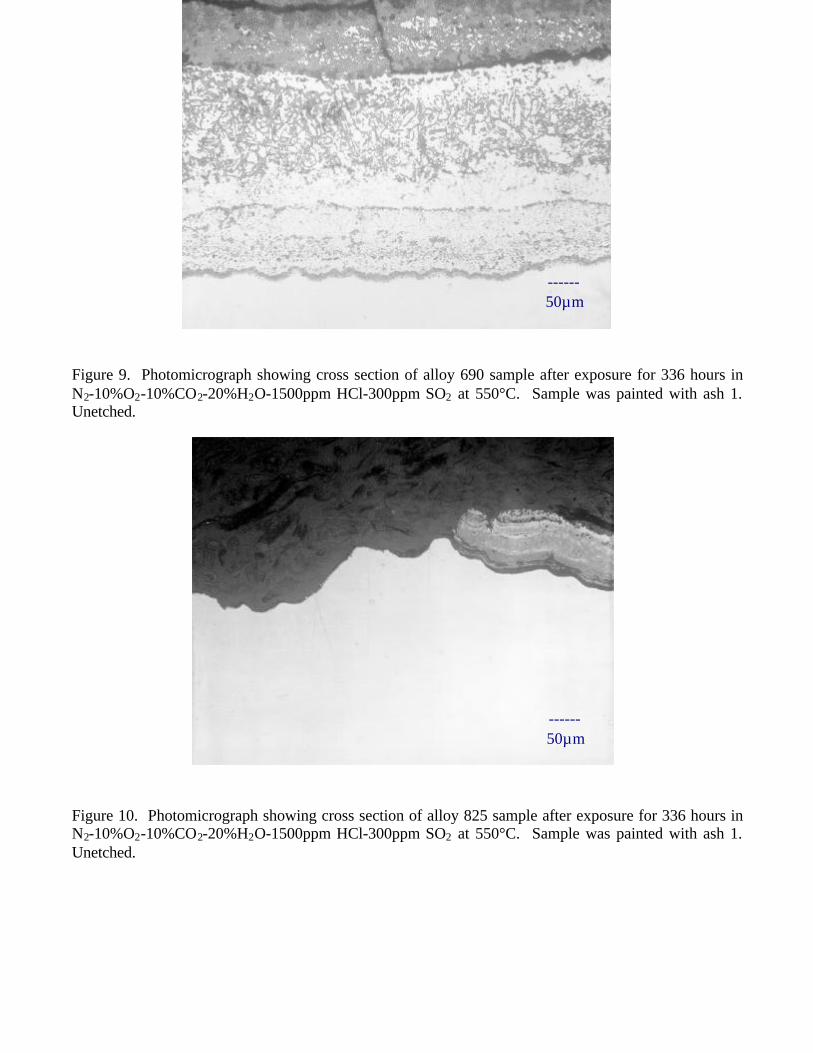
Figure 9. Photomicrograph showing cross section of alloy 690 sample after exposure for 336 hours inN2-10%O2-10%CO2-20%H2O-1500ppm HCl-300ppm SO2 at 550°C. Sample was painted with ash 1.Unetched.
Figure 10. Photomicrograph showing cross section of alloy 825 sample after exposure for 336 hours inN2-10%O2-10%CO2-20%H2O-1500ppm HCl-300ppm SO2 at 550°C. Sample was painted with ash 1.Unetched.
------50µm
------50µm
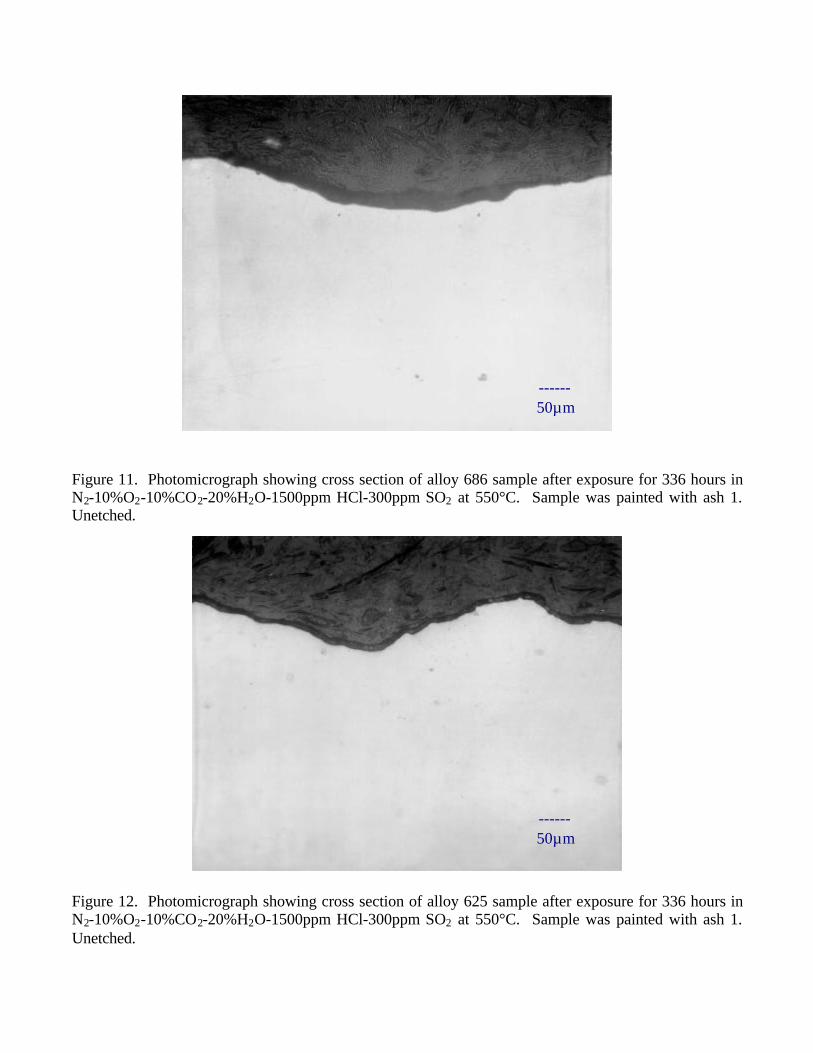
Figure 11. Photomicrograph showing cross section of alloy 686 sample after exposure for 336 hours inN2-10%O2-10%CO2-20%H2O-1500ppm HCl-300ppm SO2 at 550°C. Sample was painted with ash 1.Unetched.
Figure 12. Photomicrograph showing cross section of alloy 625 sample after exposure for 336 hours inN2-10%O2-10%CO2-20%H2O-1500ppm HCl-300ppm SO2 at 550°C. Sample was painted with ash 1.Unetched.
------50µm
------50µm

Figure 13. Corrosion Rate Measurements for Alloys 625, 622 and C-22 after Exposure for 336 Hours inN2-10%O2-10%CO2-20%H2O-1500ppm HCl-300ppm SO2 at 550°C - Samples Painted with Ash 1.
Figure 14. Corrosion rate measurements for alloys 625 and 622 after exposure for 336 hours in N2-10%O2-10%CO2-20%H2O-1500ppm HCl-300 ppm SO2 at 550°C. Samples were painted with saltmixture 1.
0
0.5
1
1.5
2
2.5
3
625 622
Att
ack
Rat
e, m
m/y
r
Wrought Sample
Weld Overlay
Iron Contents: 625 - 14.6%; 622 - 12.3%
0
1
2
3
4
5
6
625 622 C-22
Att
ack
Rat
e, m
m/y
rTest 1
Test 2Test 3
Test 4
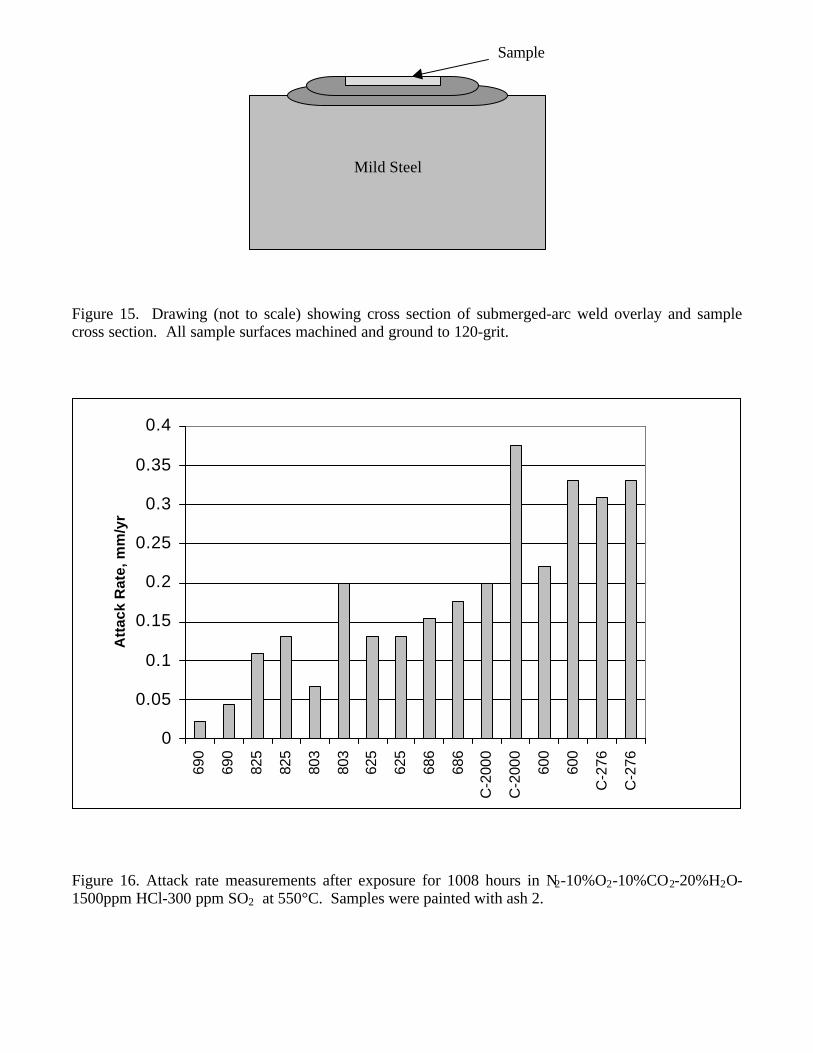
Figure 15. Drawing (not to scale) showing cross section of submerged-arc weld overlay and samplecross section. All sample surfaces machined and ground to 120-grit.
Figure 16. Attack rate measurements after exposure for 1008 hours in N2-10%O2-10%CO2-20%H2O-1500ppm HCl-300 ppm SO2 at 550°C. Samples were painted with ash 2.
Mild Steel
Sample
0
0.05
0.1
0.15
0.2
0.25
0.3
0.35
0.4
690
690
825
825
803
803
625
625
686
686
C-2
000
C-2
000
600
600
C-2
76
C-2
76
Att
ack
Rat
e, m
m/y
r