correlations between the two-phase gas/liquid spray atomization
TRANSCRIPT

Journal of Physics Conference Series
OPEN ACCESS
Correlations between the two-phase gasliquid spray atomization and theStokesaerodynamic Weber numbersTo cite this article Mohammad A Rahman et al 2009 J Phys Conf Ser 147 012057
View the article online for updates and enhancements
This content was downloaded from IP address 60655136 on 18102021 at 1117
Correlations between the Two-Phase GasLiquid Spray Atomization and the StokesAerodynamic Weber
Numbers
Mohammad A Rahman 1 Ted Heidrick 2 Brian A Fleck 3
1 The Department of Mechanical Engineering University of Alberta Edmonton Alberta Canada
1 marahmanualbertaca
Abstract The The effects of air-to-liquid ratio (β) and void fraction (α) on Sauter mean diameter (SMD or D32) arithmetic mean diameter (D10) surface mean diameter (D20) volume mean diameter (VMD or D20) and radial velocity profiles were experimentally investigated for a two-phase gasliquid (TPGL) nozzle with a hybrid design of classical twin-fluid and effervescent nozzles Radial spray profiles were measured using a Phase-Doppler-Particle-Anemometer (PDPA) system on 15Dn 30Dn 60Dn 120Dn(Dn represents nozzle diameter = 310mm) axial distances In addition the effects of spray break-up patterns were analyzed with changing axial distances The average void fraction in the feeding conduit (FC) was measured by a pneumatic controlled quick-closing-valve (QCV) The experiments were performed using mixtures of air with water at water flow rates of 150 to 750 kgmin and air-to-liquid mass ratios (β) of 030 to 10 The length and diameter of the FC was 368cm and 635mm respectively Result indicates that as the St number reaches the value of one no more break-up continues thus the droplets start to coalesce each other forming bigger droplets (higher D10 values) with increasing radial distances Knowledge from this study will provide better understanding that ensures an increase in plant efficiency and product yield in oil sands bitumen upgrading
1 INTRODUCTION In fluid coking the gas (steam) and liquid (bitumen) mix well upstream of the feed nozzles where the mixture is atomized to form a spray One of the drawbacks found with the fluid coking nozzles is the development of instabilities in the spray caused by the TPGL flow patterns formed inside or upstream the nozzle at the higher β (Ariyapadi et al 2005 Maldonado 2006) A stable spray is demonstrated by a good dispersion of the liquid phase It is desirable to produce a stable spray with minimum SMD (D32) and well-dispersed liquid droplets A desired bitumen drop size in contact with a given coke particle is one with the same nominal diameter as the coke particle This ensures that the coke is adequately and sufficiently coated with a thin layer of bitumen (Ejim 2008) On the other hand an unstable spray is characterized by intermittencypulsation in its flow regime with the random formation of fine and coarse droplets in the spray These pulsations are attributed to the TPGL fluids conditions such as β α the mixing pressure Pm the design of the mixing chamber and the geometry of nozzle (Tafreshi et al 2002) Previous studies (Roesler et al 1989 Whitlow et al 1993) showed that as the β is increased for a constant operating pressure at a certain transition point (eg β gt10 in the large-scale nozzle) the spray becomes unstable A homogeneous mixture of the gas-liquid
The 6th International Symposium on Measurement Techniques for Multiphase Flows IOP PublishingJournal of Physics Conference Series 147 (2009) 012057 doi1010881742-65961471012057
ccopy 2009 IOP Publishing Ltd 1
entering the nozzle would maximize the effect of the decompression of the gas phase resulting in a stable spray On the other hand a heterogeneous flow entering into the nozzle cause an unstable spray formation (Barker et al 1991) Enhanced heat and mass transfer can be achieved from a spray which is composed of dispersed droplets with larger spread rates Moreover as the droplet sizes are reduced the energy of the droplets is more readily transferred to the surrounding fluid (MacGregor 1991) This would ensure proper mixing with the surrounding fluids Furthermore in processes where the feed needs to be injected into a cross-flowing stream the droplets in the spray must have enough momentum to penetrate the cross-flowing fluid stream (Ariyapadi et al 2000) Continuous and fine spray characteristics are desirable in the feeding nozzle This feed nozzle is used in the heavy oil process industry Preheated bitumen and steam is mixed upstream of the nozzle and subsequently injected into fluid bed coker reactors via feed nozzles One of the drawbacks of this spray characteristic is the pulsation within the spray and in the feeding conduit which is highly undesirable to yield high productivity These pulsations result in poor atomization and in most instances a slug of liquid is ejected out of the nozzle
It is convenient to work with mean drop sizes instead of complete drop size distributions in the TPGL atomization characterization The mean drop size distribution is generalized as follows (Lefebvre 1989 Mugele et al 1951)
int
int=minus
m
m
D
D
b
D
D
a
baab
dDdDDND
dDdDDND
D
0
0
)(
)(
)( (1)
The values of a and b can be found in Lefebvre (1989) and the mean diameter expression is presented in Table 1 Table 1 Mean diameters (adapted from Lefebvre 1989)
Symbol Name of mean diameter Expression
D10 Length sumsum
i
ii
NDN
D20 Surface area 212
⎟⎟⎠
⎞⎜⎜⎝
⎛
sumsum
i
ii
NDN
D30 Volume 313
⎟⎟⎠
⎞⎜⎜⎝
⎛
sumsum
i
ii
NDN
D32 Sauter mean (SMD) sum
sum2
3
ii
ii
DNDN
The 6th International Symposium on Measurement Techniques for Multiphase Flows IOP PublishingJournal of Physics Conference Series 147 (2009) 012057 doi1010881742-65961471012057
2
Generally D32SMD provides a good indication of the drop size dispersion characteristics and used for mass transfer application The D10 diameter is used for comparison purpose the D20 diameter is used for surface area controlling application the D30 diameter is used for volume controlling application the D43 diameter is used for combustion equilibrium application In the droplet motion the Stokes number (St) is a very important parameter The St is defined as the ratio of the particle momentum response time over a flow system time defined as LudSt ccppcp microρττ 18 2== Two types of situations can be observed for particles (bubblesdroplets) suspended in fluid namely a) if the Stltlt1 the particles will have ample time to respond to changes in flow velocity b) if Stgtgt1 then the particle will have essentially no time to respond to the fluid velocity changes and the particle velocity will be little affected by fluid velocity change (Crowe 2006) A spray breaks up further downstream from the tip of a nozzle A typical TPGL atomization process involves a) primary atomization (PA) b) secondary atomization process (SA) The dominant forces involve in the atomization process are (i) hydrodynamic or inertial force attributed to undulationsperturbations (ii) aerodynamic force attributed to dragshearing effect (iii) viscous force attributed to oppose a change in liquid geometry and (iv) surface tension forces attributed to a minimum surface energy (Nasr et al 2002) The first two forces are disruptive in nature and second two forces are cohesive in nature Due to the interaction of internal forces such as a) turbulence b) inertial effects c) momentum transfer between transverse layers of a jet are mainly responsible for the PA (McCarthy et al 1974) At this stage the disruptive forces exceed the consolidating forces resulting the oscillations on the liquid surface and subsequently disintegrate the bulk liquid into drops (Liu 1999 Shavit et al 1996) The SA in a spray occurs when larger droplets or liquid ligaments break down into smaller droplets The breakup of a single droplet in a gas is caused by either greater relative velocity or turbulence (Crowe 2006) The SA occurs due to two force ratios acting on the drop (Pilch et al 1987) Firstly if the aerodynamic forces overcome the forces due to the surface tension the droplet will further deform (Low et al 1982) The ratio of this two forces can be represented by the Weber number which can be defined as i) aerodynamicgas Weber number
σρ 2drelgg duWe = or ii) liquid Weber number σρ 2
dlll duWe = Secondly the Ohnesorge
numberLaplace number denoted by LpdWeOh dllll 1Re === σρmicro which is the ratio of liquid viscous force to surface tension force on the drop also plays an important role in the SA Here Rel is the liquid Reynolds number defined ldlll du microρ Re = Mathematically if the Weg exceeds the Wecrit the SA occurs For low-viscosity liquids critWe = 6 to 13 for
10ltOh critWe asymp 2Oh for 10gtOh (Faeth 1990) In the TPGL spray characteristics measurement the PDPA system and digital image analysis techniques has been using as an advanced experimental techniques The PDPA measurement techniques to measure the TPGL spray can be found in literature (Ariyapadi et al 2000 Ariyapadi et al 2001 Ariyapadi et al 2003 Copan et al 2001 Ziesenis et al 2002) Recently developed digital image analysis techniques potentially are also capable of sizing particles of arbitrary shape and size and with a wide dynamic range (Ariyapadi et al 2005 Kashdan et al 2003 Zama et al 2004)
Measurement techniques of the TPGL flowssprays are a challenge Due to highly non-uniform volumetric flow distributions and intermittency in the flow it is extremely difficult to predict accurate droplet sizes (dd) and flow pattern distributions in this type of flow This uncertainty of the dd prediction is exaggerated if the FC length of the nozzle is short as in the present study (368 cm long) since the TPGL flow cannot be fully developed within this short pipe length The nozzles currently used in this study do not belong specifically to any of the nozzle classes for the TPGL flows existing such as twin-fluid nozzles and effervescent nozzles Moreover in
The 6th International Symposium on Measurement Techniques for Multiphase Flows IOP PublishingJournal of Physics Conference Series 147 (2009) 012057 doi1010881742-65961471012057
3
recent years Nasr et al (2002) Hsiang et al (1992) Lefebvre (1989) Lefebvre et al (1988) and Roesler et al (1989) conducted atomization studies in the feed nozzles However these studies were based on the equilibrium flow condition in vertical nozzle configurations and in a larger length scale set-up In contrast to the above studies the current study deals with the non-equilibrium flow condition (in which the FC is very short) in a horizontal nozzle configuration and in a smaller length scale set-up The objectives of this study are i) to predict correlations between the spray disintegration process and the upstream FC flow characteristics ii) to understand the fundamentals of the TPGL flow patterns and spray characteristics The proposed study will contribute to the fundamental knowledge of the TPGL flows and make concrete headway in the design of an industrial nozzle used in a large-scale high impact operation
2 EXPERIMENTAL SET-UP In this study a laboratory scale nozzle assembly was implemented The dimension was at one-quarter scale of a patented full-scale design (US Patent 6003789) employed in a fluidized bed coker for heavy oil upgrading A feeding conduit of 368 cm in length and 635 mm ID was used upstream of the nozzle The nozzle diameter (Dn) was 310 mm Gas (air) was supplied from a compressor and liquid was supplied from a reciprocating pump These two fluids mixed together at a T-mixer prior to the FC This nozzle assembly was mounted on a 3-D automated traversing rig The experimental schematic diagram is presented in Fig 1
Fig 1 Schematic of the experimental set-up (adapted from Rahman et al 2008)
Mean drop size was measured using a 2D-PDPA from the Dantec Dynamics specifications (Ejim et al 2005) The focal lengths of the PDPA transmitter and receiver lenses were 400 mm and 310 mm respectively During data collection the PDPA was operated in refraction and forward-scatter mode and the receiver was set to a scattering angle (φ) of 30deg for the air-water tests Dantec (Dantec Dynamics 2003) specified that first order refraction was the most dominant scattering mode at φ = 30deg for water droplets in air (about 102 orders of magnitude higher compared to the backward scattering mode)
This technique can measure simultaneously velocity and particle size of known refractive index This method is termed as ldquo2D-PDPArdquo as this technique can measure
The 6th International Symposium on Measurement Techniques for Multiphase Flows IOP PublishingJournal of Physics Conference Series 147 (2009) 012057 doi1010881742-65961471012057
4
velocity of two orthogonal axes The optical setting of the 2D-PDPA is presented in Table 2
Table 2 Optical settings of the PDA unit used in the study
Parameter Unit Values Scattering angle (-) 30deg
Beam spacing mm 380
Beam expansion ratio (-) 10
Receiver focal length mm 310
Beam diameter mm 135
Transmitter focal length (mm 400
Receiver slit width or aperture mm 01
He-Ne laser wavelength nm 6328
Nd-YAG laser wavelength nm 532
The green Nd-YAG and red He-Ne laser power are 200 mW and 20 mW respectively Their wavelengths are 532 and 6328 nm respectively Each laser split in two laser beams using the unitrsquos Bragg cell The resulting four beams (two pairs for each laser) are aprt of 90o each other and converge at the focal length of the transmitter lens to form a control volume Droplet size was measured by detecting the incident droplets on the receiver detectors The size of a droplet is directly proportional to the phase shift of scattered light in the control volume The velocity of droplets can be found also by detecting the incident droplets on the receiver detectors However in this case the droplets passing through the control volume transmit Doppler frequencies or signals that are directly proportional to their velocity These Doppler frequencies are detected by the receiver
Radial spray profiles were measured using the PDPA on the 30Dn 60Dn and 120Dnaxial distances downstream of the nozzle orifice Measurements were taken varying the radial positions (r) by the 3-D traversing rig The values of D32 D10 and ux were measured with the changing β r and x positions In Fig1Fig 1 the lsquoRrsquo indicates the radius of the spray
3 RESULTS AND DISCUSSIONS The SMD (D32) provides a good indication of the drop size dispersion characteristics in the TPGL spray From Fig 2 it is evident that D32 values are greater at the center of the TPGL spray due to higher non-spherical droplet density persists around this zone However further away from the center of the spray the D32 values significantly decrease as around this zone droplets are more disperse At the periphery of the spray the D32 values are flattened out and in some cases a bit increase as around this region droplets may coalesce to each other
The 6th International Symposium on Measurement Techniques for Multiphase Flows IOP PublishingJournal of Physics Conference Series 147 (2009) 012057 doi1010881742-65961471012057
5
00
02
04
06
08
10
12
0 02 04 06 08 1rR
D32
Dm
ax
060 GLR 120 GLR 185 GLR 320 GLR 590 GLR
Fig 2 Effects of the GLR (gas-to-liquid-ratio β by mass) on the SMDD32 profiles with changing r at a fixed axial distance of 60 Dn and 620 kPa mixing pressure
00
02
04
06
08
10
12
0 02 04 06 08 1
rR
DD
max
D10 D20 D30 D32 D43
Fig 3 Profiles of D10 D20 D30 D32 D43 with changing r at a fixed axial distance of 60 Dn and 620 kPa mixing pressure
The 6th International Symposium on Measurement Techniques for Multiphase Flows IOP PublishingJournal of Physics Conference Series 147 (2009) 012057 doi1010881742-65961471012057
6
In Fig 3 D10 D20 D30 D32 and D43 profiles with changing r at a fixed axial distance of 60 Dn and 620 kPa mixing pressure (Pm) is depicted All the profiles indicate that the droplet sizes are greater at the center of the spray However further away from the center of the spray the droplet size decreases significantly and finally fatten out at the periphery of the spray
The PDPA provides the two-component droplet velocity (ux uy) and droplet diameter (dd) However it cannot provide the continuous phase gas (air) velocity data in the TPGL sprays Experimentally it is difficult to obtain the continuous phase gas velocity data in the TPGL atomization process However Crowe (2006) provided a correlation for how to obtain the continuous phase gas velocity by solving a particle motion equation and knowing the droplet velocity from the PDPA This correlation was subsequently defined Ud Ugcong1(1+St) Here St was the Stokes number If the St number tends to be zero there would be no slip between the two phases of fluid In this study the Ug value was obtained from the St number and by knowing the Ud and D10 values from the PDPA data
001
01
1
10
0 02 04 06 08 1 12 14 16rR
St
0
20
40
60
80
100
120
140
D10
St 060 GLR
St 120 GLR
St 185 GLR
D10 060 GLR
D10120 GLR
D10 185 GLR
Fig 4 Effects of the GLR (gas-to-liquid-ratio β by mass) on the St and D10 profiles with changing r at a fixed axial distance of 60Dn and 620 kPa mixing pressure
In the atomization process the St number is a very important parameter The St number is defined as the ratio of the droplet momentum response time over a flow system response time defined as St = τp τc =ρl D2
10 Ul 18microl r In Fig 4 the droplet St number and D10 profiles with changing r and β at a fixed axial distance of 60 Dn are depicted The Pm was maintained at a constant pressure of 620 kPa and the flow rates of gasliquid were varied to obtain different β of 060 120 and 185 at the constant pressure of 620 kPa Here R is the radius of the spray which is 65 mm First it is observed that if the lsquorrsquo increases the St number decreases remarkably due to the smaller droplet response time at the periphery of the spray If the Stltlt1 the droplets will have ample time to respond to changes in continuous phase flow velocity However if Stgtgt1 then the droplets will have essentially no time to respond to the continuous phase fluid velocity changes and the droplet velocity will be affected very little by the fluid velocity change (Crowe 2006) In our study similar observations for droplets suspended in the atmospheric air were noticed The St number reached a value of one at rR of 025 Thus at the center of the spray the droplet response time is much higher than that of the continuous air phase At the center of the spray a remarkable amount of slip exists between the liquid and gaseous phases However at the spray outer region the droplet response time followed the
The 6th International Symposium on Measurement Techniques for Multiphase Flows IOP PublishingJournal of Physics Conference Series 147 (2009) 012057 doi1010881742-65961471012057
7
continuous phase response time In addition to the above fact it is also observed that the St number profiles do not differ significantly in the radial direction for the β values of 060 120 and 185 at the constant pressure of 620 kPa until the point where the St number is equal to 1 However after the point where the St number is equal to 1 the higher β exhibits the lower St numbers in the radial direction due to the reduction of the jet half width
1E-01
1E+00
1E+01
1E+02
1E+03
1E+04
00 02 04 06 08 10 12 14 16 18rR
Weg
and
Re
0
5
10
15
20
25
Ug
(ms)
Weg 120 GLR
Weg 185 GLR
Weg 320 GLR
Re (d) 120 GLR
Re (d) 185 GLR
Re (d) 320 GLR
Ug 120 GLR
Ug 185 GLR
Ug 320 GLR
Fig 5 Effects of the GLR on the Weg Red and Ug profiles with changing r at a fixed axial distance of 60 Dn and 620 kPa mixing pressure Droplet response with the St number can be further demonstrated by the D10 profile data set In Fig 4 it is initially observed that if the β values are increased the D10 values are decreased Secondly until the St = 1 at the radial distance of rR = 025 the D10 values are decreased as the droplets continue to break-up up to this point However as soon as the St reached 1 droplet break-up began to cease thus the droplets started to coalesce forming bigger droplets (higher D10 values) with increasing radial distances The TPGL atomization behavior can be fully understood by the aerodynamic Weber number (Weg) and droplet Reynolds number (Red) The Weg is the measure of the relative importance of the fluidsrsquo inertia compared to its surface tension which can be defined as Weg =ρl (Ul-Ug) rσ Whereas the Red is the measure of the relative importance of the dropletrsquos inertia compared to its viscosity which is defined as Red =ρl Ul rmicro A spray breaks up further downstream from the tip of a nozzle A typical TPGL atomization process involves primary atomization (PA) and secondary atomization (SA) The dominant forces involved in the atomization process are (Nasr et al 2002) a) hydrodynamic or inertial force attributed to undulationsperturbations b) aerodynamic force attributed to dragshearing effect c) viscous force attributed to an oppositional change in liquid geometry and d) surface tension forces attributed to a minimum surface energy The first two forces are disruptive in nature and the second two forces are cohesive in nature Another mechanism for the TPGL atomization mechanism is the lsquobubble energyrsquo explosion (Lefebvre et al 1988 Roesler et al 1989) It was postulated that jet break-up occurs when the bubbles within the bulk liquid possess enough energy to overcome the surface tension forces that hold the liquid jet together When the bubbles have enough energy the
The 6th International Symposium on Measurement Techniques for Multiphase Flows IOP PublishingJournal of Physics Conference Series 147 (2009) 012057 doi1010881742-65961471012057
8
droplets further atomize through bubble explosions In Fig 5 the droplet break-up mechanism was investigated by the Weg Red and Ug profiles with changing r and β at a fixed axial distance of 60 Dn Here R was the radius of the spray which was 65 mm The Pm was maintained at a constant pressure of 620 kPa and the flow rates of gas and liquid were varied to obtain the β of 120 and 185 and 320 at that constant pressure An interesting observation is that the Ug has higher values between the center and periphery of the spray in the radial direction (r) Due to this peak of the Ug value the droplets break-up further downstream radially and axially which is termed as the SA In literature several correlations were hypothesized to predict the SA in terms of the Weg The interaction of internal forces such as turbulence inertial effects and momentum transfer between transverse layers of a jet are mainly responsible for the PA (McCarthy et al 1974) At this stage the disruptive forces exceeded the consolidating forces which resulted in oscillations on the liquid surface and subsequently disintegrated the bulk liquid into drops (Liu 1999 Shavit et al 1996) The SA in a spray occurs when larger droplets or liquid ligaments break down into smaller droplets The breakup of a single droplet in a gas is caused by either greater relative velocity or turbulence (Crowe 2006) In Fig 5 the greater relative velocity exists at this peak point of Ug profile The SA occurs due to two force ratios acting on the drop (Pilch et al 1987) If at first the aerodynamic forces overcome the forces due to the surface tension the droplet will further deform (Low et al 1982) The two dimensionless numbers can represent the ratio of these two forces The Weg plays a vital role in the first stage of the SA process Secondly the Ohnesorge number denoted by Oh (microl radicρl ddσ) which is the ratio of liquid viscous force to surface tension force on the drop also plays an important role in the SA process It was postulated that if the Weg exceeds the Wecrit (lsquocritrsquo denotes for critical) the SA occurs For low-viscosity liquids Wecrit = 6 to 13 for Ohlt01 WecritasympOh2 for Ohgt01 (Faeth 1990) To find out the Wecrit in Fig 5 a perpendicular line was drawn from the peak value of the Ug profile that intersects the Weg number profile at a point The value of the Weg number at this point can be termed as the Wecrit which is approximately 500 In Fig 5 it is also observed that the Weg and Red decreased remarkably with the radial distances up to the Wecrit limit However after a few radial distances from the Wecrit limit the Weg and Red decreased slightly with the variation of the β values In Fig 5 it was also observed that the Red varied from 700 to 7000 due to the variation of the rR values If the Redltlt1 the TPGL flow can be termed as Stokes flow In the Stokes flow regime viscous droplets remain spherical The wake formed behind the droplets became stronger as the Red increases and the inertia of the flow around the droplets overcame the viscosity effects on the surface of the droplets (Crowe 2006) It is also observed that the Red value decreased with the radial distances However the Ug still has enough momentum which can induce a slip between the two phases Thus although the Rd value decreases with the r the higher relative velocity between the phases is still responsible for the SA process In Fig 6 the droplet St and D10 profiles with changing axial distances (x of 30Dn 60Dn 120Dn) and radial distances (r) are depicted Here R is the radius of the spray which was 40 mm with the β of 2 at a Pm of 520 kPa It was initially observed that if the lsquorrsquo and lsquoxrsquo increase the St number decreases remarkably due to smaller droplet response time compared to that of the continuous phase gaseous medium Secondly the St number reaches the value of 1 at rR of 040 for axial distances of 30Dn 60Dn 120 Dn respectively Droplet break-up characteristics with the St number can also be verified with the D10 data It was observed that at 120Dn downstream of the nozzle orifice the droplets are more disperse compare to other two cases Thus near the center (r=0) of the spray at 120Dn downstream from the nozzle orifice the D10 values are lower than at 30Dn and 60Dn downstream D10 values at the similar radial position (r=0) In the later cases the droplets were not fully atomized which can be further explained with the Weg and Red profiles However as soon as the St value reaches 1 further away from the center the D10 values
The 6th International Symposium on Measurement Techniques for Multiphase Flows IOP PublishingJournal of Physics Conference Series 147 (2009) 012057 doi1010881742-65961471012057
9
are higher at 120Dn downstream from the nozzle orifice than at 30Dn and 60Dn downstream values at the similar radial position This is due to the fact of coalescence of droplets around this zone In Fig 7 the droplet break-up mechanism was examined by the Weg Red and Ug profiles with changing axial distances (30 Dn 60 Dn 120 Dn) and radial distances (r) Here R is the radius of the spray which was 40 mm The β for this condition was maintained at 2 with a Pm of 520 kPa
01
1
10
012 032 052 072 092
rR
St
0
20
40
60
80
100
120
140
D10
St 120 DnSt 60DnSt 30DnD10 120 DnD10 60DnD10 30Dn
Fig 6 Effects of the axial distances on the droplet St and D10 profiles with changing radial distances (r) at 2 GLR
An interesting observation in Fig 7 is that the Ug had higher values between the center and periphery of the spray in the radial direction Until the highest Ug value the droplets had a tendency to breakup further Thus in Fig 7 again the Wecrit value was obtained by drawing a perpendicular line from the Ug profile that intersects the Weg profile at a certain point The value obtained at this point is termed the Wecrit In Fig 7 it was also observed that the Weg and Red decreased remarkably with axial distances and radial distances If the Weg exceeds the Wecrit droplets will have the tendency to break-up further due to higher momentum transfer between the phases Thus it was observed that further downstream of the spray (120Dn) the Wecrit value was less compared to the upstream condition (30Dn) However the reverse case was observed for the Ug values At 120Dn downstream from the orifice of the nozzle the Ug had greater values compared to 30Dn downstream of the spray indicating the bubble explosion imparted higher momentum than the gas phase further downstream In Fig 7 it is also observed that the Red varied from 800 to 6500 in the radial direction Downstream of the spray (120Dn) the momentum of the droplet decreased remarkably compared to the upstream condition (30Dn) However for similar positions the gas phase still had enough momentum as it had just been exploded at the nozzle orifice This also provides the
The 6th International Symposium on Measurement Techniques for Multiphase Flows IOP PublishingJournal of Physics Conference Series 147 (2009) 012057 doi1010881742-65961471012057
10
basis for why the Ug exhibits higher values at 120Dn compared to 30Dn and 60Dn downstream from the nozzle orifice However it seems that the Red values are lower further downstream as the droplets lose momentum Thus the Red values are not fully capable of explaining the droplet atomization behavior further downstream of the spray
1E+00
1E+01
1E+02
1E+03
1E+04
012 032 052 072 092rR
We g
and
Re
0
5
10
15
20
25
Ug
(ms)
120 Dn Weg 60Dn Weg30Dn Weg 120 DnRe (d)60Dn Re (d) 30Dn Re (d)120 Dn Ug 60Dn Ug 30Dn Ug
Fig 7 Effects of the axial distances on the Weg Red and Ug profiles with changing radial distances (r) at 2 GLR
4 CONCLUSIONS
The fundamental knowledge of the TPGL flowatomization process in nozzles is important for many industrial and chemical reactions The outcome of this research will help in optimization of commercial process conditions and provide a comprehensive means of improving the design conditions of the TPGL flowatomization process Specifically this project will assist to optimize the operating range of the existing steambitumen fluid cooking nozzles used in the heavy oil upgrading process Knowledge obtained will contribute to the development of a new series of nozzles heavy oil industry is currently bringing to market Atomization from the nozzle likely depends on flow patterns void fractions and bubble size distribution in the upstream FC Thus it is essential to have a good understanding and a reasonable estimate of the bubble size flow regime void fraction pressure drop and subsequent droplet size distribution in turbulent TPGL flow A wide variety of operating conditions need to be introduced in the experiment to obtain a better correlation of the flow conditions and spray characteristics
The St number is useful to evaluate the Ug values using a particle motion equation Eventually the Ug value is required to obtain the Weg and Red values which are very useful dimensionless numbers used to predict the TPGL spray atomization and specially the droplet SA commencement In this study two types of conditions were studied The value of β was first varied from 060 120 and 185 at the constant pressure of 620 kPa at a fixed axial downstream of 60Dn It was observed that the St number reached the value of 1 at the rR of 025 distance Thus at the center of the spray the droplets response time was much higher than
The 6th International Symposium on Measurement Techniques for Multiphase Flows IOP PublishingJournal of Physics Conference Series 147 (2009) 012057 doi1010881742-65961471012057
11
that of a continuous phase gaseous medium However at the spray outer region the droplet response time followed the continuous phase response time As soon as the St reached 1 break-up stopped thus the droplets started to coalesce forming bigger droplets (higher D10 values) with increasing radial distances It was also observed that the Weg and Red decreased remarkably with the radial distances (r) before the Wecrit limit However the Weg and Red decreased slowly with the variation of the β values after the Wecrit limit
In the second set of studies the droplet atomization behavior was examined with changing axial distances (x of 30Dn 60Dn 120Dn) and radial distances (r) In this case the β was 2 at a Pm of 520 kPa It was observed that if the lsquorrsquo and lsquoxrsquo was increased the St number decreased remarkably due to smaller droplet response times compared to the continuous phase response time The St number reached the value of 1 at the rR of 040 for axial distances of 30Dn 60Dn 120 Dn respectively Thus near the center (r = 0) of the spray at 120Dn downstream the D10 values were lower than that of 30Dn and 60Dn at the similar radial positions (r = 0) due to greater droplets break-up in further downstream
5 ACKNOWLEDGMENTS
The authors wish to acknowledge the financial support used to carry out this study provided by Syncrude Canada Ltd CRD grant Alberta Ingenuity and NSERC
6 LIST OF SYMBOLS NOMENCLATURE OR ABBREVIATIONS
Abbreviations GLR gas to liquid ratio by mass FC feeding conduit PDPA Phase-Doppler-Particle-Analyzer PA primary atomization SA secondary atomization TPGL two-phase gasliquid flow Symbols Dn nozzle diameter (m) D10 arithmetic mean diameter (m) D32 sauter mean diameter (m) D diameter (m) dd droplet diameter (m) db bubble diameter (m) mg mass flow rates of the gas phase (kgsec) ml mass flow rates of the liquid phase (kgsec) N number of samples (-) Pm mixing pressure (Pa)
Qg volume flow rate of the gas phase (m3sec) Ql volume flow rate of the liquid phase (m3sec) r radial position (m) R radius of the spray (m) Ug velocity of the gas phase phases (msec) Ul velocity of the liquid phases (msec) Ud velocity of the droplet (msec) x axial distance (m)
The 6th International Symposium on Measurement Techniques for Multiphase Flows IOP PublishingJournal of Physics Conference Series 147 (2009) 012057 doi1010881742-65961471012057
12
Greek Letters φ scattering angle (o) β gas to liquid ratio by mass () ρ density (kgm3) ρl density of liquid phase (20degC pure water 998 kgm3) micro viscosity )( smkg microl viscosity of the carrier fluid (20degC pure water 100times10-3 kgms) microg viscosity of the gas phase (20degC air 182times10-5 kgms) σ surface tension (20degC pure water 728 Nm) τp particle momentum response time (s) τc flow system time (s) Subscripts c l w continuousliquidwater phase p d g a particledispersedgasair phase d droplet Dimensionless numbers Oh Ohnesorge number St Stokes number Re Reynolds number We Weber number Wecrit Critical Weber number
7 REFERENCES Ariyapadi S et al (2000) Effect of Cross-Flow on the Spray Characteristics of an Industrial Feed Nozzle paper 75b Proc AIChE Spring Annual meeting Atlanta GA 2000 Ariyapadi S et al (2000) Effect of Cross-Flow on the Spray Characteristics of an Industrial Feed Nozzle paper 75b Proc AIChE Spring Annual meeting Atlanta GA Ariyapadi S et al (2001) Characterizing Spray Pulsations Using a Phase-Doppler Particle Analyzer Ind Eng Chem Res 40 pp5282-5290 Ariyapadi S et al (2005) Stability of horizontal gasndashliquid sprays in open-air and in a gasndashsolid fluidized bed Powder Technology 155 pp161 ndash 174 Ariyapadi S et al (2003) Effect of Crossflow on the Spray Characteristics of an industrial Feed Nozzle Chem Eng Comm 190 1 pp681-1704 Barker CL et al (1991) Acoustic Monitoring of Two-Phase Feed Nozzles ppUS Patent 5 004 152 Copan J et al (2001) Droplet Size-Velocity Characteristics of Sprays Generated by Two-Phase Feed Nozzles Chem Engg Comm 184 pp105- 124 Crowe CT (2006) Multiphase flow handbook CRC Taylor amp Francis Boca Raton FL
The 6th International Symposium on Measurement Techniques for Multiphase Flows IOP PublishingJournal of Physics Conference Series 147 (2009) 012057 doi1010881742-65961471012057
13
Dantec Dynamics AS (2003) BSA Flow Software Version 21 Installation and Userrsquos guide Skovlunde Ejim CE (2008) Effect of Liquid Viscosity Surface Tension and Nozzle Size on Atomization in Two-Phase Nozzles PhD thesis Mechanical Engineering University of Alberta Ejim CE et al (2005) A Scaling Study of the Atomization of a Two-Phase Industrial Nozzle Part 1 - Effect of Surface Tension and Viscosity on Mean Drop Size Profiles Proceedings of the 20th ILASS - Europe Meeting Sept 5-7 Orleacuteans France Faeth GM (1990) Structure and atomization properties of dense turbulent sprays 23rd Symposium on Combustion The Combustion Institute Pittsburgh 1990 pp 1345ndash1352 Faeth GM (1990) Structure and atomization properties of dense turbulent sprays 23rd Symposium on Combustion The combustion Institute Pittsburgh pp 1345ndash1352 Hsiang LP et al (1992) Near-limit drop deformation and secondary breakup Int J Multiphase Flow 18 pp635ndash652 Kashdan JT et al (2003) Two-Phase Flow Characterization by Automated Digital Image Analysis Part 1 Fundamental Principles and Calibration of the Technique Part Part Syst Charact 20 Lefebvre AH (1989) Atomizations and Sprays Hemisphere New York Lefebvre AH et al (1988) Spray characteristics of aerated-liquid pressure atomizers AIAA Journal of Propulsion and Power 4 (6) pp293-298 Liu H (1999) Science and Engineering of droplets - Fundamentals and Applications William Andrew IncNoyes Publications Low TB et al (1982) Collision coalescence and breakup of raindrops J Atmos Sci 39 pp1591ndash1618 MacGregor SA (1991) Air Entrainment in Spray Jets Int J Heat and Fluid Flow 12 pp279ndash283 Maldonado S (2006) Improving the Stability of Gas-Liquid Sprays by Modifying the Two-Phase Flow Entering The Nozzle MASc Thesis University of Alberta McCarthy MJ et al (1974) Review of stability of liquid jets and influence of nozzle design Chemical Engineering Journal 7 pp1-20 Mugele R et al (1951) Drop size distributions is sprays Ind Eng Chem 43 (6) pp1317-1324 Nasr GG et al (2002) Industrial sprays and atomization design analysis and applications Springer London New York Pilch M et al (1987) Use of breakup time data and velocity history data to predict the maximum size of stable fragments for acceleration-induced breakup of a liquid drop Int J
The 6th International Symposium on Measurement Techniques for Multiphase Flows IOP PublishingJournal of Physics Conference Series 147 (2009) 012057 doi1010881742-65961471012057
14
Multiphase Flow 13 pp741ndash757 Rahman MA et al (2008) Characterizing the Two-Phase AirLiquid Spray Profile Using a Phase-Doppler-Particle-Analyzer proceedings of the 14TH International Symposium on Applications of Laser Techniques to Fluid Mechanics Lisbon Portugal Roesler TC et al (1989) Studies on aerated-liquid atomization International Journal of Turbo Jet Engines 6 pp221-230 Shavit U et al (1996) Development and evaluation of a new turbulence generator for atomization research Experiments in Fluids 20 (4) pp291-301 Tafreshi ZM et al (2002) Improving the efficiency of fluid cokers by altering two-phase feed characteristics Powder Technology 125 pp234ndash 241 Whitlow JD et al (1993) Effervescent atomizer operation and spray characteristics Atomizations and Sprays 3 pp137ndash155 Zama Y et al (2004) Simultaneous Measurement of Droplet Size and Three-Components of Velocity in Spray Optical Review 11 (6) pp358ndash364 Ziesenis J et al (2002) Absorption and Scattering of Light by Highly Concentrated Two-phase Flows Part Part Syst Charact 19 pp195-202
The 6th International Symposium on Measurement Techniques for Multiphase Flows IOP PublishingJournal of Physics Conference Series 147 (2009) 012057 doi1010881742-65961471012057
15

00
02
04
06
08
10
12
0 02 04 06 08 1rR
D32
Dm
ax
060 GLR 120 GLR 185 GLR 320 GLR 590 GLR
Fig 2 Effects of the GLR (gas-to-liquid-ratio β by mass) on the SMDD32 profiles with changing r at a fixed axial distance of 60 Dn and 620 kPa mixing pressure
00
02
04
06
08
10
12
0 02 04 06 08 1
rR
DD
max
D10 D20 D30 D32 D43
Fig 3 Profiles of D10 D20 D30 D32 D43 with changing r at a fixed axial distance of 60 Dn and 620 kPa mixing pressure
The 6th International Symposium on Measurement Techniques for Multiphase Flows IOP PublishingJournal of Physics Conference Series 147 (2009) 012057 doi1010881742-65961471012057
6
In Fig 3 D10 D20 D30 D32 and D43 profiles with changing r at a fixed axial distance of 60 Dn and 620 kPa mixing pressure (Pm) is depicted All the profiles indicate that the droplet sizes are greater at the center of the spray However further away from the center of the spray the droplet size decreases significantly and finally fatten out at the periphery of the spray
The PDPA provides the two-component droplet velocity (ux uy) and droplet diameter (dd) However it cannot provide the continuous phase gas (air) velocity data in the TPGL sprays Experimentally it is difficult to obtain the continuous phase gas velocity data in the TPGL atomization process However Crowe (2006) provided a correlation for how to obtain the continuous phase gas velocity by solving a particle motion equation and knowing the droplet velocity from the PDPA This correlation was subsequently defined Ud Ugcong1(1+St) Here St was the Stokes number If the St number tends to be zero there would be no slip between the two phases of fluid In this study the Ug value was obtained from the St number and by knowing the Ud and D10 values from the PDPA data
001
01
1
10
0 02 04 06 08 1 12 14 16rR
St
0
20
40
60
80
100
120
140
D10
St 060 GLR
St 120 GLR
St 185 GLR
D10 060 GLR
D10120 GLR
D10 185 GLR
Fig 4 Effects of the GLR (gas-to-liquid-ratio β by mass) on the St and D10 profiles with changing r at a fixed axial distance of 60Dn and 620 kPa mixing pressure
In the atomization process the St number is a very important parameter The St number is defined as the ratio of the droplet momentum response time over a flow system response time defined as St = τp τc =ρl D2
10 Ul 18microl r In Fig 4 the droplet St number and D10 profiles with changing r and β at a fixed axial distance of 60 Dn are depicted The Pm was maintained at a constant pressure of 620 kPa and the flow rates of gasliquid were varied to obtain different β of 060 120 and 185 at the constant pressure of 620 kPa Here R is the radius of the spray which is 65 mm First it is observed that if the lsquorrsquo increases the St number decreases remarkably due to the smaller droplet response time at the periphery of the spray If the Stltlt1 the droplets will have ample time to respond to changes in continuous phase flow velocity However if Stgtgt1 then the droplets will have essentially no time to respond to the continuous phase fluid velocity changes and the droplet velocity will be affected very little by the fluid velocity change (Crowe 2006) In our study similar observations for droplets suspended in the atmospheric air were noticed The St number reached a value of one at rR of 025 Thus at the center of the spray the droplet response time is much higher than that of the continuous air phase At the center of the spray a remarkable amount of slip exists between the liquid and gaseous phases However at the spray outer region the droplet response time followed the
The 6th International Symposium on Measurement Techniques for Multiphase Flows IOP PublishingJournal of Physics Conference Series 147 (2009) 012057 doi1010881742-65961471012057
7
continuous phase response time In addition to the above fact it is also observed that the St number profiles do not differ significantly in the radial direction for the β values of 060 120 and 185 at the constant pressure of 620 kPa until the point where the St number is equal to 1 However after the point where the St number is equal to 1 the higher β exhibits the lower St numbers in the radial direction due to the reduction of the jet half width
1E-01
1E+00
1E+01
1E+02
1E+03
1E+04
00 02 04 06 08 10 12 14 16 18rR
Weg
and
Re
0
5
10
15
20
25
Ug
(ms)
Weg 120 GLR
Weg 185 GLR
Weg 320 GLR
Re (d) 120 GLR
Re (d) 185 GLR
Re (d) 320 GLR
Ug 120 GLR
Ug 185 GLR
Ug 320 GLR
Fig 5 Effects of the GLR on the Weg Red and Ug profiles with changing r at a fixed axial distance of 60 Dn and 620 kPa mixing pressure Droplet response with the St number can be further demonstrated by the D10 profile data set In Fig 4 it is initially observed that if the β values are increased the D10 values are decreased Secondly until the St = 1 at the radial distance of rR = 025 the D10 values are decreased as the droplets continue to break-up up to this point However as soon as the St reached 1 droplet break-up began to cease thus the droplets started to coalesce forming bigger droplets (higher D10 values) with increasing radial distances The TPGL atomization behavior can be fully understood by the aerodynamic Weber number (Weg) and droplet Reynolds number (Red) The Weg is the measure of the relative importance of the fluidsrsquo inertia compared to its surface tension which can be defined as Weg =ρl (Ul-Ug) rσ Whereas the Red is the measure of the relative importance of the dropletrsquos inertia compared to its viscosity which is defined as Red =ρl Ul rmicro A spray breaks up further downstream from the tip of a nozzle A typical TPGL atomization process involves primary atomization (PA) and secondary atomization (SA) The dominant forces involved in the atomization process are (Nasr et al 2002) a) hydrodynamic or inertial force attributed to undulationsperturbations b) aerodynamic force attributed to dragshearing effect c) viscous force attributed to an oppositional change in liquid geometry and d) surface tension forces attributed to a minimum surface energy The first two forces are disruptive in nature and the second two forces are cohesive in nature Another mechanism for the TPGL atomization mechanism is the lsquobubble energyrsquo explosion (Lefebvre et al 1988 Roesler et al 1989) It was postulated that jet break-up occurs when the bubbles within the bulk liquid possess enough energy to overcome the surface tension forces that hold the liquid jet together When the bubbles have enough energy the
The 6th International Symposium on Measurement Techniques for Multiphase Flows IOP PublishingJournal of Physics Conference Series 147 (2009) 012057 doi1010881742-65961471012057
8
droplets further atomize through bubble explosions In Fig 5 the droplet break-up mechanism was investigated by the Weg Red and Ug profiles with changing r and β at a fixed axial distance of 60 Dn Here R was the radius of the spray which was 65 mm The Pm was maintained at a constant pressure of 620 kPa and the flow rates of gas and liquid were varied to obtain the β of 120 and 185 and 320 at that constant pressure An interesting observation is that the Ug has higher values between the center and periphery of the spray in the radial direction (r) Due to this peak of the Ug value the droplets break-up further downstream radially and axially which is termed as the SA In literature several correlations were hypothesized to predict the SA in terms of the Weg The interaction of internal forces such as turbulence inertial effects and momentum transfer between transverse layers of a jet are mainly responsible for the PA (McCarthy et al 1974) At this stage the disruptive forces exceeded the consolidating forces which resulted in oscillations on the liquid surface and subsequently disintegrated the bulk liquid into drops (Liu 1999 Shavit et al 1996) The SA in a spray occurs when larger droplets or liquid ligaments break down into smaller droplets The breakup of a single droplet in a gas is caused by either greater relative velocity or turbulence (Crowe 2006) In Fig 5 the greater relative velocity exists at this peak point of Ug profile The SA occurs due to two force ratios acting on the drop (Pilch et al 1987) If at first the aerodynamic forces overcome the forces due to the surface tension the droplet will further deform (Low et al 1982) The two dimensionless numbers can represent the ratio of these two forces The Weg plays a vital role in the first stage of the SA process Secondly the Ohnesorge number denoted by Oh (microl radicρl ddσ) which is the ratio of liquid viscous force to surface tension force on the drop also plays an important role in the SA process It was postulated that if the Weg exceeds the Wecrit (lsquocritrsquo denotes for critical) the SA occurs For low-viscosity liquids Wecrit = 6 to 13 for Ohlt01 WecritasympOh2 for Ohgt01 (Faeth 1990) To find out the Wecrit in Fig 5 a perpendicular line was drawn from the peak value of the Ug profile that intersects the Weg number profile at a point The value of the Weg number at this point can be termed as the Wecrit which is approximately 500 In Fig 5 it is also observed that the Weg and Red decreased remarkably with the radial distances up to the Wecrit limit However after a few radial distances from the Wecrit limit the Weg and Red decreased slightly with the variation of the β values In Fig 5 it was also observed that the Red varied from 700 to 7000 due to the variation of the rR values If the Redltlt1 the TPGL flow can be termed as Stokes flow In the Stokes flow regime viscous droplets remain spherical The wake formed behind the droplets became stronger as the Red increases and the inertia of the flow around the droplets overcame the viscosity effects on the surface of the droplets (Crowe 2006) It is also observed that the Red value decreased with the radial distances However the Ug still has enough momentum which can induce a slip between the two phases Thus although the Rd value decreases with the r the higher relative velocity between the phases is still responsible for the SA process In Fig 6 the droplet St and D10 profiles with changing axial distances (x of 30Dn 60Dn 120Dn) and radial distances (r) are depicted Here R is the radius of the spray which was 40 mm with the β of 2 at a Pm of 520 kPa It was initially observed that if the lsquorrsquo and lsquoxrsquo increase the St number decreases remarkably due to smaller droplet response time compared to that of the continuous phase gaseous medium Secondly the St number reaches the value of 1 at rR of 040 for axial distances of 30Dn 60Dn 120 Dn respectively Droplet break-up characteristics with the St number can also be verified with the D10 data It was observed that at 120Dn downstream of the nozzle orifice the droplets are more disperse compare to other two cases Thus near the center (r=0) of the spray at 120Dn downstream from the nozzle orifice the D10 values are lower than at 30Dn and 60Dn downstream D10 values at the similar radial position (r=0) In the later cases the droplets were not fully atomized which can be further explained with the Weg and Red profiles However as soon as the St value reaches 1 further away from the center the D10 values
The 6th International Symposium on Measurement Techniques for Multiphase Flows IOP PublishingJournal of Physics Conference Series 147 (2009) 012057 doi1010881742-65961471012057
9
are higher at 120Dn downstream from the nozzle orifice than at 30Dn and 60Dn downstream values at the similar radial position This is due to the fact of coalescence of droplets around this zone In Fig 7 the droplet break-up mechanism was examined by the Weg Red and Ug profiles with changing axial distances (30 Dn 60 Dn 120 Dn) and radial distances (r) Here R is the radius of the spray which was 40 mm The β for this condition was maintained at 2 with a Pm of 520 kPa
01
1
10
012 032 052 072 092
rR
St
0
20
40
60
80
100
120
140
D10
St 120 DnSt 60DnSt 30DnD10 120 DnD10 60DnD10 30Dn
Fig 6 Effects of the axial distances on the droplet St and D10 profiles with changing radial distances (r) at 2 GLR
An interesting observation in Fig 7 is that the Ug had higher values between the center and periphery of the spray in the radial direction Until the highest Ug value the droplets had a tendency to breakup further Thus in Fig 7 again the Wecrit value was obtained by drawing a perpendicular line from the Ug profile that intersects the Weg profile at a certain point The value obtained at this point is termed the Wecrit In Fig 7 it was also observed that the Weg and Red decreased remarkably with axial distances and radial distances If the Weg exceeds the Wecrit droplets will have the tendency to break-up further due to higher momentum transfer between the phases Thus it was observed that further downstream of the spray (120Dn) the Wecrit value was less compared to the upstream condition (30Dn) However the reverse case was observed for the Ug values At 120Dn downstream from the orifice of the nozzle the Ug had greater values compared to 30Dn downstream of the spray indicating the bubble explosion imparted higher momentum than the gas phase further downstream In Fig 7 it is also observed that the Red varied from 800 to 6500 in the radial direction Downstream of the spray (120Dn) the momentum of the droplet decreased remarkably compared to the upstream condition (30Dn) However for similar positions the gas phase still had enough momentum as it had just been exploded at the nozzle orifice This also provides the
The 6th International Symposium on Measurement Techniques for Multiphase Flows IOP PublishingJournal of Physics Conference Series 147 (2009) 012057 doi1010881742-65961471012057
10
basis for why the Ug exhibits higher values at 120Dn compared to 30Dn and 60Dn downstream from the nozzle orifice However it seems that the Red values are lower further downstream as the droplets lose momentum Thus the Red values are not fully capable of explaining the droplet atomization behavior further downstream of the spray
1E+00
1E+01
1E+02
1E+03
1E+04
012 032 052 072 092rR
We g
and
Re
0
5
10
15
20
25
Ug
(ms)
120 Dn Weg 60Dn Weg30Dn Weg 120 DnRe (d)60Dn Re (d) 30Dn Re (d)120 Dn Ug 60Dn Ug 30Dn Ug
Fig 7 Effects of the axial distances on the Weg Red and Ug profiles with changing radial distances (r) at 2 GLR
4 CONCLUSIONS
The fundamental knowledge of the TPGL flowatomization process in nozzles is important for many industrial and chemical reactions The outcome of this research will help in optimization of commercial process conditions and provide a comprehensive means of improving the design conditions of the TPGL flowatomization process Specifically this project will assist to optimize the operating range of the existing steambitumen fluid cooking nozzles used in the heavy oil upgrading process Knowledge obtained will contribute to the development of a new series of nozzles heavy oil industry is currently bringing to market Atomization from the nozzle likely depends on flow patterns void fractions and bubble size distribution in the upstream FC Thus it is essential to have a good understanding and a reasonable estimate of the bubble size flow regime void fraction pressure drop and subsequent droplet size distribution in turbulent TPGL flow A wide variety of operating conditions need to be introduced in the experiment to obtain a better correlation of the flow conditions and spray characteristics
The St number is useful to evaluate the Ug values using a particle motion equation Eventually the Ug value is required to obtain the Weg and Red values which are very useful dimensionless numbers used to predict the TPGL spray atomization and specially the droplet SA commencement In this study two types of conditions were studied The value of β was first varied from 060 120 and 185 at the constant pressure of 620 kPa at a fixed axial downstream of 60Dn It was observed that the St number reached the value of 1 at the rR of 025 distance Thus at the center of the spray the droplets response time was much higher than
The 6th International Symposium on Measurement Techniques for Multiphase Flows IOP PublishingJournal of Physics Conference Series 147 (2009) 012057 doi1010881742-65961471012057
11
that of a continuous phase gaseous medium However at the spray outer region the droplet response time followed the continuous phase response time As soon as the St reached 1 break-up stopped thus the droplets started to coalesce forming bigger droplets (higher D10 values) with increasing radial distances It was also observed that the Weg and Red decreased remarkably with the radial distances (r) before the Wecrit limit However the Weg and Red decreased slowly with the variation of the β values after the Wecrit limit
In the second set of studies the droplet atomization behavior was examined with changing axial distances (x of 30Dn 60Dn 120Dn) and radial distances (r) In this case the β was 2 at a Pm of 520 kPa It was observed that if the lsquorrsquo and lsquoxrsquo was increased the St number decreased remarkably due to smaller droplet response times compared to the continuous phase response time The St number reached the value of 1 at the rR of 040 for axial distances of 30Dn 60Dn 120 Dn respectively Thus near the center (r = 0) of the spray at 120Dn downstream the D10 values were lower than that of 30Dn and 60Dn at the similar radial positions (r = 0) due to greater droplets break-up in further downstream
5 ACKNOWLEDGMENTS
The authors wish to acknowledge the financial support used to carry out this study provided by Syncrude Canada Ltd CRD grant Alberta Ingenuity and NSERC
6 LIST OF SYMBOLS NOMENCLATURE OR ABBREVIATIONS
Abbreviations GLR gas to liquid ratio by mass FC feeding conduit PDPA Phase-Doppler-Particle-Analyzer PA primary atomization SA secondary atomization TPGL two-phase gasliquid flow Symbols Dn nozzle diameter (m) D10 arithmetic mean diameter (m) D32 sauter mean diameter (m) D diameter (m) dd droplet diameter (m) db bubble diameter (m) mg mass flow rates of the gas phase (kgsec) ml mass flow rates of the liquid phase (kgsec) N number of samples (-) Pm mixing pressure (Pa)
Qg volume flow rate of the gas phase (m3sec) Ql volume flow rate of the liquid phase (m3sec) r radial position (m) R radius of the spray (m) Ug velocity of the gas phase phases (msec) Ul velocity of the liquid phases (msec) Ud velocity of the droplet (msec) x axial distance (m)
The 6th International Symposium on Measurement Techniques for Multiphase Flows IOP PublishingJournal of Physics Conference Series 147 (2009) 012057 doi1010881742-65961471012057
12
Greek Letters φ scattering angle (o) β gas to liquid ratio by mass () ρ density (kgm3) ρl density of liquid phase (20degC pure water 998 kgm3) micro viscosity )( smkg microl viscosity of the carrier fluid (20degC pure water 100times10-3 kgms) microg viscosity of the gas phase (20degC air 182times10-5 kgms) σ surface tension (20degC pure water 728 Nm) τp particle momentum response time (s) τc flow system time (s) Subscripts c l w continuousliquidwater phase p d g a particledispersedgasair phase d droplet Dimensionless numbers Oh Ohnesorge number St Stokes number Re Reynolds number We Weber number Wecrit Critical Weber number
7 REFERENCES Ariyapadi S et al (2000) Effect of Cross-Flow on the Spray Characteristics of an Industrial Feed Nozzle paper 75b Proc AIChE Spring Annual meeting Atlanta GA 2000 Ariyapadi S et al (2000) Effect of Cross-Flow on the Spray Characteristics of an Industrial Feed Nozzle paper 75b Proc AIChE Spring Annual meeting Atlanta GA Ariyapadi S et al (2001) Characterizing Spray Pulsations Using a Phase-Doppler Particle Analyzer Ind Eng Chem Res 40 pp5282-5290 Ariyapadi S et al (2005) Stability of horizontal gasndashliquid sprays in open-air and in a gasndashsolid fluidized bed Powder Technology 155 pp161 ndash 174 Ariyapadi S et al (2003) Effect of Crossflow on the Spray Characteristics of an industrial Feed Nozzle Chem Eng Comm 190 1 pp681-1704 Barker CL et al (1991) Acoustic Monitoring of Two-Phase Feed Nozzles ppUS Patent 5 004 152 Copan J et al (2001) Droplet Size-Velocity Characteristics of Sprays Generated by Two-Phase Feed Nozzles Chem Engg Comm 184 pp105- 124 Crowe CT (2006) Multiphase flow handbook CRC Taylor amp Francis Boca Raton FL
The 6th International Symposium on Measurement Techniques for Multiphase Flows IOP PublishingJournal of Physics Conference Series 147 (2009) 012057 doi1010881742-65961471012057
13
Dantec Dynamics AS (2003) BSA Flow Software Version 21 Installation and Userrsquos guide Skovlunde Ejim CE (2008) Effect of Liquid Viscosity Surface Tension and Nozzle Size on Atomization in Two-Phase Nozzles PhD thesis Mechanical Engineering University of Alberta Ejim CE et al (2005) A Scaling Study of the Atomization of a Two-Phase Industrial Nozzle Part 1 - Effect of Surface Tension and Viscosity on Mean Drop Size Profiles Proceedings of the 20th ILASS - Europe Meeting Sept 5-7 Orleacuteans France Faeth GM (1990) Structure and atomization properties of dense turbulent sprays 23rd Symposium on Combustion The Combustion Institute Pittsburgh 1990 pp 1345ndash1352 Faeth GM (1990) Structure and atomization properties of dense turbulent sprays 23rd Symposium on Combustion The combustion Institute Pittsburgh pp 1345ndash1352 Hsiang LP et al (1992) Near-limit drop deformation and secondary breakup Int J Multiphase Flow 18 pp635ndash652 Kashdan JT et al (2003) Two-Phase Flow Characterization by Automated Digital Image Analysis Part 1 Fundamental Principles and Calibration of the Technique Part Part Syst Charact 20 Lefebvre AH (1989) Atomizations and Sprays Hemisphere New York Lefebvre AH et al (1988) Spray characteristics of aerated-liquid pressure atomizers AIAA Journal of Propulsion and Power 4 (6) pp293-298 Liu H (1999) Science and Engineering of droplets - Fundamentals and Applications William Andrew IncNoyes Publications Low TB et al (1982) Collision coalescence and breakup of raindrops J Atmos Sci 39 pp1591ndash1618 MacGregor SA (1991) Air Entrainment in Spray Jets Int J Heat and Fluid Flow 12 pp279ndash283 Maldonado S (2006) Improving the Stability of Gas-Liquid Sprays by Modifying the Two-Phase Flow Entering The Nozzle MASc Thesis University of Alberta McCarthy MJ et al (1974) Review of stability of liquid jets and influence of nozzle design Chemical Engineering Journal 7 pp1-20 Mugele R et al (1951) Drop size distributions is sprays Ind Eng Chem 43 (6) pp1317-1324 Nasr GG et al (2002) Industrial sprays and atomization design analysis and applications Springer London New York Pilch M et al (1987) Use of breakup time data and velocity history data to predict the maximum size of stable fragments for acceleration-induced breakup of a liquid drop Int J
The 6th International Symposium on Measurement Techniques for Multiphase Flows IOP PublishingJournal of Physics Conference Series 147 (2009) 012057 doi1010881742-65961471012057
14
Multiphase Flow 13 pp741ndash757 Rahman MA et al (2008) Characterizing the Two-Phase AirLiquid Spray Profile Using a Phase-Doppler-Particle-Analyzer proceedings of the 14TH International Symposium on Applications of Laser Techniques to Fluid Mechanics Lisbon Portugal Roesler TC et al (1989) Studies on aerated-liquid atomization International Journal of Turbo Jet Engines 6 pp221-230 Shavit U et al (1996) Development and evaluation of a new turbulence generator for atomization research Experiments in Fluids 20 (4) pp291-301 Tafreshi ZM et al (2002) Improving the efficiency of fluid cokers by altering two-phase feed characteristics Powder Technology 125 pp234ndash 241 Whitlow JD et al (1993) Effervescent atomizer operation and spray characteristics Atomizations and Sprays 3 pp137ndash155 Zama Y et al (2004) Simultaneous Measurement of Droplet Size and Three-Components of Velocity in Spray Optical Review 11 (6) pp358ndash364 Ziesenis J et al (2002) Absorption and Scattering of Light by Highly Concentrated Two-phase Flows Part Part Syst Charact 19 pp195-202
The 6th International Symposium on Measurement Techniques for Multiphase Flows IOP PublishingJournal of Physics Conference Series 147 (2009) 012057 doi1010881742-65961471012057
15
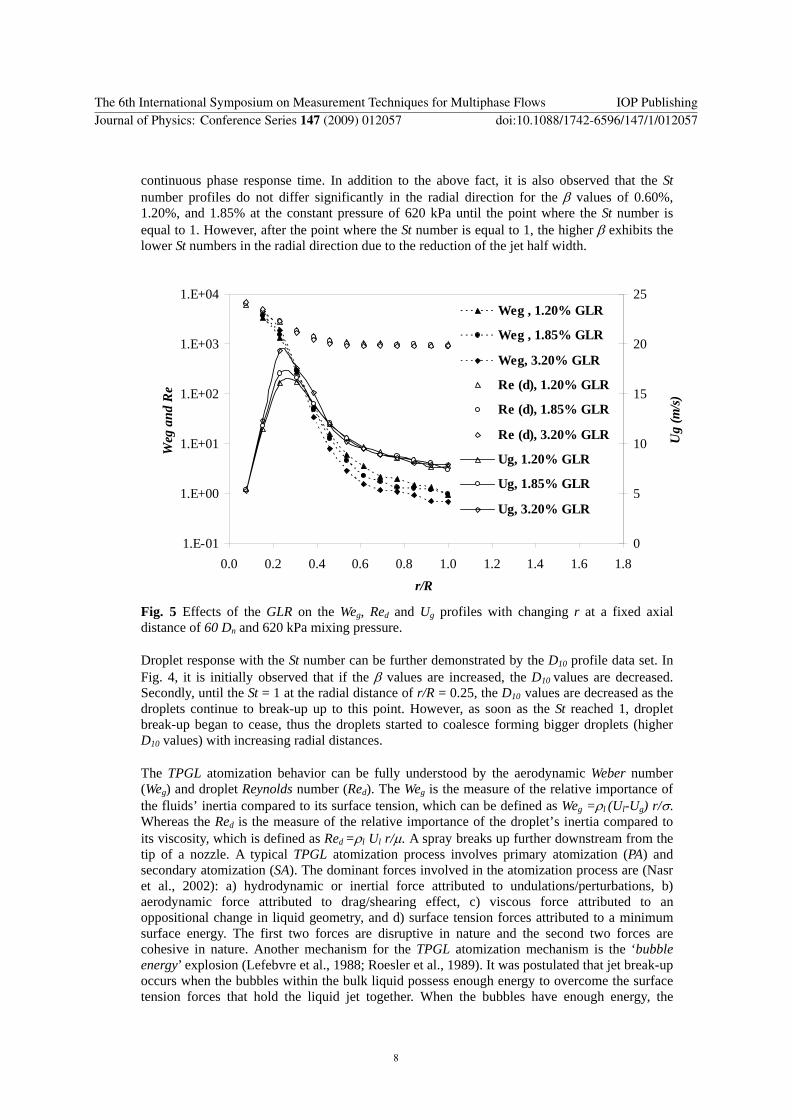
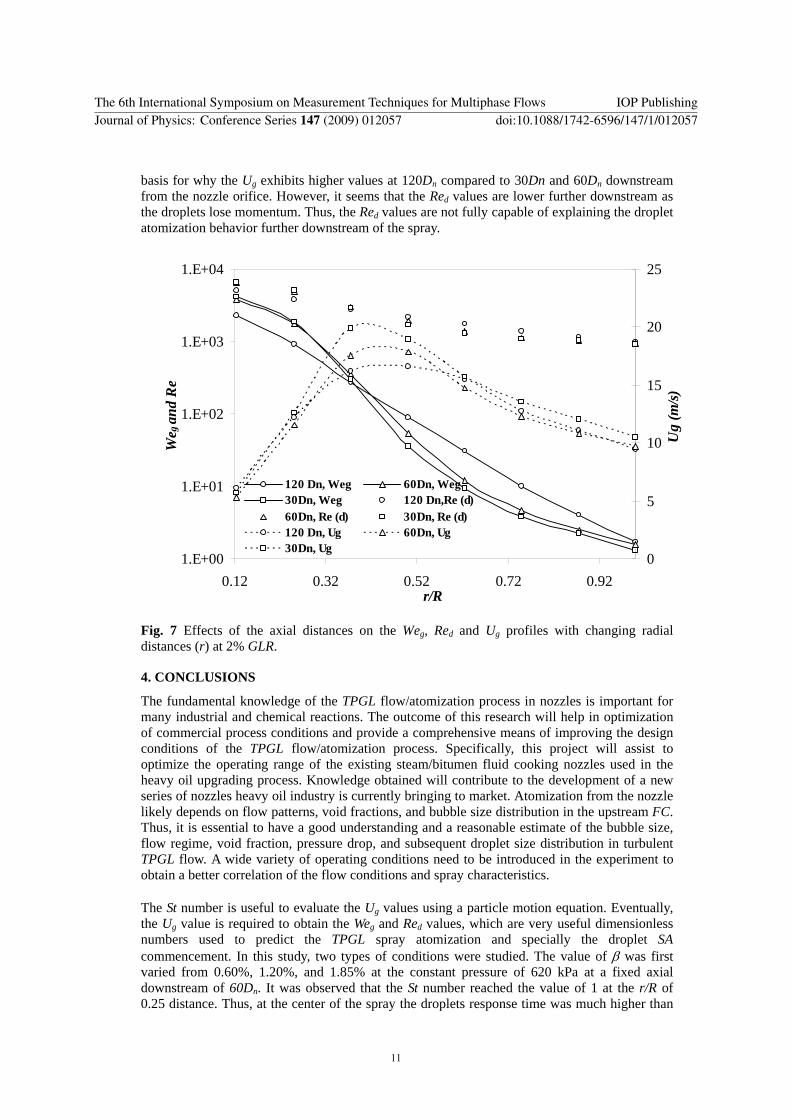