correlation between sub-micron surface roughness of iron oxide encrustations and trace element...
TRANSCRIPT

Science of the Total Environment 407 (2009) 4703–4710
Contents lists available at ScienceDirect
Science of the Total Environment
j ourna l homepage: www.e lsev ie r.com/ locate /sc i totenv
Correlation between sub-micron surface roughness of iron oxide encrustations andtrace element concentrations
Cornelius Fischer a,b,⁎, Volker Karius b, Andreas Lüttge a,c
a Department of Earth Science, MS-126, Rice University, 6100 Main Street, Houston, TX 77005, USAb Geowissenschaftliches Zentrum der Universität Göttingen, Abt. Sedimentologie & Umweltgeologie, Goldschmidtstr. 3, D-37077 Göttingen, Germanyc Department of Chemistry, Rice University, 6100 Main Street, Houston, TX 77005, USA
⁎ Corresponding author. Geowissenschaftliches ZentrAbt. Sedimentologie & Umweltgeologie, GoldschmidGermany. Tel.: +49 551 393154.
E-mail address: [email protected] (C. Fischer).
0048-9697/$ – see front matter © 2009 Elsevier B.V. Adoi:10.1016/j.scitotenv.2009.04.026
a b s t r a c t
a r t i c l e i n f oArticle history:Received 21 November 2008Received in revised form 16 April 2009Accepted 17 April 2009Available online 19 May 2009
Iron oxide encrustations are formed on black slate surfaces during oxidative weathering of iron sulfide andphosphate bearing, organic matter-rich slates. Synchronously, trace elements are released during ongoingweathering. Laser ablation ICP-MS analyses of a weathered and encrusted slate showed that major portionsof the V, Cu, As, Mo, Pb, Th, and U reside in the encrustation.Recently a potential relationship between several micrometer to 500 nm surface topography roughness ofsuch encrustations and its uranium concentration was shown. Based on laser scanning microscopymeasurements, the present study shows that this interrelation must be expanded to small submicron-sizedhalf-pores with diameters between 100 nm and 500 nm. We demonstrate that the relationship is not limitedto topography variations of a single encrustation in the hand-specimen scale. Surface topography andgeochemical analyses of iron oxide encrustations from several locations but from the same geochemicalenvironment and with similar weathering history showed that the concentrations of U, P, Cu, and Zncorrelate inversely with the surface roughness parameter F. This parameter represents the total surface areaand is – in this case – a proxy for the root-mean square surface roughness Rq.This study substantiates the environmental importance that micrometer- to submicrometer topographyvariations of fluid-rock interfaces govern the trapping of trace elements.
© 2009 Elsevier B.V. All rights reserved.
1. Introduction
The reactivity of fluid-rock interfaces governs the interactionprocesses between rocks and dissolved and suspended fluid load.Fundamental knowledge about the totality of chemical and physicalconstraints to surface reactivity is a prerequisite to understand whatinteraction processes are dominant for a particular reaction.
Our study tests the general influence of iron oxide topography ontrace element trapping in the environment. In contrast to molecularscale-related dissolution and/or precipitation processes relativelylittle is known about how micron to submicron scaled roughness andtopography influence rock surface reactivity with respect to smallparticles. Micron- and submicron-sized particles (colloids) areubiquitous in natural waters. Field and laboratory experiments haveidentified colloid-facilitated transport of low-solubility contaminantsas an important mechanism of contaminant migration throughgroundwater (e.g. Adamczyk et al., 2003). Theoretical considerationsby Bhattacharjee et al. (1998) and calculations based on surface
um der Universität Göttingen,tstr. 3, D-37077 Göttingen,
ll rights reserved.
topography investigations by Hoek et al. (2003) both showed how themorphological heterogeneities of interfaces influence the colloid-surface interaction energy. Therefore most likely surface topographyvariations of minerals and rock interfaces in the size-range of suchparticles will strongly influence their interaction processes.
As an example Fischer et al. (2008) quantified roughness andtopography variations of a single natural iron oxide precipitation andshowed an inverse correlation of the iron-normalized U concentrationand the surface size and roughness variations. Here we ask thequestion if this interrelation is of general importance. Therefore weexamine the relationship between trace element concentrations andtopography parameters of encrustations formed during the sameoxidative weathering process of the same rock type but from severaloutcrops (Fischer and Gaupp, 2005; Fischer et al., 2007b).
We examined iron oxide encrustations formed on black slates.Black slates were chosen because of their high trace elementconcentrations (Turekian and Wedepohl, 1961). Due to oxidativeweathering of black slates, iron sulfides were oxidized and iron oxideencrustations precipitated. The encrustations occur at natural orartificial high-permeability zones within the rock (Fig. 1A). Acid con-ditions due to iron sulfide weathering cause the mobilization of traceelements in black slates (Tuttle et al., 2001). During transport, thetrace-element rich fluid load is in contact with the rock surface at

Fig. 1. (A) Iron oxides formed on oxidative weathered black slate. The so-called Alex-ander von Humboldt gallery of the abandoned Morassina alum slate mine (Thüringen,Germany) was mined in 1791. Since then, iron oxides were formed on high-permeability zones in the slate due to oxidative weathering. (B) Thin-sectionmicrograph of an iron oxide encrustation formed on oxidative weathered slate.Encrustations are often several tens to hundreds of micrometers thick and cover therock volume. Therefore the fluid-rock interface is a fluid-iron oxide interface.
4704 C. Fischer et al. / Science of the Total Environment 407 (2009) 4703–4710
high-permeability zones. Thus for this example the fluid-rockinteraction is mainly a fluid-iron oxide interaction.
2. Material and methods
2.1. Material
We investigated iron oxide encrustations from four locations(Appendix) formed on weathered black slates (Littke et al., 1991;Petsch et al., 2000). The alum slates (Thüringisches Schiefergebirge,Germany) are of Silurian and Lower Devonian age. The encrustationsare several tens to hundreds of micrometers thick (Fig. 1B). Amineralogical characterization by X-ray diffraction of the herediscussed encrustations is given in Fischer et al. (2008). Theencrustations consist of goethite, X-ray amorphous iron oxide,schwertmannite, and jarosite. The samples represent the variety ofiron oxides found in the geochemical environment of oxidative blackslate weathering.
2.2. Methods
2.2.1. Whole encrustation trace element geochemistryEncrustations were scraped off the sample surface to determine
the chemical composition of the whole encrustation. The purity waschecked under a binocular microscope to minimize contamination bythe slate substrate. The size of a scraped encrustation area was20×20 mm2. 10 mg of each sample was first treated with a mixture of3 ml HF (40%), 2 ml HNO3 (65%), 3 ml HClO4 (70%) for 12 h at 150 °C.Afterwards, the acids were fumed off at 180 °C for 29 h. The precipitatewas redissolved with 0.25 ml HCl (37%) and 0.5 ml HNO3 (65%) at150 °C for 2 h. The solutions were diluted to 50 ml. All acids used wereof p.a. grade purified by sub-boiling distillation. The subsamples wereanalyzed for P, V, Fe, Ni, Cu, Zn, Mo, and U concentrations. The P, Fe, Ni,and Cu concentration were determined by measurements with aPerkin Elmer Optima 3000 DV ICP-OES in axial view mode. The Mo, V,and U concentrations were determined using an ICP-MS (PerkinElmer, ELAN DRC II). The analytical accuracy (checked with interna-tional standards JSL-1, JSL-2, and the in-house standard TW-59) isbetter than 91% (P), 36% (V), 9% (Fe), 36% (Ni),18% (Cu), 31% (Zn), 87%(Mo), and 28% (U).
2.2.2. Laser ablation ICP-MSAn encrustation profile of a polished sample was analyzed to
obtain information about element abundance patterns. The laserablation profile was analyzed by ICP-MS (Perkin Elmer, ELAN DRC II)for various elements measuring the isotopes 27Al, 29Si, 31P, 51V,57Fe,60Ni, 63Cu, 66Zn, 75As, 95Mo, 139La, 140Ce, 208Pb, 232Th, and 238U. Thelaser ablation system is based on an Excimer UV laser systemworkingat a wavelength of 193 nm. Output power was 145 mJ. Pulse repetitionrate was 7 Hz. Sample movement was 1 μm/s. Aperture was set togenerate an ablation crater with diameter of 10 μm.
The natural sample material contains no internal standard, there-fore the isotope intensity profile provides information about theelement abundance as a function of the profile length but noinformation about the absolute concentration. The intensity profileswere used to identify and compare the spatial distribution pattern.
The laser beam spot size of 10 µm convolutes the data at materialboundaries. We therefore defined the contact between two types ofmaterials to begin 5 µm after the initial rise of a characteristicelement abundance (50% of the laser beam diameter). As an exam-ple, the iron oxide encrustation in Fig. 2B starts physically 5 µm afterthe initial increase of the Fe abundance (dashed line). This meansthat the center of the laser beam is then exactly in the position of theouter edge of the encrustation. This is how we defined the totallength of the iron-rich encrustation, the phosphorus-rich encrusta-tion (dotted line), as well as the border between encrustation andslate material.
2.2.3. Surface topography methods and quantificationIn this study, we have used two different light optical microscopy
methods for surface topography measurement and quantification. Weused vertical scanning interferometry [VSI] and confocal laserscanning microscopy [LSM]. LSM has a higher lateral (100 nm vs.500 nm) but lower vertical resolution (100 nm vs. 2 nm). For VSI weused a MicroXAMMP8 VSI, ADE Phase Shift; for a detailed descriptionsee, for example, Lüttge and others (1999). For LSMwe used is a ZEISSLSM 510 Meta with a EC-Epiplan-Apo 100×0.95 HD DIC objective,beam splitters MBS NT80/20, DBS plate with a laser wavelength of405 µm and a pinhole size of 52 µm. LSM scanning was performedusing the 12 bit multi track stack scan mode of a sampling area of92.1 µm×92.1 µm. The pixel scaling was 0.09 µm×0.09 µm×0.1 µm.Three-dimensional surface measurements by LSM were described byHamilton and Wilson (1982).
A comprehensive quantification and understanding of surfaceroughness parameters allows a quantitative comparison of surface

Fig. 2. A BSE image of an encrustation (white) precipitated on a weathered black slate (gray). Arrow 1 and 2 show the position of the LA-ICP-MS profile line 1 (Fig. 2B: isotopeabundances in encrustation as well as slate) and line 2 (Fig. 2C: iron abundance, used for Fig. 3). Laser ablation scan of line 1 starts outside the encrustation (see element abundancecurve of, e.g., Fe). Line 1 ends in the slate (see, e.g., Al and Si abundances). Spot size of the ablation profile is 10 µm and scan rate is 1 µm/s.
4705C. Fischer et al. / Science of the Total Environment 407 (2009) 4703–4710
topography variations. We apply converged surface roughness andtopography parameters, calculated from data sets measured by VSIand LSM. Details about the application of converged surface roughnessparameters for rock surface topography analysis are given by Fischer &Lüttge (2007a). We characterize surface topography by using sets ofnumerical parameters derived from statistical calculations of surfacedeviations. The so-called S-parameter set contains 15 parameters ofdifferent types (amplitude, spacing, hybrid, fractal dimension para-meters (Blunt, 2003)). For surface topography characterization and
quantificationwe use amplitude surface topography parameters. Suchparameters are widely applied for characterizing surface topographyvariations in the field of material and surface sciences (Dong et al.,1992, 1993, 1994a, 1994b; Thomas, 1999). A detailed characterizationof the range of amplitude surface topography parameters of naturaliron oxide samples, measured by VSI and LSM, is given by Fischer et al.(2008).
To characterize topography variations we utilize the ten-pointpeak-to-valley average depth (Rz), root-mean-square deviation of the

4706 C. Fischer et al. / Science of the Total Environment 407 (2009) 4703–4710
surface (Rq), and interfacial area ratio (F). Below, we give a shortexplanation for these surface topographic parameters. Calculationalgorithms are explained by Thomas (1999).
Fig. 3. Abundance of elements U (A), P (B), Mo (C), Cu (D), Zn (E), and Ni (F) as a
The ten-point height, Rz, is defined as the average height deviationof the five highest (peak) local maxima plus the average heightdeviation of the five lowest (valley) local minima from a zero plane. Rz
function of the abundance of iron of laser ablation data of profile 2 (Fig. 2C).

Fig. 4. (A) Surface roughness parameters Rq and Rz as a function of surface ratio F,calculated from LSM data. The range of F is higher compared to (C). A correlationbetween of root-mean square roughness Rq and ten-point height Rtwith surface ratio Fwas found. (B) Alterations of surface roughness parameters (Rq, Rz, and F) asconsequences arising out of surface topography changes, indicated by topographysketches. (C) Root-mean square roughness Rq and ten-point height Rz as a function ofsurface ratio F. Roughness parameters were calculated from VSI x, y, z data sets. Thesurface topography parameter F correlates well with Rq and Rz. Note the slope change,indicated by the gray dashed line, compared to Fig. (A).
4707C. Fischer et al. / Science of the Total Environment 407 (2009) 4703–4710
therefore provides information about the maximum surface devia-tions. Root-mean square surface roughness Rq is also an amplitudeparameter and is used to describe dispersion of the height distributionof a surface. It is the sample standard deviation and describes thedeviation of measured surface sites from a reference surface. Thesurface area ratio, F, expresses the ratio between themeasured surfacearea, Fm, and the area of the flat xy plane, that is the sampling area, F0.For a totally flat surface, the total and geometrical surface area and thesampling area are the same (F=1). The parameter F therefore isproportional to the total surface area.
3. Results and discussion
3.1. Trace element pattern of an iron oxide encrustation
The spatial distribution of several elements (Al, Si, P, V, Fe, Ni, Cu,Zn, As, Mo, La, Ce, Pb, Th, and U) was analyzed in order to determinepotential coexistence of elements as well as geochemical inhomo-geneities of the analyzed encrustation. Fig. 2A shows the BSE image ofan X-ray amorphous iron oxide encrustation. The encrustationprecipitated on a weathered black slate surface (Fig. 1). The data inFig. 2B represent a laser ablation ICP-MS profile of 80 µm in length. Theprofile contains the newly-formed encrustation as well as the slate.Because no internal standard exists for such an inhomogeneous(multi-mineral) sample no element concentrations can be calculated.We therefore used the detected ICP-MS intensities for each element tocompare the abundances in different substrates. Compared to theblack slate section, the encrustation section of the profile showsclearly high abundances of Fe, P, V, Fe, Cu, As, Mo, Pb, Th, and U. Incontrast, Al, Si, Ni, Zn, La, and Ce are low in the encrustation.
Several trace elements do not show a congruent patternwithin theencrustation. The elements P, V, As, and Mo show their highestabundances in the lower part of the encrustation (Fig. 2B, profilesection between the dotted line and the dot-and-dashed line). Themajor portions of the elements Fe, Cu, and U were found, however, inthe upper part of the encrustation. We conclude that two majorprocesses are responsible for trace element enrichment in theencrustation.
The incongruent shape of P and Fe abundances supports theinterpretation about newly-formed phosphate minerals as a part ofthe encrustation. This agrees with Fischer et al. (2009) who identifieda newly-formed Fe3+ phosphate mineral as part of encrustations ofthese weathered black slates. The maximum of P abundance withinthe highlighted area of Fig. 2B (“encrustation”) was found below theFe abundance maximum. This suggests the P-bearing mineral to beolder and the iron oxide mineral younger. Congruent shapes of Fe andtrace element abundances support the interpretation of the occur-rence of element incorporation into newly-formed iron oxide.
Fig. 2C shows the iron abundance (counts per second [cps]) of aLA-ICP-MS profile line (#2) within an encrustation. The profile startsin the center of the encrustation and ends outside of the upperboundary of the encrustation (low/ no Fe content). In Fig. 3 theabundances of several elements are shown as a function of Feabundance (data from encrustation section of profile line #2). Theuranium abundance (Fig. 3A) correlates linear with the ironabundance but shows a broad scatter (R2=0.7). The scatter indicatesthat not only the iron concentration is responsible for the actual Uconcentration of the encrustation. The P abundance (Fig. 3B) shows ascattered pattern but no clear linear correlationwith the Fe abundance(R2=0.5). The detection of P in a section of the encrustation free of Feindicates again the occurrence of a newly-formed phosphor mineral.
Fig. 3C shows the Mo abundance as a function of Fe abundance. Nocorrelation was found (R2=0.1). Similar results occur for theabundance of Ni (R2=0.1). (Fig. 3F). Fig. 3D shows the abundanceof Cu as a function of Fe abundance. The Cu abundance correlateslinear with the iron abundance (R2=0.7). A broad scatter exists for
higher abundances, similar to U in Fig. 3A. The broad scattered Znabundance shows no correlation with the iron abundance (R2=0.3).
Our conclusion is that a first order correlation of Fe with U, Cu andpotentially P exists. However, the broad scatter of the data indicatesadditional processes may also be present.
3.2. Surface topography characterization of encrustations
Further we wanted to test the recently discussed influence of thesub-micron surface topography (Fischer et al., 2008) on the traceelement concentration in iron oxide encrustations.

4708 C. Fischer et al. / Science of the Total Environment 407 (2009) 4703–4710

4709C. Fischer et al. / Science of the Total Environment 407 (2009) 4703–4710
Fig. 4A shows surface roughness Rq and ten-point surface heightRz as a function of the surface area ratio F. The amplitude parametersRq and Rz provide information about the vertical size of surface half-pores. For an explanation see the topography profile sketches inFig. 4B. Low Rq and Rz values are typical for flat half-pores. High F dataindicate the occurrence of a high frequency of half-pores. The highnumber of half-pore walls is responsible for the enlargement of thetotal surface area.
Both Rq and Rz results calculated from LSM data indicate a halfpore height in themicron to submicron size. Rzmeasures the height ofthe five biggest half-pores of each sample and is between 0.1 µm and1 µm. Rq expresses the surface topography standard deviation and is0.15–0.4 µm. These data are in good agreement with VSI surfacetopography data from the literature (Fischer et al., 2008), Fig. 4C.
The new LSM surface topography data show in part high F values(F~1–4) (Fig. 4A and dotted line in Fig. 4C). In contrast to VSI data, theLSM data contain information about surface details of a lateraldimension between 100 nm and 500 nm. The new F data thereforeprovide information about the contribution of small half-pores to thetotal surface area. The depth of the new detected half-pores with smalldiameter is, however, similar to the depth of the wide half-poresbecause of the similarity of Rq calculations from VSI and LSM data.
Because of this new and important surface topography informationby LSM data we will apply F data of encrustation topographies to testthe potential interrelation between surface topography and traceelement concentrations.
3.3. Surface topography vs. encrustation trace element concentrations
We tested the correlation between F, the surface area ratio, and thetrace element concentrations of four encrustations. Element concen-trations were normalized for the iron concentration to avoidconcentration variations due to impurities of the encrustation, e.g.,by slate material (substrate). Such impurities would interfere the bulktrace element concentrations of the iron oxide encrustation. A secondnormalization (BET surface area of the encrustation) was used toexclude a potential impact on the variation of trace element concen-trations by the frequency of mesopores and micropores (db50 nm)(IUPAC, 1994) of the encrustations (Cornell and Schwertmann, 1996;Weidler, 1997). Therefore the element concentrations cnorm in Fig. 5are expressed according to eq. (1).
cnorm =celement
ciron4ABET: ð1Þ
Fig. 5A shows the uranium concentration of four encrustations as afunction of F. F was calculated from x, y, z data measured by the VSItechnique, which provides a lateral resolution of approx. 500 nm.Within this resolution F variations of the samples are relatively small(F~1.1 to 1.5). Due to the insight about the contribution of small(db500 nm) half-pores to the amount of F (see Fig. 4) we comparedVSI and LSM based F data. Additionally the F data and U concentrationrange from the mentioned previous study is shown (bold gray line).Fischer et al. (2008) found a linear (inverse) relationship between thenormalized U concentration of the encrustation and F. Now, the LSMdata confirm and expand this relationship for the U concentration forfour samples from different locations (Fig. 5B). Moreover, thecorrelation is valid for a broader range of F. This suggests that theprocess responsible for the correlation is sensitive for vertical andlateral surface topography deviations in the range of 100 nm to 1 µm.
Fig. 5. Fig. A shows Fe- and nitrogen BET surface area normalized concentrations of U againstthe other figures, based on LSM data. For comparison, the bold gray line shows the narrow VFigures B-H: Fe- and nitrogen BET surface area normalized concentrations of U, P, Mo, Cu, V,surface topography measurements. Comparison between VSI and LSM data of F is given for
Fig. 5C, E, and G show similar trends for the correlation between P,Cu, and Zn concentrations and the surface roughness parameter F. Theelements Mo, V, and Ni (Fig. 3D, F, H) show in part a similar behaviorbut no clear correlation was found.
The results and interpretations are based on samples from onlyfour locations. The reason for this limited number of samples is alimitation of the availability. From the geological context we know,however, that all analyzed encrustations were formed during similargeochemical conditions. As an example, significant variations in pH(e.g., caused by the common occurrence of CaCO3 concentrationvariations of such slates) would affect the evolution of iron oxideencrustations (Cornell and Schwertmann, 1996) and would thereforealso alter constraints to the trace element geochemistry. For thatreason we limited the chosen samples to a well-defined naturalenvironment of oxidative black slate weathering.
4. Conclusions
With the study presented here, the previously suggested inter-relation between micrometer to submicrometer surface roughnesstopography of natural iron oxide encrustations and its uraniumconcentrations was confirmed to be of general importance. Wedemonstrated that the interrelation is important for a broader rangeof surface topography variations. The interrelation occurs for smallhalf-pores (100 nmbdb500 nm) and was found for U, P, Cu, and Zn.Iron oxide encrustations from four locations but from the samegeochemical milieu showed this correlation. Therefore we concludethat the interrelation between submicron iron oxide topography fromhigh-permeability zones in rocks and their trace element concentra-tion could be important as to be a general mechanism.
We have substantiated the mentioned interrelation but have notyet deciphered the process responsible. Due to the size of surfacetopography variations reported here, most probably the interaction ofsmall particles (colloids) in the fluid with the rock surface topographyis responsible for the trace element concentration variations pre-sented here. Therefore detailed experimental investigations about theinteraction processes of colloids and rough iron oxide surfaces willhelp to understand the mentioned process in more detail. Addition-ally, for a fundamental understanding of themineral surface processesin the micron/ submicron scale, quantitative information aboutsurface topography alterations regarding the complex interaction ofliving microbes with the solid surfaces are necessary (e.g., Benzeraraet al., 2008).
In general, we conclude that micrometer- to submicrometertopography variations of fluid- rock interfaces may have an importantenvironmental impact.
Acknowledgements
The authors thank H. v. Eynatten and H. Ruppert (Georg-August-Universität Göttingen) for fruitful discussions and two anonymousreviewers for helpful comments that considerably improved thispaper. We thank P. Weidler (Forschungszentrum Karlsruhe), A. Kronz,and Kl. Simon (Georg-August-Universität Göttingen) for analyticalassistance. The authors would like to acknowledge gratefully supportfor this study from the Deutsche Forschungsgemeinschaft (DFG)[grants Fi 1212/1 and Fi 1212/2] and the Alexander von HumboldtFoundation (Feodor Lynen Fellowship to CF).
F values calculated from VSI measurements. Note the narrow F data range compared toSI data range of a single X-ray amorphous iron oxide encrustation (Fischer et al. (2008).Zn, and Ni concentrations against surface topography parameter F calculated from LSMthe uranium concentrations.
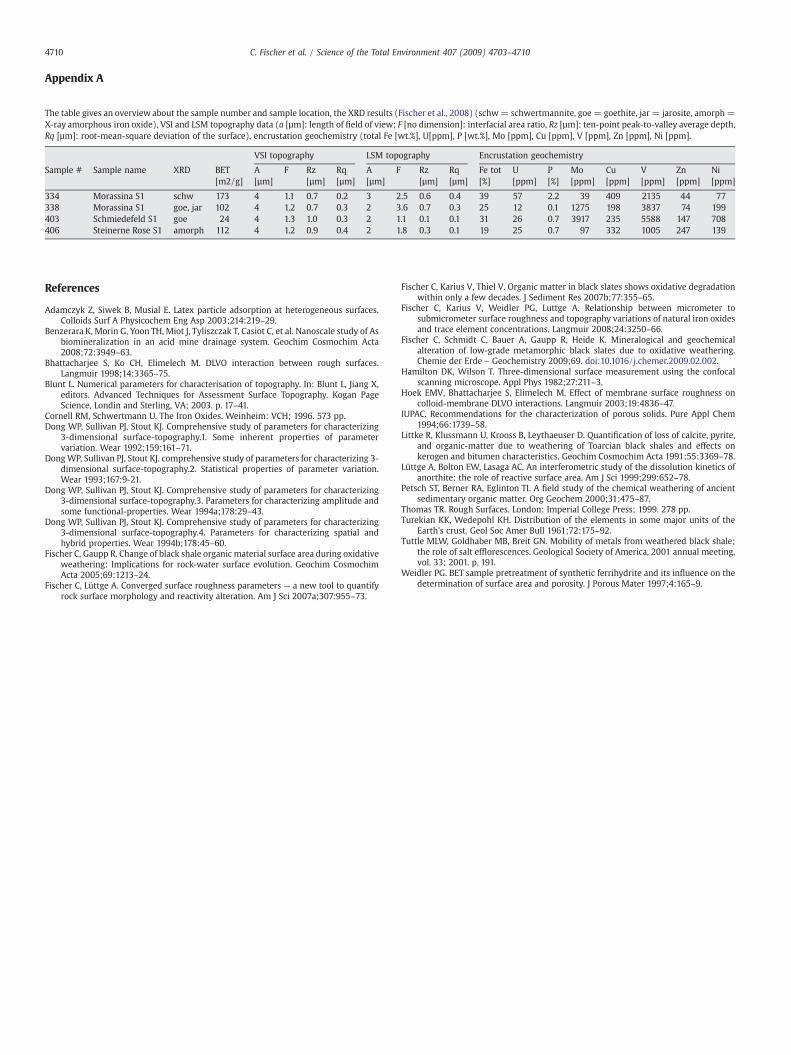
Appendix A
The table gives an overview about the sample number and sample location, the XRD results (Fischer et al., 2008) (schw= schwertmannite, goe= goethite, jar = jarosite, amorph=X-ray amorphous iron oxide), VSI and LSM topography data (a [µm]: length of field of view; F [no dimension]: interfacial area ratio, Rz [µm]: ten-point peak-to-valley average depth,Rq [µm]: root-mean-square deviation of the surface), encrustation geochemistry (total Fe [wt.%], U[ppm], P [wt.%], Mo [ppm], Cu [ppm], V [ppm], Zn [ppm], Ni [ppm].
VSI topography LSM topography Encrustation geochemistry
Sample # Sample name XRD BET[m2/g]
A[µm]
F Rz[µm]
Rq[µm]
A[µm]
F Rz[µm]
Rq[µm]
Fe tot[%]
U[ppm]
P[%]
Mo[ppm]
Cu[ppm]
V[ppm]
Zn[ppm]
Ni[ppm]
334 Morassina S1 schw 173 4 1.1 0.7 0.2 3 2.5 0.6 0.4 39 57 2.2 39 409 2135 44 77338 Morassina S1 goe, jar 102 4 1.2 0.7 0.3 2 3.6 0.7 0.3 25 12 0.1 1275 198 3837 74 199403 Schmiedefeld S1 goe 24 4 1.3 1.0 0.3 2 1.1 0.1 0.1 31 26 0.7 3917 235 5588 147 708406 Steinerne Rose S1 amorph 112 4 1.2 0.9 0.4 2 1.8 0.3 0.1 19 25 0.7 97 332 1005 247 139
4710 C. Fischer et al. / Science of the Total Environment 407 (2009) 4703–4710
References
Adamczyk Z, Siwek B, Musial E. Latex particle adsorption at heterogeneous surfaces.Colloids Surf A Physicochem Eng Asp 2003;214:219–29.
Benzerara K, Morin G, Yoon TH, Miot J, Tyliszczak T, Casiot C, et al. Nanoscale study of Asbiomineralization in an acid mine drainage system. Geochim Cosmochim Acta2008;72:3949–63.
Bhattacharjee S, Ko CH, Elimelech M. DLVO interaction between rough surfaces.Langmuir 1998;14:3365–75.
Blunt L. Numerical parameters for characterisation of topography. In: Blunt L, Jiang X,editors. Advanced Techniques for Assessment Surface Topography. Kogan PageScience, Londin and Sterling, VA; 2003. p. 17–41.
Cornell RM, Schwertmann U. The Iron Oxides. Weinheim: VCH; 1996. 573 pp.Dong WP, Sullivan PJ, Stout KJ. Comprehensive study of parameters for characterizing
3-dimensional surface-topography.1. Some inherent properties of parametervariation. Wear 1992;159:161–71.
DongWP, Sullivan PJ, Stout KJ. comprehensive study of parameters for characterizing 3-dimensional surface-topography.2. Statistical properties of parameter variation.Wear 1993;167:9-21.
Dong WP, Sullivan PJ, Stout KJ. Comprehensive study of parameters for characterizing3-dimensional surface-topography.3. Parameters for characterizing amplitude andsome functional-properties. Wear 1994a;178:29–43.
Dong WP, Sullivan PJ, Stout KJ. Comprehensive study of parameters for characterizing3-dimensional surface-topography.4. Parameters for characterizing spatial andhybrid properties. Wear 1994b;178:45–60.
Fischer C, Gaupp R. Change of black shale organic material surface area during oxidativeweathering: Implications for rock-water surface evolution. Geochim CosmochimActa 2005;69:1213–24.
Fischer C, Lüttge A. Converged surface roughness parameters — a new tool to quantifyrock surface morphology and reactivity alteration. Am J Sci 2007a;307:955–73.
Fischer C, Karius V, Thiel V. Organic matter in black slates shows oxidative degradationwithin only a few decades. J Sediment Res 2007b;77:355–65.
Fischer C, Karius V, Weidler PG, Luttge A. Relationship between micrometer tosubmicrometer surface roughness and topography variations of natural iron oxidesand trace element concentrations. Langmuir 2008;24:3250–66.
Fischer C, Schmidt C, Bauer A, Gaupp R, Heide K. Mineralogical and geochemicalalteration of low-grade metamorphic black slates due to oxidative weathering.Chemie der Erde – Geochemistry 2009;69. doi:10.1016/j.chemer.2009.02.002.
Hamilton DK, Wilson T. Three-dimensional surface measurement using the confocalscanning microscope. Appl Phys 1982;27:211–3.
Hoek EMV, Bhattacharjee S, Elimelech M. Effect of membrane surface roughness oncolloid-membrane DLVO interactions. Langmuir 2003;19:4836–47.
IUPAC. Recommendations for the characterization of porous solids. Pure Appl Chem1994;66:1739–58.
Littke R, Klussmann U, Krooss B, Leythaeuser D. Quantification of loss of calcite, pyrite,and organic-matter due to weathering of Toarcian black shales and effects onkerogen and bitumen characteristics. Geochim Cosmochim Acta 1991;55:3369–78.
Lüttge A, Bolton EW, Lasaga AC. An interferometric study of the dissolution kinetics ofanorthite: the role of reactive surface area. Am J Sci 1999;299:652–78.
Petsch ST, Berner RA, Eglinton TI. A field study of the chemical weathering of ancientsedimentary organic matter. Org Geochem 2000;31:475–87.
Thomas TR. Rough Surfaces. London: Imperial College Press; 1999. 278 pp.Turekian KK, Wedepohl KH. Distribution of the elements in some major units of the
Earth's crust. Geol Soc Amer Bull 1961;72:175–92.Tuttle MLW, Goldhaber MB, Breit GN. Mobility of metals from weathered black shale;
the role of salt efflorescences. Geological Society of America, 2001 annual meeting,vol. 33; 2001. p. 191.
Weidler PG. BET sample pretreatment of synthetic ferrihydrite and its influence on thedetermination of surface area and porosity. J Porous Mater 1997;4:165–9.