corporategovernance study: companyperformance study: thecorrelation between corporategovernanceand...
TRANSCRIPT

Corporate Governance Study:
The Correlation betweenCorporate Governance andCompany Performance
By.Lawrence D. Brown, Ph.D .Distinguished Professor of AccountancyGeorgia State University
Marcus L. CaylorPh.D. StudentGeorgia State University
Research study commissioned by:
IIISSINSTITUTIONAL SHAREHOLDER SERVICES
Copyright © 2004, Institutional Shareholder Services, Inc . All rights reserved . No part of this publication maybe reproduced or transmitted in any form or by any means, electronic or mechanical, including photocopying,recording, or any information storage and retrieval system ; without permission from the publisher. CGQ is aregistered trademark of Institutional Shareholder Services .
Institutional Shareholder Services, Inc . (ISS) is the world's leading provider of proxy voting and corporategovernance data services . ISS's proprietary rating system, Corporate Governance Quotient (CGQ®), ranks thecorporate governance performance of more than 7,500 companies worldwide, including the following indexes :S&P 500, S&P 600, S&P 400, Russell 3000, MSCI© EAFE (Europe, Asia and Far East) and S&P TSX CompositeIndex (Canada) . Considered to be the world's leading authority on corporate governance, ISS's CGQ isdesigned on the premise that good corporate governance ultimately results in increased shareholder value.
Note : An issuer may have purchased self-assessment tools and publications from ISS, or ISS's CorporatePrograms division may have provided advisory or analytical services to the issuer. Neither the issuer nor anycorporate programs division employee played a role in the preparation of the governance ratings . To inquireabout any issuer's use of ISS Corporate Program products, please email [email protected] .
This study was conducted with the assistance of a grant from Institutional Shareholder Services .
The work issolely that of the authors . ISS exercised no editorial control over the findings .
>>>The Correlation Between Corporate Governanceand Company Performance
SummaryWe first examined whether firms with weaker corporate governance perform more poorlythan firms with stronger corporate governance . We found firms with weaker corporategovernance to perform more poorly. They have lower stock returns in the preceding three,five and ten-year periods than do firms with stronger corporate governance . (See table 1,panel A) . For example, firms in the bottom decile of industry-adjusted CGQ° (CorporateGovernance Quotient) have 5-year returns that are 3.95% below the industry average, whilefirms in the top decile of industry-adjusted CGQ have 5-year returns that are 7.91 % abovethe industry-adjusted average.' The difference in performance between these two groups is11 .86% . (See table 2, panel A.)
International Business Machines Corp . (IBM) is an excellent example of good corporategovernance. It had an industry CGQ of 96.3, a 3-year return 11 .67% above the industryaverage, a 5-year return 5.90% above the industry average, and a 10-year return 19.09%above the industry average. Another example is Occidental Petroleum Corp. It had anindustry CGQ of 99.5, a 3-year return 24.35% above the industry average, a 5-year return9.75% above the industry average, and a 10-year return 5.72% above the industry average.An example of poor corporate governance is Sholodge, Inc . It had an industry CGQ of 5.1, a3-year return 7.55% below the industry average, a 5-year return 7.09% below the industryaverage, and a 10-year return 19.79% below the industry average. Another example isMediaBay, Inc. It had an industry CGQ of 9.6, a 3-year return 34 .84% below the industryaverage, and a 5-year return 38.78% below the industry average.
We next examined whether firms with weaker corporate governance are less profitable thanfirms with stronger corporate governance . We found firms with weaker corporate governanceto be less profitable . They have lower return on assets, lower return on average equity, lowerreturn on average investment, lower return on equity, and lower return on investment than dofirms with stronger governance . (See table 1, panel A) . Two examples follow. First, firms inthe bottom decile of industry-adjusted CGQ have returns on equity that are 4.86% below theirindustry-adjusted average, while those in the top decile of industry-adjusted CGQ havereturns on equity that are 18.98% above their industry-adjusted average, a performancedifferences of 23.84%. (See table 2, panel A.) Second, firms with weaker corporategovernance have a lower return on assets because they have lower net profit margins than dofirms with stronger corporate governance. (See table 1, panel B) . Firms in the bottom decileof industry-adjusted CGQ have net profit margins that are 6.38% above their industry-adjusted average, while those in the top decile of industry-adjusted CGQ have net profitmargins that are 21 .66% above their industry-adjusted average a performance difference of28.04% . (See table 2, panel B) .
1 .
Corporate Governance Quotient (CGQ) is a rating system designed to assist institutional investors in evaluating the quality ofcorporate boards and the impact their governance practices may have on performance . The CGQ uses a comprehensive set ofobjective and consistently applied criteria to each of the companies rated .

Continuing with our previous examples, IBM had a return on equity that was 70.75% abovethe industry average, and a net profit margin 64.76% above the industry average. Occidentalhad a return on equity that was 29.31 % above the industry average, and a net profit margin23.18% above the industry average. Sholodge had a return on equity that was 29.57% belowthe industry average, and a net profit margin 70.19% below the industry average . MediaBayhad a return on equity that was 30 .83% below the industry average, and a net profit margin5.84% below the industry average.
Third, we examined if firms with weaker corporate governance are riskier than firms withstronger corporate governance . We found firms with weaker corporate governance to beriskier. Three examples follow. First, firms with weaker corporate governance have moreshare price volatility than do firms with stronger corporate governance .2 (See table 1, panelA) . Firms in the bottom decile of industry-adjusted CGQ have share price volatility that is6.20% above their industry-adjusted average, while those in the top decile of industry-adjusted CGQ have share price volatility that is 5.63% below their industry-adjusted averagea performance difference of 11 .83% . (See table 2, panel A.) Second, firms with weakercorporate governance are riskier based on two of the three risk measures considered byFama and French (1992) in their highly influential study, namely, they have lower price-to-bookratios and they are smaller. (See table 1, panel A) . Firms in the bottom decile of industry-adjusted CGQ have price-to-book ratios that are 0.55 below their industry-adjusted average,while those in the top decile of industry-adjusted CGQ have price-to-book ratios that are 0.59above their industry-adjusted average. (See table 2, panel A.) Third, firms with weakercorporate governance have less interest coverage and lower operating cash flow to currentliabilities than firms with stronger corporate governance . (See table 1, panel A) . For example,firms in the bottom decile of industry-adjusted CGQ have operating cash flow to currentliabilities that is 0.01 above their industry-adjusted average, while those in the top decile ofindustry-adjusted CGQ have operating cash flow to current liabilities that is 0.29 above theirindustry-adjusted average. (See table 2, panel B.) IBM's share price volatility was 2.65%below the industry average, a price-to-book ratio 2.41 above the industry average, and anoperating cash flow to current liability ratio 0.75 above the industry average . Occidental hada share price volatility that was 28.94% below the industry average, a price-to-book ratio 0.18above the industry average, and an operating cash flow to current liability ratio 0 .27 above theindustry average. Sholodge had a share price volatility that was 47.71 % above the industryaverage, a price-to-book ratio 1 .81 below the industry average, and an operating cash flow tocurrent liability ratio 0.27 below the industry average. MediaBay had a share price volatilitythat was 42 .55% above the industry average, a price-to-book ratio 1 .36 below the industryaverage and an operating cash flow to current liability ratio 0.34 below the industry average.
Fourth, we examined whether firms with weaker corporate governance pay out fewerdividends, exacerbating the principal-agency conflict which good corporate governanceseeks to alleviate (Easterbrook 1984 ; Jensen 1986). Indeed, we found firms with weakercorporate governance have lower dividend payouts and lower dividend yields than dofirms with stronger corporate governance. (See table 1, panel B) . For example, firms in thebottom decile of industry-adjusted CGQ have a dividend payout ratio that is 3.81 % belowtheir industry-adjusted average, while those in the top decile of industry-adjusted CGQ
2 .
The results also pertain to P/E, a risk measure highly correlated to P/B . They do not pertain to beta, the third, butleast important of the Fama-French (1992) risk measures .

have a dividend payout ratio that is 6.64% above their industry-adjusted average (See table 2,panel B) . IBM had a dividend payout ratio 16.91% above the industry average . Occidentalhad a dividend payout ratio 30.83% above the industry average. Sholodge had a dividendpayout ratio 13.33% below the industry average. MediaBay had a dividend payout ratio3.48% below the industry average.
Fifth, we examined which of the four corporate governance factors considered by InstitutionalShareholder Services (ISS) is the driving factor of our results . The four factors we examinedare board composition, compensation, takeover defenses, and audit. Board composition isthe most important factor we identified . The least important we identified is takeoverdefenses . (See table 3, panel B) .
ProceduresWe undertook two analyses . First, we related industry-adjusted CGQ scores to 15 industry-adjusted "fundamental" variables suggested by ISS, and to 20 other variables that wedeemed to be of interest . Second, we related all 35 fundamental variables to four aspects ofCGQ : board composition, compensation, takeover defenses, and audit.
CGQ scores and fundamentalsThe 35 fundamental variables were subjected to a cross-sectional analysis of all firms in theCGQ database (5,460 firms) as of September 26, 2003. We omitted observations in theextreme percentile of the fundamentals (1 percent on each side) . Please see the Appendix forresearch insight mnemonics.
1 . 15 variables suggested by ISS:a.
Four past returns measures : 1 year total return, 3 year total return, 5 year total return,10 year total return .
b. Five profitability measures : return on assets, return on average equity, return onaverage investment, return on equity, and return on investment .
c. Six risk measures : beta, max of volatility, z-score, price-to-book, price-to-earnings,market value of equity.
2. 20 variables we added:a. Three profitability measures : Net profit margin, total asset turnover, financial leverage .b. Four asset utilization measures : Receivables turnover, inventory turnover, fixed asset
turnover, accounts payable turnover.c . Six short-term liquidity risk measures: Current ratio, quick ratio, operating cash flow to
current liabilities, days to collect receivables, days to sell inventory, days payableoutstanding .
d. Two dividend measures : Dividend payout and dividend yield .e . Five long-term solvency risk measures : Debt-to-equity, total debt to tangible assets,
long-term debt to tangible assets, interest coverage (income), interest coverage (cash)
The procedure used to assess if there is a relation between industry-adjusted CGQ scoresand the 35 industry-adjusted fundamental variables follows .3 We ordered the industry-
3 .
In addition to industry-adjusted CGQ scores and industry-adjusted fundamentals, we related raw CGQ scores toraw fundamentals and index-adjusted CGQ scores to index-adjusted fundamentals . The results were moremeaningful [and more intuitively-appealing] using industry-adjustments so we report those only .

adjusted CGQ scores in descending order and compared the performance measures inextreme deciles to see if the performance measures were significantly different from eachother.4 For example, when examining return on assets, we compared the return on assets forfirms in the top industry-adjusted CGQ score decile with those in the bottom decile . We useda t-test to see if the mean value of the industry-adjusted return on assets in the top decile ofindustry-adjusted CGQ scores was significantly different from that in the bottom decile . Wealso correlated industry-adjusted CGQ scores with the 35 industry-adjusted fundamentalvariables, using both Pearson (parametric) and Spearman (non-parametric) correlations . Theresults for the correlations appear in table 1 ; those for the deciles in table 2.
Results for 15 variables suggested by ISSIf firms with worse corporate governance have lower past returns, industry-adjusted CGQscores should be positively related to industry-adjusted past returns. We obtain this result forall three of the longest past return measures, namely, 3 year total return, 5 year total return, 10year total return . Results for 1-year total return are inconclusive . The one-year year returnalso proxies for price momentum, a risk-factor (Carhart 1997) so one way to interpret thisresult is that 1-year return, a risk measure (not a performance measure), is unrelated tocorporate governance. (See table 1, panel A) . For evidence on results for each of the 10deciles, see table 2, panel A.
If firms with weaker corporate governance are less profitable, industry-adjusted CGQ scoresshould be positively related to industry-adjusted profitability measures. We obtain this resultfor all five of the profitability measures we examine: return on assets, return on average equity,return on average investment, return on equity, and return on investment . (See table 1, panelA) . For information on deciles, see table 2, panel A.
If firms with weaker corporate governance are riskier, industry-adjusted CGQ scores shouldbe negatively related to industry-adjusted betas (increases in beta increase risk) and industry-adjusted max of volatility (increases in stock price volatility increase risk, and positively relatedto z-score (bankruptcy risk increases as z-score decreases), price-to-book (firms with lowerprice-to-book ratios are more risky), price to earnings (firms with lower price-to-earningsratios are more risky), and market value of equity (larger firms are less risky) . We obtain thisresult for five of the six risk measures. Only beta, the least important of the Fama-French riskmeasures, has the `wrong' sign . (See table 1, panel A) . For information on deciles, see table2, panel A.
Results for additional 20 variablesWe discuss results for those five variables that are both significant with their expected sign intable 1, panel B .5
The profitability measure, return on assets (shown to be significant in table 1, panel A) equalsnet profit margin times total asset turnover. 6 Table 1, panel B shows that firms with weaker
4 .
5 .
6 .
We examined quintiles and halves for the first 15 fundamentals (please see interim report) but we only examineddeciles for the next 20 fundamentals so we only include deciles in the final report .We could add discussion of variables that are significant with the desired sign if we focus only on Spearmancorrelations [see the notes to the table], but for conservatism's sake only discuss variables having the expectedSpearman and Pearson correlations .This is the well-known Dupont equation, developed in the 1940s .

governance have lower profit margins. Table 2, panel B provides decile results .
Two of the long-term solvency ratios, interest coverage (cash) and operating cash flow to totalliabilities, have the `correct sign,' suggesting that firms with weaker governance are riskierthan those with stronger governance. See table 1, panel B for correlation results and table 2,panel B for decile results .
Firms with poorer governance have lower dividend payouts and lower dividend yields than dofirms with stronger governance . See table 1, panel B for correlation results and table 2, panelB for decile results .
Why firms with weaker governance perform more poorly, are less profitable, more risky,and have lower dividends than firms with better governance:
ISS identifies four measures of corporate governance: board composition, compensation,takeover defenses, and audit.? To determine which aspects of corporate governance are mostimportant for explaining our results, we regressed each of the 35 industry-adjustedfundamental variables on industry-adjusted board composition, compensation, takeover, andaudit. Our findings appear in table 3, panel A, for the original 15 variables, and in table 3,panel B, for the additional 20 variables .
Panel A reveals that board composition has the expected result in 13 of 15 cases . These arethe same 13 cases where the relation between CGQ and fundamentals are as expected (seetable 1, panel A) . The result is perverse for 1-year total returns and insignificant for beta .However, if 1-year returns are considered as a risk-proxy (Carhart 1997) rather than aperformance measure, this result suggests that firms with better boards are less risky .
Compensation has the expected result in seven of 15 cases . These seven cases are a subsetof the 11 cases that `worked' for board compensation : three return measures (3-year totalreturn, 5-year total return, and 10-year total return), two profitability measures (return onaverage equity and return on average investment), and two risk measures (price-to-book andmarket value of equity) .
Takeover defenses has the expected result in only one of 12 cases, 1-year total return . Audithas the expected result in four cases, two returns measures (1 year total return and 5 yeartotal return) and two risk measures (price-to-book and market value of equity) .
Panel B of table 3 shows that board composition has the expected result for all five of the 20additional measures for which we obtained the expected result in table 1, panel B, namely netprofit margin, interest coverage (cash), operating cash flow to current liabilities, dividendpayout and dividend yield .
Compensation has the expected result for two of the five additional measures for which weobtained a significant relation in table 1, panel B, namely dividend payout and dividend yield .
7 .
They also have finer breakdowns, based on eight measures and 61 measures . We confined our analysis to thefour measures .

Takeover defenses are perverse once again. It has an unexpected result for all five of themeasures for which we obtained the expected result in table 1, panel B, namely net profitmargin, interest coverage (cash), operating cash flow to current liabilities, dividend payout anddividend yield .
Audit is not significant with its expected sign for any of the 20 additional measures.
In sum, board composition is the most important factor, compensation is the next mostimportant factor (a distant second), audit is the third most important factor, and takeover is (atbest) unimportant or (at worst) perverse .
Notes
1 . Our results pertain to a point in time, namely, September 26, 2003 and may not pertain toother time periods. We have no reason to believe that our results are unique to thisparticular time period, and we are in the process of verifying that our results are robust toother time periods.
2 . We conduct our analyses using the entire data set. They may not pertain to subsets of thedata (e.g ., industries, indices) .
3 . Our results are based on univariate analyses, namely correlations, deciles, andregressions. They may not pertain to multivariate analyses.
4.
We assume that the data we use are reliable, both the CGQ scores provide by ISS andthe fundamental variables obtained from research insight.
5. We assume that high (low) CGQ scores indicate superior (inferior) corporate governance.
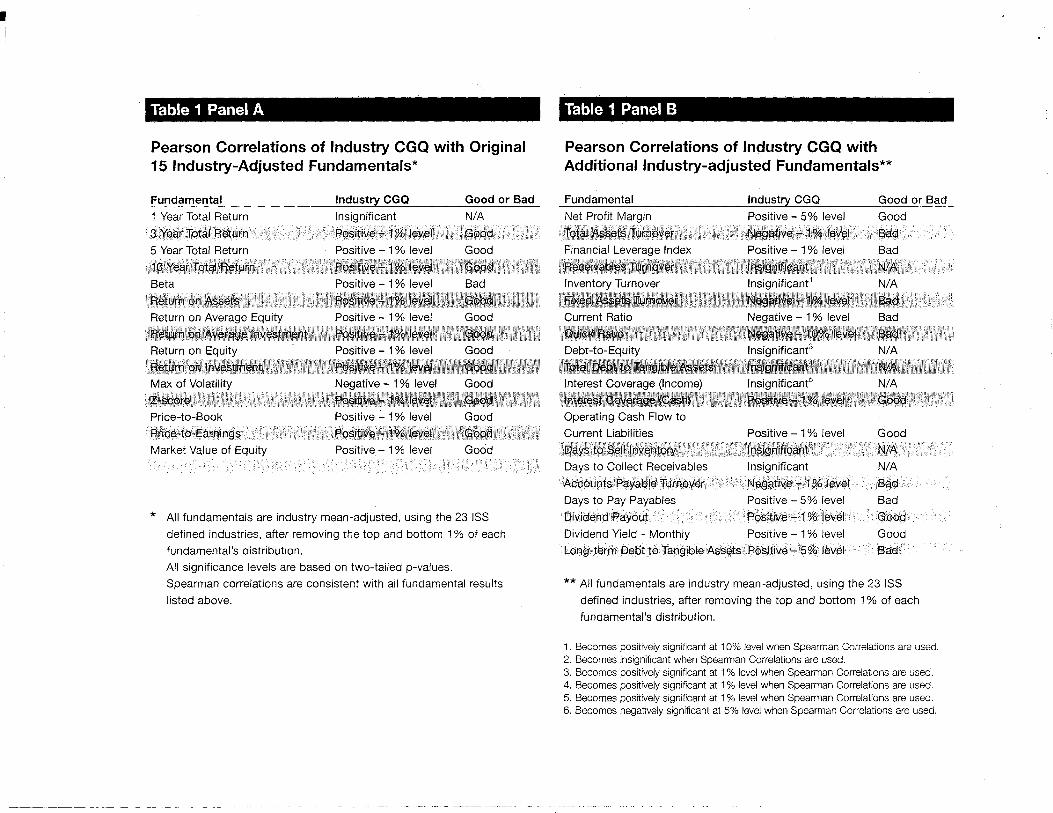
Table 1 Panel A
Pearson Correlations of Industry CGQ with Original15 Industry-Adjusted Fundamentals*
Fundamental1 Year Total Return3 Year Total Return5 Year Total Return10 Year Total ReturnBetaReturnReturnReturnReturnReturnMax of VolatilityZ-scorePrice-to-BookPrice-to-EarningsMarket Value of Equity
on Assetson Average Equityon Average Investmenton Equityon Investment
Industry CGQInsignificantPositive - 1 % levelPositive - 1 % levelPositive - 1 % it,,ualPositiv- -Positive -Positi~- -Positive -P . :it,,Posifiv~=-~JPositive -Positive - 19/,, levelPositive- 1 % levelPositive - 1 % level
ellevellevel
Ile~.-eI
All fundamentals are industry mean-adjusted, using the 23 ISSdefined industries, after removing the top and bottom 1 % of eachfundamental's distribution .All significance levels are based on two-tailed p-values .Spearman correlations are consistent with all fundamental resultslisted above .
Good or BadN/AGoodGoodGoodBadGoc :d
Oo~~~f
Good
Table 1 Panel B
Pearson Correlations of Industry CGQ withAdditional Industry-adjusted Fundamentals**
Total Debt to T3iilit le Assetst
Ir ~t rest C
< r ~.c e ~~
.shlOperating Cash Flow toCurrent LiabilitiesDays to Sell InventoryDays to Collect ReceivablesAccounts Payable TurnoverDays to Pay PayablesDividend PayoutDividend Yield - MonthlyLong-term Debt to Tangible Assets Positive - 5% level
Insiuiiih_antInsignificant'lr s ;gr~ ma.~tPositivC 1 ,,level
Positive - 1 % levelInsignificant`'InsignificantNegative - 1 % levelPositive - 5% levelPositive - 1 % levelPositive - 1 % level
d or Badd
GoodN/AN/ABadBadGoodGoodBad
** All fundamentals are industry mean-adjusted, using the 23 ISSdefined industries, after removing the top and bottom 1 % of eachfundamental's distribution .
1 . Becomes positively significant at 10% level when Spearman Correlations are used .2 . Becomes insignificant when Spearman Correlations are used .3. Becomes positively significant at 1 % level when Spearman Correlations are used .4. Becomes positively significant at 1 % level when Spearman Correlations are used .5. Becomes positively significant at 1 % level when Spearman Correlations are used .6 . Becomes negatively significant at 5% level when Spearman Correlations are used .
Fundamental Industry CGQ GoNet Profit Margin Positive - 5% levelTotal Assets Turnover Negative - 1 % level GooBadFinancial Leverage Index Positive - 1 % level BadReceivables Turno, er . Insignificant N/AInv-nt-! Turn---r N/Af=i r~ Aas-~s Tumo~rar tJega`ive - 1 ;io lever BadC :rr~nt F : . ., - I'% level BadUwCK Ratirs tJegatlve - 10% level Bad
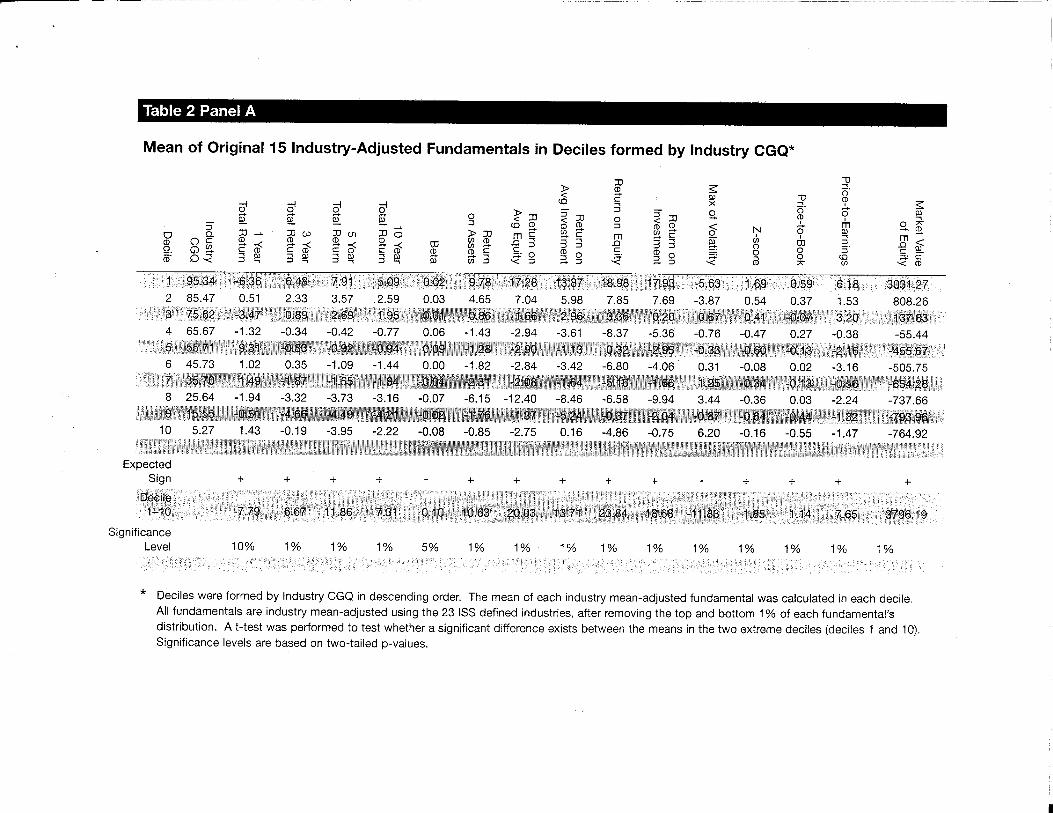
Table 2 Panel A
Mean of Original 15 Industry-Adjusted Fundamentals in Deciles formed by Industry CGQ*
-,
p
a
....
w
cn
7o p
--1
010
01
(DD M
m em
n c
m
c :
07
c~'n
<?tn.
C CD
C (D
c CD
C CD
CD
(.Dc
S.
95.3485.4775.6265.6755.7145.7335.7025 .6415 .555 .
-6 .360.51-3.47-1 .329 .311,021 .-19
-1 .94
-0 .33 -
-0.92
-0.9 1
0 .090.35 1 ., 1 .-1-1=1 .87 -1 .55 -1 .8-1 -0 .01-3.32
, -
3.-21 .
1 r
-0.07-4 .66 -4.49 -4 .21 -0.02
1
0 .00
9.78 17 .284.65 7 .040.86 1 .661 .-1
-1 .28 , .90
-2.08_10
-1 .76 -1 .37
ExpectedSign
+ + + + - + +Decile1-10
-7.79 6 .67 11 .86 7.31 0.10 10.63 20 .03
SignificanceLevel 10% 1% 1% 1% 5% 1% 1%
*
Deciles were formed by Industry CGQ in descending order. The mean of each industry mean-adjusted fundamental was calculated in each decile .All fundamentals are industry mean-adjusted using the 23 ISS defined industries, after removing the top and bottom 1 % of each fundamental'sdistribution . A t-test was performed to test whether a significant difference exists between the means in the two extreme deciles (deciles 1 and 10) .Significance levels are based on two-tailed p-values .
CD~.
3 cW
m-0
CD (D
3~c
(D
x
<o_~'=
Np
oO
,0
w
7s GC
13.87 18.98 17.93 -5 .63 1 .69 0.59 6.18 3031 .275.98 7 .85 7.69 -3 .87 0.54 0.37 1 .53 808.26.96 3 .36 0.20 0 .67 0.41 -0.07 3 .20 137.83
-3 .61 -8 .37 -5.36 -0 .76 -0.47 0.27 -0 .38 -55 .44-1 .13 0.32 -2.95 -0.33 -0.60 -0.13 -2.16 -455.67-3.42 -6.80 -4.06 0.31 -0.08 0 .02 -3.16 -505 .75-1 .61 -5 .16 -1 .66 1 .25 -0.34 -0 .13 -0.56 -654 .28
4 , .58 -9.94 3.44 -0.36 0.03 -2.24 -737 .66-5 .2-1 -0 .37 -2 .04 -0.87 -0 .6-1 -0 .44 -1 .32 -793.960 .If, - ;86 -0 . 1 5 0,20 -0.16 5 -1 .47 -7"-1 .92
+ + + - + + + +
13.71 23 .84 18.68 -11 .83 1 .85 1 .14 7.65 3796.19
1% 1% 1% 1% 1% 1% 1% 1%

Table 2 Panel B
Mean of Additional Industry-Adjusted Fundamentals in Deciles Formed by Industry CGQ*
CD
W
CD
Z30
'J0
-0-0
i = Insignificant
Deciles were formed by Industry CGQ in descending order. The mean of each industry mean-adjusted fundamental was calculated in each decile .All fundamentals are industry mean-adjusted using the 23 ISS defined industries, after removing the top and bottom 1% of each fundamental'sdistribution . A t-test was performed to test whether a significant difference exists between the means in the two extreme deciles (deciles 1 and 10).Significance levels are based on two-tailed p-values .
CD W
-' ~CD 7
omc
7 ~~~- .
N
'r-<CCD
c~ocQX (D
E~
CD.Z3
<
W
-N
c-~
3<CD
nXc-i o.
0ND
<<(D N
C~w
JJvO
Oc
~)wO
,
_
-0
G.
~ _~'
O
(
N O
.. noo3W
(D
~.
C)_ <n~~~
CD
r ow0- C) cpC:
m
(OpCQ
1<< NCD O
o c)CD
NCD
m
W o
tNpCD.O.
mN
:3<
W N
W p~~
"G
a
W
o
K Q
O
=7"< .
Q m
m
(A O
1 21 .66 -0.04 0.43 0 .02 3.10 -1 .04 -0.40 -0.30 0.14 2.21 14.20 0.21 0.29 -1 .60 4.10 -0.85 83.05 6.64 0.34 2.37
2 5 .55 -0 .01 0.17 -0 .45 -2 .28 -0 .59 -0.16 -0.06 0.10 0.93 6.99 0.08 0 .05 -2.63 0.38 -0 .87 63 .70 3.87 0 .13 1 .043 -3.84 -0.05 =0.15 -1 .68 -0.29 -0 .61 0.09 0.03 -0.09 -0.39 -0.85 0.03 0 .00 0.17 -7.27 0.38 87 .64 1 .66 0 .14 -0 .554 -3 .43 0.00 -0 .11 1 .05 1 .33 -0 .21 0.01 0.02 -0.06 -0.09 -6 .91 -0 .01 0 .00 -13.17 -8.43 0.42 -33 .32 0.73 0.04 0 .665 -11 .86 0.00 -0.05 -0 .13 -0.37 0.75 -0,03 0.03 -0.06 -0.40 -6 .87 -0 .11 -0 .12 -1 .25 34.05 -0.44 22 .50 -0.78 -0 .05 0.89
-0 .44 0.01 -0 .28 0.19 -0 .02 0.06 0.15 0.13 -0.03 -0.90 -0 .04 -0 .08 -0 .08 13.20 4 .34 0.40 -123 .39 -2.24 -0 .07 -0 .46-6 .14 0.01 -0 .02 0.37 0.25 0.50 0.26 0.20 001 -2 .76 -9 .50 -0 .13 -0.14 -5.00 -2 .09 -0 .51 -44 .48 -2.04 -0.08 -2.081 .99 0.04 -0 .17 1 .39 -2 .33 0.11 0.11 -0 .02 -0 .11 -0 .91 -8 .09 0 .00 0.05 1 .30 -18 .16 -0.17 60.77 -4.02 -0.13 -2.48
9 -13 .81 0.03 0 .09 0.18 -0 .33 0.28 0 "5 0 .16 0.02 0.15 -2 .80 -0.10 -0 .11 6.09 -4.25 0.77 22.65 -2.42 -0.22 -0:580 6 .38 0.03 0 .01 -0.75 0 .54 1 .1 2 9 .11 0 .04 i' .O1 4.88 -6 .55 1 .30 -182.70 -3 .81 -0.19 0.26
ExpectedSign + + + + + + + + - - + + + - - + - + +
Decile1-10 15.28 -0.07 0.42 0.77 2.56 2 .20 -0 .30 -0 .16 0.09 0.71 5.09 0.17 0.28 -6 .-18 10 .65 -2.15 265.75 10.45 0.53 2.11
SignificanceLevel 1% 10% 5% i i 5% 10% i i i i 5% 1% i i 1% 1% 1% 1% i

Table 3 Panel A
Regressions of Original 15 Industry-adjusted Fundamentals on Four Industry Subscores*
mcam
m
w
1 Year Total Return3 Year Total Return5 Year Total Return10 Year Total ReturnBetaReturn on AssetsReturn on AverageEquityReturn on AverageInvestmentReturn on EquityReturn on InvestmentMax of volatilityZ-scorePrice-to-BookPrier -~-E-inMarket Value of Equity
Negative - 1 % levelPositive - 1 % levelPositive - 1 % levelPositive - 1 % level
InsignificantPositive - 19/o level
Pc -jt, .,- - 1
levelPositive - 1 '- levelP , 1Ja-- 1
ll-(iativ'e - 1 "C', levelPositive - 1 I-,Po sitiva - 5 0 ~_ levelP(,siti :Positive - 1 » level
ao o_o cna c~
InsignificantPositive - 1 % levelPositive- 1 % levelPositive - 1 % level
InsignificantInsignificant
P
it
- 1% levelInsi(InificantIn_i :nificantIn ,~iCniflcantIn ;ignifi~:ant
Positive levelI~ . iw.nitic~~n ;
Positive 1 level
Positive - 5% levelNegative - 1 % levelNegative - 1 % levelNegative - 1 % level
InsignificantNegative - 1 % level
Negative - 1 % level
Negative - 1 % levelNegative - 1 % levelNegative - 1 % level
InsignificantNegative - 1 % level
InsignificantNegative - 10% levelNegative -1 % revel
*
All fundamentals are industry mean-adjusted, using the 23 ISS defined industries after removing the top and bottom 1 % of each fundamental's distribution .We regressed each industry mean-adjusted fundamental on the four industry sub-scores : Board Composition, Compensation, Takeover Defense, and Audit .All significance levels are based on two-tailed p-values.
Positive - 1'% levelInsignificant
Positive- 1 % levelInsignificant
Positive - 1 % levelInsignificant
Insignificant
InsignificantInsignificantInsignificantInsignificantInsignificant
Positive- 1 % levelInsignificant
Positive - 1 %level
0
D
E~
c,o XCID
°3 o ~- CD
cW (1)
Woaa
~' cno cQ
can D~'o
W com °-o W
cQ
mmo
o cu°-D
o_ c4

Table 3 Panel B
Regressions of Original 15 Industry-adjusted Fundamentals on Four Industry Subscores*
Net Profit %larginl ' - I -
Turno : :Financial LeverageIndexReceivables TurnoverInventory TurnoverFixed Assets TurnoverCurrent RatioQuick RatioDebt-to-EquityTotal Debt toTangible AssetsInterest Coverage(Income)Interest Coverage(Cash)Operating Cash Flowto Current U,91-JI'l tiesDays to Sell jncentoryDays to CollectReceivablesAccounts PayahleTurnoverDays to PayDividend PayoutDividend Yield -MonthlyLong-term Debtto Tangible Assets*
Positive - 1 % levelInsignificantInsignificantInsignificant
Negative - 1 % levelNegative - 1 % levelPositive - 5% level
Positive - 10% level
Positive - 10% level
Positive - 1 % level
Pe t - - I' ;, levelInsignificant
Insignificant
Ipsigr, fountNegative - 1 % level
InsignificantInsignificantInsignificant
Negative - 1 % levelInsignificantInsignificantInsignificant
hisignificantInsignificant
Negative - 1 % levelInsignificant
Negative - 5% levelPositive- 5% level
InsignificantPositive - 1 % levelPositive - 5% levelPositive - 1 % levelNegative - 1 % level
Negative - 1 % level
Negative - 1 % I--< ~~Insignificant
All fundamentals are industry mean-adjusted, using the 23 ISS defined industries after removing the top and bottom 1 % of each fundamental's distribution .We regressed each industry mean-adjusted fundamental on the four industry sub-scores : Board Composition, Compensation, Takeover Defense, and Audit .All significance levels are based on two-tailed p-values.
Negative - 1'~ levelNegative - 1 % level
InsignificantInsignificantInsignificantInsignificantInsignificantInsignificantInsignificant
Insignificant
Negative - 5% level
Negative - 1 % level
mXcDn(D
W Q0ma
DcvW0wa
C) mO X3 -0m m
0-W(a
00
mv o0 c
o XCDCD
m n0 cnm
0"~'~C:W
m0
X'aCDo 0
o_cn
a co
DcwDca
Insignificant Insignificant Positive - 10% level Insignificant
Negative -1',.'-;,level Insignificant Insignificant InsignificantIr ^ "~ificant In .i , 11 -lificarii Positive - 1 % level Insignificant
P t - -- 1`, level Pc ;hive - 1 % level Negative - 1 % level Insignificant
Positive - 1 % level Positive - 1 % level Negative - 1 % level Insignificant
Positive - 5% level Positive - 1 % level Negative - 1 % level Insignificant

Appendix
Our Variable Name Mnemonic in Research Insight1 Year Total Return TRT1 Y3 Year Total Return TRT3Y5 Year Total Return TRT5Y10 Year Total Return TRT10YBeta BETAReturn on Assets ROAReturn on Average Equity ROAEReturn on Average Investment ROAIReturn on Equity ROEReturn on Investment ROIMax of Volatility VOLTDZ-score ZSCOREPrice-to-Book MKBKPrice-to-Earnings PEMarket Value of Equity MKVALNet Profit Margin NPMTotal Assets Turnover ATTFinancial Leverage Index LEVIDXReceivables Turnover RECXInventory Turnover INVXFixed Assets Turnover FXATOCurrent Ratio CRQuick Ratio QRDebt-to-Equity DLTT / SEQTotal Debt to Tangible Assets DTATInterest Coverage (Income) ICBTInterest Coverage (Cash) CFL / (LCT+DLTT)Operating Cash Flow to Current Liabilities CFL / LCTDays to Sell Inventory 360 / INVXDays to Collect Receivables 360 / RECXAccounts Payable Turnover (COGS + INVT - INVT[-1]) / APDays to Pay Payables 360 / (COGS + INVT - INVT[-1]) / APDividend Payout DVPORDividend Yield - Monthly DVYDCLong-term Debt to Tangible Assets DLTT / (1/(DTAT/DT))

References
Carhart, Mark . 1997. On persistence in mutual fund performance. The Journal of Finance 52,57-82 .
Easterbrook, Frank. Two agency-cost explanations of dividends . American Economic Review74, 650-659 .
Fama, Eugene, and Kenneth French, 1992 . The cross-section of expected stock returns. TheJournal of Finance 47, 427-465 .
Jensen, Michael. 1986 . Agency costs of free cash flow, corporate finance, and takeovers .American Economic Review 76, 323-329.