corporate tax statistics · report (cbcr) statistics introduction general data characteristics 5....
TRANSCRIPT

Corporate Tax Statistics
SECOND EDITION

CONTENTS
Introduction 1
Corporate tax revenues 3
Statutory corporate income tax rates 9
Corporate effective tax rates 16
Tax incentives for research and development (R&D) 26
Anonymised and aggregated Country-by-Country Report (CbCR) statistics 33
Intellectual property regimes 45
Controlled Foreign Company (CFC) Rules 49
Interest Limitation Rules 50
References 51
Corporate Tax Statistics00This document and any map included herein are without prejudice to the status of or sovereignty over any territory, to the delimitation of international frontiers and boundaries and to the name of any territory, city or area.
Colombia was not an OECD Member at the time of preparation of this publication. Accordingly, Colombia does not appear in the list of OECD Members and is not included in the zone aggregates.
The statistical data for Israel are supplied by and under the responsibility of the relevant Israeli authorities. The use of such data by the OECD is without prejudice to the status of the Golan Heights, East Jerusalem and Israeli settlements in the West Bank under the terms of international law.
Note by Turkey: The information in this document with reference to “Cyprus” relates to the southern part of the Island. There is no single authority representing both Turkish and Greek Cypriot people on the Island. Turkey recognises the Turkish Republic of Northern Cyprus (TRNC). Until a lasting and equitable solution is found within the context of the United Nations, Turkey shall preserve its position concerning the “Cyprus issue”.
Note by all the European Union Member States of the OECD and the European Union: The Republic of Cyprus is recognised by all members of the United Nations with the exception of Turkey. The information in this document relates to the area under the effective control of the Government of the Republic of Cyprus.
Image credits: © Shutterstock.com
The OECD freely authorises the use of this material for non-commercial purposes, provided that suitable acknowledgment of the source and copyright owner is given. All requests for commercial uses of this material or for translation rights should be submitted to [email protected].
© OECD 2020

IntroductionIn preparing this second edition of the Corporate Tax Statistics database, the OECD has worked closely with members of the Inclusive Framework on BEPS (Inclusive Framework) and other jurisdictions willing to participate in the collection and compilation of statistics relevant to corporate taxation.
This database is intended to assist in the study of corporate tax policy and expand the quality and range of data available for the analysis of base erosion and profit shifting (BEPS). The 2015 BEPS Action 11 report on Measuring and Monitoring BEPS highlighted that the lack of quality data on corporate taxation is a major limitation to the measurement and monitoring of the scale of BEPS and the impact of the OECD/G20 BEPS project. While this database is of interest to policy makers from the perspective of BEPS, its scope is much broader. Apart from BEPS, corporate tax systems are important more generally in terms of the revenue that they raise and the incentives for investment and innovation that they create. The Corporate Tax Statistics database brings together a range of valuable information to support the analysis of corporate taxation, in general, and of BEPS, in particular.
The database compiles new data items as well as statistics in various existing data sets held by the OECD. The second edition of the database contains the following categories of data:
l corporate tax revenues;
l statutory corporate income tax (CIT) rates;
l corporate effective tax rates;
l tax incentives for research and development (R&D);
l anonymised and aggregated statistics collected via country-by-country reports;
l intellectual property regimes;
l controlled foreign company rules;
l interest limitation rules.
INTRODUCTION . 1
ALB Albania AND AndorraAGO AngolaAIA AnguillaARG ArgentinaABW ArubaAUS AustraliaAUT AustriaBHS BahamasBHR BahrainBRB BarbadosBEL BelgiumBLZ BelizeBMU BermudaBOL BoliviaBIH Bosnia and HerzegovinaBWA BotswanaBRA BrazilVGB British Virgin IslandsBRN Brunei DarussalamBGR BulgariaBFA Burkina FasoCPV Cabo VerdeCMR CameroonCAN CanadaCYM Cayman IslandsCHL ChileCHN ChinaCOL Colombia
NAMES OF COUNTRIES AND JURISDICTIONS
COD Democratic Republic of the CongoCOG CongoCOK Cook IslandsCRI Costa RicaCIV Côte d’IvoireHRV CroatiaCUB CubaCUW CuraçaoCYP CyprusCZE Czech RepublicDNK DenmarkDMA DominicaDOM Dominican RepublicCOD DRCEGY EgyptSLV El SalvadorGNQ Equatorial GuineaEST EstoniaSWZ EswatiniFRO Faroe IslandsFJI FijiFIN FinlandFRA FranceGAB GabonGEO GeorgiaDEU GermanyGHA GhanaGRC GreeceGRL Greenland
GRD GrenadaGTM GuatemalaGGY GuernseyGUY GuyanaHND HondurasHKG Hong Kong, ChinaHUN HungaryISL IcelandIND IndiaIDN IndonesiaIRL IrelandIMN Isle of ManISR IsraelITA ItalyJAM JamaicaJPN JapanJEY JerseyKAZ KazakhstanKEN KenyaKOR KoreaLVA LatviaLBR LiberiaLIE LiechtensteinLTU LithuaniaLUX LuxembourgMAC Macau, ChinaMDG MadagascarMYS MalaysiaMDV MaldivesMLI Mali
MLT MaltaMRT MauritaniaMUS MauritiusMEX MexicoMCO MonacoMSR MontserratMAR MoroccoNAM NamibiaNLD NetherlandsNZL New ZealandNER NigerNGA NigeriaMKD North MacedoniaNOR NorwayOMN OmanPAN PanamaPNG Papua New GuineaPRY ParaguayPER PeruPHL PhilippinesPOL PolandPRT PortugalROU RomaniaRUS RussiaRWA RwandaLCA Saint Lucia VCT Saint Vincent and the GrenadinesWSM SamoaSMR San Marino
SAU Saudi ArabiaSEN SenegalSRB SerbiaSYC SeychellesSGP SingaporeSVK Slovak RepublicSVN SloveniaSLB Solomon IslandsZAF South AfricaESP SpainSWE SwedenCHE SwitzerlandTHA ThailandTGO TogoTKL TokelauTTO Trinidad and TobagoTUN TunisiaTUR TurkeyTCA Turks and Caicos IslandsUGA UgandaARE United Arab EmiratesGBR United KingdomUSA United StatesURY UruguayVNM Viet Nam

2 . OECD | CORPORATE TAX STATISTICS
Box 1. CORPORATE TAX STATISTICS DATABASE
l Corporate tax revenues: – data are from the OECD’s Global Revenue Statistics
Database – covers 101 jurisdictions from 1965-2018 (for OECD
members) and 1990-2018 (for non-OECD members)
l Statutory corporate income tax rates: – covers 109 jurisdictions from 2000-2020
l Corporate effective tax rates: – covers 74 jurisdictions for 2019
l Tax incentives for research and development (R&D): – data are from the OECD R&D Tax Incentive Database
produced by the OECD’s Science, Technology and Innovation Directorate
– covers 46 jurisdictions for 2000-2017 (for tax and direct government support as a percentage of R&D)
– covers 48 jurisdictions for 2000-2019 (for implied subsidy rates for R&D, based on the B-index)
l Anonymised and aggregated Country-by-Country Report (CbCR) statistics:
– data are from anonymised and aggregated CbCR statistics prepared by OECD Inclusive Framework members and submitted to the OECD
– covers 26 jursidictions for 2016
l Intellectual property (IP) regimes: – data collected by the OECD’s Forum on Harmful Tax
Practices – covers 51 regimes in 38 jurisdictions for 2019
l Controlled foreign company rules: – covers 49 jurisdictions for 2019
l Interest limitation rules: – covers 67 jurisdictions for 2019
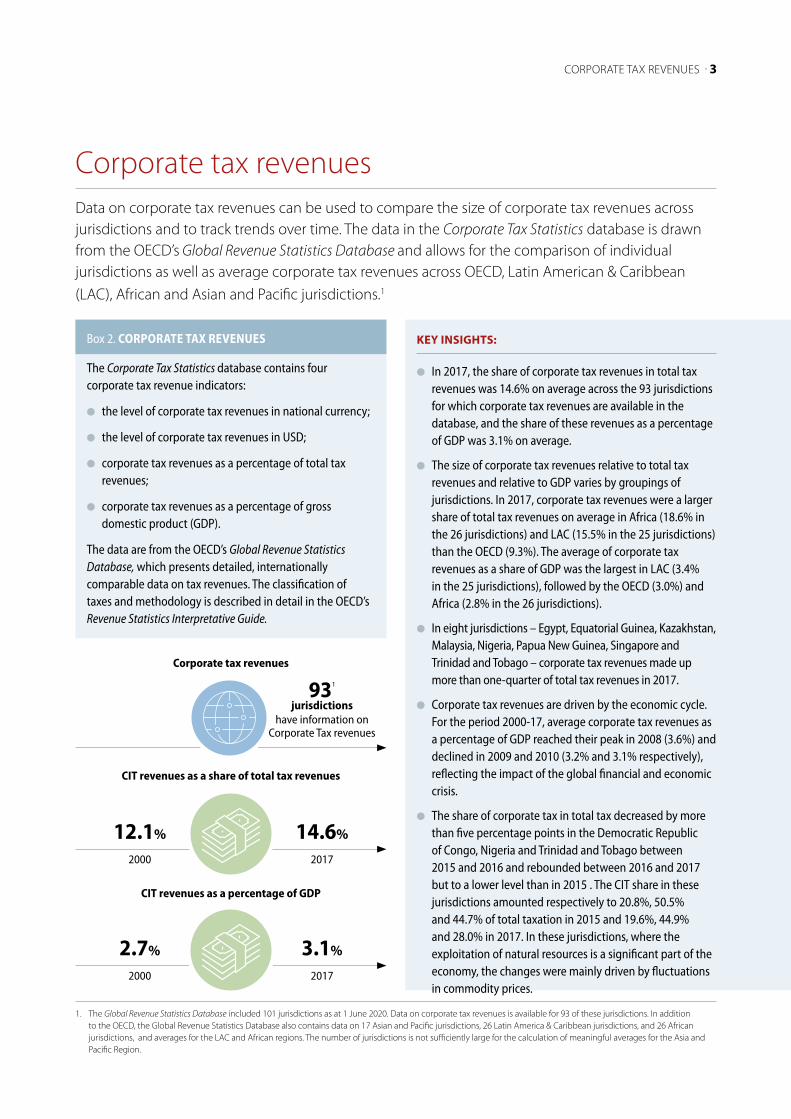
Corporate tax revenues Data on corporate tax revenues can be used to compare the size of corporate tax revenues across jurisdictions and to track trends over time. The data in the Corporate Tax Statistics database is drawn from the OECD’s Global Revenue Statistics Database and allows for the comparison of individual jurisdictions as well as average corporate tax revenues across OECD, Latin American & Caribbean (LAC), African and Asian and Pacific jurisdictions.1
KEY INSIGHTS:
l In 2017, the share of corporate tax revenues in total tax revenues was 14.6% on average across the 93 jurisdictions for which corporate tax revenues are available in the database, and the share of these revenues as a percentage
of GDP was 3.1% on average.
l The size of corporate tax revenues relative to total tax revenues and relative to GDP varies by groupings of jurisdictions. In 2017, corporate tax revenues were a larger share of total tax revenues on average in Africa (18.6% in the 26 jurisdictions) and LAC (15.5% in the 25 jurisdictions) than the OECD (9.3%). The average of corporate tax revenues as a share of GDP was the largest in LAC (3.4% in the 25 jurisdictions), followed by the OECD (3.0%) and Africa (2.8% in the 26 jurisdictions).
l In eight jurisdictions – Egypt, Equatorial Guinea, Kazakhstan, Malaysia, Nigeria, Papua New Guinea, Singapore and Trinidad and Tobago – corporate tax revenues made up more than one-quarter of total tax revenues in 2017.
l Corporate tax revenues are driven by the economic cycle. For the period 2000-17, average corporate tax revenues as a percentage of GDP reached their peak in 2008 (3.6%) and declined in 2009 and 2010 (3.2% and 3.1% respectively), reflecting the impact of the global financial and economic crisis.
l The share of corporate tax in total tax decreased by more than five percentage points in the Democratic Republic of Congo, Nigeria and Trinidad and Tobago between 2015 and 2016 and rebounded between 2016 and 2017 but to a lower level than in 2015 . The CIT share in these jurisdictions amounted respectively to 20.8%, 50.5% and 44.7% of total taxation in 2015 and 19.6%, 44.9% and 28.0% in 2017. In these jurisdictions, where the exploitation of natural resources is a significant part of the economy, the changes were mainly driven by fluctuations in commodity prices.
CORPORATE TAX REVENUES . 3
Box 2. CORPORATE TAX REVENUES
The Corporate Tax Statistics database contains four corporate tax revenue indicators:
l the level of corporate tax revenues in national currency;
l the level of corporate tax revenues in USD;
l corporate tax revenues as a percentage of total tax revenues;
l corporate tax revenues as a percentage of gross domestic product (GDP).
The data are from the OECD’s Global Revenue Statistics Database, which presents detailed, internationally comparable data on tax revenues. The classification of taxes and methodology is described in detail in the OECD’s Revenue Statistics Interpretative Guide.
1. The Global Revenue Statistics Database included 101 jurisdictions as at 1 June 2020. Data on corporate tax revenues is available for 93 of these jurisdictions. In addition to the OECD, the Global Revenue Statistics Database also contains data on 17 Asian and Pacific jurisdictions, 26 Latin America & Caribbean jurisdictions, and 26 African jurisdictions, and averages for the LAC and African regions. The number of jurisdictions is not sufficiently large for the calculation of meaningful averages for the Asia and Pacific Region.
CIT revenues as a share of total tax revenues
12.1%
2000
14.6%
2017
CIT revenues as a percentage of GDP
2.7%
2000
3.1%
2017
Corporate tax revenues
931
jurisdictionshave information on
Corporate Tax revenues

4 . OECD | CORPORATE TAX STATISTICS
Between 2000 and 2017, the trend for both indicators is very similar. When measured both as a percentage of total tax revenues and as a percentage of GDP, corporate tax revenues reached their peak in 2008 and then dipped in 2009 and 2010, reflecting the impact of the global financial and economic crisis. While average CIT revenues recovered after 2010, the unweighted averages declined in 2014, 2015 and 2016 across all 93 jurisdictions for which data are available. The unweighted averages recovered slightly in 2017 as a result of increases across a wide range of jurisdictions.
0 %
1 %
2 %
3 %
4 %
0 %
2 %
4 %
6 %
8 %
1 0 %
1 2 %
1 4 %
1 6 %
1 8 %
2 0 0 0 2 0 0 1 2 0 0 2 2 0 0 3 2 0 0 4 2 0 0 5 2 0 0 6 2 0 0 7 2 0 0 8 2 0 0 9 2 0 1 0 2 0 1 1 2 0 1 2 2 0 1 3 2 0 1 4 2 0 1 5 2 0 1 6 2 0 1 7
Percentage of total taxation Percentage of GDP
Perc
enta
ge o
f tot
al ta
xatio
n
Perc
enta
ge o
f GD
P
TRENDS IN CORPORATE TAX REVENUES
Data from the OECD’s Corporate Tax Statistics database show that there was a slight increase in both the average of CIT revenues as a share of total tax revenues and as a share of GDP between 2000 and 2017 across the 93 jurisdictions for which data are available. Average corporate tax revenues as a share of total tax revenues increased from 12.1% in 2000 to 14.6% in 2017, and average CIT revenues as a percentage of GDP increased from 2.7% in 2000 to 3.1% in 2017.
2. The latest available tax revenue data available across all jurisdictions in the database are for 2017, although there are 2018 data available for some jurisdictions in the Global Revenue Statistics database.
FIGURE 1: Average corporate tax revenues as a percentage of total tax and as a percentage of GDP
Corporate tax revenues are particularly important in developing economies
(CIT revenues as a share of total tax revenues in 2017)
Corporate tax revenues as a share of total tax in 2017
Note: These averages are unweighted. The number of jurisdictions used to calculate the averages shown in this figure grew from 77 in 2000 to 93 in 2017. Therefore, the averages shown in the early years are not strictly comparable with the averages shown in the later years.
Source: Data from the Global Revenue Statistics Database, http://oe.cd/global-rev-stats-database
Corporate tax revenues made up more than one-quarter of total tax revenues in 2017: Egypt, Equatorial Guinea, Kazakhstan, Malaysia, Nigeria, Papua New Guinea, Singapore and Trinidad and Tobago
Corporate tax revenues made up less than 5% of total tax revenues in 2017: Bahamas, Estonia, Italy, Slovenia and Tokelau
5%OR LESS
25%OR MORE
AFRICA (26): 18.6% LAC (25): 15.5%
OECD: 9.3%Bahamas, Estonia, Italy, Slovenia and Tokelau
Bahamas, France, Hungary, Italy, Latvia, Tokelau and the United States
Egypt, Equatorial Guinea, Kazakhstan, Malaysia,Nigeria, Papua New Guinea, Singapore and the Trinidad and Tobago
Bahamas, Estonia, Italy, Slovenia and Tokelau
Bahamas, France, Hungary, Italy, Latvia, Tokelau and the United States
Egypt, Equatorial Guinea, Kazakhstan, Malaysia,Nigeria, Papua New Guinea, Singapore and the Trinidad and Tobago

CORPORATE TAX REVENUES . 5
Note: The statistical data for Israel are supplied by and under the responsibility of the relevant Israeli authorities. The use of such data by the OECD is without prejudice to the status of the Golan Heights, East Jerusalem and Israeli settlements in the West Bank under the terms of international law.
FIGURE 2: Corporate tax revenues as a percentage of total tax revenues, 2017
0% 10% 20% 30% 40% 50% 60% 70%
BHSTKLEST
SVNITA
GRCFRALTULVADEUHUNPOLAUTUGA
FINSWEUSAESPTURDNKTUN
ISLGBRNLDBRABRB
WSMARGBELPRTSENISR
TGOURYSVKPAN
CRICZECHESLBCIV
CANJPN
JAMCPVIRL
MDGNORKEN
CMRLUXKORNZL
MUSPRYCUBCOKBFASLVBLZZAFBOLMLI
DOMGHARWAMARHNDSWZNERAUSCOGCODGTMMRTCHLSYC
GUYMEXIDN
FJIPERTHAPHLCOLTTOPNGKAZEGYSGPMYSNGAGNQ
Revenues
LAC (25) average – 15.5%
OECD average – 9.3%
Africa (26) average – 18.6%
Source: Data from the Global Revenue Statistics Database, http://oe.cd/global-rev-stats-database

6 . OECD | CORPORATE TAX STATISTICS
The averages mask considerable differences across jurisdictions. In 2017, jurisdictions differed considerably in the portion of total tax revenues raised by the CIT. In Egypt, Equatorial Guinea, Kazakhstan, Malaysia, Nigeria, Papua New Guinea, Singapore and Trinidad and Tobago, CIT revenue accounted for more than 25% of total tax revenue. In Equatorial Guinea, it accounted for more than 66%. In contrast, some jurisdictions – such as the Bahamas, Estonia, Italy, Slovenia and Tokelau – raised less than 5% of total tax revenues from the CIT. In most jurisdictions, the difference in the level of corporate taxes as a share of total tax revenues reflects differences in the levels of other taxes raised.
The average revenue share of corporate tax in 2017 also varied across the OECD and the regional groupings (Latin America & the Caribbean and Africa). In 2017, the OECD average was the lowest, at 9.3%, followed by the Africa (26) average (18.6%) and the LAC (25) average (15.5%).
Some of the variation in the share of CIT in total tax revenues results from differences in statutory corporate tax rates, which also vary considerably across
jurisdictions. In addition, this variation can be explained by institutional and jurisdiction-specific factors, including:
l the degree to which firms in a jurisdiction are incorporated;
l the breadth of the CIT base;
l the current stage of the economic cycle and the degree of cyclicality of the corporate tax system (for example, from the generosity of loss offset provisions);
l the extent of reliance on other types of taxation, such as taxes on personal income and on consumption;
l the extent of reliance on tax revenues from the exploitation of natural resources;
l other instruments to postpone the taxation of earned profits.
Generally, differences in corporate tax revenues as a share of total tax revenues should not be interpreted as being related to BEPS behaviour, since many other factors are likely to be more significant, although profit shifting may have some effects at the margin.
3. The Bahamas and Tokelau do not levy a corporate income tax.

0% 1% 2% 3% 4% 5% 6% 7% 8%
BHSTKL
UGACODMDG
LTUPANESTSENLVATURUSASVNCMRPOLGRCCIV
DEUPRY
HUNITA
TGOWSMDOM
ESPCOGFRAKENNERTUNGHACPVAUTGTMNGA
CRIIDNFINIRL
MLIRWA
SLBBRBSWEGBRBRAARGMUSBFA
SWZISL
CHEURYPRTJAMSLV
DNKNLD
ISRSVK
MEXPER
PNGJPNCZE
CANKORBOL
GNQMRTHNDTHABELSGPCHLCOKPHLKAZBLZZAFNZLEGYCOLNORMARLUXAUSGUYMYSTTO
FJICUBSYC
Revenues
LAC (25) average – 3.4%
OECD average – 3.0%
Africa (26) average – 2.8%
CORPORATE TAX REVENUES . 7
FIGURE 3: Corporate tax revenues as a percentage of GDP, 2017
Source: Data from the Global Revenue Statistics Database, http://oe.cd/global-rev-stats-database

8 . OECD | CORPORATE TAX STATISTICS
CORPORATE TAX REVENUES AS A SHARE OF GDP
Corporate tax revenues as a percentage of GDP also vary across jurisdictions. In 2017, the ratio of corporate tax revenues to GDP was between 2% and 5% of GDP for a majority of jurisdictions. For a few jurisdictions, corporate tax revenues accounted for a larger percentage of GDP; they are more than 5% of GDP in Australia, Cuba, Fiji, Luxembourg, Malaysia, Seychelles, and Trinidad and Tobago. In contrast, they are less than 2% of GDP in 15 jurisdictions.
In 2017, the OECD and Africa (26) averages were almost identical, at 3.0% and 2.8% of GDP respectively, whereas the LAC (25) average was higher (3.4%).
The reasons for the variation across jurisdictions in corporate tax revenues as a percentage of GDP are similar
to those that account for why the corporate tax revenue share of total tax revenues differs, such as differences in statutory corporate tax rates and differences in the degree to which firms in a given jurisdiction are incorporated. In addition, the total level of taxation as a share of GDP plays a role. For example, for the 26 African jurisdictions, the relatively high average revenue share of CIT compared to the relatively low average of CIT as a percentage of GDP reflects the low amount of total tax raised as a percentage of GDP (average of 17.0%). Total tax revenue as a percentage of GDP is higher for the 25 LAC jurisdictions (average of 22.8%) and OECD jurisdictions (average of 34.2%). Across jurisdictions in the database, low tax-to-GDP ratios may reflect policy choices as well as other challenges associated with domestic resource mobilisation (e.g. administrative capacity and levels of compliance).
In 2017, average corporate tax revenues as a percentage of GDP were highest in the LAC (25) region at 3.4%. The OECD and African (26) averages were 3.0% and 2.8% respectively.

Statutory corporate income tax ratesStatutory CIT rates show the headline tax rate faced by corporations and can be used to compare the standard tax rate on corporations across jurisdictions and over time. As statutory tax rates measure the marginal tax that would be paid on an additional unit of income, in the absence of other provisions in the tax code, they are often used in studies of BEPS to measure the incentives that firms have to shift income between jurisdictions.
Standard statutory CIT rates, however, do not give a full picture of the tax rates faced by corporations in a given jurisdiction. The standard CIT rate does not reflect any special regimes or rates targeted to certain industries or income types, nor does it take into account the breadth of the corporate base to which the
rate applies. Further information, such as the data on effective corporate tax rates and intellectual property (IP) regimes in the Corporate Tax Statistics database, is needed to form a more complete picture of the tax burden on corporations across jurisdictions.
KEY INSIGHTS:
l Statutory CIT rates have been decreasing on average over the last two decades, although considerable variation among jurisdictions remains. The average combined (central and sub-central government) statutory tax rate for all covered jurisdictions was 20.6% in 2020, compared to 20.7% in 2019 and 28.0% in 2000.
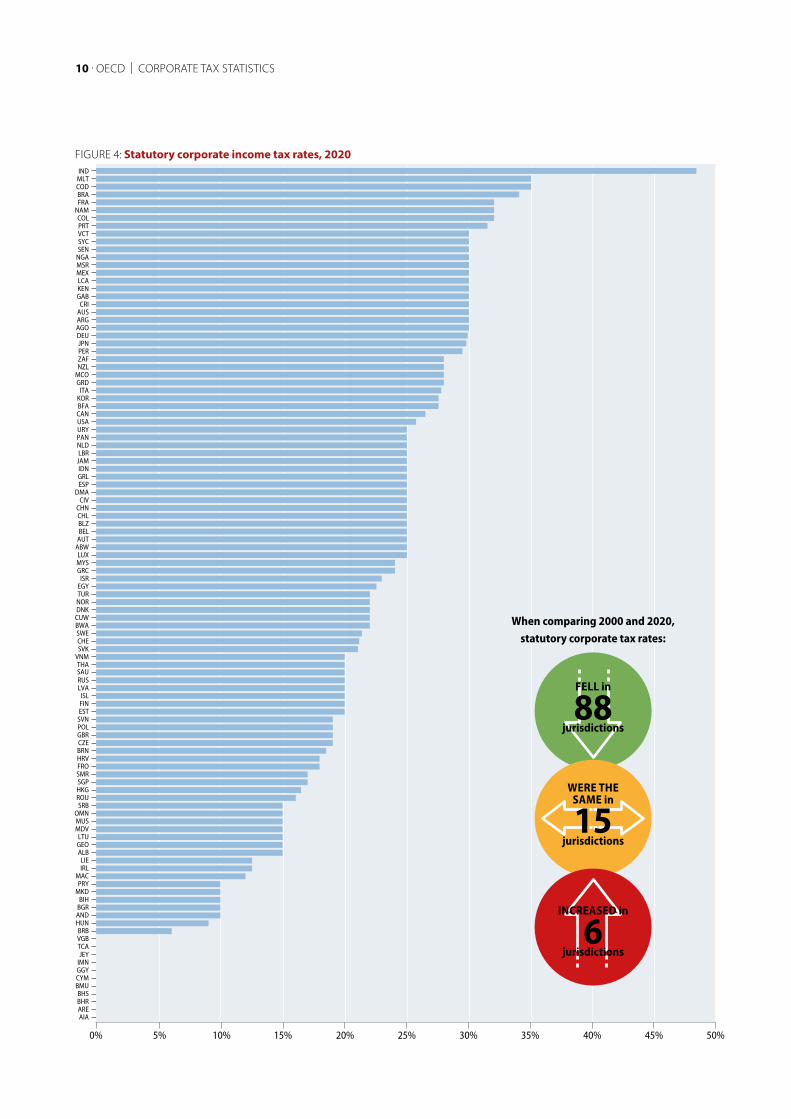
l Of the 109 jurisdictions covered, 21 had corporate tax rates equal to or above 30% in 2020, with India having the highest corporate tax rate at 48.3%, which includes a tax on distributed dividends.
l In 2020, 12 jurisdictions had no corporate tax regime or a CIT rate of zero. Two jurisdictions, Barbados (5.5%) and Hungary (9%), had a positive corporate tax rate less than 10%. Hungary, however, also has a local business tax, which does not use corporate profits as its base. This is not included in Hungary’s statutory tax rate, but it does mean that businesses in Hungary are subject to a higher level of tax than its statutory tax rate reflects.
l Comparing corporate tax rates between 2000 and 2020, 88 jurisdictions had lower tax rates in 2018, while 15 jurisdictions had the same tax rate, and 6 had higher tax rates (Andorra; Chile; Hong Kong, China; India; the Maldives; Oman).
l The largest increases between 2000 and 2020 were in Andorra and Chile (both at 10 percentage points) and
the Maldives (15 percentage points). Andorra and the Maldives did not previously have a corporate tax regime
and introduced one during this time period.
l Comparing 2000 and 2020, nine jurisdictions – Aruba, Barbados, Bosnia and Herzegovina, Bulgaria, Germany, Guernsey, Jersey, Isle of Man and Paraguay – decreased their corporate tax rates by 20 percentage points or more. During this time, Guernsey, Jersey and the Isle of Man eliminated preferential regimes and reduced their standard corporate tax rates to zero and Barbados reduced its standard corporate tax rate to 5.5% after eliminating its preferential regime.
l From 2019 to 2020, the combined statutory tax rate decreased in seven jurisdictions (Belgium, Canada, France, Greenland, Monaco and the United States) and there were no increases across the 109 jurisdictions covered.
l The jurisdictions with the largest decreases in the combined corporate tax rate between 2019 and 2020 were Belgium (an almost 5 percentage point decrease) and Greenland (a decrease of 5 percentage points).
STATUTORY CORPORATE INCOME TAX RATES . 9
The average statutory tax rate fell by 7.4 percentage points
from 28.0% in 2000...
...to 20.6% in 2020
10 . OECD | CORPORATE TAX STATISTICS
FIGURE 4: Statutory corporate income tax rates, 2020
When comparing 2000 and 2020, statutory corporate tax rates:
FELL in
88
jurisdictions
WERE THE SAME in
15
jurisdictions
INCREASED in
6
jurisdictions
SAU
0% 5% 10% 15% 20% 25% 30% 35% 40% 45% 50%
AIAAREBHRBHS
BMUCYMGGYIMNJEY
TCAVGBBRB
HUNANDBGRBIH
MKDPRY
MACIRLLIE
ALBGEOLTU
MDVMUSOMN
SRBROUHKGSGPSMRFROHRVBRNCZEGBRPOLSVNESTFINISL
LVARUS
THAVNMSVKCHESWEBWACUWDNKNORTUREGYISR
GRCMYSLUX
ABWAUTBELBLZCHLCHN
CIVDMA
ESPGRLIDN
JAMLBRNLDPANURYUSACANBFAKORITA
GRDMCONZLZAFPERJPN
DEUAGOARGAUSCRI
GABKENLCA
MEXMSRNGASENSYCVCTPRTCOL
NAMFRABRACODMLTIND
When comparing 2000 and 2020, statutory corporate tax rates:
FELL in
88
jurisdictions
WERE THE SAME in
15
jurisdictions
INCREASED in
6
jurisdictions

Box 3. STATUTORY CORPORATE INCOME TAX RATES
The Corporate Tax Statistics database reports statutory tax rates for resident corporations at the:
l central government level;
l central government level exclusive of any surtaxes;
l central government level less deductions for subnational taxes;
l sub-central government level;
l combined (central and sub-central) government level.
The standard rate, that is not targeted at any particular industries or income type, is reported. The top marginal rate is reported if a jurisdiction has a progressive corporate tax system. Other special corporate taxes that are levied on a base other than corporate profits are not included.
STATUTORY CORPORATE INCOME TAX RATES . 11
STATUTORY CORPORATE TAX RATES SINCE 2000
The distribution of CIT rates changed significantly between 2000 and 2020. In 2000, 13 jurisdictions had tax rates greater than or equal to 40%, while only 1 jurisdiction (India) had a rate exceeding 40% in 2020, and that rate only applies to distributed earnings. Around two-thirds (68 jurisdictions) of the 109 jurisdictions in the database had corporate tax rates greater than or equal to 30% in 2000 compared to less than one-fifth (21 jurisdictions) in 2020.
Most of the downward movement in tax rates between 2000 and 2020 was to corporate tax rates equal to or greater than 10% and less than 30%. The number of jurisdictions with tax rates equal to or greater than 20% and less than 30% jumped from 24 jurisdictions to 48 jurisdictions, and the number of jurisdictions with tax rates equal to or greater than 10% and less than 20% more than tripled, from 7 to 28 jurisdictions.
FIGURE 5: Changing distribution of statutory corporate tax rates
2020
2000
0
10
20
30
40
50
60
<10% 10%-20% 20%-30% 30%-40% 40%+

12 . OECD | CORPORATE TAX STATISTICS
Despite the general downward movement in tax rates during this period, the number of jurisdictions with very low tax rates of less than 10% remained fairly stable between 2000 and 2020. There were 10 jurisdictions with tax rates less than 10% in 2000, and 14 below that threshold in 2020.
There has, however, been some movement of jurisdictions into and out of this category, and these movements illustrate how headline statutory tax rates do not give a complete picture of the tax rate in a jurisdiction. Between 2005 and 2009, the British Virgin Islands, Guernsey, Jersey and the Isle of Man all moved from corporate tax rates above 10% to zero corporate tax rates. In all of these cases, however, before changing their standard corporate tax rate to zero, they had operated broadly applicable special regimes that resulted in very low tax rates for qualifying companies. Meanwhile, Andorra and the Maldives instituted corporate tax regimes and moved from zero rates to positive tax rates (10% in Andorra beginning in 2012 and 15% in the Maldives beginning in 2011). However, they also introduced preferential regimes as part of their corporate tax systems that offered lower
rates to qualifying companies. (Andorra has recently amended or abolished its preferential regimes that were not compliant with the BEPS Action 5 minimum standard, and the Maldives is also in the process of amending or abolishing such regimes.)
CORPORATE TAX RATE TRENDS ACROSS REGIONS
Since 2000, average statutory tax rates have declined across OECD member states and the three regional groupings of jurisdictions: African jurisdictions, Asian jurisdictions and LAC jurisdictions.4
The grouping with the most significant decline has been the OECD (a decline of 9.0 percentage points, from 32.2% in 2000 to 23.2% in 2020) followed by the Africa (15) average with a decline of 7.0 percentage points, from 34.5% in 2000 to 27.5% in 2020. While the averages have fallen for each grouping over this period, there remains a significant level of difference between the average for each group: the average corporate tax rate for Africa (15) was 27.5% in 2020, compared to 23.2% for the OECD, 17.0% for Asia (16) and 19.4% for LAC (25).
4. As the sample of jurisdictions for which tax revenue data are available and the sample of jurisdictions for which statutory corporate tax rate data are available are not the same, the average corporate tax revenue and statutory tax rate data for the different regional groups should not be directly compared.
The average statutory corporate tax rate declined more significantly in the OECD than in the three regional groupings (a decline of 9.0 percentage points, from 32.2% in 2000 to 23.2% in 2020).

STATUTORY CORPORATE INCOME TAX RATES . 13
FIGURE 6: Average statutory corporate income tax rates by region
15%
20%
25%
30%
35%
40%
2000 2001 2002 2003 2004 2005 2006 2007 2008 2009 2010 2011 2012 2013 2014 2015 2016 2017 2018 2019 2020
Africa (15) Asia (16) LAC (25) OECD Overall
Percentage of jurisdictions with statutory corporate tax rates greater than, or equal to, 30%
2000
62%
2005
49%
2010
31%
2015
25%
2020
19%
Note: For readability purposes, the Y-axis value has been positioned to start at 15%
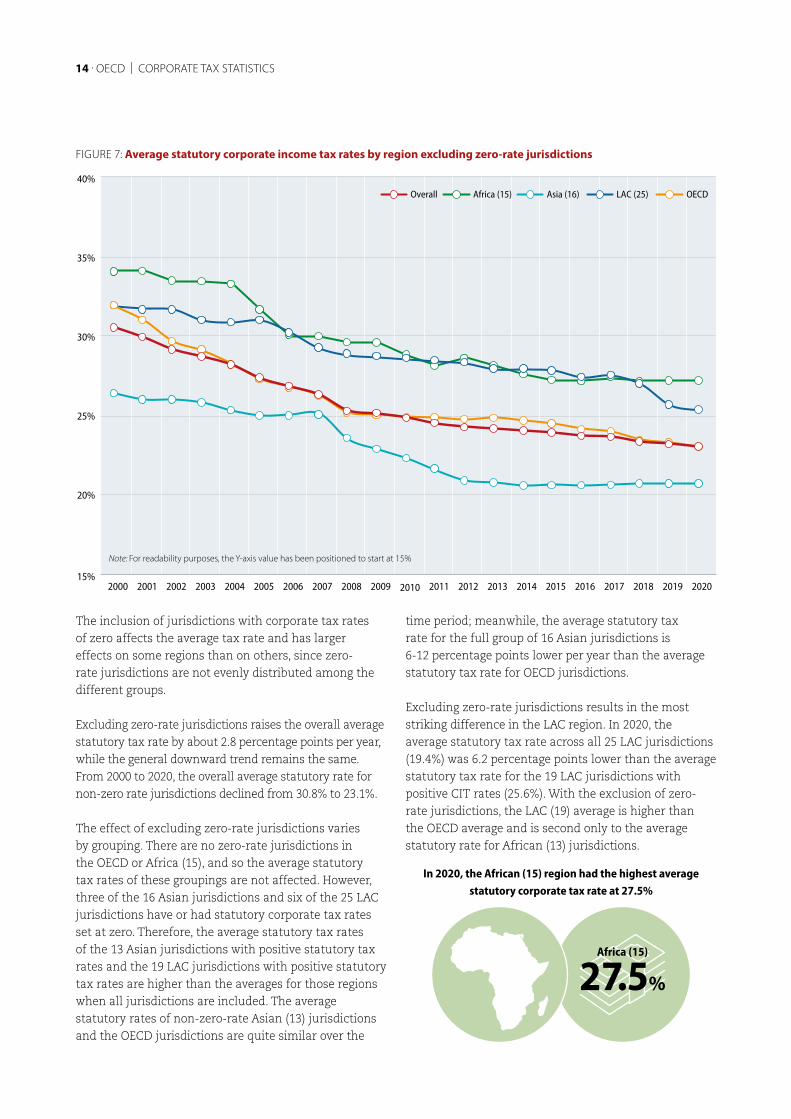
Excluding jurisdictions with tax rates of 0%, the overall average statutory rate declined from 30.8% in 2000 to 23.1% in 2020.
14 . OECD | CORPORATE TAX STATISTICS
15%
20%
25%
30%
35%
40%
2000 2001 2002 2003 2004 2005 2006 2007 2008 2009 2010 2011 2012 2013 2014 2015 2016 2017 2018 2019 2020
Africa (15) Asia (16) LAC (25) OECD Overall
FIGURE 7: Average statutory corporate income tax rates by region excluding zero-rate jurisdictions
The inclusion of jurisdictions with corporate tax rates of zero affects the average tax rate and has larger effects on some regions than on others, since zero-rate jurisdictions are not evenly distributed among the different groups.
Excluding zero-rate jurisdictions raises the overall average statutory tax rate by about 2.8 percentage points per year, while the general downward trend remains the same. From 2000 to 2020, the overall average statutory rate for non-zero rate jurisdictions declined from 30.8% to 23.1%.
The effect of excluding zero-rate jurisdictions varies by grouping. There are no zero-rate jurisdictions in the OECD or Africa (15), and so the average statutory tax rates of these groupings are not affected. However, three of the 16 Asian jurisdictions and six of the 25 LAC jurisdictions have or had statutory corporate tax rates set at zero. Therefore, the average statutory tax rates of the 13 Asian jurisdictions with positive statutory tax rates and the 19 LAC jurisdictions with positive statutory tax rates are higher than the averages for those regions when all jurisdictions are included. The average statutory rates of non-zero-rate Asian (13) jurisdictions and the OECD jurisdictions are quite similar over the
time period; meanwhile, the average statutory tax rate for the full group of 16 Asian jurisdictions is 6-12 percentage points lower per year than the average statutory tax rate for OECD jurisdictions.
Excluding zero-rate jurisdictions results in the most striking difference in the LAC region. In 2020, the average statutory tax rate across all 25 LAC jurisdictions (19.4%) was 6.2 percentage points lower than the average statutory tax rate for the 19 LAC jurisdictions with positive CIT rates (25.6%). With the exclusion of zero-rate jurisdictions, the LAC (19) average is higher than the OECD average and is second only to the average statutory rate for African (13) jurisdictions.
In 2020, the African (15) region had the highest average statutory corporate tax rate at 27.5%
Note: For readability purposes, the Y-axis value has been positioned to start at 15%
Africa (15)
27.5%
Standard statutory CIT rates provide a snapshot of the corporate tax rate in a jurisdiction. However, jurisdictions may have multiple tax rates with the applicable tax rate depending on the characteristics of the corporation and the income.
l Some jurisdictions operate preferential tax regimes with lower rates offered to certain corporations or income types.
l Some jurisdictions tax retained and distributed earnings at different rates.
l Some jurisdictions impose different tax rates on certain industries.
l Some jurisdictions have progressive rate structures or different regimes for small and medium sized companies.
l Some jurisdictions impose different tax rates on non-resident companies than on resident companies.
l Some jurisdictions impose lower tax rates in special or designated economic zones.
l Some jurisdictions impose taxes on corporates based on multiple components using different tax rates (for example the Zakat levied by the Kingdom of Saudi Arabia, which operates as a tax on income or equity).
Jurisdictions with broadly applicable tax regimes available to international companies
Preferential tax regimes are especially important in understanding how standard corporate tax rates do not always capture the incentives that may exist to engage in BEPS behaviours. In particular, some jurisdictions offer or have offered very low rates through regimes that are available to international companies with relatively few restrictions, while maintaining high standard statutory CIT rates.
For example, a number of jurisdictions offer or have offered International Business Companies regimes. Companies qualifying for these regimes pay a reduced rate of tax relative to the standard statutory CIT rate. While that standard statutory tax rate may be quite high in these jurisdictions, qualifying international business companies were typically exempt from tax or paid tax at a very low rate. There are also special cases, like Malta, which offers a refund of up to six-sevenths of corporate income taxes to both resident and non-resident investors through its imputation system.
THE STANDARD STATUTORY CORPORATE TAX RATE IS NOT THE ONLY CORPORATE TAX RATE
STATUTORY CORPORATE INCOME TAX RATES . 15
Except for the Maltese imputation system, which is not in the scope of the BEPS project, all of the regimes belonging to jurisdictions for which statutory CIT rate data is available in the Corporate Tax Statistics database have been, or are in the process of being, amended or abolished to be aligned with the BEPS Action 5 minimum standard. These changes should greatly diminish the incentives these regimes provide for BEPS behaviour.
Taxes on distributed earnings
Another way in which standard statutory tax rates may not reflect the rates imposed on companies is if jurisdictions tax distributed earnings in addition to (or instead of) a CIT on all profits.
In some jurisdictions, there is a tax on all corporate profits when they are earned and an additional tax on any earnings that are distributed. This is the case in India, for example, where corporate profits, whether retained or distributed, are taxed at a rate of 34.9%, and an additional tax on dividend distributions raises the total tax rate on distributed profits to 48.3%.
In other jurisdictions, there is no tax on profits when they are earned, and corporate tax is only imposed when profits are distributed. This is the case in Estonia and Latvia, which both tax distributed profits at 20% and impose no tax on retained earnings. While 20% is reported for both jurisdictions in the Corporate Tax Statistics database, the rate faced by corporations in these jurisdictions could be much lower and will depend on the proportion of profits that are distributed. In the case of both of these jurisdictions, where a corporation retains all profits and does not pay any dividends in a given period, it will not be subject to any CIT.

16 . OECD | CORPORATE TAX STATISTICS
It is well understood that cross-jurisdiction competitive-ness is not solely driven by the tax costs associated with an investment; many other factors, such as the quality of the workforce, infrastructure and the legal environment, affect profitability and are likely to have significant impacts on investment decisions. In measuring the competitiveness of jurisdictions, however, effective tax rates (ETRs) provide a more accurate picture of the effects of corporate tax systems on the actual tax liabilities faced by companies than statutory tax rates.
The Corporate Tax Statistics dataset presents “forward-looking” ETRs, which are synthetic tax policy indicators calculated using information about specific tax policy rules. Unlike “backward-looking” ETRs, they do not incorporate any information about firms’ actual tax payments. As described in more detail in Box 3, the ETRs reported in Corporate Tax Statistics focus on the effects of fiscal depreciation and several related provisions (e.g., allowances for corporate equity, half-year conventions, inventory valuation methods). While this includes fiscal depreciation rules for intangible property, such as acquired patents or trade-marks, for example, the effects of expenditure-based R&D tax incentives and intellectual property (IP) regimes are not accounted for. It is intended that the effects of R&D tax incentives and IP regimes will be included in the ETR dataset in the future.
In contrast, backward-looking ETRs are calculated by dividing actual tax payments by profits earned over a given period. They are calculated on the basis of historical jurisdiction-level or firm-level data and reflect the combined effects of many different factors, such as the definition of the tax base, the types of projects that firms have been engaged in, as well as the effects of possible tax-planning strategies. Although backward-looking ETRs may not reflect how corporate tax systems affect current incentives to invest, they provide information on how tax payments and profits of specific
taxpayers or groups of taxpayers compare to each other in the past. Due to data limitations, backward-looking ETRs are not included in the database.
Corporate effective tax ratesVariations in the definition of corporate tax bases across jurisdictions can have a significant impact on the tax liability associated with a given investment. For instance, corporate tax systems differ across jurisdictions with regard to several important features, such as fiscal depreciation rules as well as other allowances and deductions. To capture the effects of these provisions on corporate tax bases and tax liabilities, it is necessary to go beyond a comparison of statutory CIT rates.
Box 4. CORPORATE EFFECTIVE TAX RATES
The Corporate Tax Statistics database contains four forward-looking tax policy indicators:
l the effective marginal tax rate (EMTR);
l the effective average tax rate (EATR);
l the cost of capital;
l the net present value of capital allowances as a share of the initial investment.
All four tax policy indicators are calculated by applying jurisdiction-specific tax rules to a prospective, hypothetical investment project. Calculations are undertaken separately for investments in different asset types and by sources of financing (i.e. debt and equity). Composite tax policy indicators are computed by weighting over assets and sources of finance. In addition, more disaggregated results are also reported in the Corporate Tax Statistics database.
The tax policy indicators are calculated for three different macroeconomic scenarios. Unless noted, the results reported in this report refer to composite effective tax rates based on the macroeconomic scenario with a 3% real interest rate and 1% inflation.
Largest statutory tax rate reductions due to fiscal acceleration(percentage points, 2019)
Italy
4.9percentage points
Kenya
3.8percentage points
Papua New Guinea
3.7percentage points
Cote d’Ivoire
3.4percentage points

CORPORATE EFFECTIVE TAX RATES . 17
KEY INSIGHTS:
l Of the 74 jurisdictions covered in 2019, 57 provide accelerated depreciation, meaning that investments in these jurisdictions are subject to EATRs below their statutory tax rates. Among those jurisdictions, the average reduction of the statutory tax rate was 1.7 percentage points; in 2019, the largest reductions were observed in Italy (4.9 percentage points), Kenya (3.8 percentage points), Papua New Guinea (3.7 percentage points) and Cote d’Ivoire (3.4 percentage points).
l In contrast, fiscal depreciation was decelerated in eight jurisdictions, leading to EATRs above the statutory tax rate. Among those jurisdictions, the average increase of the statutory tax rate was 3.3 percentage points; the largest increases were observed in Costa Rica (7.7 percentage points), Chile (6.3 percentage points) and Botswana (5.3 percentage points).
l Among all 74 jurisdictions, nine jurisdictions had an allowance for corporate equity (ACE): Belgium, Brazil, Cyprus, Italy, Liechtenstein, Malta, Poland, Portugal and Turkey. Including this provision in their tax code has led to an additional reduction in their EATRs of 1.3 to 4.5 percentage points.
l The average EATR across jurisdictions (20.1%) is 1.3 percentage points lower than the average statutory tax rate (21.4%). EATRs are also less dispersed across jurisdictions compared to the statutory tax rate. While the median is about the same as for the statutory tax rate, the highest EATR is only 45.7%, compared to the highest statutory tax rate at 48.3%; half of the jurisdictions covered have EATRs between 15% and 27%.
l Effective marginal tax rates (EMTRs) are the lowest in jurisdictions with an allowance for corporate equity (ACE), i.e. Belgium, Brazil, Cyprus, Italy, Liechtenstein, Malta, Poland, Portugal and Turkey, as well as those with the most accelerated fiscal depreciation rules.
l The most significant changes between EMTRs in 2019 compared to 2018 are observed in Poland, Canada and the United Kingdom.
l Disaggregating the results to the asset level reveals that fiscal acceleration is strongest for investments in buildings and tangible assets. For these two asset categories, the average EATR across jurisdictions is 18.8% and 19.2%, considerably lower than the average composite EATR (20.1%).
l Investments in intangibles are subject to very different ETRs due to significant variation in tax treatment across jurisdictions. In particular, intangibles are non-depreciable in Botswana, Chile and Costa Rica, leading to strongly decelerated fiscal depreciation. Argentina, Australia, Brazil, South Africa, Montserrat and Spain provide moderately decelerated depreciation of intangibles. On the other hand, Papua New Guinea, Kenya and Denmark allow acquired intangible assets to be expensed immediately while Italy provides enhanced deductions for the acquisition of highly-digitalised intangible assets.
If capital allowances are more generous than economic depreciation, fiscal depreciation is accelerated. Fiscal acceleration can be measured by comparing the EATR to the statutory rate.

FORWARD-LOOKING CORPORATE EFFECTIVE TAX RATES IN 2019
Forward-looking ETRs capture information on corporate tax rates and bases as well as other relevant provisions within a comparable framework. They provide an appropriate basis for cross-jurisdiction comparisons of the combined impact of corporate tax systems on the investment decisions of firms and are more accurate tax policy indicators than statutory tax rates.
Two complementary forward-looking ETRs are typically used for tax policy analysis, capturing incentives at different margins of investment decision making:
l EATRs reflect the average tax contribution a firm makes on an investment project earning above-zero economic profits. This indicator is used to analyse discrete investment decisions between two or more alternative projects (along the extensive margin).
l EMTRs measure the extent to which taxation increases the pre-tax rate of return required by investors to break even. This indicator is used to analyse how taxes affect the incentive to expand existing investments given a fixed location (along the intensive margin).
EFFECTIVE AVERAGE TAX RATES
Figure 8 shows the composite EATR for the full database, ranking jurisdictions in descending order. In most jurisdictions, EATRs diverge considerably from the statutory CIT rate; if fiscal depreciation is generous compared to true economic depreciation or if there are other significant base narrowing provisions, the EATR (and also the EMTR) will be lower than the statutory tax rate, i.e. tax depreciation is accelerated. On the other hand, if tax depreciation does not cover the full effects of true economic depreciation, it is decelerated, implying that the tax base will be larger and effective taxation higher.
To allow comparison with the statutory tax rate, the share of the EATR (in percentage points) that is due to a deceleration of the tax base is shaded in light blue in Figure 8; reductions of the statutory tax rate due to acceleration are transparent. In addition, the reduction in the EATR due to an ACE is indicated as a striped area.
18 . OECD | CORPORATE TAX STATISTICS
Among the 57 jurisdictions that provide accelerated depreciation, the averagereduction of the statutory tax rate was 1.7 percentage points in 2019.
The average EATR across jurisdictions (20.1%) is 1.3 percentage points lower than the average statutory tax rate (21.4%).
Disaggregating the results to the asset level shows that fiscal acceleration is strongest for investments in buildings and tangible assets. For these two asset categories, the average EATR across jurisdictions is 18.8% and 19.2%, lower than the average composite EATR (20.1%).

CORPORATE EFFECTIVE TAX RATES . 19
FIGURE 8: Effective average tax rate: OECD, G20 and participating Inclusive Framework jurisdictions, 2019
0% 5% 10% 15% 20% 25% 30% 35% 40% 45% 50%
Acceleration: EATR decrease compared to STR (pp)
Deceleration: EATR increase compared to STR (pp)
Deceleration effects counterbalanced by ACE (pp)
EATR reduction due to ACE (pp)
EATR
Statutory Corporate Tax RateCYMGGYIMNJEY
TCAVGBANDBGR
HUNLIE
CYPMAC
IRLLTU
MUSROUALBHKGPOLHRVSGPESTLVASVN
ISLGBRRUSFIN
CHEDNKSWETUR
CUWITA
CZENOR
ISRIDNTHASVKNLDLUXBEL
JAMCHNAUTUSACANESP
KORPRTKENPNGMEXGRCSENNZLZAFJPN
BWADEUPERSYCMLTARGAUSBRAFRAMSRCHLCOD
CRIIND
20 . OECD | CORPORATE TAX STATISTICS
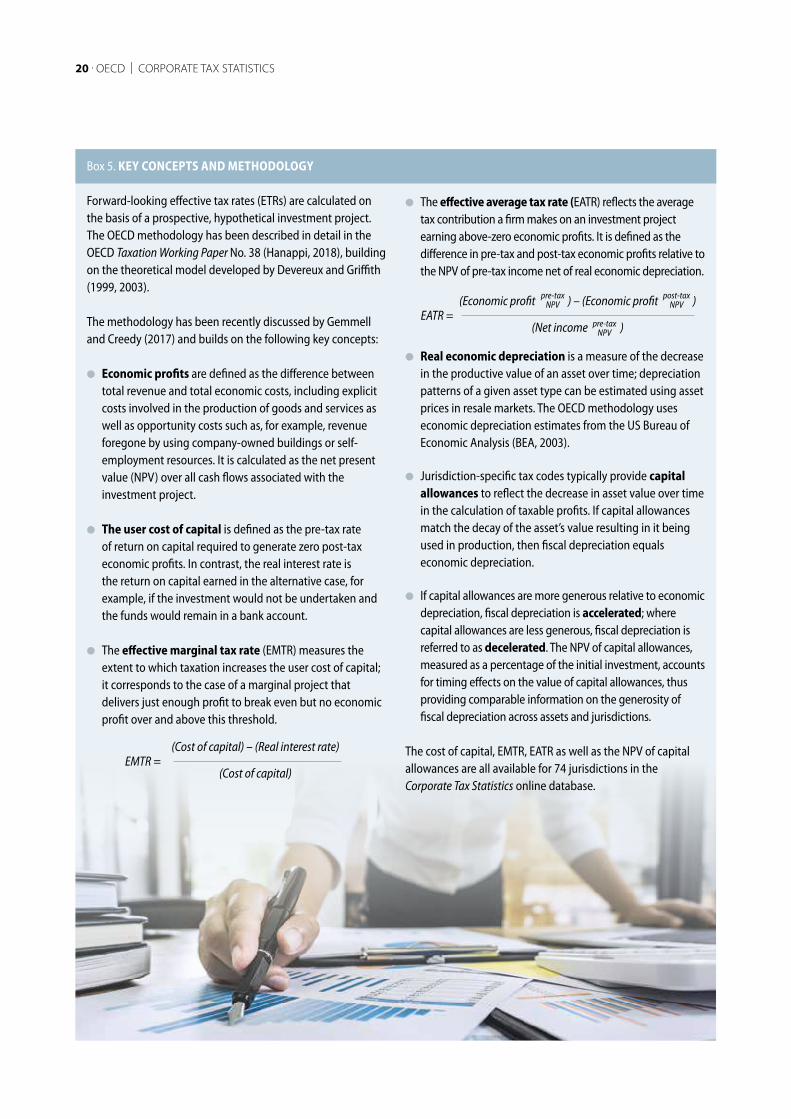
Box 5. KEY CONCEPTS AND METHODOLOGY
Forward-looking effective tax rates (ETRs) are calculated on the basis of a prospective, hypothetical investment project. The OECD methodology has been described in detail in the OECD Taxation Working Paper No. 38 (Hanappi, 2018), building on the theoretical model developed by Devereux and Griffith (1999, 2003).
The methodology has been recently discussed by Gemmell and Creedy (2017) and builds on the following key concepts:
l Economic profits are defined as the difference between total revenue and total economic costs, including explicit costs involved in the production of goods and services as well as opportunity costs such as, for example, revenue foregone by using company-owned buildings or self-employment resources. It is calculated as the net present value (NPV) over all cash flows associated with the investment project.
l The user cost of capital is defined as the pre-tax rate of return on capital required to generate zero post-tax economic profits. In contrast, the real interest rate is the return on capital earned in the alternative case, for example, if the investment would not be undertaken and the funds would remain in a bank account.
l The effective marginal tax rate (EMTR) measures the extent to which taxation increases the user cost of capital; it corresponds to the case of a marginal project that delivers just enough profit to break even but no economic profit over and above this threshold.
l The effective average tax rate (EATR) reflects the average tax contribution a firm makes on an investment project earning above-zero economic profits. It is defined as the difference in pre-tax and post-tax economic profits relative to the NPV of pre-tax income net of real economic depreciation.
l Real economic depreciation is a measure of the decrease in the productive value of an asset over time; depreciation patterns of a given asset type can be estimated using asset prices in resale markets. The OECD methodology uses economic depreciation estimates from the US Bureau of Economic Analysis (BEA, 2003).
l Jurisdiction-specific tax codes typically provide capital allowances to reflect the decrease in asset value over time in the calculation of taxable profits. If capital allowances match the decay of the asset’s value resulting in it being used in production, then fiscal depreciation equals economic depreciation.
l If capital allowances are more generous relative to economic depreciation, fiscal depreciation is accelerated; where capital allowances are less generous, fiscal depreciation is referred to as decelerated. The NPV of capital allowances, measured as a percentage of the initial investment, accounts for timing effects on the value of capital allowances, thus providing comparable information on the generosity of fiscal depreciation across assets and jurisdictions.
The cost of capital, EMTR, EATR as well as the NPV of capital allowances are all available for 74 jurisdictions in the Corporate Tax Statistics online database.
(Cost of capital) – (Real interest rate)
(Cost of capital)EMTR =
(Economic profit ) – (Economic profit )
(Net income )EATR =
pre-taxNPV
pre-taxNPV
post-taxNPV
CORPORATE EFFECTIVE TAX RATES . 21
The composite EATR corresponds to the combination of the unshaded and shaded blue components of each bar. Across the entire sample of jurisdictions, the EATRs range from around 45.7% in India to 0% in the British Virgin Islands, Cayman Islands, Guernsey, Isle of Man, Jersey and the Turks and Caicos Islands. Ranking just above these jurisdictions, Andorra, Bulgaria and Hungary have EATRs around 9%, the lowest non-zero rates in the sample.
Comparing the patterns of tax depreciation across jurisdictions shows that most jurisdictions provide some
degree of acceleration, as indicated by the transparent bars; with the most significant effects being observed in jurisdictions with an ACE, such as Italy, Belgium, Malta, Portugal and Poland among others, as well as in jurisdictions with generous accelerated depreciation, such as Italy, Kenya and Papua New Guinea. While fewer jurisdictions have decelerating tax depreciation rules, the effect of deceleration can become quite large in terms of percentage point increases compared to the statutory tax rate; e.g. in Botswana, Chile and Costa Rica, where intangible assets are non-depreciable.
The data series is currently available for three years, from 2017 to 2019 inclusive. Looking at the development of the composite EATR over this time period shows that the unweighted average composite EATR has been relatively steady over this period and has declined only marginally, similar in magnitude to the decline in the unweighted average statutory CIT rate. However, the GDP-weighted average EATR declined by 3.5 percentage points between 2017 and 2018 due to the US tax reform, which included a reduction in the combined statutory CIT rate by around 13 percentage points as well as an increase in bonus depreciation. The GDP-weighted average EATR declined by a further 0.1 percentage points between 2018 and 2019.
Box 6. ASSET CATEGORIES AND TAX PROVISIONS COVERED
The calculations build on a comprehensive coverage of jurisdiction-specific tax rules pertaining to four quantitatively relevant asset categories:
1. buildings: e.g. office buildings or manufacturing plants;
2. tangible assets: e.g. machinery, cars, furniture or equipment;
3. inventories: e.g. goods or raw materials in stock;
4. intangibles: e.g. acquired patents or trademarks.
The following corporate tax provisions have been covered:
l combined central and sub-central statutory corporate income tax rates;
l asset-specific fiscal depreciation rules, including first-year allowances, half-year or mid-month conventions;
l general tax incentives only if available for a broad group of investments undertaken by large domestic or multinational firms;
l inventory valuation methods including first-in-first-out, last-in-first-out and average cost methods;
l allowances for corporate equity.
The composite ETRs reported in this brochure are constructed in three steps. First, ETRs are calculated separately for each jurisdiction, asset category and source of finance (debt and equity); while the debt-finance case accounts for interest deductibility, jurisdiction-specific limitations to interest deductibility have not been covered in this edition. Second, an unweighted average over the asset categories is taken, separately for both sources of finance. Third, the composite ETRs are obtained as a weighted average between equity- and debt-financed investments, applying a weight of 65% equity and 35% debt finance.
Box 7. MACROECONOMIC SCENARIOS
The two main macroeconomic parameters, inflation and interest rates, interact with the effects of the tax system in various ways and can have ambiguous effects on the effective tax rates (ETRs).
The Corporate Tax Statistics database contains ETR results for three different macroeconomic scenarios. In the first two scenarios, interest and inflation rates are held constant; the third scenario uses jurisdiction-specific macroeconomic parameters. While the former approach addresses the question of how differences in tax systems compare across jurisdictions holding other factors constant, the latter approach gives better indications on the tax effects on investment incentives in a specific jurisdiction at a specific point in time.
The results published in this brochure build exclusively on the macroeconomic scenario with constant 3% interest and 1% inflation rates, however, results from the two additional macroeconomic scenarios are available in the online database.

22 . OECD | CORPORATE TAX STATISTICS
EFFECTIVE MARGINAL TAX RATES
Figure 9 shows the ranking based on the composite EMTR. As highlighted above, the EMTR measures the effects of taxation on the pre-tax rate of return required by investors to break even. While the effects of tax depreciation and macroeconomic parameters work in the same direction as in the case of the EATR, their impacts on the EMTR will generally be stronger because marginal projects do not earn economic profits (see Box 5). As a consequence, jurisdictions with relatively high statutory CIT rates and relatively generous capital allowances, notably India, Côte d’Ivoire, France, Peru and Germany, rank lower than in Figure 8. On the other hand, jurisdictions with decelerating fiscal depreciation, including the Czech and Slovak Republics or Thailand, are ranked higher based on the EMTR, as shown in Figure 9.
If investment projects are financed by debt, it is also possible for the EMTR to be negative, which means that the tax system, notably through interest deductibility, reduces the pre-tax rate of return required to break even and thus enables projects that would otherwise not have been economically viable. Figure 9 shows that the composite EMTR, based on a weighted average between
equity- and debt-financed projects, is negative in 10 out of 74 jurisdictions; this result is due to the combination of debt finance with comparatively generous tax depreciation rules. For jurisdictions with an ACE, the composite EMTR will generally be lower because of the notional interest deduction available for equity-financed projects.
Comparing EMTRs in 2019 with the previous year shows that changes in the corporate tax provisions covered in the calculations had significant effects on EMTRs in six jurisdictions, in decreasing order of impact: Poland, Canada, the United Kingdom, Norway, France and Greece. While the effects in the latter three jurisdictions have been small, substantial effects are observed in the former three, as shown in Figure 9. The largest change is observed in Poland due to the introduction of an ACE, driving down the EMTR into negative territory in 2019. Canada has increased the acceleration of fiscal depreciation for non-residential structures, tangible assets as well as acquired intangibles. The United Kingdom has introduced fiscal depreciation for non-residential structures, investments which were not previously subject to depreciation for tax purposes.
9 jurisdictions had an allowance for corporate equity (ACE) in 2019: Belgium, Brazil, Cyprus, Italy, Liechtenstein, Malta, Poland, Portugal and Turkey. Including this provision in their tax code has significant effects on the incentive to expand existing investments as measured by the EMTR.

-60% -50% -40% -30% -20% -10% 0% 10% 20% 30%
Change 2018-19EMTR
ITABELMLTPRT
POL
LIEKENBRAPNGCYPCYMESTGGYIMNJEYLVATCAVGB
HRVMEXANDHUNLTU
ROUDNKSENIDN
BGRCODNLDHKG
ISLIND
MUS
LUX
MACJPNIRL
TUR
SWE
RUSCHEZAF
CUW
CAN
SGPALBUSADEUCHNSVNJAMFIN
KORPER
GBRISR
AUTSYC
NOR
FRA
GRC
ARGNZLESPSVKAUSTHABWACZECHLMSRCRI
CORPORATE EFFECTIVE TAX RATES . 23
FIGURE 9: Effective marginal tax rate: OECD, G20 and participating Inclusive Framework jurisdictions, 2019

EFFECTIVE TAX RATES BY ASSET CATEGORIES
The composite ETRs can be further disaggregated by asset categories; jurisdiction-level EATRs and EMTRs by asset categories are available in the online Corporate Tax Statistics database. Figure 10 summarises these data on asset-level ETRs. The upper panel provides more information on the distribution of asset-specific EATRs, comparing them to the distribution of statutory CIT rates. The first vertical line depicts information on the statutory CIT rates; it shows that the mean (i.e. the red triangle in the middle of the first vertical line) and the median (the blue circle) are both around 22%, while the 50% of jurisdictions in the middle of the distribution have statutory CIT rates between 16% and 30%.
The other four vertical lines in the upper panel of Figure 10 illustrate the distribution of EATRs across jurisdictions for each of the four asset categories: buildings, tangible assets, inventories and intangibles. Comparing them with the statutory CIT rate shows that the distribution of EATRs is more condensed for investments in buildings, with the middle 50% of the country distribution ranging between 15% and 25%. For investments in tangible assets, the middle 50% of jurisdictions have EATRs between around 14% and 26%. However, the mean EATR on investments in tangible assets is around 1.4 percentage points lower than the median, indicating that some jurisdictions have much lower EATRs on this type of investment. For investments in the other two asset categories, the distributions are similar to the statutory tax rate, although the comparatively high mean EATR for investments in intangibles suggests that there are several outliers at the top of the distribution.
The lower panel depicts boxplots illustrating the EMTR distribution for each of the asset categories. From this graph the following insights can be drawn:
l Investments in tangible assets benefit more often from accelerated tax depreciation than other investments; as a result, the corresponding vertical line is more condensed compared to the statutory CIT rate, while the mean and median are both close to zero.
l Investments in buildings are also often accelerated, as evidenced by the vertical line that is also condensed between values from around -4% to 7%. Compared to tangible assets, however, the mean is much lower than the median suggesting that some jurisdictions offer a particularly generous tax treatment for investments in buildings.
l Investments in inventories often benefit from lower EMTRs, compared to the statutory tax rate, although to a lesser extent than the first two asset categories.
l Marginal investments in acquired intangibles can be subject to very different EMTRs in different jurisdictions, which is reflected in the vertical line that stretches out more than the others, ranging from around 0% to around 25%. This result is driven, on the one hand, by the variation surrounding the actual economic depreciation of intangible assets as well as, on the other hand, different policy treatments across jurisdictions.
24 . OECD | CORPORATE TAX STATISTICS

FIGURE 10 : EATR and EMTR: Variation across jurisdictions and assets: OECD, G20 and participating Inclusive Framework jurisdictions, 2017
Buildings Tangible assets Inventories Intangibles Statutory corporateincome tax rate
-5%
0%
5%
10%
15%
20%
25%
30%
35%
-5%
0%
5%
10%
15%
20%
25%
30%
35%
Buildings Tangible assets Inventories Intangibles
25th percentile Median Mean 75th percentile
EFFECTIVE AVERAGE TAX RATE (EATR)
EFFECTIVE MARGINAL TAX RATE (EMTR)
Statutory corporateincome tax rate
CORPORATE EFFECTIVE TAX RATES . 25

Tax incentives for research and development (R&D)Incentivising investment in research and development (R&D) by businesses ranks high in the innovation policy agenda of many jurisdictions. R&D tax incentives have become a widely used policy tool to promote business R&D in recent times. Several jurisdictions offer them in addition to direct forms of support such as R&D grants or government purchases of R&D services. R&D tax incentives can provide relief to R&D expenditures, e.g. the wages of R&D staff and/or to the income derived from R&D activities, e.g. patent income. The indicators referred to in this section relate to expenditure-based R&D tax incentives. An overview of income-based tax incentives is available in the next section on Intellectual Property regimes. The significant variation in the design of expenditure-based tax relief provisions across jurisdictions and over time affects the implied generosity of R&D tax incentives.
26 . OECD | CORPORATE TAX STATISTICS
The Corporate Tax Statistics database incorporates two R&D tax incentives indicators that offer a complementary view of the extent of R&D tax support provided through expenditure-based R&D tax incentives:
l Government tax relief for business R&D (GTARD) reflects the cost of R&D tax provisions to the government. It includes the cost of incentives available at the national and subnational level where applicable and relevant data are available. This indicator is complemented with figures of direct funding of business R&D to provide a more complete picture of total government support to business R&D investment.
l Implied marginal tax subsidy rates for R&D (1-B-Index) reflect the design and implied generosity of R&D tax incentives for an extra unit of R&D invested by firms of different size and profitability. It refers to R&D tax incentives available at the national level.
These indicators feature in the OECD R&D Tax Incentive database compiled by the OECD Directorate for Science, Technology and Innovation.
Box 8. INDICATORS OF R&D TAX INCENTIVES

A snapshot of R&D tax incentives in the OECD
1. A widespread policy-toolNumber of jurisdictions offering tax relief to R&D expenditures:
2. An increasing weight in public finances
Total cost to the government 2017 Increase
from 2006
Tax Support $57 bn USD 112%
Direct Support $48 bn USD -1%
3. Governments’ policy mix: a shift from direct to tax measuresThe policy mix to support business R&D, OECD, 2006 vs 2017
TAX INCENTIVES FOR RESEARCH AND DEVELOPMENT . 27
KEY INSIGHTS:
l R&D tax incentives are increasingly used to promote business R&D with 30 out of the 36 OECD jurisdictions offering tax relief on R&D expenditures in 2019, compared to 19 in 2000.
l Most jurisdictions use a combination of direct support and tax relief to support business R&D, but the policy mix varies.
l Over time, there has been a shift in the policy mix towards a more intensive use of R&D tax incentives to deliver support for business R&D.
l In 2019, implied marginal R&D tax subsidy rates were highest for profitable small and medium-sized enterprises (SMEs) and profitable large firms in France, Portugal and Chile.
l Eighteen OECD jurisdictions offer refundable (payable) tax credits or equivalent incentives. Such provisions explicitly target SMEs and young firms vis-à-vis large enterprises in Australia, Canada and France.
l R&D tax incentives have become more generous, on average, over time. This is due to the higher uptake and increases in the generosity of R&D tax relief provisions. In recent years, this trend has been stabilising.
Note: Data refers to 2006 and 2017 or closest year for which data is available. Estimates of tax support exclude subnational R&D tax incentives as data was not available in 2006 . Israel is not included in these statistics as data on tax support is not available throughout time .
64%Direct support
R&D tax support
45%
36%55%
2006 2017
0 5 10 15 20 25 30 35
2000: 19 out of 36 OECD jurisdictions
2019: 30 out of 36 OECD jurisdictions

28 . OECD | CORPORATE TAX STATISTICS
Data and notes: https://oe.cd/ds/rdtax.
Source: OECD (2020), R&D Tax Incentive Database, http://oe.cd/rdtax (accessed in June 2020).
FIGURE 11: Direct government funding and tax support for business R&D (BERD) as a percentage of GDP, 2017
0
0.1
0.2
0.3
0.4
0.5 %
RUS
FRA
BEL
GBR
KOR
CAN
AUT
ISL
NO
RU
SA2
HU
NIR
LIT
AN
LD SVN
AUS
JPN
PRT
CZE
CHN
2
SWE
BRA
ISR1
TUR
NZL
POL
ESP2
DEU
DN
KFI
NLU
XRO
UM
LT EST
CHL
LTU
CHE
GRC SV
KZA
FM
EX LVA
BGR
HRV
ARG
CYP
1. Data on tax support not available 2. Data on subnational tax support not available
Direct funding of BERD Tax support for BERD Subnational tax Support for BERD Total 2006 (excl. subnational tax support)
GOVERNMENT SUPPORT FOR BUSINESS R&D
Indicators of government tax relief for business R&D (GTARD) combined with data on direct R&D funding provide a more complete picture of governments’ efforts to support business R&D (BERD). Together, these indicators facilitate the cross-jurisdiction comparison of the policy mix provided by governments to support R&D and the monitoring of any changes over time.
Between 2006 and 2017, total government support (direct and national tax support) for business R&D expenditure as a percentage of GDP increased in 29 out of 46 jurisdictions for which relevant data are available. The Russian Federation, France and Belgium provided the largest levels of support in 2017. Subnational R&D tax incentives account for nearly 30% of total tax support in Canada in 2017, playing a comparatively smaller role in Hungary (16% of total tax support) and Japan (less than 1% of total tax support).
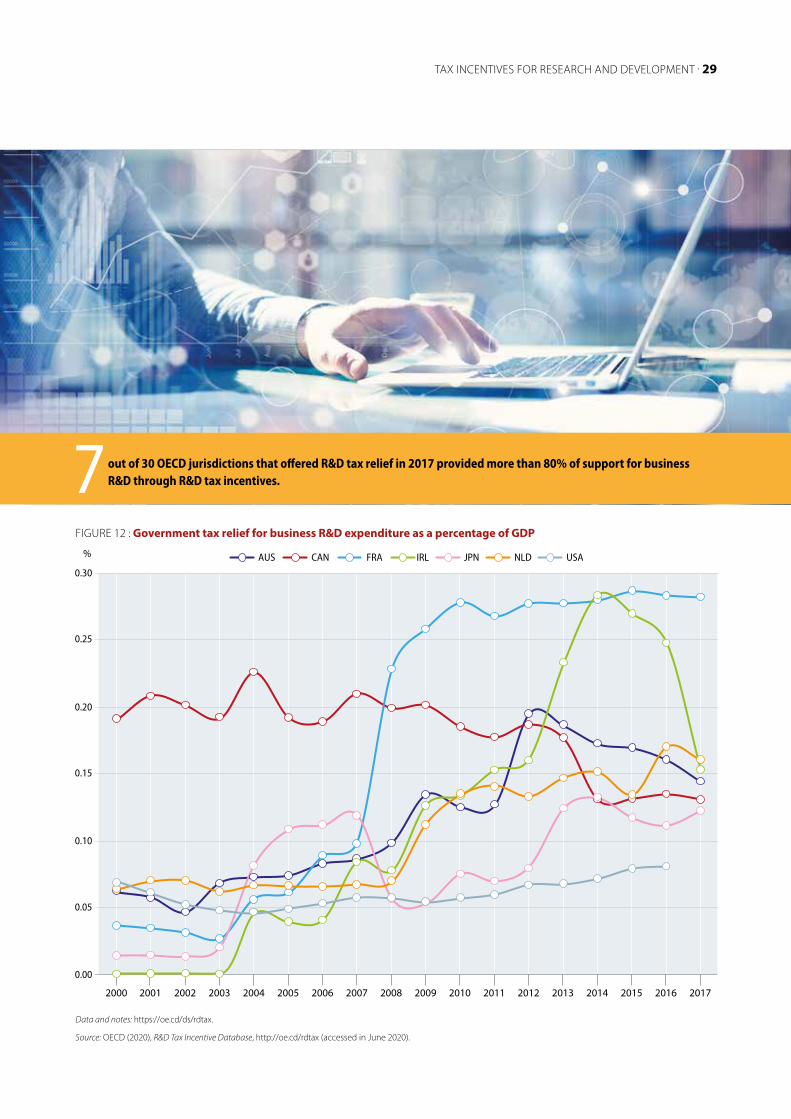
Most jurisdictions integrate both direct and indirect forms of R&D support in their policy mix, but to different degrees. In 2017, 15 OECD jurisdictions offered more than 50% of government support for business R&D
through the tax system, and this percentage reached 80% or more in seven jurisdictions: the Netherlands, Australia, Italy, Japan, Lithuania, Belgium and Portugal. Five OECD jurisdictions relied solely on direct support in 2017. These are Estonia, Finland, Germany, Luxembourg and Switzerland.
Differences in the cost of R&D tax relief reflect differences in design features and eligibility rules, but also the role of factors impacting the demand for tax support by firms and their ability to claim relief. From 2000 to 2017, the absolute and relative magnitude of R&D tax support increased throughout many OECD and partner economies, only interrupted by the onset of the global financial and economic crisis. The volume of R&D tax support typically increases following the first-time launch (e.g. Ireland in 2004) or the introduction of new or redesigned tax relief measures (e.g. France in 2008, Japan in 2003 and 2013; the Netherlands in 2012 and 2016). The use of carry-over and refundability provisions by firms with insufficient tax liability also influences the cost of tax support, particularly after an economic downturn (e.g. the observed increased for Ireland after the financial crisis).
TAX INCENTIVES FOR RESEARCH AND DEVELOPMENT . 29
2000 2001 2002 2003 2004 2005 2006 2007 2008 2009 2010 2011 2012 2013 2014 2015 2016 2017
0.00
0.05
0.10
0.15
0.20
0.25
0.30
% AUS CAN FRA IRL JPN NLD USA
Data and notes: https://oe.cd/ds/rdtax.
Source: OECD (2020), R&D Tax Incentive Database, http://oe.cd/rdtax (accessed in June 2020).
out of 30 OECD jurisdictions that offered R&D tax relief in 2017 provided more than 80% of support for business R&D through R&D tax incentives.7
FIGURE 12 : Government tax relief for business R&D expenditure as a percentage of GDP

30 . OECD | CORPORATE TAX STATISTICS
Combining time-series estimates of GTARD and direct funding helps illustrate variations in governments’ policy mix over time. In recent years, many jurisdictions have granted a more prominent role to R&D tax incentives. Compared to 2006, the share of tax support in total government support in 2017 increased in 26 jurisdictions out of 35 OECD jurisdictions for which data are available. This implies a general shift towards less discretionary forms of support for business R&D, with some exceptions, e.g. Canada and Hungary that increased their reliance on direct support or the United States that sustained its level of support.
IMPLIED MARGINAL TAX SUBSIDY RATES FOR R&D
Implied marginal tax subsidy rates, based on the B-Index indicator (see Box 11), provide a synthetic indicator of the expected generosity of the tax system towards an extra unit of firms’ R&D investment. This indicator, available for four combinations of firm size and profitability scenarios, allows the comparison of the preferential treatment to R&D expenditure across 48 OECD and partner economies during the period 2000-19.
Implied marginal tax subsidy rates are inherently linked to both the design features of the R&D tax incentive as well as to the general provisions of the tax system, e.g. statutory CIT rates, baseline depreciation rules. Subsidies vary also with business characteristics such as firm size and profitability. Some jurisdictions such as Australia or Canada offer enhanced tax relief provisions for SMEs that are not available to large firms. This induces a gap in the expected tax subsidy rates estimated for these two types of firms.
Refunds and carry-over provisions are common to promote R&D in firms that would not otherwise be able to utilise the support provided by the tax system. This may arise when firms do not have sufficient tax liability to offset earned deductions or do not make a profit. Implied marginal subsidy rates are calculated under two scenarios: profitable firms (which are able to fully utilise the tax support available to them) and loss-making firms (which may not be able to fully utilise the tax support available to them) to reflect the varying impact of these provisions. Refundability provisions such as those available in Austria and Norway align the subsidy for profitable and loss-making firms. Compared to refunds, carry-over provisions, such as those available in Spain, imply a lower subsidy for loss-making firms compared to profitable firms as the benefits may only be used in the future. In jurisdictions where no such provisions exist, such as Brazil or Japan, loss-making firms experience a full-loss of tax benefits.
Time-series estimates of implied marginal tax subsidy rates allow an analysis of jurisdiction-specific and aggregate trends in the provision and generosity of R&D tax support by firm size and profit scenario. Changes in subsidy rates are driven by first-time introductions of R&D tax support (Belgium in 2005, Mexico in 2017), additions of new R&D tax provisions to existing ones (Hungary in 2013) and reforms of existing R&D tax relief measures (France in 2013). Over time, R&D tax incentives have become more generous, on average, although they have stabilised in recent years. Persistently higher subsidy rates are offered over time to SMEs vis-à-vis large firms in both the profit scenarios considered (profitable and loss-making).
Box 9. MEASURING GOVERNMENT SUPPORT FOR R&D
Direct government support for business R&D: This indicator measures the component of business R&D expenditures that businesses report to be directly funded by all levels of government. These estimates comprise government grants (transfers) and payments to firms in return for R&D services and exclude indirect forms of support that are not necessarily targeted towards R&D or that are expected to be repaid. By convention, estimates of tax support for R&D are also excluded because effective support may depend on taxable profits or payable taxes (OECD, 2015). This indicator features in the OECD Main Science Technology Indicators and is based on data collected by the OECD in its R&D Statistics database.
Government tax relief for R&D expenditures (GTARD): This indicator estimates the cost to the government of R&D tax relief provisions. GTARD refers to the enhanced relief available to taxpayers for their engagement in R&D activities relative to a normal or baseline tax structure (OECD, 2015). Cost figures reported refer to tax relief for business R&D offered through expenditure-based R&D tax incentives available at the national (central) government level. Estimates of GTARD are provided by the OECD R&D tax incentive network integrated by the Working Party of National Experts on Science and Technology Indicators in collaboration with experts in Public Finance as part of the OECD R&D Tax Incentives data collection led by the Directorate of Science, Technology and Innovation.

Data and notes: https://oe.cd/ds/rdtax.
Source: OECD (2020), R&D Tax Incentive Database, http://oe.cd/rdtax (accessed in June 2020).
- 0.1
0.0
0.2
0.1
0.3
0.4
0.5 1-B index
FRA
PR
TTH
AC
HL
CO
LES
PLT
UC
AN
NLD IR
LSV
KG
BR
BR
AK
OR
ISL
NO
RP
OL
MLT
CZ
ESV
NH
UN
JPN
AU
SN
ZL
AU
TZ
AF
BEL
RU
SR
OU
GR
CC
HN
MEX
TUR
SWE
USA
HR
VIT
AES
TIS
RB
GR
LVA
DN
KFI
NC
YP
CH
ELU
XD
EUA
RG
Large, pro�table �rm SME, pro�table �rm Large, loss-making �rm SME, loss-making �rm
TAX INCENTIVES FOR RESEARCH AND DEVELOPMENT . 31
Average implied tax subsidy rates per dollar invested in R&D in OECD
jurisdictions, 2019
Large, profitable firm
0.14
SME, profitable firm
0.17
Large, loss-making firm
0.12
SME, loss-making firm
0.14
FIGURE 13: Implied marginal tax subsidy rates on business R&D expenditures, 2019

Tax support provisions lower the after-tax cost of performing R&D. More generous incentives reduce the level of return a firm requires before tax to break even after tax on one additional unit of R& D investment. The B-index captures this pre-tax rate of return for a representative firm on a marginal investment across jurisdictions and over time. The B-index represents the tax component of the cost of capital for an R&D asset (see Box 5).
The B-index is computed as the after-tax cost of investing one unit of R&D taking all R&D tax provisions into consideration normalised by the net-of-tax rate (1-CIT rate) for cross-jurisdiction comparability. When no enhanced provisions are in place, firms are generally allowed to deduct R&D costs from their taxable profits. The B-index in this case equals one. This serves as a benchmark to assess the extent to which the tax system subsidises R&D. Enhanced relief provisions reduce the after-tax cost of R&D yielding a B-index lower than one. Implied tax subsidy rates can be computed as the distance to the benchmark, i.e. as one minus the B-index, and give an indication of the preferential treatment of R&D in a given
tax system.The more generous the tax provisions for R&D, the higher the implied subsidy rates for R&D.
The calculation of the B-index is customised to each jurisdiction’s specific design features and to capture the general parameters of the tax system. It focuses on expenditure-based R&D tax incentives and schemes that apply at the central/federal level. In the generation of R&D assets, firms usually incur a combination of current costs and capital investments. The enhanced tax treatment of each component differs across jurisdictions. To facilitate interpretability, the modelling of the B-index considers a fixed mix of 90% current expenditure (60% labour; 30% other current expenditure) and 10% capital (5% machinery and equipment; 5% buildings and land) to produce the R&D asset, reflecting average shares in OECD R&D statistics. A fixed project composition ensures that variations across jurisdictions can be attributed to taxation. The indicator is computed for four different scenarios of firm size (SMEs and large firms) and profitability (profitable and loss-making), as these represent major defining business features that impact the notional level of tax subsidy firms can expect to receive.
Box 10. UNDERSTANDING AND INTERPRETING THE B-INDEX INDICATOR
Data and notes: https://oe.cd/ds/rdtax.
Source: OECD (2020), R&D Tax Incentive Database, http://oe.cd/rdtax (accessed in June 2020).
-0.05
0.00
0.05
0.10
0.15
0.20
0.25
0.30
0.35
0.40
0.45
2000 2001 2002 2003 2004 2005 2006 2007 2008 2009 2010 2011 2012 2013 2014 2015 2016 2017 2018 2019
1-B-index AUT BEL GBR HUN KOR MEX PRT
32 . OECD | CORPORATE TAX STATISTICS
FIGURE 14: Implied tax subsidy rates on R&D expenditures in a selected number of jurisdictions

Country-by-Country reporting was implemented as part of Action 13 of the OECD/G20 BEPS Project to support jurisdictions in combating base erosion and profit shifting (BEPS). While the main purpose of Country-by-Country Reports (CbCRs) is to support tax administrations in the high-level detection and assessment of transfer pricing and other BEPS-related risks, data collected from CbCRs can also play a role in supporting the economic and statistical analysis of BEPS activity and of multinational enterprises (MNEs) in general (see Box 11 for detail on Action 13).
Under Action 11 of the BEPS Project, acknowledging the need for additional sources of data on MNEs, jurisdictions agreed to regularly publish anonymised and aggregated CbCR statistics to support the ongoing economic and statistical analysis of MNEs and BEPS. The 2020 edition of Corporate Tax Statistics includes the first release of aggregated CbCR statistics, which are for the year 2016 and include CbCRs filed in 26 jurisdictions, covering nearly 4,000 MNE groups. This new dataset contains a vast array of information on the global financial and economic activities of MNEs. A description of the CbCR data and how they are collected can be found in Box 12.
The aggregated CbCR data are subject to a number of limitations that need to be borne in mind when carrying out any economic or statistical analysis (see Box 13). Nonetheless, the data provide some preliminary insights into the potential activities of MNEs that may not be observable through existing data sources:
l The CbCR data provide global information on MNEs’ activities, with more granular information than is available in other data sources such as consolidated financial accounts.5
l The CbCR data include information on MNE employees, related and unrelated party revenues, profits and taxes paid; variables that are not comprehensively described in other datasets for most jurisdictions.
l The data ensure the inclusion of all global activities of included MNEs.
l The data allows for the domestic and foreign activities of MNEs to be separately identified.6 Depending on the reporting jurisdiction, it allows for an analysis of MNEs’ activities in investment hubs and developing jurisdictions thanks to a detailed geographical disaggregation.
l Information is reported by jurisdiction of tax residence and not jurisdiction of incorporation.
l The CbCR data provide cross-country information on MNEs major business activities (e.g. manufacturing, IP holding, sales) in different jurisdictions.
The CbCR data thus provide governments and researchers with important new information to analyse MNE behaviour, particularly in relation to tax, allowing for the construction of a more complete view of the global activities of the largest MNEs than is possible using existing sources.
Anonymised and aggregated Country-by-Country Report (CbCR) statisticsINTRODUCTION
General data characteristics
5. In the case of the United States, CbCR data are less granular than IRS Form 5471, 8865, and 8858 data.
6. With the exception of stateless income, which could relate to either domestic or foreign activities.

34 . OECD | CORPORATE TAX STATISTICS
BEPS Action 13 is part of the transparency pillar of the OECD/G20 BEPS project, supporting jurisdictions in combating BEPS. In many cases, jurisdictions already have rules in place to deal with BEPS risks posed by MNE groups, but may not previously have had access to information to identify cases where these risks arise. BEPS Action 13 helps to address this by providing new information for use by tax administrations in high-level risk assessment of transfer pricing and other BEPS-related risks.
Feedback from tax administrations indicates that they are using CbCRs to combat BEPS, in combination with other tools: (i) to help identify MNE groups for possible audit, (ii) to help identify MNE groups that do not need to be audited (de-selection), and (iii) to help plan audits or other enquiries. The specific approaches adopted vary depending upon each tax administration’s general approach to risk assessment. A number of common remarks on the role of CbCRs include:
l CbCRs may only be used in a high level risk assessment of an MNE. CbCRs may not be used as evidence that BEPS exists or as a substitute for substantive enquiries, and should be used alongside other information available to
tax administrations. It is unlikely that success in particular cases will be able to be attributed to CbCRs specifically.
l There may be a significant time delay between a CbCR being filed and the outcomes of a transfer pricing audit. CbCRs may be used for the purposes of a high level risk assessment and in planning a tax audit, but it will only be determined whether an MNE group is in fact engaged in BEPS once further enquiries are completed, which may take a number of years.
l There are limitations with respect to the use of CbCR data, as described in Box 13 and the associated disclaimer accompanying the data.
While CbCRs are an important new tool, tax administrations are using them in concert with a range of other tools in their efforts to combat BEPS. The OECD has developed several tools to support tax administrations in using CbCRs and, in particular, in undertaking multilateral activity to risk assess MNE groups. These include regular CbCR risk assessment workshops; the CbCR Tax Risk Evaluation and Assessment Tool (TREAT); a Tax Risk Assessment Questionnaire (TRAQ), which can be provided by a tax administration to an MNE group with an invitation to explain key indicators of possible risk; and the CbCR Effective Risk Assessment Handbook, released in 2017.
Box 11. BEPS ACTION 13
MNE GROUP STRUCTURE
An MNE group is a collection of enterprises related through ownership or control such that the group is either required to prepare consolidated financial statements for financial reporting purposes under applicable accounting principles or would be so required if equity interests in any of the enterprises were traded on a public securities exchange.
An entity is any separate business unit of an MNE group that is included in the consolidated financial statements of the MNE group for financial reporting purposes.
The ultimate parent entity (UPE) directly or indirectly owns a sufficient interest in one or more other entities of the MNE group such that it is required to prepare consolidated financial statements.
A sub-group is formed by the combined entities of an MNE group operating in one tax jurisdiction.
Ultimate parent sub-group
MNE group XYZ operates in France, Mexico and Egypt. The ultimate parent entity is in France.
Foreign sub-groups
Entity 1(UPE)
Entity 2
FRANCE(Ultimate Parent
Jurisdiction)
Entity 3
EGYPT(Foreign Jurisdiction)
Entity 5Entity 4
MEXICO(Foreign Jurisdiction)
Note: Definitions are adapted for brevity, further details are available in Action 13 Final Report (Annex IV to Chapter V, Transfer Pricing Documentation and Country-by-Country Reporting, Action 13 - 2015 Final Report
https://doi.org/10.1787/9789264241480-en).

ANONYMISED AND AGGREGATED COUNTRY-BY-COUNTRY REPORT (CBCR) STATISTICS . 35
The anonymised and aggregated CbCR statistics are constructed in two main steps. First, all large MNEs (i.e. with consolidated revenues above EUR 750 million) file CbCRs, typically with the tax administration in the jurisdiction of their ultimate parent entity (UPE). Second, in each jurisdiction, tax administrations or other government bodies compile the different CbCR filings into a single dataset according to their specific confidentiality standards. This results in a single anonymised and aggregated dataset covering all the jurisdiction’s MNEs subject to the filing requirement, which is shared with the OECD. An MNE group is usually required to file its CbCR one year after the closing date of its fiscal year. To construct the first aggregate set of data, covering CbCRs with fiscal years starting between 1 January 2016 and 1 July 2016, jurisdictions started receiving CbCRs for the first time in late 2017/ early 2018. The OECD has worked closely with members of the Inclusive Framework to develop a common reporting template and to overcome a range of legal and technical issues to ensure that jurisdictions have been able to start submitting aggregate data to the OECD.
While there are 137 members of the Inclusive Framework, 58 jurisdictions received CbCRs for fiscal years starting in 2016, with only 46 having implemented mandatory reporting for
the fiscal year 2016 and 12 having received CbCRs under voluntary filing. Of the jurisdictions receiving CbCRs, only 35 were estimated to have received a sufficient number of CbCRs to be able to provide aggregated statistics while ensuring taxpayer confidentiality. Of these 35, the first data release presents CbCR statistics from a total of 26 jurisdictions, including information on the activities of nearly 4,000 MNE groups (See Table 1).
To provide an overview of the global activities of MNEs, jurisdictions have provided the OECD with anonymised and aggregated tabulations of the following information: number of CbCRs, number of sub-groups, number of entities, total unrelated and related party revenues (and their sum, total revenues), profit or loss before income tax, income tax paid (on a cash basis), current year income tax accrued, stated capital, accumulated earnings, number of employees, tangible assets other than cash and cash equivalents and the main business activity (or activities) of each constituent entity. Aggregation is performed at the sub-group level according to certain sub-group or group characteristics and reported according to these different criteria in several tables (See Table 2).
Box 12. THE ANONYMISED AND AGGREGATED CBCR DATA: COVERAGE AND COLLECTION PROCESS
COVERAGE OF ANONYMISED AND AGGREGATED CBCR STATISTICS
Inclusive Framework 137 jurisdictions
58 jurisdictions accepted CbCRs for FY 2016
35 jurisdictions estimated to have received
20+ CbCRs
Anonymised and aggregated CbCR statistics provided to
the OECD by 26 jurisdictions(74% coverage rate)

36 . OECD | CORPORATE TAX STATISTICS
TABLE 1: Sample composition and average values per CbCR for key financial variables
ReportingJurisdiction
Level of data disaggregation
Number of CbCRs
Unrelated party revenues
Tangible assets (other than cash)
Income tax accrued
Number of employees
1 Australia 56 Individual jurisdictions 110 5 034 4 547 150 12 989
2 Austria Continents 73 4 956 2 959 57 13 437
3 Belgium 39 Individual jurisdictions 54 5 426 4 185 156 13 767
4 Bermuda 72 Individual jurisdictions 39 15 004 17 269 248 14 903
5 Canada 9 Individual jurisdictions 160 5 116 7 810 71 13 550
6 Chile 13 Individual jurisdictions 32 3 359 3 594 55 22 192
7 China 89 Individual jurisdictions 82* 41 201 83 294 882 172 714
8 Denmark 95 Individual jurisdictions 39 3 991 2 698 76 26 254
9 FinlandAll foreign jurisdictions combined
54 3 930 1 585 55 10 638
10 France 80 Individual jurisdictions 181 12 684 6 740 268 37 075
11 India 162 Individual jurisdictions 165 4 684 6 807 129 29 978
12 Indonesia 29 Individual jurisdictions 19 6 750 8 083 176 20 897
13 IrelandAll foreign jurisdictions combined
45 5 415 2 951 44 15 012
14 Italy 104 Individual jurisdictions 130 5 259 3 131 97 12 337
15 Japan 28 Individual jurisdictions 715 8 745 4 052 171 24 336
16 KoreaAll foreign jurisdictions combined
185 8 197 5 426 139 15 208
17 Luxembourg 80 Individual jurisdictions 120 3 808 1 746 21 12 129
18 Mexico 102 Individual jurisdictions 74 5 303 4 293 125 28 099
19 NetherlandsAll foreign jurisdictions combined
155 8 951 5 240 111 23 695
20 Norway Continents 60 4 058 4 257 131 7 212
21 Poland 3 Individual jurisdictions 29 3 098 3 062 35 14 165
22 Singapore 11 Individual jurisdictions 32 6 345 6 385 136 18 367
23 Slovenia 4 Individual jurisdictions 7 1 591 722 9 5 506
24 South Africa 126 Individual jurisdictions 44 3 385 4 666 75 25 239
25 Sweden Continents 88 6 677 3 793 79 20 074
26 United States 137 Individual jurisdictions 1 101 10 209 5 646 239 25 026
Note: Currency values (all values except the number of CbCRs and number of employees) are reported in millions of USD. Average values are obtained by dividing totals (i.e. the sum of parent and foreign jurisdiction figures) by the number of CbCRs. Level of data disaggregation provided depends on data confidentiality standards applicable in each reporting jurisdiction.
* The 82 CbCRs reported for China represents the number of CbCRs that were used to prepare the CbCR statistics in 2016. However, these 82 CbCRs do not represent all of the CbCRs that were filed in China in 2016. It is estimated that many more CbCRs were filed in China for the fiscal year 2016, however, China only prepared statistics from CbCRs for which data quality was satisfactory. In 2017, it is expected that China will provide statistics from a larger number of CbCRs.
Source: 2016 Anonymised and Aggregated CbCR statistics
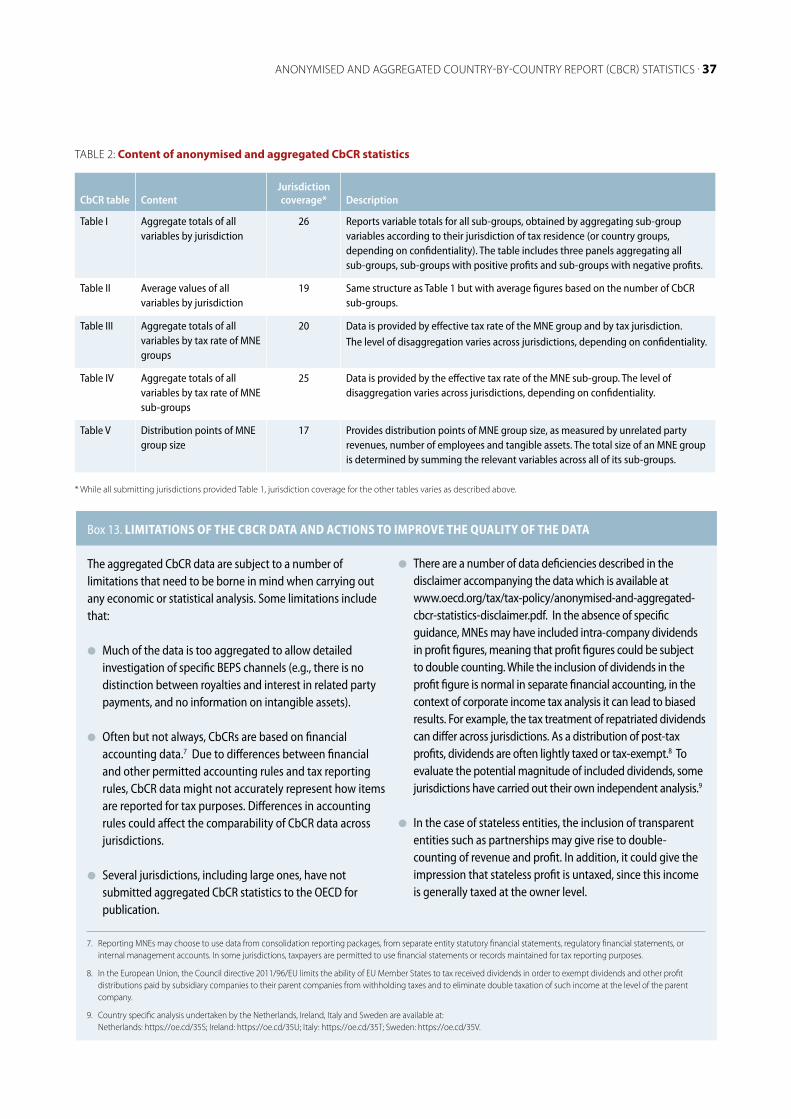
ANONYMISED AND AGGREGATED COUNTRY-BY-COUNTRY REPORT (CBCR) STATISTICS . 37
TABLE 2: Content of anonymised and aggregated CbCR statistics
CbCR table ContentJurisdiction coverage* Description
Table I Aggregate totals of all variables by jurisdiction
26 Reports variable totals for all sub-groups, obtained by aggregating sub-group variables according to their jurisdiction of tax residence (or country groups, depending on confidentiality). The table includes three panels aggregating all sub-groups, sub-groups with positive profits and sub-groups with negative profits.
Table II Average values of all variables by jurisdiction
19 Same structure as Table 1 but with average figures based on the number of CbCR sub-groups.
Table III Aggregate totals of all variables by tax rate of MNE groups
20 Data is provided by effective tax rate of the MNE group and by tax jurisdiction.
The level of disaggregation varies across jurisdictions, depending on confidentiality.
Table IV Aggregate totals of all variables by tax rate of MNE sub-groups
25 Data is provided by the effective tax rate of the MNE sub-group. The level of disaggregation varies across jurisdictions, depending on confidentiality.
Table V Distribution points of MNE group size
17 Provides distribution points of MNE group size, as measured by unrelated party revenues, number of employees and tangible assets. The total size of an MNE group is determined by summing the relevant variables across all of its sub-groups.
* While all submitting jurisdictions provided Table 1, jurisdiction coverage for the other tables varies as described above.
The aggregated CbCR data are subject to a number of limitations that need to be borne in mind when carrying out any economic or statistical analysis. Some limitations include that:
l Much of the data is too aggregated to allow detailed investigation of specific BEPS channels (e.g., there is no distinction between royalties and interest in related party payments, and no information on intangible assets).
l Often but not always, CbCRs are based on financial accounting data.7 Due to differences between financial and other permitted accounting rules and tax reporting rules, CbCR data might not accurately represent how items are reported for tax purposes. Differences in accounting rules could affect the comparability of CbCR data across jurisdictions.
l Several jurisdictions, including large ones, have not submitted aggregated CbCR statistics to the OECD for publication.
l There are a number of data deficiencies described in the disclaimer accompanying the data which is available at
www.oecd.org/tax/tax-policy/anonymised-and-aggregated-cbcr-statistics-disclaimer.pdf. In the absence of specific guidance, MNEs may have included intra-company dividends in profit figures, meaning that profit figures could be subject to double counting. While the inclusion of dividends in the profit figure is normal in separate financial accounting, in the context of corporate income tax analysis it can lead to biased results. For example, the tax treatment of repatriated dividends can differ across jurisdictions. As a distribution of post-tax profits, dividends are often lightly taxed or tax-exempt.8 To evaluate the potential magnitude of included dividends, some jurisdictions have carried out their own independent analysis.9
l In the case of stateless entities, the inclusion of transparent entities such as partnerships may give rise to double-counting of revenue and profit. In addition, it could give the impression that stateless profit is untaxed, since this income is generally taxed at the owner level.
Box 13. LIMITATIONS OF THE CBCR DATA AND ACTIONS TO IMPROVE THE QUALITY OF THE DATA
7. Reporting MNEs may choose to use data from consolidation reporting packages, from separate entity statutory financial statements, regulatory financial statements, or internal management accounts. In some jurisdictions, taxpayers are permitted to use financial statements or records maintained for tax reporting purposes.
8. In the European Union, the Council directive 2011/96/EU limits the ability of EU Member States to tax received dividends in order to exempt dividends and other profit distributions paid by subsidiary companies to their parent companies from withholding taxes and to eliminate double taxation of such income at the level of the parent company.
9. Country specific analysis undertaken by the Netherlands, Ireland, Italy and Sweden are available at: Netherlands: https://oe.cd/35S; Ireland: https://oe.cd/35U; Italy: https://oe.cd/35T; Sweden: https://oe.cd/35V.
38 . OECD | CORPORATE TAX STATISTICS
l CIT exempt companies such as pension funds or university hospitals are required to file CbCRs and as such are included in aggregated statistics, unless otherwise specified. The inclusion of these companies could distort the relation between profits and taxes.
Some of the data limitations have already been addressed through revised guidance. For example, with respect to the double-counting of dividends, the guidance on CbCR implementation was updated in November 2019 to specify that intra-company dividends should be excluded from profit figures. However, because of the time lag in the revising of instructions with jurisdictions and in reporting, it is expected to take several years before these actions lead to improvements in data quality. Other issues, e.g. the treatment of stateless entities, are the subject of ongoing discussion, including through the review of Country-by-Country Reporting (BEPS Action 13)10 that could lead to the collection of more detailed information through CbCR reports in the future. The OECD continues to work with members of the Inclusive Framework and other stakeholders to improve the quality and consistency of the data across jurisdictions. In light of these potential improvements, it is expected that the value and importance of the dataset, in providing researchers and the public with a valuable tool for better understanding the global activities of MNEs and BEPS, will only increase over time.
In addition to the limitations mentioned above, caution needs to be exercised when attempting to draw conclusions from the data for several reasons:
l Changes and potential trends in BEPS behaviour cannot be detected with a single year of data.
l In the short term, comparability between the 2016 and 2017 samples will be limited, e.g. because of a move from voluntary to mandatory filing and differences in fiscal year coverage.11 In the longer term, changes to guidance will lead to changing treatment of some variables such as profits, limiting the comparison of these variables over time.
l Even with additional years of data, a number of other events that affect the data may make it difficult to identify the effect of BEPS-related policies (e.g. COVID-19, and the United States’ 2017 Tax Cuts and Jobs Act).
l Implementing BEPS measures takes time and the effects of these measures may not become evident until a few years after implementation.
Box 13 – continued
10. The BEPS Action 13 report (http://www.oecd.org/tax/transfer-pricing-documentation-and-country-by-country-reporting-action-13-2015-final-report-9789264241480-en.htm) included a requirement that a review of the CbCR minimum standard be completed by the end of 2020 (the 2020 review). A public consultation meeting on the 2020 review of Country-by-Country Reporting (BEPS Action 13) was held virtually on 12-13 May 2020, where external stakeholders had the opportunity to provide input on the ongoing work.
11. In 2016, it was decided to cover CbCRs with fiscal years ending between 31 December 2016 and 30 June 2017. For future releases of this dataset it is anticipated that CbCRs for the period 1 January to 31 December will be covered for most jurisdictions (e.g., 2017 data will cover CbCRs with fiscal years ending between 1 January 2017 and 31 December 2017).

ANONYMISED AND AGGREGATED COUNTRY-BY-COUNTRY REPORT (CBCR) STATISTICS . 39
Note: The white dot represents the average value (obtained by dividing totals by the number of CbCRs), the blue box is delimited by the 25th and 75th percentiles while the black bar in the middle is the median (50th percentile). The error bars are delimited by the 5th and 95th percentiles. Jurisdictions are ranked with respect to the 95th percentile. Country coverage reflects data availability in Table V, and excludes one jurisdiction that provided incomplete data.
Source: 2016 Anonymised and Aggregated CbCR statistics
JPN SWE SGPAUTAUSBELITAMEXCHLNORDNKZAFLUX
GENERAL OBSERVATIONS FROM THE CBCR DATA
The following descriptive statistics provide insight into some key features of the 2016 CbCR data:
l Anonymised and aggregated CbCR data provide an overview of where large MNE groups are headquartered. Table 1 shows that, across the jurisdictions that submitted data, the United States and Japan host almost half of the headquarters of MNEs included in the sample. The number of reported MNEs varies considerably among jurisdictions, ranging from a minimum of seven to 1,101 in the United States. The median number of reported MNEs is 74.
l The size of MNE groups varies across the sample and includes a small number of relatively large MNE groups. Figure 15 shows the distribution points of unrelated party revenues of MNE groups headquartered in each reporting jurisdiction. A common feature across all jurisdictions is that the mean MNE group size in terms of unrelated party revenues is considerably larger than the median size, indicating that the underlying sample includes a small number of relatively large MNE groups.
0
10
20
30
40
50
FRA CAN KOR JPN SWE SGP AUT AUS BEL ITA MEX CHL NOR DNK ZAF LUX
Unr
elat
ed p
arty
reve
nues
(USD
bill
ions
)
FIGURE 15: Distribution of MNE groups unrelated party revenues by ultimate parent jurisdiction

40 . OECD | CORPORATE TAX STATISTICS
Note: The percentages above are calculated by dividing the amount of total tax accrued reported in CbCR statistics by total CIT revenues as reported in the 2016 OECD Global Revenue Statistics data. The figure shows total revenues of both domestic and foreign MNEs as a percentage of total CIT revenues, with jurisdictions ranked according to the total contribution of MNEs to CIT revenues. As there might be some timing differences in recording tax payments between tax accrued reported in CbCR data and CIT revenues reported Global Revenue Statistics, percentages should be considered as indicative. Revenues from foreign MNEs are calculated as the sum of tax accrued reported in the jurisdiction by MNEs headquartered in other jurisdictions. Foreign MNEs’ tax revenues should be considered as a lower bound as they can be reported exclusively where the geographical disaggregation is available at the jurisdiction level. Data for Bermuda, China and India are missing because these jurisdictions are not covered in the 2016 OECD Global Revenue Statistics data.
Source: 2016 Anonymised and Aggregated CbCR statistics and 2016 OECD Global Revenue Statistics.
-10% 0% 10% 20% 30% 40% 50% 60% 70%
Percentage of total CIT revenues
SVN
POL
AUT
ZAF
CAN
FIN
ITA
BEL
SWE
AUS
NLD
MEX
DNK
CHL
FRA
IDN
KOR
JPN
SGP
LUX
NOR
USA
IRL
Local a�liates owned by domestic MNEsLocal a�liates owned by foreign MNEs9%
17%
20%
20%
23%
25%
26%
27%
29%
29%
31%
34%
34%
34%
42%
42%
43%
47%
53%
54%
55%
56%
65%
l Foreign and domestic MNEs account for significant shares of corporate income tax (CIT) revenues in several jurisdictions. Figure 16 reports total tax accrued based on CbCR statistics, as a fraction of the total national CIT revenues, taken from the OECD’s
Global Revenue Statistics Database. The figure allows an examination of the relative importance of foreign and domestic MNE contributions as covered in the 2016 data.12 The share of CIT revenue from foreign MNEs ranged from 3% to 65%.
12. Foreign MNEs’ contributions might be understated for two main reasons: some jurisdictions provided limited geographical disaggregation and the contributions of MNEs with parents headquartered in jurisdictions that did not provide data are missing.
FIGURE 16: MNEs’ contribution to total CIT Revenues

ANONYMISED AND AGGREGATED COUNTRY-BY-COUNTRY REPORT (CBCR) STATISTICS . 41
KEY INSIGHTS FROM CBCR DATA
The first release of anonymised and aggregated CbCR data (2016) provides some fresh insights on BEPS.
Due to the limitations of the CbCR data (Box 13), considerable caution needs to be exercised when attempting to draw conclusions about BEPS from the data. This is especially the case given that this is the first year for which anonymised and aggregated CbCR data have been provided, and that changes and potential trends in BEPS behaviour cannot be detected with a single year of data.
Taking these caveats into account, the first release of CbCR statistics suggests some preliminary insights on BEPS:
l The data are indicative of a misalignment between the location where profits are reported and the location where economic activities occur. The data show significant differences in the distribution across
jurisdiction groups of employees, tangible assets, and profits.13 Figure 17 presents the distribution of MNEs’ foreign activities across jurisdiction groups.14 For example, high and middle income jurisdictions account for a higher share of employees (respectively 32% and 37% of total employees) and tangible assets (respectively 35% and 23% of total tangible assets) than of profits (respectively 28% and 19%).
On the other hand, in investment hubs, on average MNEs report a relatively high share of profits (25%) compared to their share of employees (4%) and tangible assets (11%). High income jurisdictions, middle income jurisdictions and investment hubs account for 37%, 31% and 10% of tax accrued, respectively.15
13. As indicated in Box 13, and described in greater detail at https://www.oecd.org/tax/tax-policy/anonymised-and-aggregated-cbcr-statistics-disclaimer.pdf, profits may be overestimated due to the inclusion of intra-company dividends, this may have a greater impact in jurisdictions with a large share of holding companies. To evaluate the potential magnitude of included dividends country specific analysis provided by the Netherlands, Ireland, Italy and Sweden are available at:
Netherlands: https://oe.cd/35S; Ireland: https://oe.cd/35U; Italy: https://oe.cd/35T; Sweden: https://oe.cd/35V .
14. Jurisdictions are classified in four jurisdiction groups: (i) high income; (ii) middle income; (iii) low income; and (iv) investment hubs. The first three groups are based on the World Bank classification resulting in 61 high income jurisdictions, 104 middle income jurisdictions and 29 low income jurisdictions. Investment hubs are defined as jurisdictions with a total inward Foreign Direct Investment (FDI) position above 150% of GDP and include Bahamas; Barbados; Bermuda; British Virgin Islands; Cayman Islands; Cyprus*; Gibraltar; Guernsey; Hong Kong, China; Hungary; Ireland; Isle of Man; Jersey; Liberia; Luxembourg; Malta; Marshall Islands; Mauritius; Mozambique; Netherlands; Singapore and Switzerland. Investment hubs are diverse and consist of zero-tax jurisdictions alongside jurisdictions with positive tax rates. Indeed, each of the four jurisdiction groups includes a diverse range of jurisdictions and group averages can mask substantial variation within each jurisdiction group.
15. Tax accrued depends on both effective tax rates and taxable profits in a jurisdiction.
FIGURE 17: Jurisdiction groups’ shares of foreign MNEs’ activities
Note: The profit variable could include intracompany dividends in several instances, and therefore be upward biased. The bars represent jurisdiction groups’ shares of different variables (e.g. profit in group x/total profits booked in foreign jurisdictions*100) across all jurisdictions included in the CbCR sample. The percentages are calculated using Table I (all sub-groups). “Other” reflects aggregate geographic groupings.
Source: 2016 Anonymised and Aggregated CbCR statistics
0%
10%
20%
30%
40%
High income Middle income Low income Investment hubs Stateless Other
NA
Perc
enta
ge o
f for
eign
act
iviti
es
Tax accrued Pro�t Related party rev. Total revenuesUnrelated party rev. Tangible assets No. of employees
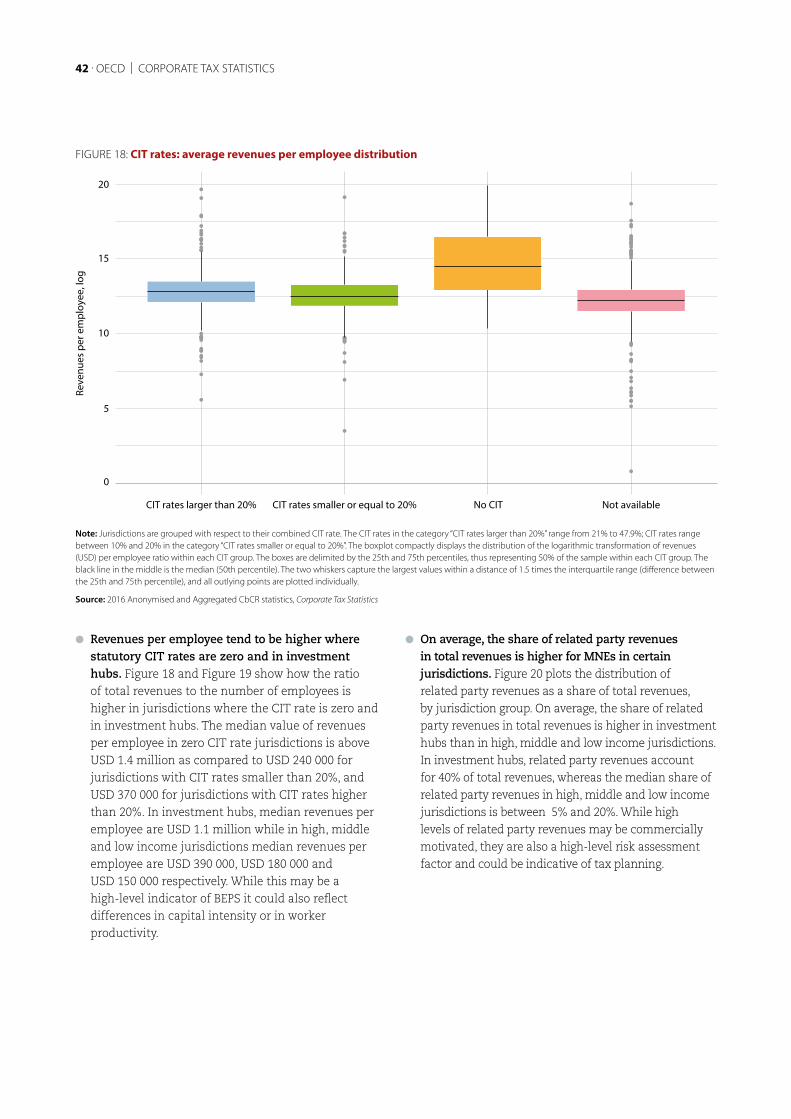
42 . OECD | CORPORATE TAX STATISTICS
l Revenues per employee tend to be higher where statutory CIT rates are zero and in investment hubs. Figure 18 and Figure 19 show how the ratio of total revenues to the number of employees is higher in jurisdictions where the CIT rate is zero and in investment hubs. The median value of revenues per employee in zero CIT rate jurisdictions is above USD 1.4 million as compared to USD 240 000 for jurisdictions with CIT rates smaller than 20%, and USD 370 000 for jurisdictions with CIT rates higher than 20%. In investment hubs, median revenues per employee are USD 1.1 million while in high, middle and low income jurisdictions median revenues per employee are USD 390 000, USD 180 000 and
USD 150 000 respectively. While this may be a high-level indicator of BEPS it could also reflect
differences in capital intensity or in worker productivity.
l On average, the share of related party revenues in total revenues is higher for MNEs in certain jurisdictions. Figure 20 plots the distribution of related party revenues as a share of total revenues, by jurisdiction group. On average, the share of related party revenues in total revenues is higher in investment hubs than in high, middle and low income jurisdictions. In investment hubs, related party revenues account for 40% of total revenues, whereas the median share of related party revenues in high, middle and low income jurisdictions is between 5% and 20%. While high levels of related party revenues may be commercially motivated, they are also a high-level risk assessment factor and could be indicative of tax planning.
FIGURE 18: CIT rates: average revenues per employee distribution
Note: Jurisdictions are grouped with respect to their combined CIT rate. The CIT rates in the category “CIT rates larger than 20%” range from 21% to 47.9%; CIT rates range between 10% and 20% in the category “CIT rates smaller or equal to 20%”. The boxplot compactly displays the distribution of the logarithmic transformation of revenues (USD) per employee ratio within each CIT group. The boxes are delimited by the 25th and 75th percentiles, thus representing 50% of the sample within each CIT group. The black line in the middle is the median (50th percentile). The two whiskers capture the largest values within a distance of 1.5 times the interquartile range (difference between the 25th and 75th percentile), and all outlying points are plotted individually.
Source: 2016 Anonymised and Aggregated CbCR statistics, Corporate Tax Statistics
0
5
10
15
20
CIT rates larger than 20% CIT rates smaller or equal to 20% No CIT Not available
Reve
nues
per
em
ploy
ee, l
og

ANONYMISED AND AGGREGATED COUNTRY-BY-COUNTRY REPORT (CBCR) STATISTICS . 43
FIGURE 19: Average revenues per employee: distribution across jurisdiction groups
FIGURE 20: Distribution of related party revenues shares across jurisdiction groups
Note: The boxplot summarises the distribution of related party revenues as a share of total revenues within each jurisdiction group. The boxes are delimited by the 25th and 75th percentiles, thus representing 50% of the sample within each jurisdiction group. The black line in the middle is the median (50th percentile). The two whiskers capture the largest values within a distance of 1.5 times the interquartile range (difference between the 25th and 75th percentile), and all outlying points are plotted individually.
Source: 2016 Anonymised and Aggregated CbCR statistics
0%
40%
80%
High incomeMiddle incomeLow incomeInvestment HubsStateless NA
Rela
ted
part
y re
venu
es s
hare
High income Middle income Low income Investment hubs Stateless Other
0
5
10
15
20
High income Middle income Low income Investment hubs Stateless Other
Reve
nues
per
em
ploy
ee, l
og
Note: The boxplot compactly displays the distribution of the logarithmic transformation of revenues per employee ratio within each jurisdiction group. The boxes are delimited by the 25th and 75th percentiles, thus representing 50% of the sample within each jurisdiction group. The black line in the middle is the median (50th percentile). The two whiskers capture the largest values within a distance of 1.5 times the interquartile range (difference between the 25th and 75th percentile), and all outlying points are plotted individually.
Source: 2016 Anonymised and Aggregated CbCR statistics
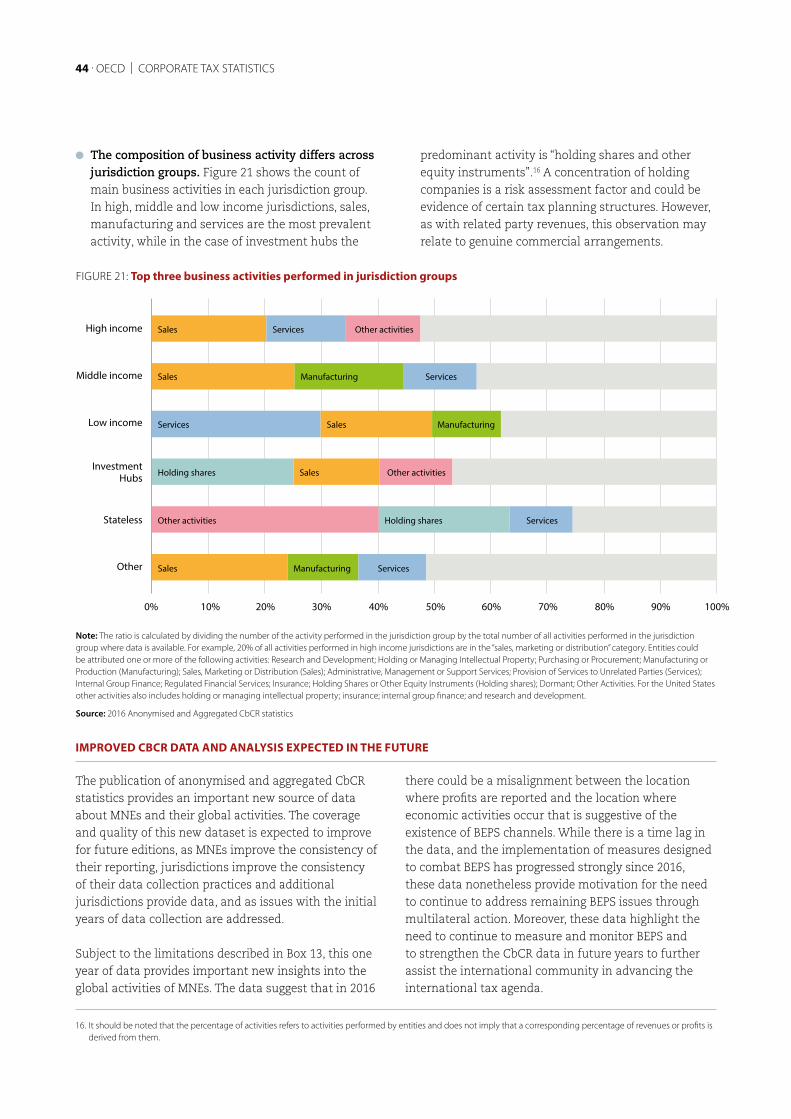
44 . OECD | CORPORATE TAX STATISTICS
l The composition of business activity differs across jurisdiction groups. Figure 21 shows the count of main business activities in each jurisdiction group. In high, middle and low income jurisdictions, sales, manufacturing and services are the most prevalent activity, while in the case of investment hubs the
predominant activity is “holding shares and other equity instruments”.16 A concentration of holding companies is a risk assessment factor and could be evidence of certain tax planning structures. However, as with related party revenues, this observation may relate to genuine commercial arrangements.
Note: The ratio is calculated by dividing the number of the activity performed in the jurisdiction group by the total number of all activities performed in the jurisdiction group where data is available. For example, 20% of all activities performed in high income jurisdictions are in the “sales, marketing or distribution” category. Entities could be attributed one or more of the following activities: Research and Development; Holding or Managing Intellectual Property; Purchasing or Procurement; Manufacturing or Production (Manufacturing); Sales, Marketing or Distribution (Sales); Administrative, Management or Support Services; Provision of Services to Unrelated Parties (Services); Internal Group Finance; Regulated Financial Services; Insurance; Holding Shares or Other Equity Instruments (Holding shares); Dormant; Other Activities. For the United States other activities also includes holding or managing intellectual property; insurance; internal group finance; and research and development.
Source: 2016 Anonymised and Aggregated CbCR statistics
0% 10% 20% 30% 40% 50% 60% 70% 80% 90% 100%
Sales Manufacturing ServicesOther
Other activities Holding shares ServicesStateless
Holding shares Sales Other activitiesInvestment
Hubs
Services Sales ManufacturingLow income
Sales Manufacturing ServicesMiddle income
Sales Services Other activitiesHigh income
16. It should be noted that the percentage of activities refers to activities performed by entities and does not imply that a corresponding percentage of revenues or profits is derived from them.
IMPROVED CBCR DATA AND ANALYSIS EXPECTED IN THE FUTURE
The publication of anonymised and aggregated CbCR statistics provides an important new source of data about MNEs and their global activities. The coverage and quality of this new dataset is expected to improve for future editions, as MNEs improve the consistency of their reporting, jurisdictions improve the consistency of their data collection practices and additional jurisdictions provide data, and as issues with the initial years of data collection are addressed.
Subject to the limitations described in Box 13, this one year of data provides important new insights into the global activities of MNEs. The data suggest that in 2016
there could be a misalignment between the location where profits are reported and the location where economic activities occur that is suggestive of the existence of BEPS channels. While there is a time lag in the data, and the implementation of measures designed to combat BEPS has progressed strongly since 2016, these data nonetheless provide motivation for the need to continue to address remaining BEPS issues through multilateral action. Moreover, these data highlight the need to continue to measure and monitor BEPS and to strengthen the CbCR data in future years to further assist the international community in advancing the international tax agenda.
FIGURE 21: Top three business activities performed in jurisdiction groups

IP regimes may be used by governments to support R&D activities in their jurisdiction. In the past, IP regimes may have been designed in a manner that incentivised firms to locate IP assets in a jurisdiction regardless of where the underlying R&D was undertaken. However,
Intellectual property regimesThe Corporate Tax Statistics database also includes information on intellectual property (IP) regimes. Many jurisdictions have implemented IP regimes, which allow income from the exploitation of certain IP assets to be taxed at a lower rate than the standard statutory CIT rate.
the nexus approach of the BEPS Action 5 minimum standard now requires that tax benefits for IP income are made conditional on the extent to which a taxpayer has undertaken the R&D activities that produced the IP asset in the jurisdicition providing the tax benefits.
INTELLECTUAL PROPERTY REGIMES . 45
KEY INSIGHTS:
l 37 regimes were found to be not harmful (of which two are harmful only in respect of a transition issue for a certain period) and one was found to be harmful. Three regimes were in the process of being amended or eliminated since they were not compliant with the BEPS Action 5 minimum standard. A further 10 regimes were under review even though it had not yet been determined whether they were in compliance with the Action 5 minimum standard.
l Of the 37 non-harmful IP regimes, all 37 offer benefits to patents, 27 offer benefits to copyrighted software and 11
offer benefits to the third allowed category of assets that are restricted to SMEs.
l Tax rate reductions for the 37 non-harmful IP regimes range from a full exemption from tax to a reduction of about 40% of the standard tax rate.
l Two of the three regimes that are in the process of being amended or eliminated offer a full exemption from taxation for IP income while the third offers a reduction from 28% to 10% for IP income.

WHAT QUALIFIES AS AN INTELLECTUAL PROPERTY REGIME?
IP regimes can be regimes that exclusively provide benefits to income from IP, but some regimes categorised as IP regimes are “dual category” regimes. These regimes also provide benefits to income from other geographically mobile activities or to a wide range of activities and do not necessarily exclude income from IP.
The Corporate Tax Statistics database shows information both on regimes that narrowly target IP income and on regimes that offer reduced rates to IP income and other types of income. Of the 51 IP regimes contained in the database, 32 were reviewed by the FHTP as IP regimes only and 19 were reviewed as “dual category” regimes (IP and non-IP regimes).
STATUS OF INTELLECTUAL PROPERTY REGIMES
On the basis of the features of the regime, IP regimes are found to be either: harmful (because they do not meet the nexus approach), not harmful (when the regime
46 . OECD | CORPORATE TAX STATISTICS
Box 12. INTELLECTUAL PROPERTY REGIMES
The information reported for each IP regime in the Corporate Tax Statistics database is:
l the name of the regime;
l the qualifying IP assets;
l the reduced rate that applies under the IP regime;
l the status of the IP regime per the OECD’s Forum on Harmful Tax Practices (FHTP).
The Corporate Tax Statistics database draws on the detailed information collected by the FHTP for its peer reviews of preferential tax regimes. The information and the status presented are as of November 2019. Changes to regimes that have been legislated in 2019 but are not effective until 2020 are not reflected in this edition of the database.
The information presented in this edition provides a basic description of IP regimes in place in 2019. Future editions will incorporate the effects of IP regimes into the corporate effective tax rate analysis.
Reduced rates available under non-harmful IP regimes ranged from 0% to 18.75% in 2019. The magnitude of the reductions ranges from around 40% to a full exemption from tax.
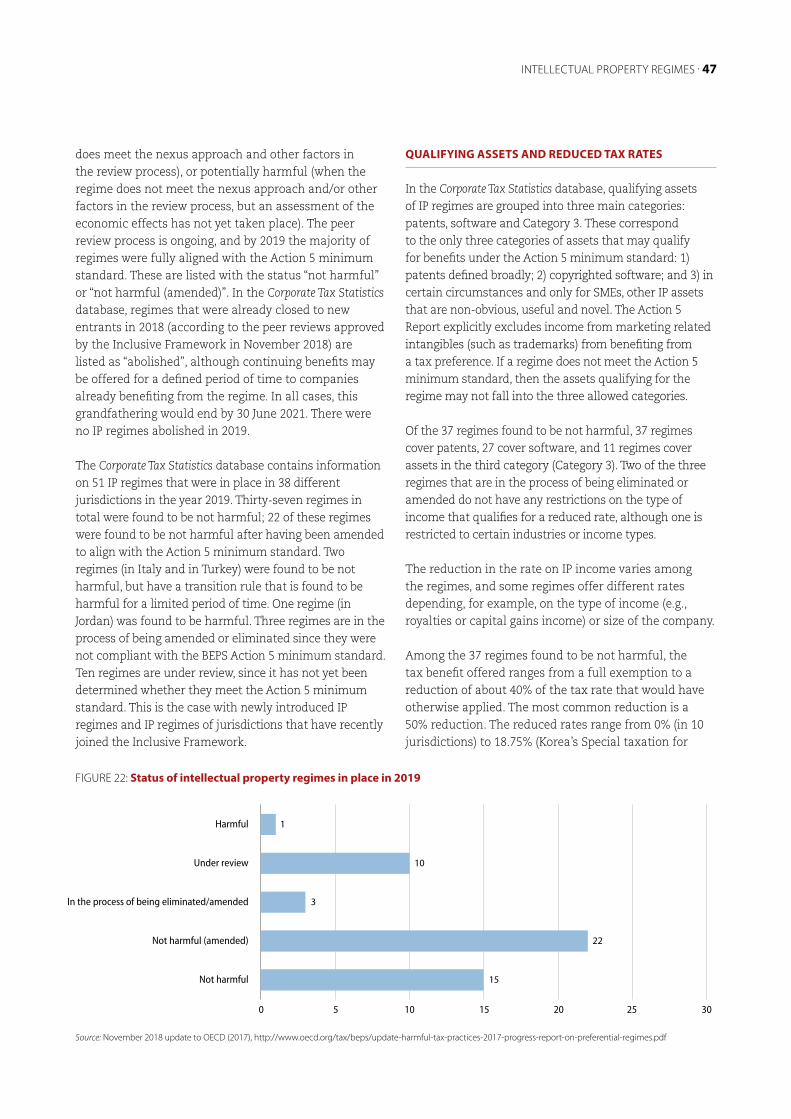
does meet the nexus approach and other factors in the review process), or potentially harmful (when the regime does not meet the nexus approach and/or other factors in the review process, but an assessment of the economic effects has not yet taken place). The peer review process is ongoing, and by 2019 the majority of regimes were fully aligned with the Action 5 minimum standard. These are listed with the status “not harmful” or “not harmful (amended)”. In the Corporate Tax Statistics database, regimes that were already closed to new entrants in 2018 (according to the peer reviews approved by the Inclusive Framework in November 2018) are listed as “abolished”, although continuing benefits may be offered for a defined period of time to companies already benefiting from the regime. In all cases, this grandfathering would end by 30 June 2021. There were no IP regimes abolished in 2019.
The Corporate Tax Statistics database contains information on 51 IP regimes that were in place in 38 different jurisdictions in the year 2019. Thirty-seven regimes in total were found to be not harmful; 22 of these regimes were found to be not harmful after having been amended to align with the Action 5 minimum standard. Two regimes (in Italy and in Turkey) were found to be not harmful, but have a transition rule that is found to be harmful for a limited period of time. One regime (in Jordan) was found to be harmful. Three regimes are in the process of being amended or eliminated since they were not compliant with the BEPS Action 5 minimum standard. Ten regimes are under review, since it has not yet been determined whether they meet the Action 5 minimum standard. This is the case with newly introduced IP regimes and IP regimes of jurisdictions that have recently joined the Inclusive Framework.
QUALIFYING ASSETS AND REDUCED TAX RATES
In the Corporate Tax Statistics database, qualifying assets of IP regimes are grouped into three main categories: patents, software and Category 3. These correspond to the only three categories of assets that may qualify for benefits under the Action 5 minimum standard: 1) patents defined broadly; 2) copyrighted software; and 3) in certain circumstances and only for SMEs, other IP assets that are non-obvious, useful and novel. The Action 5 Report explicitly excludes income from marketing related intangibles (such as trademarks) from benefiting from a tax preference. If a regime does not meet the Action 5 minimum standard, then the assets qualifying for the regime may not fall into the three allowed categories.
Of the 37 regimes found to be not harmful, 37 regimes cover patents, 27 cover software, and 11 regimes cover assets in the third category (Category 3). Two of the three regimes that are in the process of being eliminated or amended do not have any restrictions on the type of income that qualifies for a reduced rate, although one is restricted to certain industries or income types.
The reduction in the rate on IP income varies among the regimes, and some regimes offer different rates depending, for example, on the type of income (e.g., royalties or capital gains income) or size of the company.
Among the 37 regimes found to be not harmful, the tax benefit offered ranges from a full exemption to a reduction of about 40% of the tax rate that would have otherwise applied. The most common reduction is a 50% reduction. The reduced rates range from 0% (in 10 jurisdictions) to 18.75% (Korea’s Special taxation for
INTELLECTUAL PROPERTY REGIMES . 47
0 5 10 15 20 25 30
15Not harmful
22Not harmful (amended)
3In the process of being eliminated/amended
10Under review
1Harmful
Source: November 2018 update to OECD (2017), http://www.oecd.org/tax/beps/update-harmful-tax-practices-2017-progress-report-on-preferential-regimes.pdf
FIGURE 22: Status of intellectual property regimes in place in 2019
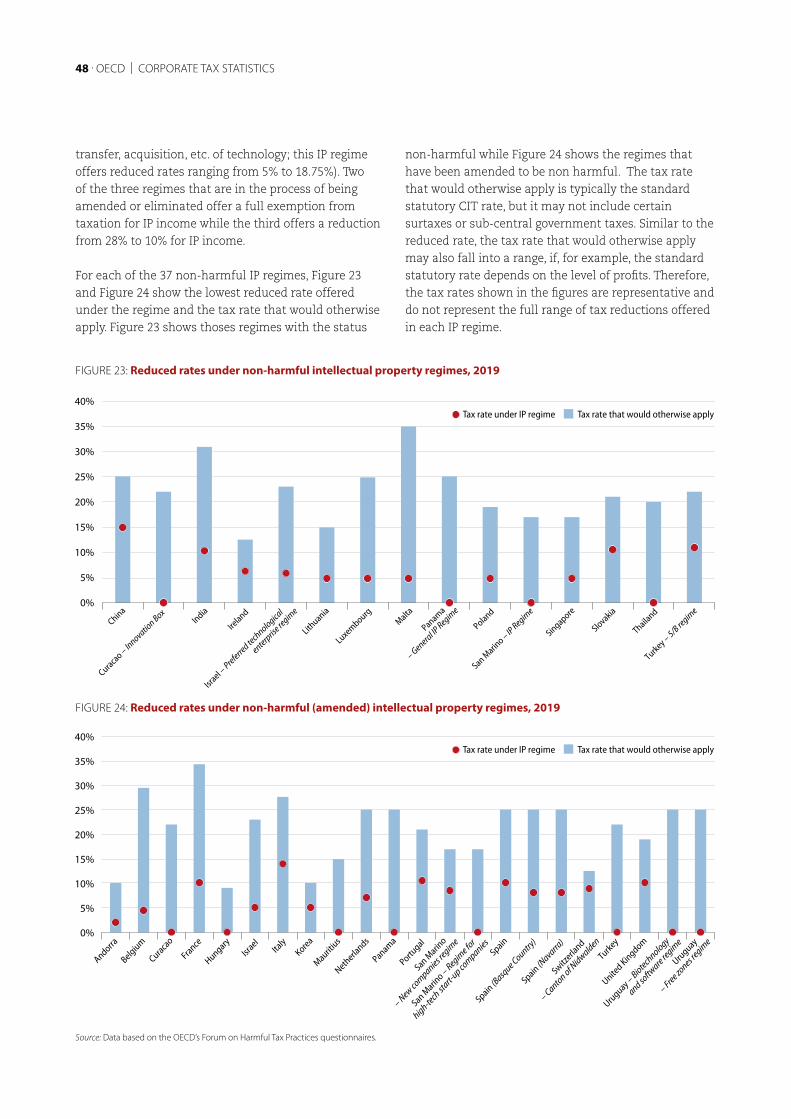
48 . OECD | CORPORATE TAX STATISTICS
transfer, acquisition, etc. of technology; this IP regime offers reduced rates ranging from 5% to 18.75%). Two of the three regimes that are in the process of being amended or eliminated offer a full exemption from taxation for IP income while the third offers a reduction from 28% to 10% for IP income.
For each of the 37 non-harmful IP regimes, Figure 23 and Figure 24 show the lowest reduced rate offered under the regime and the tax rate that would otherwise apply. Figure 23 shows thoses regimes with the status
non-harmful while Figure 24 shows the regimes that have been amended to be non harmful. The tax rate that would otherwise apply is typically the standard statutory CIT rate, but it may not include certain surtaxes or sub-central government taxes. Similar to the reduced rate, the tax rate that would otherwise apply may also fall into a range, if, for example, the standard statutory rate depends on the level of profits. Therefore, the tax rates shown in the figures are representative and do not represent the full range of tax reductions offered in each IP regime.
Source: Data based on the OECD’s Forum on Harmful Tax Practices questionnaires.
FIGURE 23: Reduced rates under non-harmful intellectual property regimes, 2019
0%
5%
10%
15%
20%
25%
30%
35%
40%
0%
5%
10%
15%
20%
25%
30%
35%
40%
Andorra
Belgium
Curacao
France
HungaryIsr
aelIta
lyKorea
Mauritius
Netherla
nds
Panama
Portugal
San Marin
o
– New companies r
egime
San Marin
o – Regime fo
r
high-tech sta
rt-up companies
Spain
Spain (Basq
ue Country)
Spain (Navarra
)
Switzerla
nd
– Canton of Nidwalden
Turkey
United Kingdom
Uruguay – Biotechnology
and softw
are regim
e
Uruguay
– Free zones regim
e
Tax rate that would otherwise apply Tax rate under IP regime
Tax rate that would otherwise apply Tax rate under IP regime
China
Curacao – In
novation Box
India
Ireland
Israel –
Preferred te
chnological
enterprise re
gime
Lithuania
LuxembourgMalta
Panama
– General IP Regim
e
Poland
San Marin
o – IP Regim
e
Singapore
Slovakia
Thailand
Turkey – 5/B re
gime
FIGURE 24: Reduced rates under non-harmful (amended) intellectual property regimes, 2019

CONTROLLED FOREIGN COMPANY RULES . 49
The OECD gathers information on progress related to the implementation of Action 3, namely:
l whether a jurisdiction has CFC rules in place;
l the definition of CFC income,
l whether CFC rules include a substantial economic activity test and, if so, the nature of the test, and, finally, whether any exceptions apply.
This information is presented in the Corporate Tax Statistics database for the first time in this edition, and the information pertains to the rules in place in 2019.
Information on the presence of CFC rules is available for 122 Inclusive Framework member jurisdictions. Of these, 49 jurisdictions indicated that CFC rules were in place in 2019 (Figure 25). In general, a CFC is defined as a foreign
company that is either directly or indirectly controlled by a resident taxpayer. Jurisdictions apply a variety of criteria to determine control. Some approaches make reference to voting rights held by resident taxpayers or to shareholder value held by resident taxpayers, while others stipulate that a foreign company is a CFC if it carries out its operations in a low-tax jurisdiction and others base CFC designation on a taxation test (i.e., if the foreign company does not pay tax in its jurisdiction of residence). Jurisdictions also vary in their definitions of CFC income, with some applying CFC rules to any type of income while others apply them to only passive income (i.e., income from interest, rental property, dividends, royalties or capital gains). Finally, jurisdictions also vary in the presence of substantial activity tests. Of the 49 jurisdictions that had CFC rules in 2019, 11 had no substantial activity tests in place.
FIGURE 25: Controlled Foreign Company rules across the Inclusive Framework
Controlled Foreign Company (CFC) RulesThe 2015 BEPS Action 3 report set out recommended approaches to the development of controlled foreign company (CFC) rules to ensure the taxation of certain categories of MNE income in the jurisdiction of the parent company in order to counter certain offshore structures that result in no or indefinite deferral of taxation. Comprehensive and effective CFC rules have the effect of reducing the incentive to shift profits from a market jurisdiction into a low-tax jurisdiction.
122 Inclusive Framework members surveyed
49 have CFC rules in operation
11 have no substantial activity tests in place
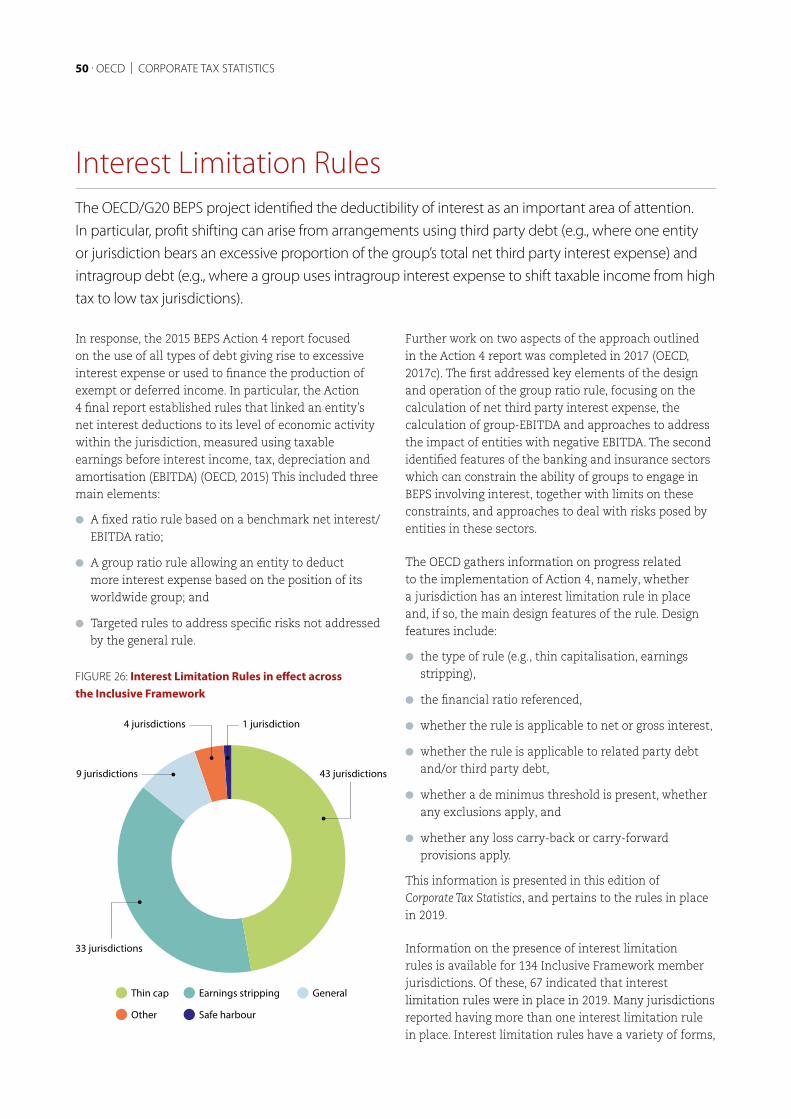
43 jurisdictions9 jurisdictions
33 jurisdictions
4 jurisdictions 1 jurisdiction
Thin cap Earnings stripping
Other Safe harbour
General
In response, the 2015 BEPS Action 4 report focused on the use of all types of debt giving rise to excessive interest expense or used to finance the production of exempt or deferred income. In particular, the Action 4 final report established rules that linked an entity’s net interest deductions to its level of economic activity within the jurisdiction, measured using taxable earnings before interest income, tax, depreciation and amortisation (EBITDA) (OECD, 2015) This included three main elements:
l A fixed ratio rule based on a benchmark net interest/EBITDA ratio;
l A group ratio rule allowing an entity to deduct more interest expense based on the position of its worldwide group; and
l Targeted rules to address specific risks not addressed by the general rule.
Further work on two aspects of the approach outlined in the Action 4 report was completed in 2017 (OECD, 2017c). The first addressed key elements of the design and operation of the group ratio rule, focusing on the calculation of net third party interest expense, the calculation of group-EBITDA and approaches to address the impact of entities with negative EBITDA. The second identified features of the banking and insurance sectors which can constrain the ability of groups to engage in BEPS involving interest, together with limits on these constraints, and approaches to deal with risks posed by entities in these sectors.
The OECD gathers information on progress related to the implementation of Action 4, namely, whether a jurisdiction has an interest limitation rule in place and, if so, the main design features of the rule. Design features include:
l the type of rule (e.g., thin capitalisation, earnings stripping),
l the financial ratio referenced,
l whether the rule is applicable to net or gross interest,
l whether the rule is applicable to related party debt and/or third party debt,
l whether a de minimus threshold is present, whether any exclusions apply, and
l whether any loss carry-back or carry-forward provisions apply.
This information is presented in this edition of Corporate Tax Statistics, and pertains to the rules in place in 2019.
Information on the presence of interest limitation rules is available for 134 Inclusive Framework member jurisdictions. Of these, 67 indicated that interest limitation rules were in place in 2019. Many jurisdictions reported having more than one interest limitation rule in place. Interest limitation rules have a variety of forms,
Interest Limitation RulesThe OECD/G20 BEPS project identified the deductibility of interest as an important area of attention. In particular, profit shifting can arise from arrangements using third party debt (e.g., where one entity or jurisdiction bears an excessive proportion of the group’s total net third party interest expense) and intragroup debt (e.g., where a group uses intragroup interest expense to shift taxable income from high tax to low tax jurisdictions).
FIGURE 26: Interest Limitation Rules in effect across the Inclusive Framework
50 . OECD | CORPORATE TAX STATISTICS
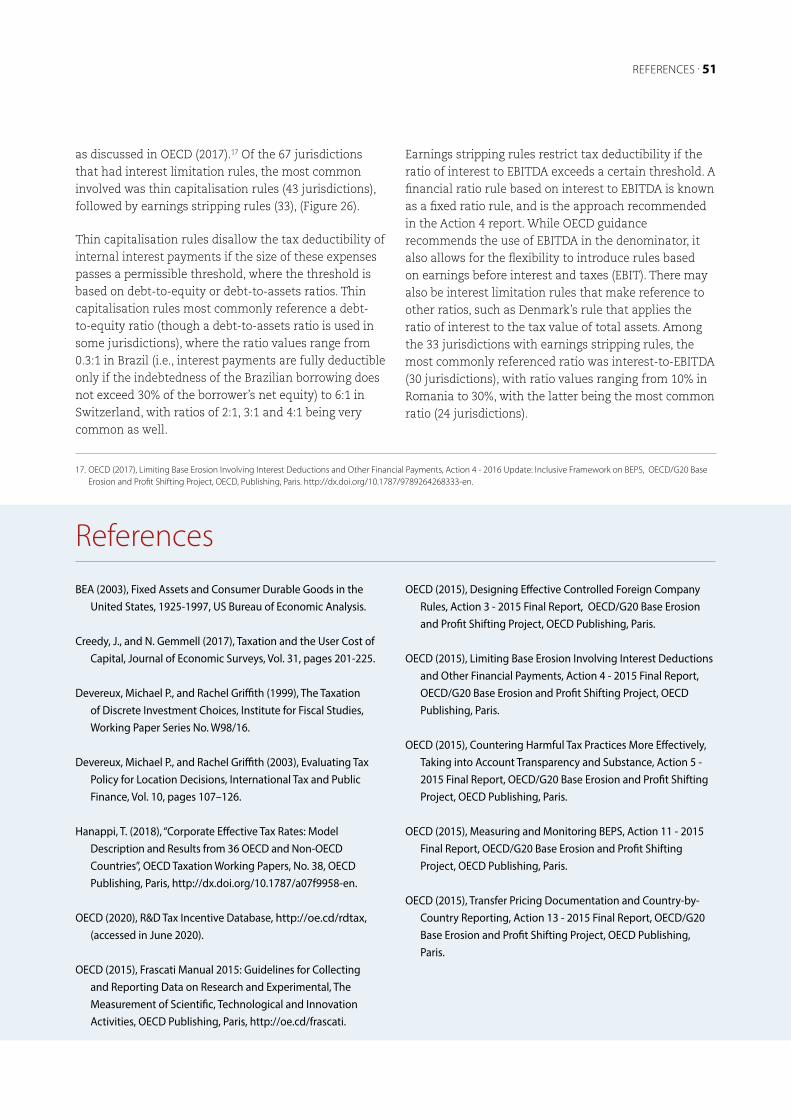
BEA (2003), Fixed Assets and Consumer Durable Goods in the United States, 1925-1997, US Bureau of Economic Analysis.
Creedy, J., and N. Gemmell (2017), Taxation and the User Cost of Capital, Journal of Economic Surveys, Vol. 31, pages 201-225.
Devereux, Michael P., and Rachel Griffith (1999), The Taxation of Discrete Investment Choices, Institute for Fiscal Studies, Working Paper Series No. W98/16.
Devereux, Michael P., and Rachel Griffith (2003), Evaluating Tax Policy for Location Decisions, International Tax and Public Finance, Vol. 10, pages 107–126.
Hanappi, T. (2018), “Corporate Effective Tax Rates: Model Description and Results from 36 OECD and Non-OECD Countries”, OECD Taxation Working Papers, No. 38, OECD Publishing, Paris, http://dx.doi.org/10.1787/a07f9958-en.
OECD (2020), R&D Tax Incentive Database, http://oe.cd/rdtax, (accessed in June 2020).
OECD (2015), Frascati Manual 2015: Guidelines for Collecting and Reporting Data on Research and Experimental, The Measurement of Scientific, Technological and Innovation Activities, OECD Publishing, Paris, http://oe.cd/frascati.
ReferencesOECD (2015), Designing Effective Controlled Foreign Company
Rules, Action 3 - 2015 Final Report, OECD/G20 Base Erosion and Profit Shifting Project, OECD Publishing, Paris.
OECD (2015), Limiting Base Erosion Involving Interest Deductions and Other Financial Payments, Action 4 - 2015 Final Report, OECD/G20 Base Erosion and Profit Shifting Project, OECD Publishing, Paris.
OECD (2015), Countering Harmful Tax Practices More Effectively, Taking into Account Transparency and Substance, Action 5 - 2015 Final Report, OECD/G20 Base Erosion and Profit Shifting Project, OECD Publishing, Paris.
OECD (2015), Measuring and Monitoring BEPS, Action 11 - 2015 Final Report, OECD/G20 Base Erosion and Profit Shifting Project, OECD Publishing, Paris.
OECD (2015), Transfer Pricing Documentation and Country-by-Country Reporting, Action 13 - 2015 Final Report, OECD/G20 Base Erosion and Profit Shifting Project, OECD Publishing, Paris.
as discussed in OECD (2017).17 Of the 67 jurisdictions that had interest limitation rules, the most common involved was thin capitalisation rules (43 jurisdictions), followed by earnings stripping rules (33), (Figure 26).
Thin capitalisation rules disallow the tax deductibility of internal interest payments if the size of these expenses passes a permissible threshold, where the threshold is based on debt-to-equity or debt-to-assets ratios. Thin capitalisation rules most commonly reference a debt-to-equity ratio (though a debt-to-assets ratio is used in some jurisdictions), where the ratio values range from 0.3:1 in Brazil (i.e., interest payments are fully deductible only if the indebtedness of the Brazilian borrowing does not exceed 30% of the borrower’s net equity) to 6:1 in Switzerland, with ratios of 2:1, 3:1 and 4:1 being very common as well.
Earnings stripping rules restrict tax deductibility if the ratio of interest to EBITDA exceeds a certain threshold. A financial ratio rule based on interest to EBITDA is known as a fixed ratio rule, and is the approach recommended in the Action 4 report. While OECD guidance recommends the use of EBITDA in the denominator, it also allows for the flexibility to introduce rules based on earnings before interest and taxes (EBIT). There may also be interest limitation rules that make reference to other ratios, such as Denmark’s rule that applies the ratio of interest to the tax value of total assets. Among the 33 jurisdictions with earnings stripping rules, the most commonly referenced ratio was interest-to-EBITDA (30 jurisdictions), with ratio values ranging from 10% in Romania to 30%, with the latter being the most common ratio (24 jurisdictions).
REFERENCES . 51
17. OECD (2017), Limiting Base Erosion Involving Interest Deductions and Other Financial Payments, Action 4 - 2016 Update: Inclusive Framework on BEPS, OECD/G20 Base Erosion and Profit Shifting Project, OECD, Publishing, Paris. http://dx.doi.org/10.1787/9789264268333-en.

For more information:
https://oe.cd/corporate-tax-stats
@OECDtax
The OECD freely authorises the use of this material for non-commercial purposes, provided that suitable acknowledgment of the source and copyright owner is given. All requests for commercial uses of this material or for translation rights should be submitted to [email protected].
© OECD 2020
Images © Shutterstock.com
Design by baselinearts.co.uk