corporate presentation - fintech group · corporate presentation fintech group ag ... pt eur 28.00...
TRANSCRIPT

CORPORATE PRESENTATIONFinTech Group AG | November 2017
Financial Services TechnologiesWe got IT

Employees Offices Number ofCustomers
Customer CashDeposits
Securities underCustody
Number of exchanges and OTC-partners
Approx. 450 8 € 929 m € 10.3 bn 64
1.1 FinTech Group – at a glance*
2THE FINTECH GROUP
ExecutedTrades
ExecutedTrade Volume
Credit Book(collateralized)
Average Interest Rate (Loan Book)
TIER-1 Capital
Return on Equity p.a.(before Tax)
5.5 m € 38 bn € 186 m 4.3% p.a. € 41 m 22%* As of 30.06.2017
>200k
B2C
>100
B2BBerlin
ZwickauWillich
Andernach
Frankfurt a.M. (HQ)
Kulmbach
Dusseldorf
Vienna
12
14
16
18
20
22
24
03.0
5.20
17
02.0
6.20
17
02.0
7.20
17
01.0
8.20
17
31.0
8.20
17
30.0
9.20
17
30.1
0.20
17
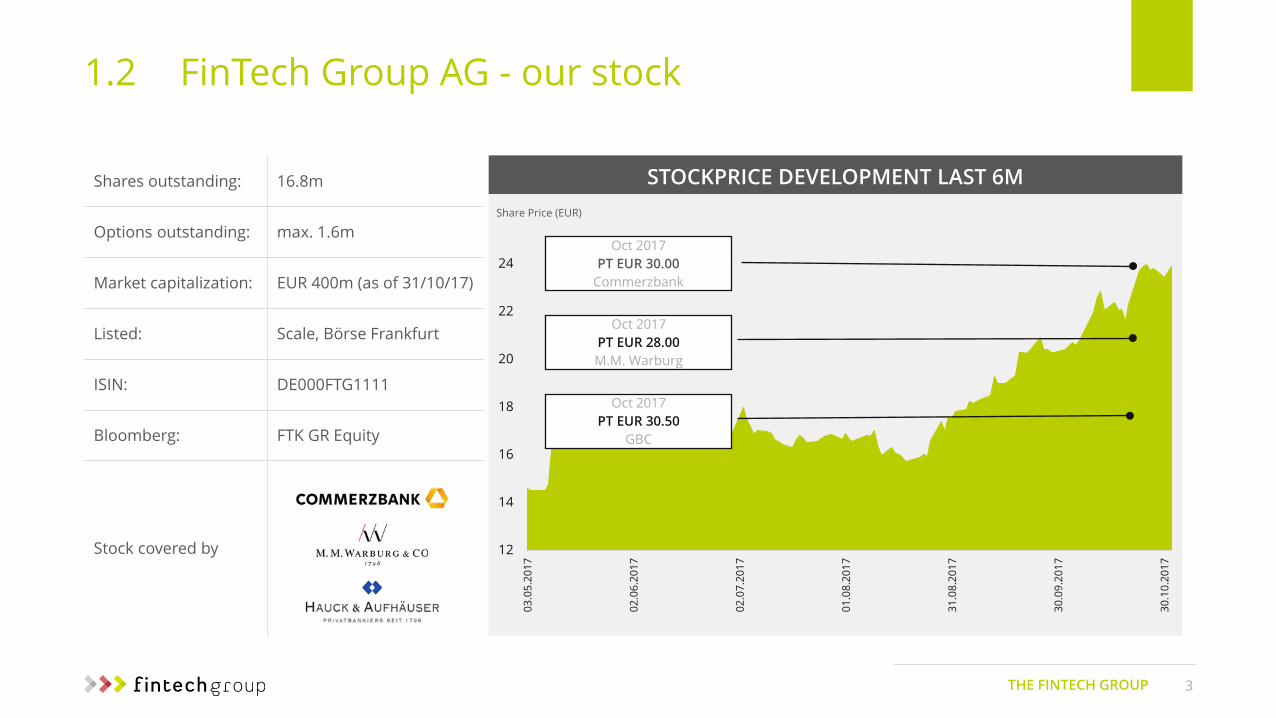
Oct 2017PT EUR 30.00
Commerzbank
Share Price (EUR)
Oct 2017PT EUR 28.00M.M. Warburg
Oct 2017PT EUR 30.50
GBC
STOCKPRICE DEVELOPMENT LAST 6M
1.2 FinTech Group AG - our stock
3THE FINTECH GROUP
Shares outstanding: 16.8m
Options outstanding: max. 1.6m
Market capitalization: EUR 400m (as of 31/10/17)
Listed: Scale, Börse Frankfurt
ISIN: DE000FTG1111
Bloomberg: FTK GR Equity
Stock covered by

1.3 FinTech Group AG - corporate structure
4THE FINTECH GROUP
FTG Finanz GmbH (100%)
100% 100%
100%
CORP
ORA
TE S
TRU
CTU
RE T
OD
AY
100%
Tech-Entity
Fin-EntityAS O
F Q
1 20
18
1.4 FinTech Group AG - Executive Committee
5THE FINTECH GROUP
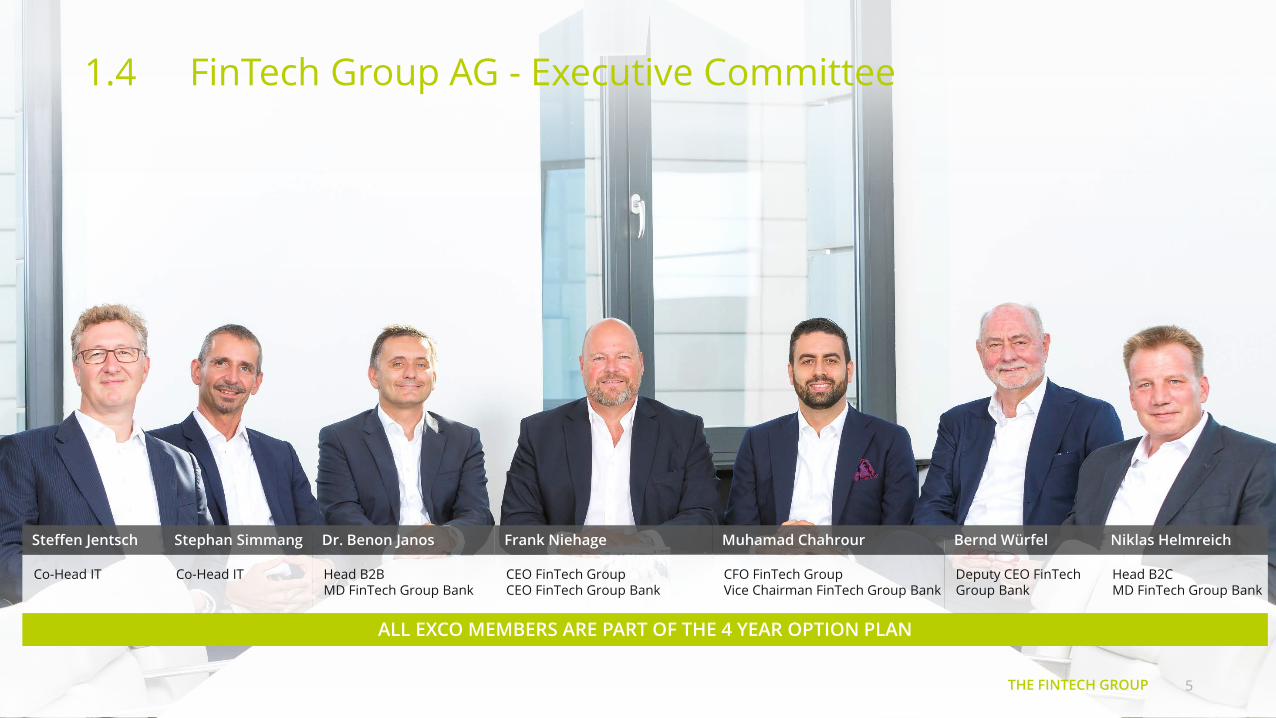
Steffen Jentsch Stephan Simmang Dr. Benon Janos Frank Niehage Muhamad Chahrour Bernd Würfel Niklas Helmreich
Co-Head IT Co-Head IT Head B2BMD FinTech Group Bank
CEO FinTech GroupCEO FinTech Group Bank
CFO FinTech GroupVice Chairman FinTech Group Bank
Deputy CEO FinTechGroup Bank
Head B2CMD FinTech Group Bank
ALL EXCO MEMBERS ARE PART OF THE 4 YEAR OPTION PLAN

22.7
75.2
95.0>100.0
>150.0
-8.0
19.7
30.6 >32.0
>50.0
-7.7 -2.2
12.3 16.8
>30.0
2016a 2017e Mid-term ambition
Net Sales
EBITDA
Net Profit
1.5 FinTech Group - track record and mid-term ambition
6THE FINTECH GROUP
Acquisition of service provider XCOM/biw to control cost structure and set-up tech in-house expertise
Implemented high class management team and subsequent restructuring actions
Sold CeFDex to Commerzbank to reduce risk structure (strategic partnership)
Restructuring of group operations and implementation of IFRS Reporting
Boost of organic growth of existing B2C business
Sale of loss making AKTIONÄRSBANK, improve annual earnings and pool banking activities in FinTech Group Bank AG
EUR milliono Continue strong growth of
number of settled transactions
o Leverage own used value chain by providing unutilized resources to third party B2B clients
o Use liquidity from cash deposits to grow the fully collateralized loan book
o Up-listing to Prime Standard of Frankfurt Stock Exchange
o Further strategic acquisitions & partnerships
2014a 2015a
Implement technology based lending and redeveloping treasury with the potential to generate an additional EUR 10+ million
Improved B2C product portfolio with Morgan Stanley ETP partnership

2.1 B2C - business model of flatex and ViTrade
7THE FINTECH GROUP
(c70% REVENUE CONTRIBUTION, ~45% EBIT MARGIN)
Fastest growing online brokerage business in Germany and Austria, >200k retail clients doing >9m transactions with notional amount of >EUR 65bn p.a.
Most trading-active clients in the market (FinTech clients: avg. 40 - 50 trades p.a. vs. market: avg. 8-12 trades p.a.)
Market share of >25% in Germany and >50% in Austria in terms of online brokerage transactions(total est. # of transactions: 50-55m in Germany, 2-3m in Austria)
Guaranteed flat pricing model of EUR 5.90 for more than 11 years - regardless of type of asset(stocks, bonds, ETPs, ETFs etc.), transaction amount and exchange
Market leading ETP offering with Morgan Stanley partnership, open architecture offering: Commerzbank, Deutsche Bank, Citi, BNP

A GROWING NUMBER OF BROKERAGE CUSTOMERS (IN K)
134,4
149,6
175,4
205,5
270,0
FY 2014 FY 2015 FY 2016 FY 2017E Mid Term
NUMBER OF RETAIL TRANSACTIONS (IN M)
5,8
7,1
7,7
9,2
12,5
FY 2014 FY 2015 FY 2016 FY 2017E Mid Term
2.2 B2C - development of brokerage KPIs
8THE FINTECH GROUPSo
urce
: Fin
Tech
Gro
up
Sour
ce: F
inTe
ch G
roup
2.3 B2C - our competitive edge
9THE FINTECH GROUP
Key drivers for successful brokerage business: cost per trade settlement (CPT), cost per client acquisition (CPA) and outstanding product offering
Competitive technology edge due to self-developed, highly scalable security ordering/settlement infrastructure ensures sustainable cost leadership with CPT of EUR 1.45
Each additional trade reduces cost per trade settlement - doubling the # of transactions reduces CPT by >40% to less than EUR 0.80 per settlement
Quality of clients matters more than quantity - focused marketing strategy attracts the right clients (>25 trades p.a.) with only EUR 100 CPA vs. EUR 300-500 at competitors
Top notch product partners offering ETFs and ETPs - exclusive joint venture with Morgan Stanley (see case study)
2.4 B2C – Case Study: Morgan Stanley ETP
10THE FINTECH GROUP
BANKS…
PAST: 90 : 10split
TODAY: 50 : 50split
REVENUE POOL
…TRADED BY CLIENTS
Revenue generation forissuing bank through:
• Inherent interestcomponent
• Bid-ask spread
…OFFERED AT FLATEX……ISSUE ETPs…
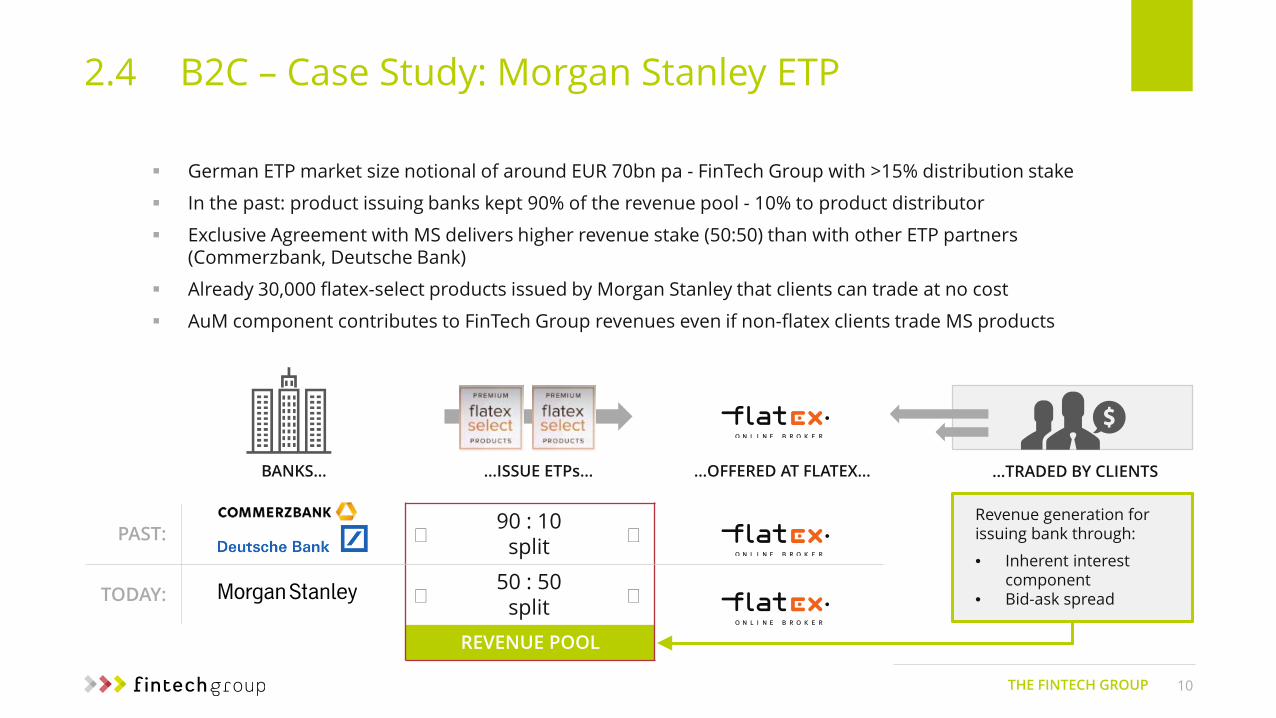
German ETP market size notional of around EUR 70bn pa - FinTech Group with >15% distribution stake
In the past: product issuing banks kept 90% of the revenue pool - 10% to product distributor
Exclusive Agreement with MS delivers higher revenue stake (50:50) than with other ETP partners (Commerzbank, Deutsche Bank)
Already 30,000 flatex-select products issued by Morgan Stanley that clients can trade at no cost
AuM component contributes to FinTech Group revenues even if non-flatex clients trade MS products
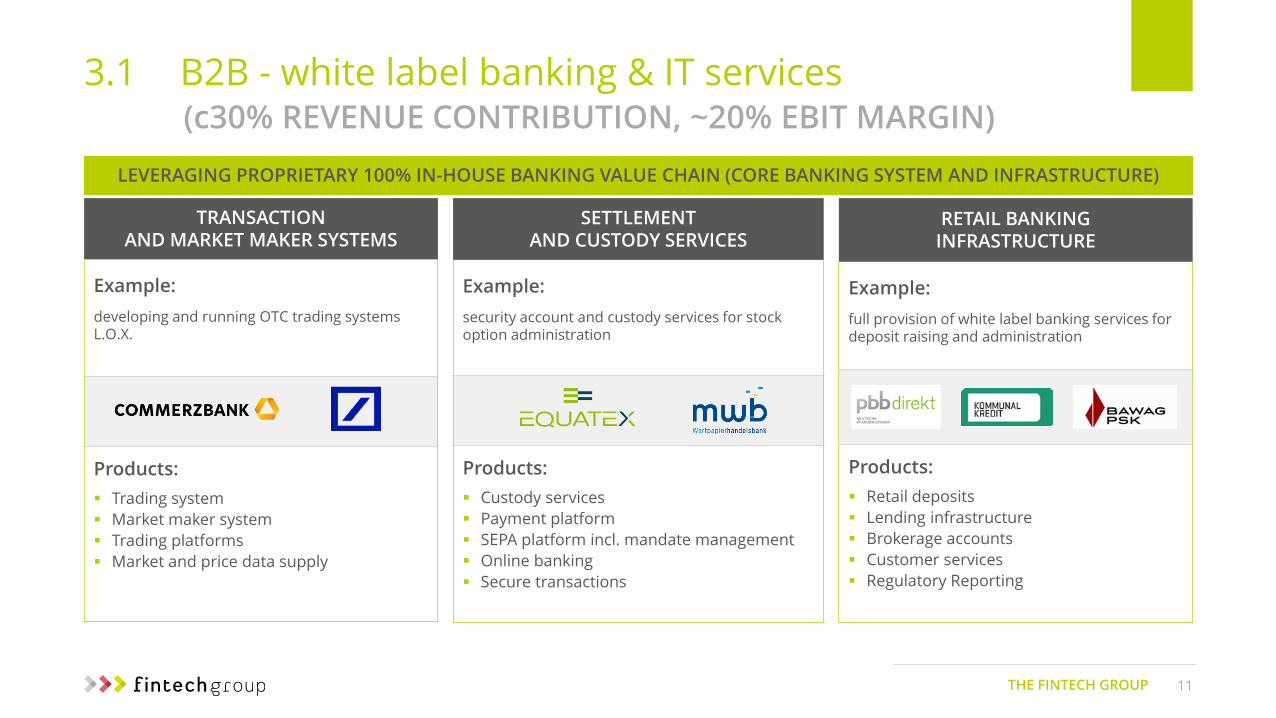
TRANSACTION AND MARKET MAKER SYSTEMS
Example:developing and running OTC trading systems L.O.X.
Products: Trading system Market maker system Trading platforms Market and price data supply
11THE FINTECH GROUP
SETTLEMENT AND CUSTODY SERVICES
Example:security account and custody services for stock option administration
Products: Custody services Payment platform SEPA platform incl. mandate management Online banking Secure transactions
RETAIL BANKING INFRASTRUCTURE
Example:full provision of white label banking services for deposit raising and administration
Products: Retail deposits Lending infrastructure Brokerage accounts Customer services Regulatory Reporting
LEVERAGING PROPRIETARY 100% IN-HOUSE BANKING VALUE CHAIN (CORE BANKING SYSTEM AND INFRASTRUCTURE)
3.1 B2B - white label banking & IT services(c30% REVENUE CONTRIBUTION, ~20% EBIT MARGIN)
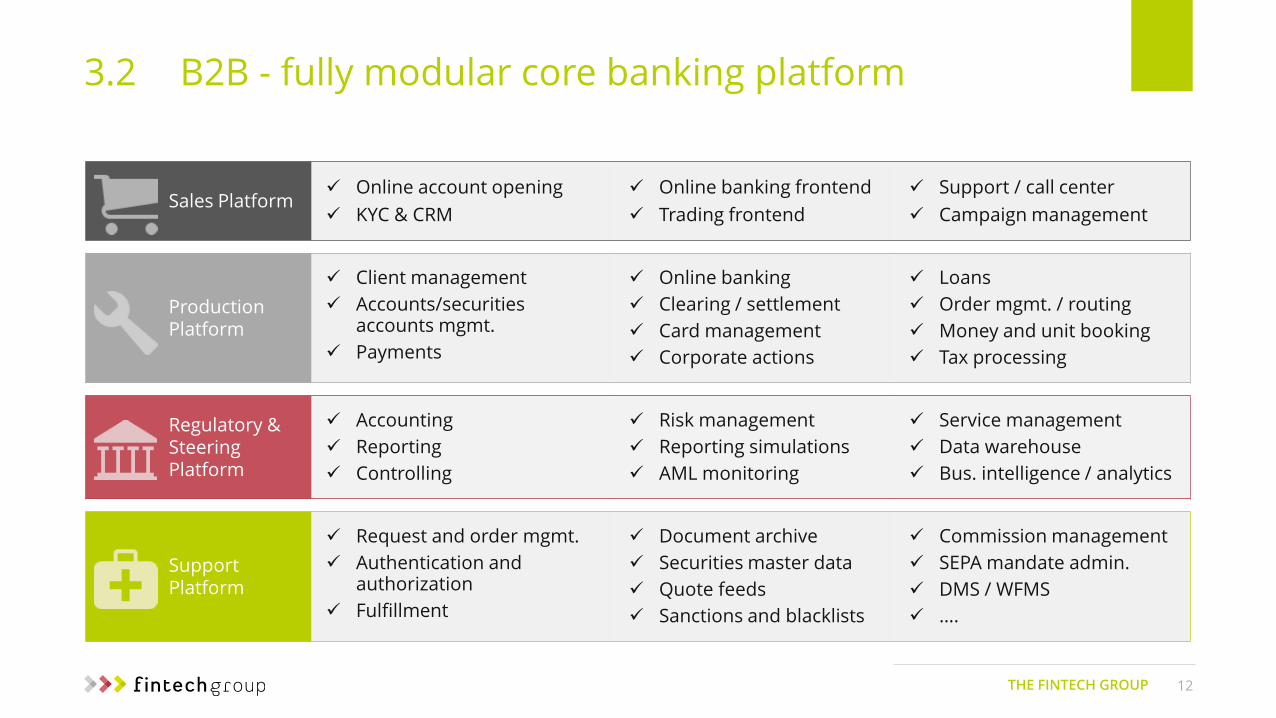
3.2 B2B - fully modular core banking platform
12THE FINTECH GROUP
Sales Platform Online account opening KYC & CRM
Online banking frontend Trading frontend
Support / call center Campaign management
Production Platform
Client management Accounts/securities
accounts mgmt. Payments
Online banking Clearing / settlement Card management Corporate actions
Loans Order mgmt. / routing Money and unit booking Tax processing
Regulatory & Steering Platform
Accounting Reporting Controlling
Risk management Reporting simulations AML monitoring
Service management Data warehouse Bus. intelligence / analytics
SupportPlatform
Request and order mgmt. Authentication and
authorization Fulfillment
Document archive Securities master data Quote feeds Sanctions and blacklists
Commission management SEPA mandate admin. DMS / WFMS ….

Not yetdisclosed
FinTech Group provides a retail banking infrastructure for deposit collection in a full BPO (including account opening, KYC, AML and all banking center services) for an international bank moving operations from London to Frankfurt due to Brexit
BankhausObotritia
FinTech Group runs and manages in a full business process outsourcing (BPO) the banking operations, including core banking system and all major regulatory banking processes to run the bank
FinTech Group was chosen to set-up the technological infrastructure for digital online retail banks in Germany and Austria including providing several respective regulatory banking processes
3.3 B2B - client excerpt and case studies
13THE FINTECH GROUP
Most recent B2B projects:

4.1 The ecosystem - unique combination of independent business models…
14
B2C - Brokerage
High margin business
Volatile business model
Heavily depending on capital markets and customer behavior
Less predictive revenue streams
OPEX driven
B2B - White label banking & IT services
Stable long term contracts
Very low volatility
Lower margin than B2C business
Highly predictable revenue streams
CAPEX driven
THE FINTECH GROUP

4.2 The ecosystem - …creates inherent growth potential
15THE FINTECH GROUP
Access to new partner
Increase transactions
Expand product portfolio Increase
profitability
GROWTH
B2B B2CReduce costs
Leveragesynergies
Improve customer value "customer
journey"
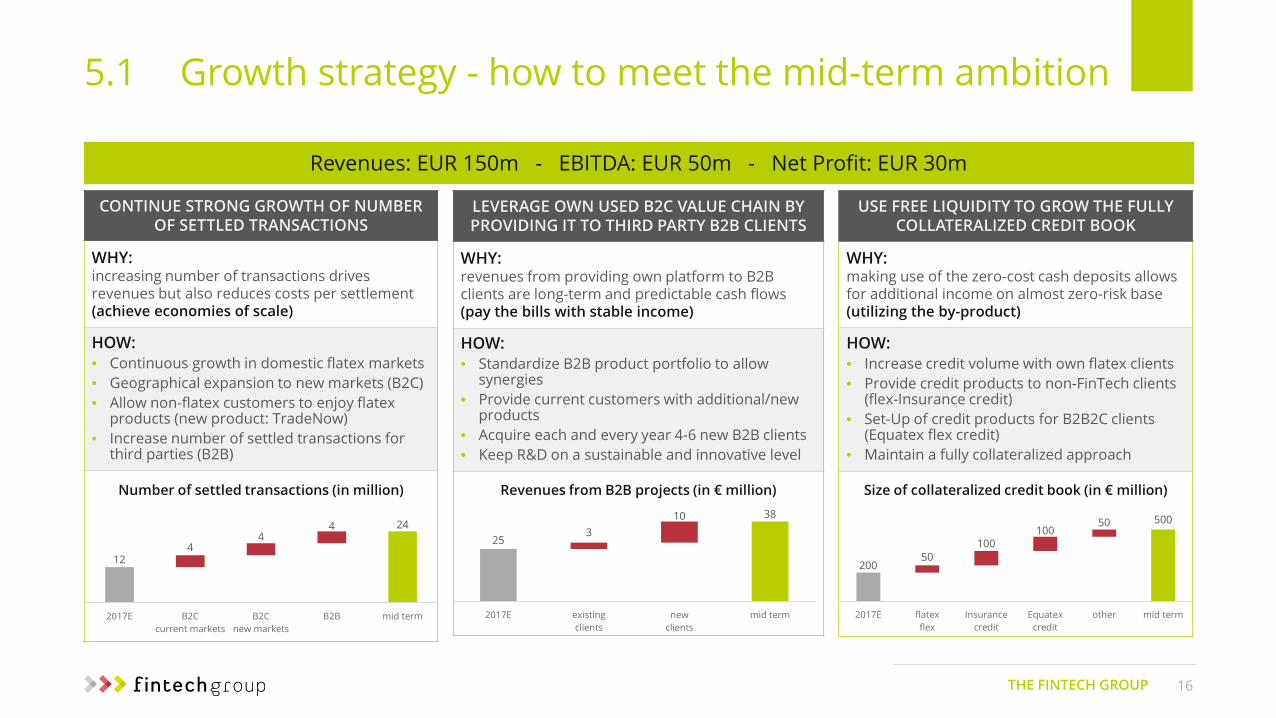
Revenues: EUR 150m - EBITDA: EUR 50m - Net Profit: EUR 30m
USE FREE LIQUIDITY TO GROW THE FULLY COLLATERALIZED CREDIT BOOK
WHY:making use of the zero-cost cash deposits allows for additional income on almost zero-risk base (utilizing the by-product)
HOW:• Increase credit volume with own flatex clients• Provide credit products to non-FinTech clients
(flex-Insurance credit)• Set-Up of credit products for B2B2C clients
(Equatex flex credit)• Maintain a fully collateralized approach
LEVERAGE OWN USED B2C VALUE CHAIN BY PROVIDING IT TO THIRD PARTY B2B CLIENTS
WHY:revenues from providing own platform to B2B clients are long-term and predictable cash flows(pay the bills with stable income)
HOW:• Standardize B2B product portfolio to allow
synergies• Provide current customers with additional/new
products• Acquire each and every year 4-6 new B2B clients• Keep R&D on a sustainable and innovative level
CONTINUE STRONG GROWTH OF NUMBER OF SETTLED TRANSACTIONS
WHY:increasing number of transactions drives revenues but also reduces costs per settlement (achieve economies of scale)
HOW:• Continuous growth in domestic flatex markets• Geographical expansion to new markets (B2C)• Allow non-flatex customers to enjoy flatex
products (new product: TradeNow)• Increase number of settled transactions for
third parties (B2B)
5.1 Growth strategy - how to meet the mid-term ambition
16THE FINTECH GROUP
124
44 24
2017E B2Ccurrent markets
B2Cnew markets
B2B mid term
253
10 38
2017E existingclients
newclients
mid term
20050
100100
50 500
2017E flatexflex
Insurancecredit
Equatexcredit
other mid term
Revenues from B2B projects (in € million)Number of settled transactions (in million) Size of collateralized credit book (in € million)

5.2 Growth strategy - B2C
17THE FINTECH GROUP
ORGANIC GROWTH STRATEGY
• Continue organic growth in Germany and Austria and manifest market leadership in terms of client activity and product offering
• Emphasize focus on becoming the leading European online brokerage business by penetrating new countries
• Leverage partnership with ETP partner to share penetration and marketing expenses
• Spread out all over Europe and build the largest pan-European online brokerage business which is big-bank independent using our EU-Passport
GROWTH STRATEGY BY ACQUISITON
• Search for takeover opportunities in Europe with the following parameters:
• Higher cost per transaction leveraging our processes and systems to generate higher profit
• Higher cost per client acquisition apply our marketing strategies to generate higher profit
• Inefficient product partnerships offer our best-class and broadest product portfolio to generate higher profits
• Weakly managed under increasing regulatory requirements implement our experienced management team to generate added value
B2C - Online Brokerage
Currently operating Potential markets

5.3 Growth strategy - B2B
18THE FINTECH GROUP
B2B - White Label Banking/IT Services
ORGANIC GROWTH STRATEGY
Clear strategy to become Europe’s leading transaction processor by offering own-used value chain to third parties
Continue focus on transaction settlement and offering settlement as a service to private and specialist banks
Current global ROE of banks @ 8-10%, ROE of banks in Germany @ < 4% banks have pressure to reduce costs and to outsource inefficient back office structures and processes
Make use of current market and regulatory (ongoing consolidation of banking technology provider affecting more than 300 banks) as well as political environment (Brexit) to attract new B2B clients
Each new mandate will contribute at least a contract lifetime revenue of EUR 5-10 million

5.4 Growth strategy - credit book
19THE FINTECH GROUP
0
250
500
31.12.2016 30.06.2017 31.12.2017 30.06.2018mid termambition
Setting-up a credit portfolio, diversified over risk, maturity and duration (>95% fully collateralized)
Aimed mid term portfolio size of EUR 500m @ average interest rate of 4%
Successful introduction of “flatex flex credit line” (technically a 100% collateralized overdraft facility with max 25% LTV on securities held by client) EUR 100m+ credit lines drawn after 12 months
Addressing new market participants (B2B2C clients as well as insurance customers) with flex credit
Highly collateralized factoring portfolio of currently ~EUR 50m, first-class debtors with top credit ratings such as ALDI, LIDL
B2C COLLATERALIZED LOANS EUR 350MN @ 4.5% = EUR +16MN P.A. ALTERNATIVE CREDIT BOOK EUR 150MN @ 3.5% = EUR +5MN P.A.

Customers maintain currently more than EUR 1bn with FinTech Group Bank AG (overnight trading money), thereof around EUR 800m is managed in a treasury portfolio
Current management set up treasury strategy, despite low (negative) interest environment in Europe treasury portfolio is profitable and highly diversified (sovereign, municipal bonds and corporate bonds), yielding around 0.2% interest
FinTech Group has never paid interest rates on customer deposits to customers
Hidden reserve: increase in interest rate environment will have enormous impact on P&L:1% increase +EUR 10 million EBT
5.5 Growth strategy – the hidden treasury reserve
20THE FINTECH GROUP
0.5%
1.0%
1.5%
0
10
20
30
800 900 1000 1100 1200 1300 1400 1500
Incr
emen
talE
BT
Customer deposits
HIDDEN RESERVE: P&L IMPACT DUE TO CHANGE OF INTEREST ENVIRONMENT..
Cash Deposits as of 30.06.2017

30,10%
15,90%
6,87%
3,12%2,97%
1,72%
1,31%
1,02%
0,86%
0,57%
35,57%
GFBK (Entity of flatex founder Bernd Förtsch)
Other and free float (Holding <0.5%)
7. The FinTech Group AG - shareholder structure
21THE FINTECH GROUP

Annex

23THE FINTECH GROUP
Our business model at a glance
ONLINE BROKERAGE
Germany & Austria 230k retail clients > 9m security transactions Broad product portfolio (including
stocks, bonds, ETPs, ETFs, variousfunds)
100% of value chain in-house (technology, banking, regulatory)
65 – 70%
~ 45%
Revenue contribution
Products
Peer group
EBITmargin
CREDIT & TREASURY
Portfolio EUR 1bn deposits of clients EUR 180m loan book @ 4% NIM Aimed portfolio size by EOY17: EUR 250m Substantial hidden reserve in treasury portfolio− today: EUR 1bn @ 0.2% = EUR 2m NII− potentail (increase in interest environment):
EUR 1bn @ 1.2% = EUR 12m NII
5 – 10%
~ 100%
WHITE LABEL BANKING SERVICES
Banking Core banking system White Label Banking
Services (account opening and admin., call center etc.)
Reporting systems (client, regulatory etc.)
Transaction Trading system Market maker system Trading platforms Market and price data
supply
20 – 25%
~ 20%

24THE FINTECH GROUP
History of FinTech Group – Key Miletones
1988Company founded in Langen
2001Development and full BPO provider for pan-European expansion (core banks system FTG:CBS:R1 is born)
2006Best German online broker goes live
Full white label Retail Bank operations begins (full BPO)
L.O.X. OTC certificate platform developed (limit order system connects DB/Coba flow to 22 pan-European brokers)
Migration of mwb fairtrade from caceis to FinTech Group Bank for order routing and securities settlement (1.4m trades / yr)
Largest Austrian bank selects FinTech Group as full BPO for German digital expansion
1997
Full BPO IT provider for bankenverband ever since
2009
2015
2017
2010

25ANNEX
Financials at a Glance - Consolidated GroupSo
urce
: Fin
Tech
Gro
up
Sour
ce: F
inTe
ch G
roup
Sour
ce: F
inTe
ch G
roup
34,6* 40,6 48,3 46,7
100,0+
H1 2015 H2 2015 H1 2016 H2 2016 FY 2017E
10,0
-12,2
2,5
9,8
16,8+
H1 2015 H2 2015 H1 2016 H2 2016 FY 2017E
-15,5%
-2,5%
13,6%16,5%+
2014 2015 2016 2017E
Sour
ce: F
inTe
ch G
roup
-0,58
-0,99
0,731,00+1
2014 2015 2016E 2017E
* H1 2015 numbers include significant one-off income (reported figure in FY15: EUR 8.3mn) andconsolidate only three months XCOM AG / FinTech Group Bank AG (for further information see HY16 financial report note 4)
Note: all segment numbers before intersegment consolidation and holding expenses – thus sum of segments does not equal Group financials
1undiluted, based on 16.8m shares outstanding as of 01/04/2017
SHAREHOLDER VALUE CREATION THROUGH ROE GROWTH AFTER GROUP RESTRUCTURING FOCUS ON EPS
CONTINUOUS REVENUE GROWTH WITH NEW STRATEGY (mEUR) NET PROFIT TURNAROUND ACHIEVED (mEUR)

26ANNEX
Segment Financials at a GlanceSECURITIES TRADING AND FINANCIAL SERVICES
EFFICIENT IT AND BANKING ECOSYSTEM DRIVES EBITDA-MARGIN
Sour
ce: F
inTe
ch G
roup
ONGOING INCREASE IN NUMBER OF RETAIL CLIENTS (k)
Sour
ce: F
inTe
ch G
roup 163,7
176,6193,8
212,0
250,0**
H1 2015 H2 2015 H1 2016 H2 2016 FY 2017E
73,4%*
54,9%63,8% 57,7%
67,0%+
H1 2015 H2 2015 H1 2016 H2 2016 FY 2017E
EBITDA INCREASING WITH HIGHER SHARE OF WALLET (mEUR)
Sour
ce: F
inTe
ch G
roup
15,7*
3,9
7,44,5
16,5+
H1 2015 H2 2015 H1 2016 H2 2016 FY 2017E
LEADING B2C-POSITION ENSURES RECURRING REVENUES (mEUR)
Sour
ce: F
inTe
ch G
roup
21,4*
7,111,6
7,8
25,0+
H1 2015 H2 2015 H1 2016 H2 2016 FY 2017E
* H1 2015 numbers include significant one-off income (reported figure in FY15: EUR 8.3mn)** includes flatex, ViTrade and further B2C clients
Note: all numbers before intersegment consolidation and holding expenses – thus sum of segmentsdoes not equal Group financials

27ANNEX
Segment Financials at a GlanceTRANSACTION PROCESSING & WHITE-LABEL BANKING SERVICES
SCALABLE PRODUCTS AND BPO PUSHES EBITDA-MARGIN
Sour
ce: F
inTe
ch G
roup
STRONG GROWTH IN NUMBER OF SETTLED TRANSACTIONS (m)
Sour
ce: F
inTe
ch G
roup
RESTRUCTURING HAS INCREASED EFFICIENCY AND EBITDA (mEUR)
Sour
ce: F
inTe
ch G
roup
INTENSIFIED SALES ACTIVITIES IMPACT REVENUE GROWTH (mEUR)
Sour
ce: F
inTe
ch G
roup
Note: all numbers before intersegment consolidation and holding expenses – thus sum of segmentsdoes not equal Group financials
* H1 2015 numbers consolidate only three months XCOM AG / FinTech Group Bank AG (for furtherinformation see HY16 financial report note 4)
4,8 5,3 5,0 5,5
12,5
H1 2015 H2 2015 H1 2016 H2 2016 FY 2017E
18,6%* 18,6%
33,7%
47,7%
38,0%+
15%
40%
H1 2015 H2 2015 H1 2016 H2 2016 FY 2017E
2,2*6,2
12,316,3
28,5+
H1 2015 H2 2015 H1 2016 H2 2016 FY 2017E
11,8*
33,4 36,5 34,2
75,0+
H1 2015 H2 2015 H1 2016 H2 2016 FY 2017E

Frank NiehageCEOFinTech Group AGRotfeder-Ring 5-760327 Frankfurt, Germany
www.fintechgroup.com
Muhamad ChahrourCFOFinTech Group AGRotfeder-Ring 5-760327 Frankfurt, Germany
www.fintechgroup.com
Contact details