corporate presentation aug10x - fibr.infoinvest.com.br at the time, ... eucalyptus pulp shipments...
TRANSCRIPT
1
Corporate PresentationAugust 2010
Disclaimer
The information contained in this presentation may include statements which constituteforward-looking statements, within the meaning of Section 27A of the U.S. Securities Actof 1933, as amended, and Section 21E of the U.S. Securities Exchange Act of 1934, asamended. Such forward-looking statements involve a certain degree of risk anduncertainty with respect to business, financial, trend, strategy and other forecasts, andare based on assumptions, data or methods that, although considered reasonable by thecompany at the time, may turn out to be incorrect or imprecise, or may not be possible torealize. The company gives no assurance that expectations disclosed in this presentationwill be confirmed. Prospective investors are cautioned that any such forward-looking
2
will be confirmed. Prospective investors are cautioned that any such forward-lookingstatements are not guarantees of future performance and involve risks and uncertainties,and that actual results may differ materially from those in the forward-looking statements,due to a variety of factors, including, but not limited to, the risks of international businessand other risks referred to in the company’s filings with the CVM and SEC. The companydoes not undertake, and specifically disclaims any obligation to update any forward-looking statements, which speak only for the date on which they are made.
Agenda
The Company
Market Positioning
Pulp and Paper Market
3
2Q10 Financials
Corporate Restructuring

4
The Company

VCP and Aracruz merged to create Fibria
Shareholder Structure
Votorantim Industrial S.A.
BNDESPar Free Float
29.34% 30.42% (1) 40.17%
Treasury
0.07%
5
Veracel Celulose S.A.
50.0%50.0%
Conpacel
(1) Position as of June 30, 2010. BNDESPar has 21% linked to a shareholder’s agreement with VID during the first 3 years, and 10.9% during the following 2 years.

Improved Corporate Governance
Board Advisory CommitteesBoard of Directors
Audit and Risks
Personnel and Remuneration
����
����
Alexandre Gonçalves Silva Indicated by Votorantim
Alexandre Silva D’Ambrosio Indicated by Votorantim
Armando Mariante Carvalho Junior Indicated by BNDES
Eduardo Rath Fingerl Indicated by BNDES
6
Finance
Sustainability
����
����
João Miranda Indicated by Votorantim
José Armando de Figueiredo Campos Independent Member
Jose Luciano Penido Chairman of the Board
Raul Calfat Indicated by Votorantim
Wang Wei Chang Indicated by Votorantim

7
Market Positioning
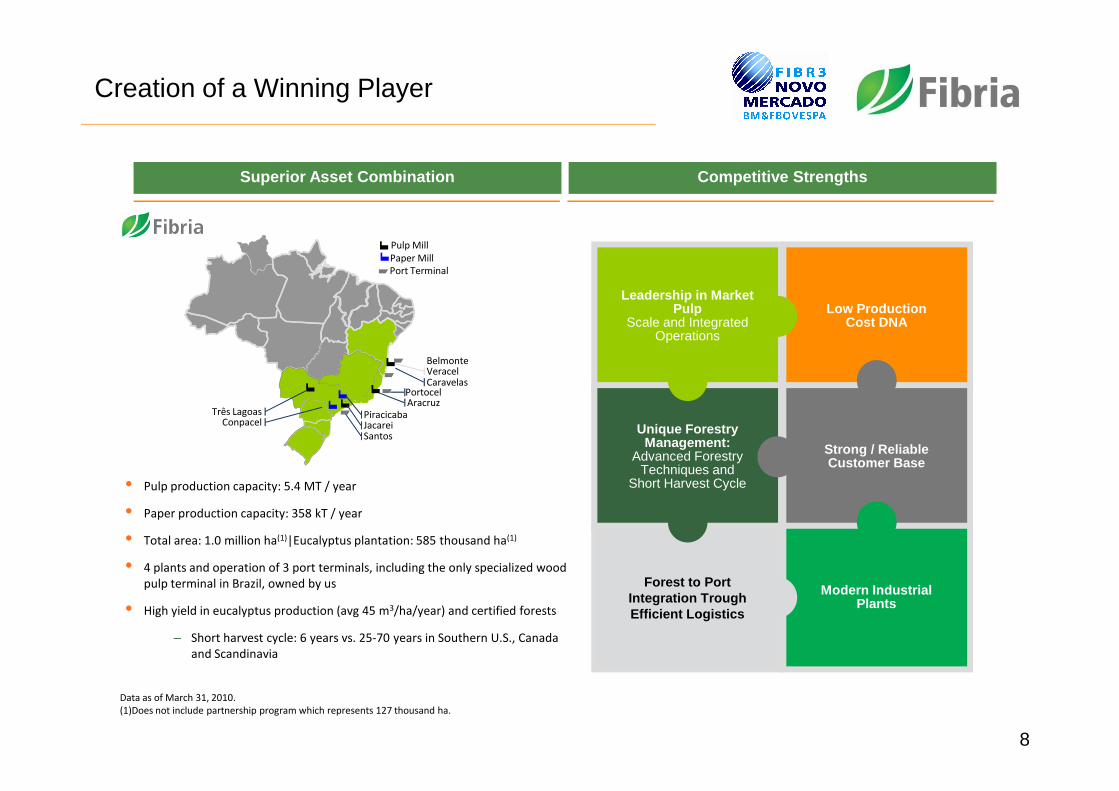
Creation of a Winning Player
Competitive Strengths
Pulp Mill
Paper Mill
BelmonteVeracelCaravelas
Portocel
Superior Asset Combination
Port Terminal
Leadership in Market Pulp
Scale and Integrated Operations
Low Production Cost DNA
8
• Pulp production capacity: 5.4 MT / year
• Paper production capacity: 358 kT / year
• Total area: 1.0 million ha(1)|Eucalyptus plantation: 585 thousand ha(1)
• 4 plants and operation of 3 port terminals, including the only specialized wood
pulp terminal in Brazil, owned by us
• High yield in eucalyptus production (avg 45 m3/ha/year) and certified forests
– Short harvest cycle: 6 years vs. 25-70 years in Southern U.S., Canada
and Scandinavia
PortocelAracruz
PiracicabaJacareiSantos
Três LagoasConpacel
Data as of March 31, 2010.
(1)Does not include partnership program which represents 127 thousand ha.
Unique Forestry Management:
Advanced Forestry Techniques and
Short Harvest Cycle
Forest to Port Integration Trough Efficient Logistics
Strong / Reliable Customer Base
Modern Industrial Plants
1.5
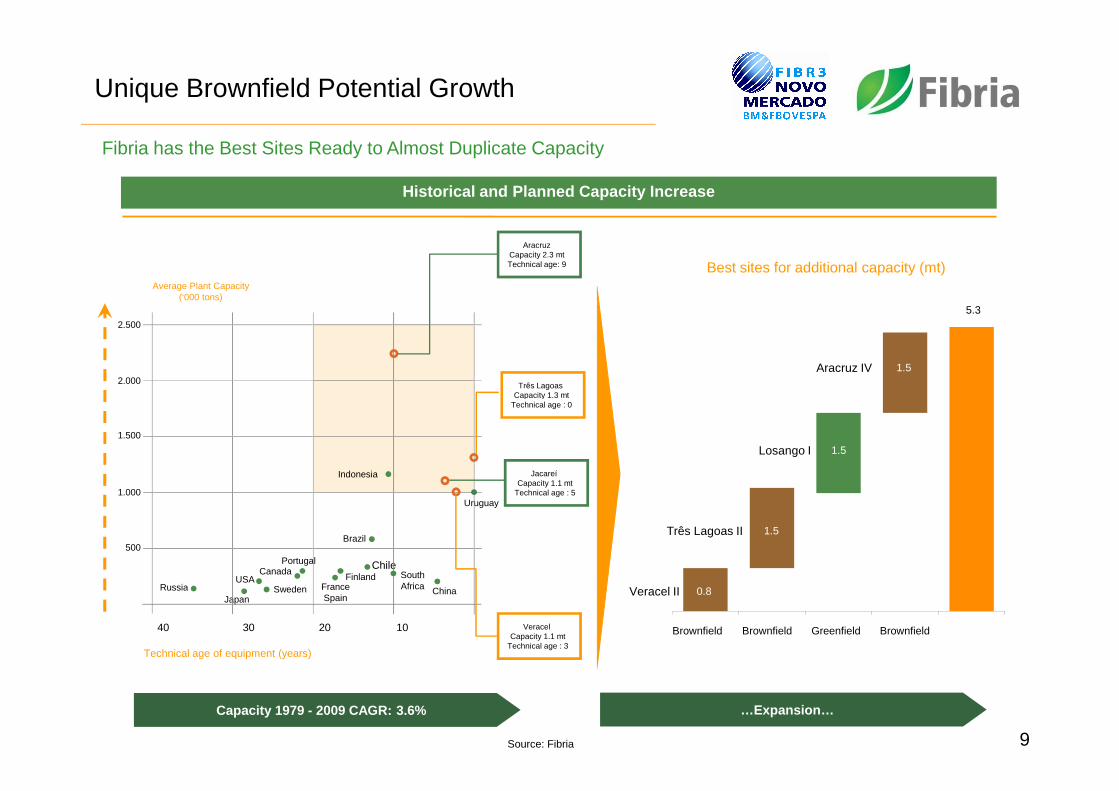
Unique Brownfield Potential Growth
Fibria has the Best Sites Ready to Almost Duplicate Capacity
Historical and Planned Capacity Increase
Aracruz IV
Best sites for additional capacity (mt)
AracruzCapacity 2.3 mtTechnical age: 9
Average Plant Capacity(‘000 tons)
2.500
2.000 Três LagoasCapacity 1.3 mt
5.3
9
Veracel II
Três Lagoas II
Losango I
Brownfield Brownfield Greenfield Brownfield
Source: Fibria
1.500
1.000
500
40 30 20 10
RussiaJapan
USASweden
CanadaPortugal
FinlandFranceSpain
ChileSouthAfrica China
Brazil
Indonesia
Uruguay
Technical age of equipment (years)
Capacity 1.3 mtTechnical age : 0
JacareíCapacity 1.1 mt
Technical age : 5
VeracelCapacity 1.1 mt
Technical age : 3
Capacity 1979 - 2009 CAGR: 3.6% …Expansion…
0.8
1.5
1.5

Undisputable Leadership in the Global Market Pulp
Pulp Production Capacity
2009E in ktons
5,400
Dominant Position in a Growing Market
1o
~ Twice The size
10Source: PÖYRY, 2007 / As for Market Pulp: Pulp and Paper Products Council (PPPC) 2009 and Fibria.(1) Market Share estimated considering 2009 nominal capacity.

2,44
2,18
2,00
Low Production Cash Cost DNA
Cash Costs (2)Fibria's Margin vc Macroeconomic Fundamentals (1)
155
243 238284 310
178232
178133 104 95
320225
199152 113
238 161
118133
151 155
468437 436 423
475
416393
296266 255 250(3)583
641
705
783
565
920
Average PriceBHKP (US$/ton) (1)
11
1,95 1,84
2,00
1,80
104 95
Iberia
(2) Source: Hawkins Wright Estimate 2Q10 (3) Fibria 2Q10 Cash cost without downtimes
Hardwood Cash Cost (US$/t) vs Capacity (kT)
0
100
200
300
400
500
600
0 2.000 4.000 6.000 8.000 10.000 12.000
US$/ton
Iberia
250
Capacidade (kT)
Exchange Rate Average(RS/US$)(1)
1.013 1.115880
2.196
1.697
730
35%38%
34%37%
28%
40%
2005* 2006* 2007* 2008 Pro Forma
2009 2Q10
(1) Average Price: FOEX | Exchange rate: Brazilian Central Bank
EBITDA Margin
EBITDA (R$ million)
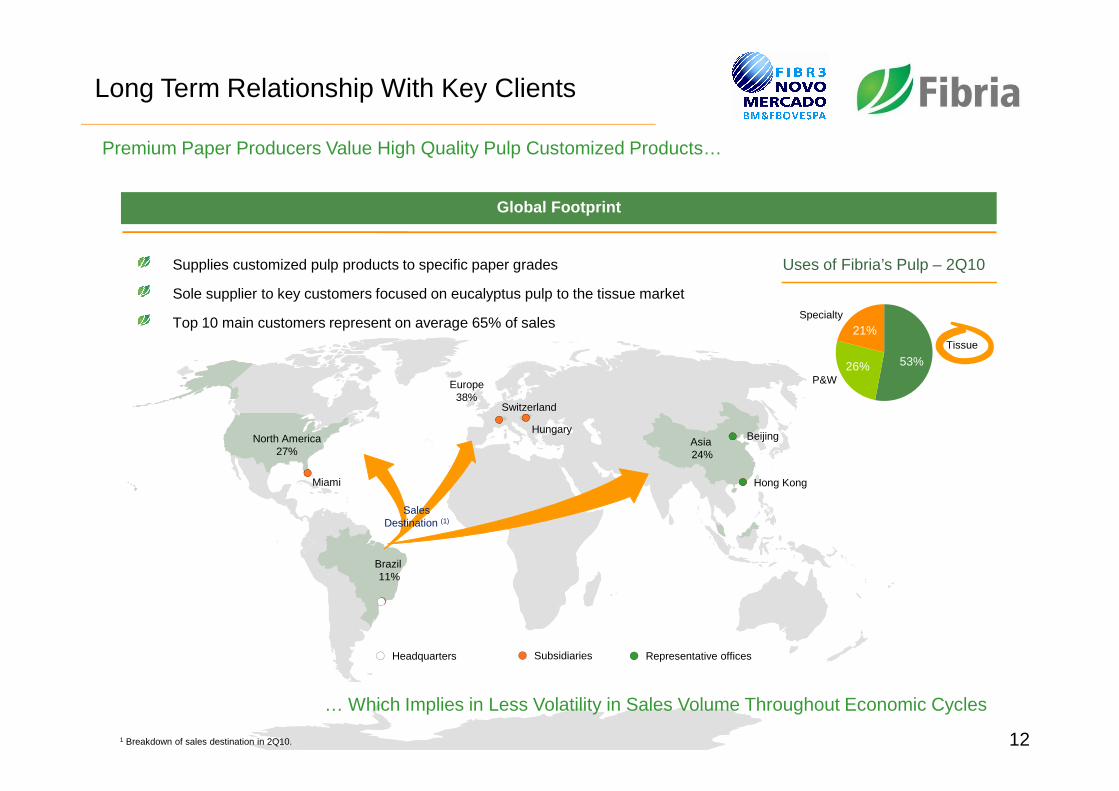
Long Term Relationship With Key Clients
Premium Paper Producers Value High Quality Pulp Customized Products…
Global Footprint
Supplies customized pulp products to specific paper grades
Sole supplier to key customers focused on eucalyptus pulp to the tissue market
Top 10 main customers represent on average 65% of sales
P&W
Tissue
Specialty
Uses of Fibria’s Pulp – 2Q10
Europe38%
53%26%
21%
12
NY004GAK_1.worNY004GAK_1.worNY004GAK_1.worNY004GAK_1.worNY004GAK_1.worNY004GAK_1.worNY004GAK_1.worNY004GAK_1.wor… Which Implies in Less Volatility in Sales Volume Throughout Economic Cycles
1 Breakdown of sales destination in 2Q10.
38%
North America27%
Asia 24%
Brazil 11%
Beijing
Switzerland
SalesDestination (1)
Miami Hong Kong
Hungary
Subsidiaries Representative officesHeadquarters

13
Pulp and Paper Market

Positive Commodity Cycle and Demand Recovery
World P&W paper shipments to capacityWorld market pulp shipments to capacity
91%89%
82%
86%
83%
79%
90%
77%
88%
92%
97%
86%
95%
92%93%
95%
90%92%
90%
86%
98%
91%
95%
87%87%
92%
89%
87%
97%
92%
85%
78%76%
79%79%77%
73%
79%79%78%
89%87%
86%
81%79%
88%87%
86%87%87%
14
Jun-
08
Jul-0
8
Aug
-08
Sep
-08
Oct
-08
Nov
-08
Dec
-08
Jan-
09
Feb
-09
Mar
-09
Apr
-09
May
-09
Jun-
09
Jul-0
9
Aug
-09
Sep
-09
Oct
-09
Nov
-09
Dec
-09
Jan-
10
Feb
-10
Mar
-10
Apr
-10
May
-10
Jun-
10
Jun-
08
Jul-0
8
Aug
-08
Sep
-08
Oct
-08
Nov
-08
Dec
-08
Jan-
09
Feb
-09
Mar
-09
Apr
-09
May
-09
Jun-
09
Jul-0
9
Aug
-09
Sep
-09
Oct
-09
Nov
-09
Dec
-09
Jan-
10
Feb
-10
Mar
-10
Apr
-10
May
-10
Jun-
10
World pulp consumers' days of supplyWorld pulp producers' average days of supply
Source: PPPC Global 100
Source: PPPC Global 100 Source: PPPC Global 100
Source: PPPC Global 100
1915
20
25
30
35
Mar
-05
Oct
-05
May
-06
Dec
-06
Jul-0
7
Feb
-08
Sep
-08
Apr
-09
Nov
-09
Jun-
10
25
10
20
30
40
50
60
Mar
-05
Oct
-05
May
-06
Dec
-06
Jul-0
7
Feb
-08
Sep
-08
Apr
-09
Nov
-09
Jun-
10
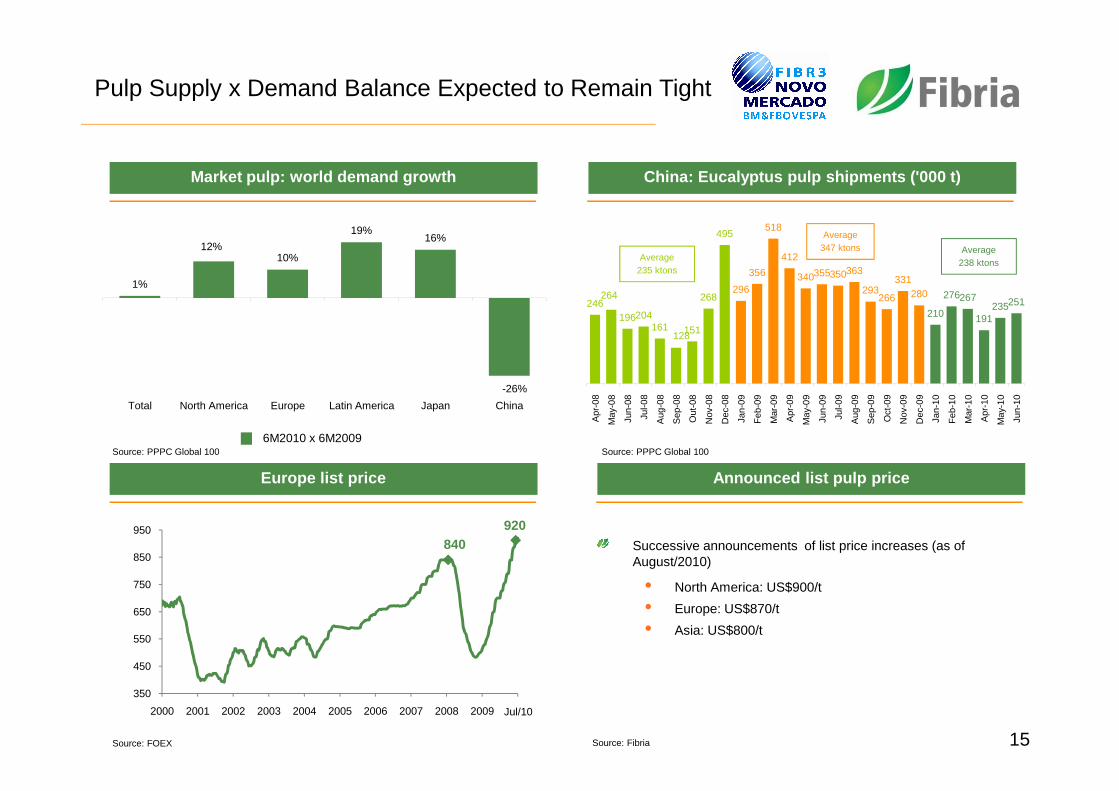
Pulp Supply x Demand Balance Expected to Remain Tight
China: Eucalyptus pulp shipments ('000 t)Market pulp: world demand growth
246264
196204161
128151
268
495
296
356
518
412
340355350363
293266
331280
210
276267
191235251
08 08 08 08 08 08 08 08 08 09 09 09 09 09 09 09 09 09 09 09 09 10 10 10 10 10 10
1%
12%10%
19%16%
-26%
Average235 ktons
Average347 ktons Average
238 ktons
15
Apr
-08
May
-08
Jun-
08
Jul-0
8
Aug
-08
Sep
-08
Out
-08
Nov
-08
Dec
-08
Jan-
09
Feb
-09
Mar
-09
Apr
-09
May
-09
Jun-
09
Jul-0
9
Aug
-09
Sep
-09
Oct
-09
Nov
-09
Dec
-09
Jan-
10
Feb
-10
Mar
-10
Apr
-10
May
-10
Jun-
10
Announced list pulp priceEurope list price
Source: Fibria
Source: PPPC Global 100 Source: PPPC Global 100
Source: FOEX
Total North America Europe Latin America Japan China
6M2010 x 6M2009
Successive announcements of list price increases (as of August/2010)
• North America: US$900/t
• Europe: US$870/t
• Asia: US$800/t
840920
350
450
550
650
750
850
950
2000 2001 2002 2003 2004 2005 2006 2007 2008 2009 2010Jul/10
16
2Q10 Financials

2Q10 Performance
Pulp sales mixKey figures
2Q10 1Q10 2Q09 2Q10 vs1Q10
2Q10 vs2Q09
Pulp Production (1000t) 1,208 1,314 1,334 -8% -9%
Pulp Sales (1000t) 1,253 1,322 1,349 -5% -7%
Paper Producton (1000t) 79 77 94 3% -16%
Paper sales (1000t) 87 83 104 6% -16%
Net Revenue (R$ million) 1,809 1,675 1,471 8% 23%
Adjusted EBITDA (R$ million) 730 637 389 15% 87%
EBITDA Margin (%) 40% 38% 26% 2 p.p. 14 p.p.
21%
32%
37%
9%
2Q09
27%
39%
23%
11%
1Q10
North America Europe Asia Brazil/Others
27%
38%
24%
11%
2Q10
17
EBITDA (R$ million) and EBITDA Margin (%)Cash cost (R$/t)
389
637
730
2Q09 1Q10 2Q10
EBITDA Margin (%) 40% 38% 26% 2 p.p. 14 p.p.
Financial Income (R$ million) (315) (341) 1.369 - -
Net Income (R$ million) 130 9 920 1,341% -86%
26%
38% 40%
418
499
440
1Q10 2Q10 2010E
449
2Q10 w/ downtimes
Source: Fibria
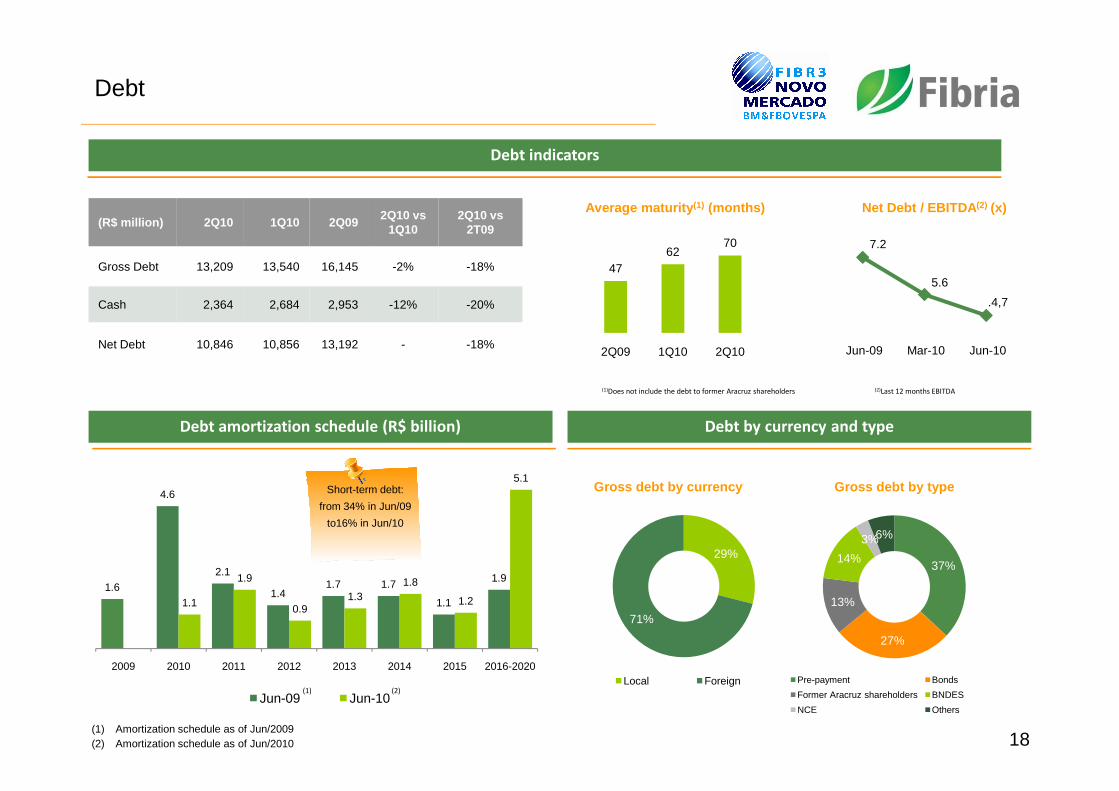
Debt
Debt indicators
(R$ million) 2Q10 1Q10 2Q092Q10 vs
1Q102Q10 vs
2T09
Gross Debt 13,209 13,540 16,145 -2% -18%
Cash 2,364 2,684 2,953 -12% -20%
Net Debt 10,846 10,856 13,192 - -18%
4762
70
2Q09 1Q10 2Q10
(1)Does not include the debt to former Aracruz shareholders
Average maturity (1) (months)
7.2
5.6
.4,7
Jun-09 Mar-10 Jun-10
Net Debt / EBITDA (2) (x)
(2)Last 12 months EBITDA
18
Debt amortization schedule (R$ billion) Debt by currency and type
1.6
4.6
2.1
1.41.7 1.7
1.1
1.9
1.1
1.9
0.91.3
1.8
1.2
5.1
2009 2010 2011 2012 2013 2014 2015 2016-2020
Jun-09 Jun-10
29%
71%
Gross debt by currency
Local Foreign
(1) Amortization schedule as of Jun/2009(2) Amortization schedule as of Jun/2010
(1) (2)
37%
27%
13%
14%
3%6%
Gross debt by type
Pre-payment Bonds
Former Aracruz shareholders BNDES
NCE Others
Short-term debt:
from 34% in Jun/09
to16% in Jun/10
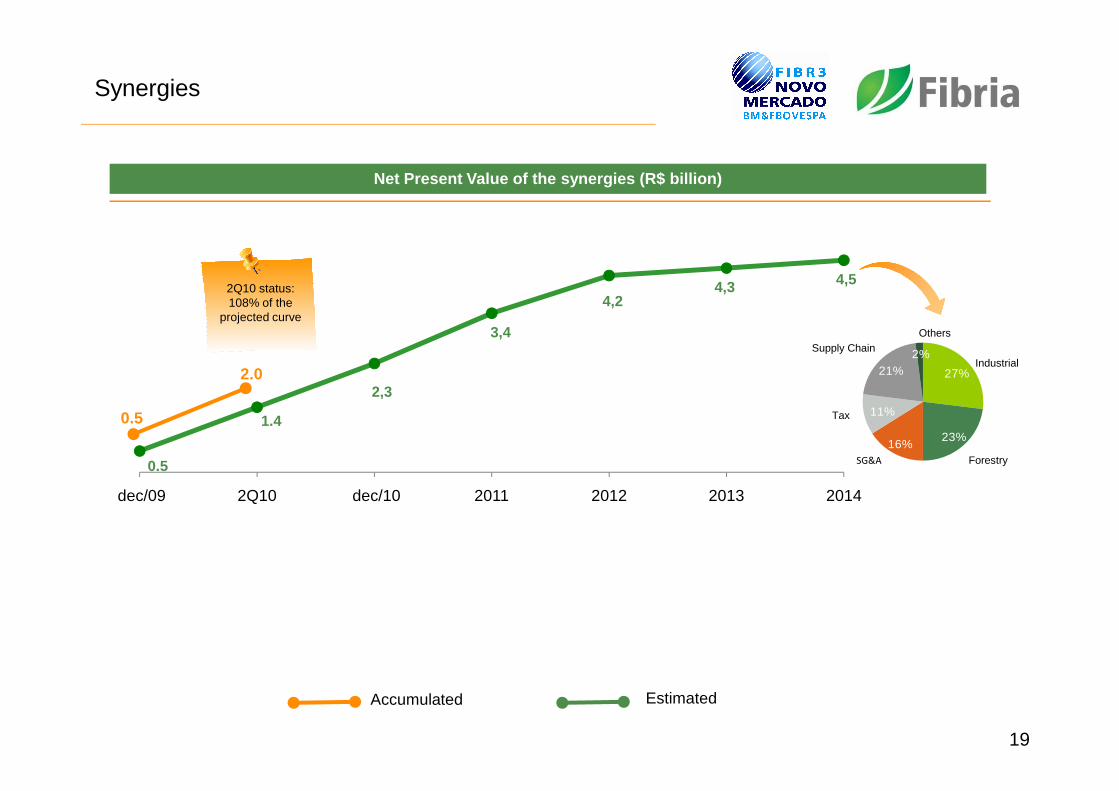
Synergies
Net Present Value of the synergies (R$ billion)
2,3
3,4
4,24,3 4,5
2Q10 status:108% of the
projected curve
27%21%2%
IndustrialSupply Chain
Others
2.0
19
Accumulated Estimated
0.5
1.4
2,3
dec/09 2Q10 dec/10 2011 2012 2013 2014
23%16%
11%
ForestrySG&A
Tax0.5
20
Corporate Restructuring

Corporate Restructuring
Event Date
Acquisition by VCP of additional 28% of Aracruz common shares Jan 20, 2009
VCP Capital Increase Apr 14, 2009
VCP conversion of prefered into common shares Jun 12, 2009
Tender Offer for Aracruz common shareholders Jul 02, 2009
Incorporation proposal for the 0.1347 ratio Aug 24, 2009
Merger of Aracruz shares into VCP approval Aug 24, 2009
21
Merger of Aracruz shares into VCP approval Aug 24, 2009
Shareholderes Agreement - VID and BNDES Oct 29, 2009
End of withdrawal rights period Nov 12, 2009
End of Aracruz trading Nov 17, 2009
Fibria trading start (Bovespa: FIBR3 / NYSE: FBR) Nov 18, 2009
Approval of the merger of Aracruz into Fibria Dec 22, 2009
Migration to Novo Mercado listing segment at BM&FBovespa May 20, 2010
2222
Investor Relations Team:
João Elek – IRO
André Gonçalves – General Manager
Fernanda Naveiro Vaz – Consultant
Anna Laura Linkewitsch – Specialist
Roberto Costa – Specialist
Email: [email protected]