corporate, nri banking services online - axis bank | - fy 2012-13 … · 2016-07-22 · axis bank...
TRANSCRIPT

FY 2012-13
First Quarter Results
Investor Presentation

1
Safe Harbor
Except for the historical information contained herein, statements in this release which
contain words or phrases such as “will”, “aim”, “will likely result”, “would”, “believe”, “may”,
“expect”, “will continue”, “anticipate”, “estimate”, “intend”, “plan”, “contemplate”, “seek to”,
“future”, “objective”, “goal”, “strategy”, “philosophy”, “project”, “should”, “will pursue” and
similar expressions or variations of such expressions may constitute "forward-looking
statements". These forward-looking statements involve a number of risks, uncertainties and
other factors that could cause actual results to differ materially from those suggested by the
forward-looking statements. These risks and uncertainties include, but are not limited to our
ability to successfully implement our strategy, future levels of non-performing loans, our
growth and expansion, the adequacy of our allowance for credit losses, our provisioning
policies, technological changes, investment income, cash flow projections, our exposure to
market risks as well as other risks. Axis Bank Limited undertakes no obligation to update
forward-looking statements to reflect events or circumstances after the date thereof.

2
Q1FY13
Net Profit 22% YOY
Net Interest Income 26% YOY
Fee Income 9% YOY
Operating Revenue 22% YOY
Operating Profit 26% YOY
Net Interest Margin 3.37%
Cost of Funds 6.70%
Performance Highlights

3
16.09
19.93 19.89 20.13 21.22
20.58
Return on Equity (%)
FY08 FY09 FY10
FY11 FY12 Q1FY13
Shareholder Returns
245.14
284.50
395.99
462.77
552.00
585.41
Book Value per Share
1.24
1.44
1.67 1.68 1.68 1.62
Return on Assets (%)(`)
Q1FY12 : `485.98 Q1FY12 : 20.31% Q1FY12 : 1.61%

4
Interpretation of Q1FY13 Performance • Total Assets grew 24% YOY to `2,89,373 crores
• Aggregate Deposits grew 21% YOY to `2,22,631 crores
• Net Advances grew 30% YOY to `1,71,146 crores
• Large and Mid-Corporate segment loans grew 32% YOY to `92,887 crores
• Retail Advances grew 50% YOY to `40,591 crores and constitutes 24% of advances
• Savings Bank Deposits grew 23% YOY to 52,777 crores
• Share of demand deposits in total deposits stood at 39%
• Net NPAs at 0.31% similar to that of June 2011.
• At the end of June 2012, book value per share was `585.41, as compared to `485.98 at
the end of June 2011
• Capital Adequacy ratio (CAR) stood at 13.03% with Tier-I CAR at 9.02% (without
reckoning Q1FY13 profit, as stipulated by Reserve Bank of India). Including Q1FY13
profits, total CAR & Tier-I CAR would have been 13.51% & 9.49% respectively

5
942
1,488
2,892 2,822
1,154
1,813
3,515 3,365
Net Profit Core Oper. Profit Oper. Revenue Core Oper. Revenue
Q1FY12 Q1FY13
Note: Core Operating Revenue and Profit excludes trading gains / losses
Amount ` in Crore
22% YOY 22% YOY 22% YOY 19% YOY
Profitability: Sustained Growth

6
175 228
307 361
330
403
501
582 562 532
656
765 742 735
891
1,020
942 920
1102
1277
1154
Quarter 1 Quarter 2 Quarter 3 Quarter 4
FY08 FY09 FY10 FY11 FY12 FY13
Quarterly Net Profits
Consistent Net Profit Growth
Amounts in ` Crores

7
6.13% 6.19% 6.34% 6.45%
6.70%
3.28%
3.78% 3.75%
3.55% 3.37%
Q1FY12 Q2FY12 Q3FY12 Q4FY12 Q1FY13
Cost of Funds Net Interest Margin
Net Interest Margin and Cost of Funds
NIMs for the last 5 years
FY08 3.47%
FY09 3.33%
FY10 3.75%
FY11 3.65%
FY12 3.59%

8
Growing Net Interest Income
1,724
2,180
Net Interest Income
Q1FY12 Q1FY13
Amount ` in Crore
26% YOY
NII for the last 5 years (` crore)
FY08 2,585
FY09 3,686
FY10 5,004
FY11 6,563
FY12 8,018
CAGR 33%

9
YOY Growth in Daily Average Demand and Term Deposits
Deposit Q1FY13
Savings 22%
Current 7%
Total Demand Deposits 16%
Total Deposits 20%
Growing Demand Deposits
109,183 135,689
74,414
86,942
30th June 2011 30th June 2012
Demand Deposits
Term Deposits
(41%)
(59%) (61%)
17% YOY
24% YOY
Amount ` in Crore
(39%)

10
1,057
1,154
Fees
Q1FY12 Q1FY13
9% YOY
Fees
Amount ` in crore Fees for the last 5 years (` crore)
FY08 1,495
FY09 2,447
FY10 2,925
FY11 3,790
FY12 4,727
CAGR 33%

11
413
210
46
95
16
276
409
238
63
110
12
322
Large & MidCorporate
Credit
Treasury &DCM
Agri & SMEBanking
BusinessBanking
CapitalMarkets
RetailBanking
Q1FY12 Q1FY13
1% YOY 13% YOY 36% YOY 16% YOY 29% YOY 17% YOY
Fee Income Composition
Amount ` in Crore
Note: Previous year‟s figures have been restated pursuant to a realignment of the organisation structure
12
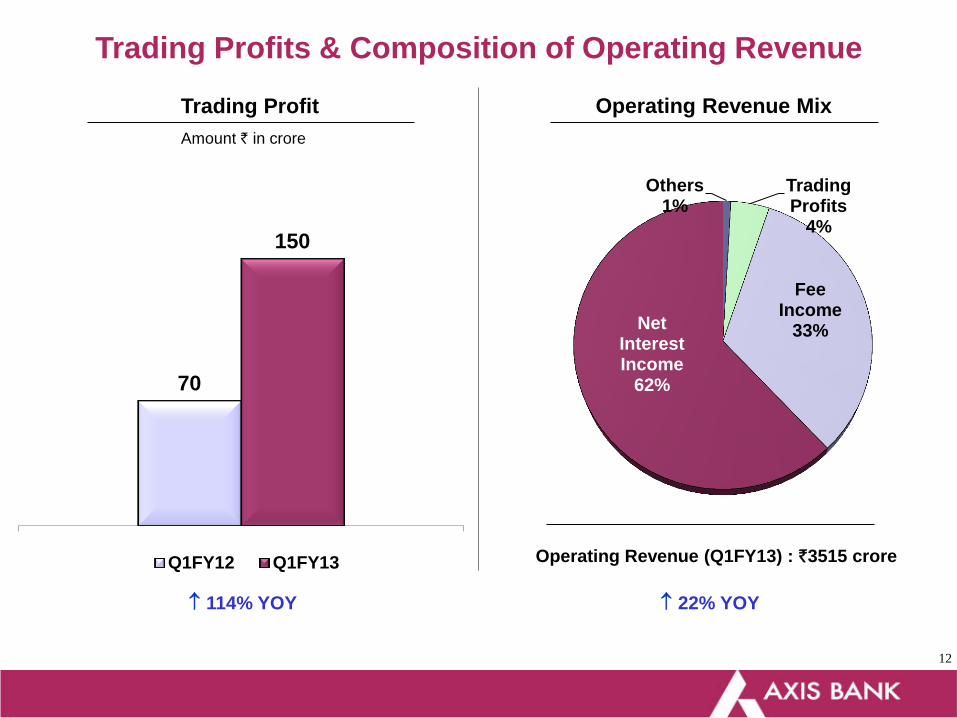
Trading Profits & Composition of Operating Revenue
Amount ` in crore
Trading Profit
70
150
Q1FY12 Q1FY13
114% YOY
Others 1%
Trading Profits
4%
Fee Income
33% Net Interest Income
62%
Operating Revenue Mix
Operating Revenue (Q1FY13) : `3515 crore
22% YOY

13
Stressed Assets and Net NPA (%)
Amount ` crore
1,573
1,744
1,915 1,806
2,092
462 549
683
473 605
0.31% 0.34%
0.39%
0.25%
0.31%
0.15%
0.30%
0.45%
0.60%
0.75%
0.90%
300
600
900
1,200
1,500
1,800
2,100
Q1FY12 Q2FY12 Q3FY12 Q4FY12 Q1FY13
Gross NPAs Net NPAs Net NPA (%)
Cumulative Restructured Assets: `3,827 crore (1.95% of gross
customer assets) as on 30th June 2012
• Assets amounting to `1,231 crore have a 2 years track-
record of repayment
• Adjusting for these assets, restructured assets would
make up 1.32% of gross customer assets
Additions to Restructured Assets during Q1FY13: `628 crore
Net NPAs as at year-end
FY08 0.36%
FY09 0.35%
FY10 0.36%
FY11 0.26%
FY12 0.25%

BUSINESS OVERVIEW

15
2,764 3,595
4,293
6,270
9,924 10,337
ATMs
March 2008 March 2009 March 2010 March 2011 March 2012 June 2012
Network Increasing Reach
405
515
643
921
1,050 1,080
Centres Covered
Branch Demographics (Domestic)
Branches Extn. Counters
Metro 466 6
Urban 500 3
Semi-urban 527 -
Rural 172 -
Total 1,665 9
644 792
983
1,390
1,622 1,674
Branches + Extension Counters*
*Excludes service branches and credit processing centres

16
Large and Mid Corporate Banking
• End to End Player offering bouquet of financial products & solutions ranging
from credit, syndication, cash management, etc. under one roof
• Business Segments
– Large Corporates
– Mid Corporates
– Infrastructure (Relationship led model underpinned by superior
syndication & underwriting skills)
• Focus on building out a superior quality of credit assets with emphasis on
corporates having
– Global competitive advantage in their businesses
– Good corporate governance and management practices
• Rigorous and regular risk assessment of individual accounts
– Rating Tools and Monitoring Tools

17
Distribution of Ratings (Large and Mid Corporate)
64% of corporate advances have rating of at least „A‟ as at June 2012
2% 3% 3% 3% 3%
23% 24% 27% 30% 33%
41% 42%
41% 40%
40%
26% 24% 23% 19% 18%
8% 7% 6% 8% 6%
Jun-11 Sep-11 Dec-11 Mar-12 Jun-12
AAA
AA
A
BBB
<BBB orunrated
18
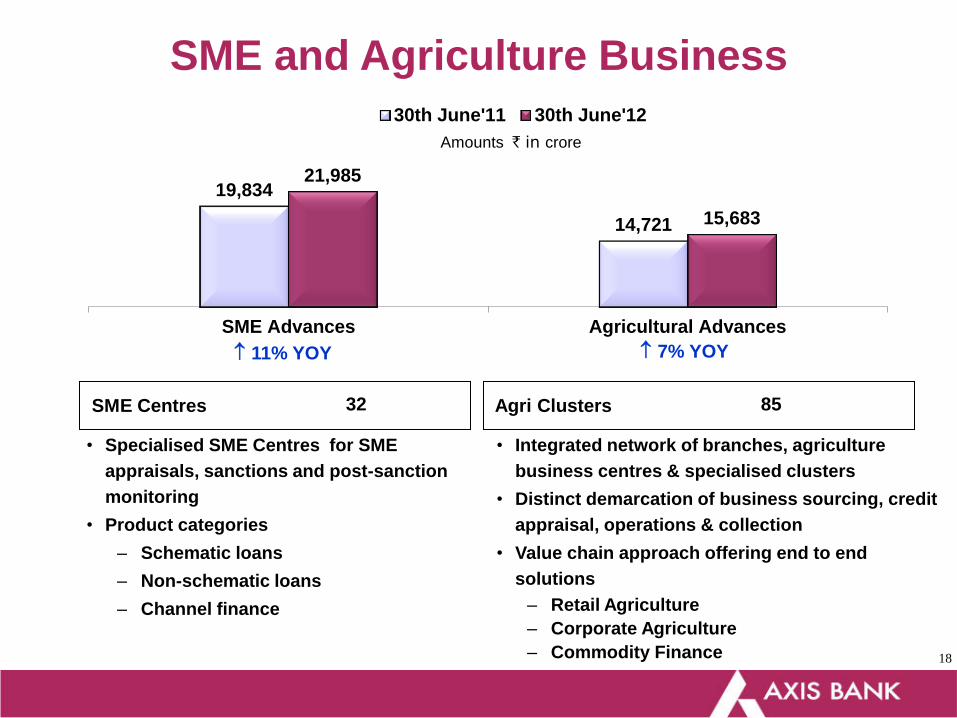
SME and Agriculture Business
11% YOY
• Specialised SME Centres for SME
appraisals, sanctions and post-sanction
monitoring
• Product categories
– Schematic loans
– Non-schematic loans
– Channel finance
• Integrated network of branches, agriculture
business centres & specialised clusters
• Distinct demarcation of business sourcing, credit
appraisal, operations & collection
• Value chain approach offering end to end
solutions
– Retail Agriculture
– Corporate Agriculture
– Commodity Finance
SME Centres 32 Agri Clusters
Amounts ` in crore
19,834
14,721
21,985
15,683
SME Advances Agricultural Advances
30th June'11 30th June'12
7% YOY
85

19
Distribution of Ratings: SME 80% of SME advances have rating of at least „SME3‟ as at June 2012
8% 8% 9% 9% 8%
12% 13% 12% 12% 12%
55% 56% 55% 57% 57%
20% 18% 18% 18% 18%
5% 5% 6% 5% 5%
Jun-11 Sep-11 Dec-11 Mar-12 Jun-12
SME 1
SME 2
SME 3
SME 4
SME 5-8

20
Industry-wise Distribution (Top 10)
Rank Sectors
Outstanding as on 30 June 2012 (%)&
Total Fund-based Non-fund
based
1. Power Generation & Distribution 10.28 5.18 20.13
2. Infrastructure Construction* 9.11 7.86 11.53
3. Financial Companies** 7.41 7.02 8.14
4. Metals & Metal Products 6.54 5.57 8.41
5. Engineering & Electronics 6.12 3.59 10.99
6. Food Processing 4.05 5.12 1.99
7. Trade 3.28 2.95 3.93
8. Shipping, Transportation & Logistics 2.53 2.84 1.95
9. Chemicals & Chemical Products 2.32 1.86 3.22
10. Real Estate 2.12 2.99 0.45
& Percentages stated above are on the total fund and non-fund based outstanding across all loan segments
* Financing of projects (roads, ports, airports etc)
** Includes Housing Finance Companies and other NBFCs

21
Business Banking Cash Management Services & Government Business
8,755
12,366
CMS Accounts
30th Jun'11 30th Jun'12
41% YOY
• Collection of Central Government taxes on
behalf of CBDT and CBEC, including through
e-payments
• Collection of State Government taxes on
behalf of 8 State Governments and UTs
• Collections and payments for Central
Government ministries - Railways, Ministry of
Finance, Urban Development and Housing &
Urban Poverty Alleviation
• Collections under e-governance initiatives of
7 State Governments and UT

22
Business Banking Current Accounts Growth
31,515 34,165
Period End Balance
30-Jun-11 30-Jun-12
• Wide range of products
• Customised offerings for various business segments
• Growth aided by “Club 50” and “Channel One” – high-end
premium products
• Broad-based sales strategy
• Focused approach for Corporates, Institutions and Government
• Over 2.02 lac EDC machines
8% YOY
Amount ` crore
25,793 27,539
Daily Average Balance (Q1)
30-Jun-11 30-Jun-12
7% YOY
Amount ` crore
Current Account Deposits (` crore)
(as on 31st March)
FY08 20,045
FY09 24,822
FY10 32,168
FY11 36,917
FY12 39754
5 Year CAGR 29%

23
Debt Capital Markets
19,143
27,695
Q1FY12 Q1FY13
• A dominant player in placement and syndication of debt issues
• Ranked No.1 Debt Arranger by Bloomberg for six month period June 2012
• Ranked No.1 Debt Arranger by Prime Database for year period ended March 2012
45% YOY
Amount ` crore
Placement & Syndications
(Debentures / Bonds)

24
Retail Deposits
23% YOY 33% YOY
42,899 40,117
52,777
48,886
Period End Balance Daily average balance(Q1)
Savings Deposits
30-Jun-11
30-Jun-12
Amount ` crore
Term deposit portfolio as on 30th June 2012
• Retail TD : `53,452
• Others : `82,237
22% YOY
79,960
106,229
Period End Balance
Savings & Retail Term Deposits
30-Jun-11
30-Jun-12
Amount ` crore
Savings Deposits (` crore)
(as on 31st March)
FY08 19,982
FY09 25,822
FY10 33,862
FY11 40,850
FY12 51,668
5 Year CAGR 34%

25
Third Party Products Business
• Focus on cross-selling to existing
customers
• Third-party products sold include
mutual funds, insurance, on-line
broking, portfolio management
services (non-discretionary) and
gold coins
• Systematic customer
segmentation
54
60
Fee Income
Q1FY12 Q1FY13
12% YOY
Amount ` in crore

26
Retail Assets
27,022
40,591
Portfolio Size
30-Jun-11 30-Jun-12
• Retail Assets grew by 50% YOY
• Retail Assets constitute 24% of the bank‟s total advances, as compared to 20% as at
end June ‟11.
50% YOY
Amount ` in crore
Cards 2%
Non-Schematic
4% Personal
Loans 6%
Auto loans 13%
Housing Loans 75%
Portfolio Composition as
on 30th June 2012

27
Cards, Retail Forex & Remittances Business
• Issuance
– Over 8.24 lac Credit Cards in force
till end June „12
– Travel Currency Cards in 12
currencies -USD, Euro, GBP, AUD,
CAD, SGD, SEK, CHF, JPY, AED,
SAR & INR card (for foreign
nationals & NRIs)
– 1st Indian Bank to launch
Remittance Card and Meal Card
43% YOY
89
128
Fee Income
Q1FY12 Q1FY13
Amount ` in crore

28
• Branches at Singapore, Hong Kong, DIFC - Dubai and Colombo
• Representative offices at Shanghai, Dubai and Abu Dhabi
• Axis U.K. Ltd. incorporated as a subsidiary
• Total assets overseas amounted to US$ 6.15 billion as compared to
US$ 4.85 billion as at end June ‟11, a growth of 27%YOY. Overseas
assets constituted 12% of total assets as at end June 2012.
• Corporate Banking, Trade Finance products, Debt Syndication and
Liability businesses
International Presence

29
Shareholding Pattern as on 30th June 2012
• Share Capital - `414.29 crore
• Net Worth - `23,181.36 crore
• Book Value per share - `585.41
• Market Price as on 16/07/12 - `1,046.30
• Market Cap as on 16/07/12 - `43,347 crore (US $7.84 billion)
SUUTI 23.47%
LIC 9.66%
FIIs 27.27%
Others 39.60%

30
Thank You