corporate networks, value chains, and …content.csbs.utah.edu/~weiy/pdf/wei10ug_computer.pdf ·...
TRANSCRIPT

1118
Urban Geography, 2010, 31, 8, pp. 1118–1140. DOI: 10.2747/0272-3638.31.8.1118Copyright © 2010 by Bellwether Publishing, Ltd. All rights reserved.
1118
CORPORATE NETWORKS, VALUE CHAINS, AND SPATIAL ORGANIZATION: A STUDY OF THE COMPUTER INDUSTRY IN CHINA1
Y. H. Dennis Wei2
Center for Modern Chinese City Studies East China Normal University, Shanghai 200062, China
and Department of Geography and Institute of Public and International Affairs
University of Utah
Jian Li2
Center for Urban and Regional Studies Shanghai Academy of Social Sciences
Shanghai 200020, China
Yuemin NingCenter for Modern Chinese City Studies
East China Normal University Shanghai 200062, China
Abstract: Global economic restructuring and technological change are transforming the map of global production and the global division of labor. Based on the perspectives of global value chains and global production networks, this study analyzes the production networks, value chains, and spatial organization of the computer industry in China. It was found that the notion of a sym-metric, bell-shaped smiling curve is a highly idealized conceptual framework, and for a develop-ing country like China where leading firms have yet to become top-tier transnational corporations, the smiling curve more likely exhibits a flattened saucer shape. China is also increasingly being integrated into global production networks, and a new form of spatial organization, centered on emerging global cities and globalizing cities, is emerging. An investigation of the global–local networks of the computer industry showed that the embeddedness of transnational corporations (TNCs) is heavily influenced by industrial characteristics and geographical/institutional con-texts. [Key words: Global Value Chain, Global Production Network, Embeddedness, Computer Industry, China.]
Since the 1980s, the process of globalization has intensified and the division of labor in countries across the world has been restructured. Production processes have been global-ized, forming transnational or cross-regional production chains and networks, with more
1We would like to acknowledge the funding of the U.S. National Science Foundation (BCS0757615), the TransCoop Program of the Alexander von Humboldt Foundation (3.1-TCVERL-DEU/1131699), the Chinese Ministry of Education (07JJD840185), and the Natural Science Foundation of China (40671060). We are grate-ful for the constructive comments of Minfeng Wang and Wei Xu and the research assistance of Yingru Li and Zhouyang Wang.2Correspondence concerning this article should be addressed to Jian Li, Center for Urban and Regional Studies, Shanghai Academy of Social Sciences, 7-622 Huaihai Zhong Road, Shanghai 200020, China; telephone: 86-13816961062; fax: 86-21-63846062; email: [email protected]; or Y. H. Dennis Wei, Department of Geography, University of Utah, 260 S. Central Campus Drive, Room 270, Salt Lake City, Utah 84112-9155; telephone: 801-585-0545; fax: 801-581-8219; email: [email protected]
THE COMPUTER INDUSTRY IN CHINA 1119
and more countries being incorporated into the global production system (Dicken, 2003). Asia’s newly industrializing economies (NIEs) have been undergoing drastic economic restructuring as well; they are increasingly connected with the global core on one hand and developing countries such as China on the other. This trend has restructured the division of labor vertically and horizontally, and opened up new sources of production growth and economic development. Three closely related, network-based theoretical perspectives and approaches—global value chains (GVCs), global commodity chains (GCCs), and global production networks (GPNs)—have been developed to explain the process of globaliza-tion and changes in global production (Gereffi and Korzeniewicz, 1994; Ernst et al., 1998; Henderson et al., 2002).
Since the late 1970s, China has restructured its development policies from egalitarian-ism and self-reliance toward competitiveness and opening up to the outside world through a threefold transition process of decentralization, marketization, and globalization (Wei, 2007). China is the leading recipient of global capital, with sources ranging from devel-oped countries such as the United States and Japan to such Asian NIEs as Taiwan and South Korea. China has become a global manufacturing platform and a key node in the global production process. Its major cities have also been increasingly incorporated into the global urban hierarchy and networks, led by Shanghai and Beijing. Such changes can best be understood through an analysis of the dynamic information and communication technology (ICT) sector, especially its leading computer industry. In 2006, the ICT sec-tor in China had sales income of 4,750 billion yuan and exports of 364 billion yuan. The computer industry had an operational income of 1,271 billion yuan, accounting for 26.8% of the ICT sector (Ministry of Information Industry, 2007b). China also produced 93.36 million personal computers (PCs; 39.1% of the global total), including 51.99 million note-book computers (Editorial Committee, 2007).
This study, drawing from the perspectives and approaches of GVCs and to a lesser extent, GPNs, analyzes the corporate networks, value chains, and spatial organization of the computer industry in China to discover the networks and spatial relations that connect firms. First, the structure of value chains and the position of the Chinese computer indus-try within the global network are investigated. Second, network relations are examined among firms in the computer sector, specifically, the organizational (horizontal and verti-cal) relations among firms. And third, the spatial organization of production networks is investigated, especially in the Yangtze River Delta (YRD), an emerging global city–region of China.
THEORETICAL ISSUES AND RESEARCH CONTEXT
Globalization, Global Value Chains, and the “Smiling Curve”
The GCC perspective is a network-based, organizational approach to studying the dynamics of global industries, and analyzes the full set of actors (i.e., firms) and relation-ships that are involved in the production and distribution of a particular good or service to understand where, how, and by whom value is created and distributed along a com-modity chain (Bair, 2005). This approach pays special attention to the governance struc-ture, especially of lead firms or chain drivers in an industry, and argues that development requires integration with the producer-driven and buyer-driven commodity chains. Four

1120 WEI ET AL.
dimensions of the commodity chain have been identified: (1) an input–output structure, (2) a territorial context, (3) a governance structure, and (4) an institutional context. The GVC approach overlaps with and builds on the GCC approach, and has a strong emphasis on issues of sector-specific governance (hierarchy, captive, relational, modular, and market) shaped by the internal logics of sectors (Bair, 2005; Gereffi et al., 2005). Borrus (1997) and Ernst (1997) proposed the concept of GPN to represent a cross-border production organization, which includes all sectors and interactions of the value chain, such as R&D, product design, manufacturing, distribution, and services. The Manchester School of GPN scholars has proposed a comprehensive analytical framework that focuses on the organiza-tional and geographical webs of intrafirm, interfirm, and extrafirm networks (Henderson et al., 2002; Hess and Coe, 2006).
Based on the GVC concept and his own experiences, Stan Shih (2005), the founder of Acer, a computer company headquartered in Taiwan, in 1992, proposed a “Smiling Curve” to illustrate value-adding potentials of the different components in the value chain (Fig. 1). He pointed out that in the PC industry, both ends of the value chain command higher added values to the product than the middle part of the value chain because the implementation of IBM’s open PC standards and the rapid development of compatible PCs have signifi-cantly reduced entry barriers in PC manufacturing. If the X-axis represents the value chain (stage of production) and the Y-axis the value added, the resulting curve takes the form of a “smile.” The upward segments of the curve at both ends indicate that value added increases by adopting R&D on one hand and brand service on the other.
More specifically, the global value chain can be classified into four parts that also high-light power relations among them. (1) At the left high end, R&D and design is the leader and origin of technology and industry standards of the computer, with strong monopoly power and trade barriers. (2) The right high end is brand management and marketing,
Fig. 1. The value chain of the computer industry: smiling curve.

THE COMPUTER INDUSTRY IN CHINA 1121
which determines the product reputation and market edge. (3) The middle section includes the manufacturing of core components and general parts; core-component manufacturing still enjoys high profits, whereas the profit of general parts is mainly obtained from scale economies and specialized production rather than technological innovation. (4) At the low end, computer assembly processing and packaging mark the bottom of the value chain, activities that typically are labor intensive with low technological skills, and mainly con-centrated in developing countries.
However, such a symmetric smiling curve is highly generalized, and has not been thor-oughly tested empirically. This study analyzes the extent to which the value distribution of the computer industry fits the smiling curve, and the position of the Chinese computer industry in the global value chain. It is argued that the symmetrical, bell-shaped smiling curve is a highly idealized conceptual framework, and the real pattern is more likely to be asymmetric. Moreover, for a developing country like China, the smiling curve is at an earlier stage of development in which leading firms have yet to occupy monopolistic posi-tions, and therefore the smiling curve is more likely to exhibit a flattened saucer shape.
Globalization, Division of Labor, and Spatial Organization
Changing global production is reshaping the nature of the division of labor and linkages across countries. The theory of the new international division of labor (NIDL) describes the division of labor in the 1980s and is concerned with the transfer of labor-intensive industries to developing countries for cost reduction, while the developed countries focus on capital- and technology-intensive industries. This is characterized as a vertical sys-tem. Since the 1990s, the organizational structure of firms has gone through a process of vertical disintegration because of fierce competition among firms and an increase of subcontracting activity. The division of labor has been reorganized based on value and commodity chains, and is characterized by the integration of functional units of production across spatial units. Under such a new global division of labor (NGDL), high-technology industries have labor-intensive components (e.g., processing and assembly of high-tech products) whereas labor-intensive industries have knowledge- and technology-intensive sectors (e.g., design in the garment industry).
The NGDL has several new features. First, the developed countries maintain their inter-national competitiveness in manufacturing through global production to take advantage of diverse resources across the world, such as cheap labor and land, marketing potential, preferential investment policies, the development of transportation and information tech-nology, and free-trade policies (Dicken, 2003). Second, globalization and technological development have restructured the international division of labor and the competitive-ness of global firms, which increasingly depends on vertical specialization (Ernst, 2006). Through the modular production network, independent manufacturers can produce cus-tomized products for buyers; such a model uses flexible machinery to pool capacity for different customers, forming a division of labor around value chains (Sturgeon, 2002). And third, the traditional manufacturing process as well as management, R&D, sales, and service are integrated into the NGDL and GVCs to create value. The NGDL, therefore, displays multiple characteristics, including the division of labor across industries, prod-ucts, and value-added sectors, which have been studied through the prism GCCs, GVCs, and GPNs.

1122 WEI ET AL.
Globalization and global production have made spatial imprints on cities, and are instrumental to the formation of world cities and globally connected urban networks. The geographic expansion of production across the world requires world cities to serve as command centers to better organize complex global production and varied GCCs, GVCs, and GPNs (Sassen, 2001). World cities, joined by emerging, globalizing cities in devel-oping countries, are control points of global production networks and the international urban hierarchy. Such trends have also been observed in China, where global production is integrating Chinese cities into GCCs and GPNs, and leading cities such as Shanghai and Beijing are being integrated into GPNs (Wei et al., 2006). Tong and Wang (1999) argued that the PC industry has expanded its production networks from the Silicon Valley and Taiwan’s Hsinchu to Dongguan, China. Ning and Li (2006) maintain that, because of modular production, not only labor-intensive industries but also R&D centers have been relocated to China.
Drawing from the perspectives of GVCs and GPNs as well as an analysis of the com-puter industry, it is argued that China is increasingly being integrated into global produc-tion networks, and that a new urban hierarchy based on emerging global cities is also forming in China. Production organizations will be analyzed across the urban hierarchy to identify the key growth centers.
Globalization, Localization, and Glocal Networks
Questions closely related to the discussion above are how firms and regions are inte-grated into GPNs and how GPNs influence their development. As argued in the literature, two intertwined processes are considered instrumental. The first is a TNC’s embedded-ness within a local economy, and the second involves the efforts of firms in developing countries to upgrade their industries and join GPNs through a strategic coupling with the latter.
The nature of GPNs and their influence on regional development depend on institutions and geographic context. Dicken (2003) argued that the embeddedness of GPNs cannot be explained without reference to official or unofficial policies of governments. Hess and Coe (2006) proposed that, for the mobile telecommunications industry, power and embed-dedness play a central role in shaping the organization and spatial structure of GPNs; in addition, technical standards are the key measures to evaluate the abilities of actors to control special nodes, which are based on their cultural and social backgrounds rather than economic rules governing trade costs. Regarding Asian countries, Ernst (2004) argued that industrial upgrading is mainly achieved by integration into GPNs and knowledge flows. Parthasarathy and Aoyama (2006) found that active local entrepreneurship plays an increas-ingly important role in technological upgrading and in the shift from low-skill to high-skill services in Bangalore, and is facilitated by growing institutional depth. This is evidenced by the accumulation of local expertise, increasing local entrepreneurship by addressing specific market niches, and the development of a local technical community, which moves beyond the traditional buyer-driven and producer-driven dichotomy of GCCs.
In the context of China, Depner and Bathelt (2005), in their study of the Shanghai auto-motive industry cluster, revealed how Volkswagen overcame operational problems with different criteria and regulations, unknown systems, and an unfamiliar cultural environ-ment. Liu and Dicken (2006) showed that foreign direct investment (FDI) in the automobile

THE COMPUTER INDUSTRY IN CHINA 1123
industry in China is a type of market-led and embedded investment characterized by joint ventures and follow-up network configurations. They argued that the government of China, through the process of “obligated embeddedness,” in which a TNC is forced to comply with state criteria in order to gain access to resources, has promoted the positive contribu-tion of TNCs to the development of China’s auto industry and local economies. Research-ers have also found significant impacts of government policy on the location of FDI and network configurations (Zhou, 2005; Miao et al., 2007; Wei et al., 2008).
However, the phenomenon of “obligated embeddedness” is a special feature of the automobile and other strategic industries in China, which are heavily regulated by the government. In fact, in the auto industry national political institutions create pressure for local content, which guides production close to end markets (Sturgeon et al., 2008). Thus automotive TNCs have to negotiate with the Chinese government for their production sites and access to the country’s market. Moreover, Shanghai and Beijing, the major production bases of the auto industry, are the most powerful cities in China and provide their local governments with much leverage in bargaining with TNCs and demanding local content. But the computer industry is more open and less regulated by the state. It is argued that the nature of a TNC’s local embeddedness in the computer industry is likely to be quite differ-ent from the auto industry, being much more highly influenced by industrial characteristics and geographic as well as institutional contexts.
RESEARCH CONTEXT AND DATA
Since China’s economic reform in the late 1970s, international computer manufactur-ers have entered the Chinese market because of abundant and cheap labor, a potentially huge marketplace, and preferential investment policies. In the early stage of reform, foreign investors were required to cooperate with Chinese firms, which led to the development of a number of well-established Chinese computer companies. With more extensive reforms in the 1990s, the government released control over FDI in ownership. As a result, FDI in China accelerated and the demand for computers also increased dramatically. In the YRD and PRD, computer industry clusters formed based on locational advantages, local govern-ment policies, and widening industrial bases (Tong and Wang, 1999; Wang and Lee, 2007; Yang and Hsia, 2007). By 2006, foreign-invested enterprises (FIEs) in the computer industry accounted for 80% of sales, 79% of industrial value added, and 80% of all profits in China (Ministry of Information Industry, 2007a).
This study utilized several data sources. First, Intel and 34 computer firms among the top 100 global IT companies in the world were selected as sample firms to analyze smiling curves. According to Business Week (2006), firms must reach certain levels to be included in the top 100. Companies with sales income of less than US$500 million, those whose stock prices fell more than 75%, and/or those who experienced sales declines were excluded from the list. Intel was also excluded because of its monopolistic position in the industry. Nonetheless, Intel was included in this research given its significant role in the computer industry. In the software industry, only the operating system is part of the PC value chain. Because such major products as Microsoft DOS and Windows are the plat-forms and standard components of PCs, Microsoft was also included.
The second data source is the list of the top 100 IT companies in China in 2007 (2006 data) (Ministry of Information Industry, 2007c), which included 15 Chinese computer

1124 WEI ET AL.
companies. There are 7 brand manufacturers, 7 integrated circuit (IC) manufacturers, and 2 peripherals manufacturers. China’s list of the top 100 IT companies was produced through company applications, recommendations of local governments, and a review of the Ministry of Information Industry. SMIC was not on this list although its sale was quali-fied; however, it was included because of its size and significance. Software companies were not included in the list. Our sample of 16 computer firms includes 5 brand manufac-turers (Lenovo, Founder, Tongfang, Unis, and Hedy), 5 IC designers and manufacturers (SMIC, Shenzhen SEG, Shanghai Hongsheng, Huarun, and Huahong), and 2 peripherals manufacturers (BOE and Great Wall Corporation).
Third, in the fall of 2006 and spring of 2007, we conducted a survey of ICT firms in five leading Chinese cities: Shanghai, Beijing, Shenzhen, Suzhou, and Dongguan. The survey used both phone calls and site visits, each lasting up to 90 minutes. Data were generated for more than 1,000 firms, and comprehensively covered the ICT industry in these cities (hereafter the ICT survey). This study draws on selected data on the computer industry from the survey, especially in the case of Suzhou. The latter is home to 157 ICT hardware firms, 33 computer equipment manufacturers, and 20 software firms.
Third, to further understand the computer industry and its operational environments, a dozen interviews were conducted at computer firms. These were conducted in all five cit-ies, with most of the firms located in Suzhou and Shanghai, including such leading players as Quanta Computer. A number of government officials and business associations were also interviewed, mainly in Shanghai and Suzhou, to better understand government poli-cies and external networks of firms.
Li et al. (2007) reported some preliminary findings of smiling curves of the Chinese computer industry by using the first two datasets. This study expands that work by build-ing upon theoretical perspectives of GVCs and GPNs and providing a systematic analysis of the two datasets. It also expands the data and scope of research to global–local net-works and cases of Suzhou as well as Taiwanese investment in China. The ICT survey and interviews of firms and at government agencies also strengthen the empirical basis of the research and provides more supporting evidence for theoretical arguments.
BUSINESS ORGANIZATIONS, VALUE CHAINS, AND SMILING CURVES
Value Chains and Economic Performance
Based on the classification of value chains, the sample firms are divided into five catego-ries (Table 1). Among the 35 selected firms, Microsoft and Intel are in a separate category as technological source and standard-setting firms because of their monopolistic nature. For comparison, the top 5 firms from the rest of the four categories were selected to cal-culate average sales, profits, and sales margins so that each category represents the same number of firms. Table 2 displays the value chain of the computer industry in China.
Comparing Tables 1 and 2, two problems can be identified in the value chains of the computer industry in China. The first is the lack of system designer and R&D of high-end products, and the second is that the division of labor is at a low level. Most brand manu-facturers are FIEs and assemblers. In 2006, average sales and profits of the top 5 in each category of computer firms in China were much smaller than those of the top 5 global firms. For firms in IC design and manufacturing, average sales income and profits were

THE COMPUTER INDUSTRY IN CHINA 1125
6.68 billion yuan and 530 million yuan, respectively, which were 11.3% and 6.5% of the averages of global firms. For firms in brand manufacturing, the average sales income and profits were 37.79 billion yuan and 1.15 billion yuan, respectively, which were 10.5% and 7.7% of the averages of global firms. In general, China’s computer firms are still small in scale and low in profit margins, reflecting the wide computer-industry gap between China and the leading developed countries.
Smiling Curves Based on Sales Profits
In the five categories of computer firms, only those of technological source and stan-dards had average profits above US$10 billion (US$11.07 billion), much greater than the other firm types. Average profits of brand marketing and core-component design and manufacturing reached US$1.94 billion and US$1.08 billion, respectively, while
Table 1. Financial indicators For top 5 Firms oF Each catEgory in thE global computEr industry
CategoryNo. offirms Name of leading firms
Average operational
income ($billions)
Average sales profit ($billions)
Average sales margin
(%)
Technological sources and standards
2 Intel, Microsoft 40.73 11.07 27.2
R&D and manufacturing of core parts
5 AMD, Seagate Technology, Western Digital, TI, and Agilent Technologies
7.64 1.08 14.2
Manufacturing of general parts
5 Lite-On, TPV, NVIDIA, Benedict, and Anixter International
5.93 0.19 3.8
OEM and assembly 5 Honghai, Quanta, Compal, Inventec and Wistron
12.6 0.45 3.4
Brand marketing and management
5 Hewlett-Packard, Dell, Apple, Toshiba, and Acer
45.88 1.94 4.2
Source: Compiled from http://bwnt.businessweek.com/it100/2006/index.asp
Table 2. Financial indicators For top 5 Firms oF Each catEgory in thE computEr industry oF china
CategoryAverage operation income
($billion)a
Average sales profit ($billion)
Average sales margin (%)
IC design & manufacturing 0.86 0.07 7.9
Peripherals manufacturing – – 2.8*
Brand manufacturer 4.84 0.15 3.0
aUS$1 = 7.8 Yuan. Brand manufacturers in China also often produce peripherals.Source: Compiled from http://www.mii.gov.cn/art/2007/06/08/art_3079_31052.html

1126 WEI ET AL.
general-component design and manufacturing as well as OEM and assembly obtained average profits of US$450 million and US$190 million, respectively, which were at the low end of the value chain.
As seen in the smiling curve in Figure 2, the left leg of the curve rises sharply due to the monopoly of Microsoft, Intel, and their Wintel alliance, and the right leg also rises because firms in brand marketing and services have high profits. The smiling curve, however, is asymmetric, showing an upward curve on the left leg, indicating the monopolistic nature and highest profits of technological source and standard setting.
Using a similar coordinate system, the smiling curve of China’s computer industry value chain shows some unique characteristics (Fig. 3). Similarly, the firms of IC design and manufacturing as well as brand manufacturing had higher profits than those in peripherals manufacturing. However, when compared to the global computer industry value chain, the curve is only slightly higher at both ends and much flatter, resembling a saucer, indicating much lower value gaps among firms in the Chinese computer industry.
Fig. 2. The value chain-smiling curve of the global computer industry based on average profits. Source: Compiled from http://bwnt.businessweek.com/it100/2006/index.asp

THE COMPUTER INDUSTRY IN CHINA 1127
Smiling Curves Based on Average Sales Profit Margins
Sales profit margins of the global computer industry value chain also exhibit an asym-metrical smiling curve (Fig. 4). The average sales margins of the firms in technology source and standard setting, as well as core-component design and manufacturing, were 27.2% and 14.2%, respectively, and reflect higher sales profit margins based on a technological
Fig. 3. The value chain-smiling curve of the computer industry in China based on average profits. Source: Compiled from http://www.mii.gov.cn/art/2007/06/08/art_3079_31052.html
Fig. 4. The value chain-smiling curve of the global computer industry based on profit margins. Source: Same as Compiled from http://bwnt.businessweek.com/it100/2006/index.asp

1128 WEI ET AL.
monopoly. Average sales profit margins of firms in brand marketing and management, general-component design and manufacturing, and OEM and assembly were only 4.2%, 3.8%, and 3.4%, respectively.
Similar to the global computer industry value chain, the distribution of sales profit margins in China’s computer industry is also asymmetrical (Fig. 5). Moreover, high-end and low-end firms had much smaller differences in sales profit margins. Average sales profit margins of IC design and manufacturing, brand manufacturing, and peripherals manufacturing firms were 7.9%, 3.0%, and 2.8%, respectively.
SMRC (2007) has analyzed the value structure of a notebook computer (Pentium M740CPU, the second-generation platform of SONOMA, 15.4-inch WXGA monitor, 256 computer motherboard, DDR333 memory, DVD burner drive, 60G5400 hard drive, and genuine preinstalled XP). Its factory cost was about US$900, in which the CPU and soft-ware accounted for, respectively, 23% and 9% of the total cost. Core components such as the monitor, motherboard, and hard drive accounted for 17%, 12%, and 10% of the cost, respectively. The drive, casing, and memory accounted for 6%, 2%, and 3%, respectively, whereas manufacturing and assembly only accounted for 3%. Such a value chain structure provides further evidence of the value distribution shown in Figures 4 and 5.
VALUE CHAINS AND THE GLOBAL DIVISION OF LABOR
Global Value Chains and Power Relations
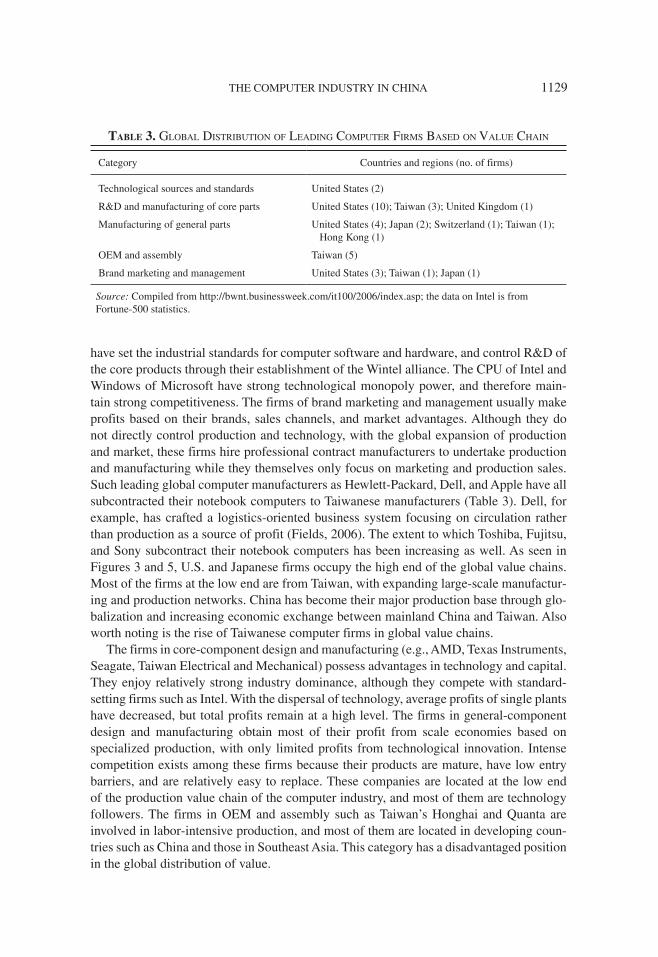
Power relations among firms can also be analyzed using value chains. Intel and Microsoft are exemplar firms in technology source and standard setting (Table 3). They
Fig. 5. The value chain-smiling curve of the computer industry in China based on profit margins. Source: Compiled from http://www.mii.gov.cn/art/2007/06/08/art_3079_31052.html
THE COMPUTER INDUSTRY IN CHINA 1129
have set the industrial standards for computer software and hardware, and control R&D of the core products through their establishment of the Wintel alliance. The CPU of Intel and Windows of Microsoft have strong technological monopoly power, and therefore main-tain strong competitiveness. The firms of brand marketing and management usually make profits based on their brands, sales channels, and market advantages. Although they do not directly control production and technology, with the global expansion of production and market, these firms hire professional contract manufacturers to undertake production and manufacturing while they themselves only focus on marketing and production sales. Such leading global computer manufacturers as Hewlett-Packard, Dell, and Apple have all subcontracted their notebook computers to Taiwanese manufacturers (Table 3). Dell, for example, has crafted a logistics-oriented business system focusing on circulation rather than production as a source of profit (Fields, 2006). The extent to which Toshiba, Fujitsu, and Sony subcontract their notebook computers has been increasing as well. As seen in Figures 3 and 5, U.S. and Japanese firms occupy the high end of the global value chains. Most of the firms at the low end are from Taiwan, with expanding large-scale manufactur-ing and production networks. China has become their major production base through glo-balization and increasing economic exchange between mainland China and Taiwan. Also worth noting is the rise of Taiwanese computer firms in global value chains.
The firms in core-component design and manufacturing (e.g., AMD, Texas Instruments, Seagate, Taiwan Electrical and Mechanical) possess advantages in technology and capital. They enjoy relatively strong industry dominance, although they compete with standard-setting firms such as Intel. With the dispersal of technology, average profits of single plants have decreased, but total profits remain at a high level. The firms in general-component design and manufacturing obtain most of their profit from scale economies based on specialized production, with only limited profits from technological innovation. Intense competition exists among these firms because their products are mature, have low entry barriers, and are relatively easy to replace. These companies are located at the low end of the production value chain of the computer industry, and most of them are technology followers. The firms in OEM and assembly such as Taiwan’s Honghai and Quanta are involved in labor-intensive production, and most of them are located in developing coun-tries such as China and those in Southeast Asia. This category has a disadvantaged position in the global distribution of value.
Table 3. global distribution oF lEading computEr Firms basEd on ValuE chain
Category Countries and regions (no. of firms)
Technological sources and standards United States (2)
R&D and manufacturing of core parts United States (10); Taiwan (3); United Kingdom (1)
Manufacturing of general parts United States (4); Japan (2); Switzerland (1); Taiwan (1); Hong Kong (1)
OEM and assembly Taiwan (5)
Brand marketing and management United States (3); Taiwan (1); Japan (1)
Source: Compiled from http://bwnt.businessweek.com/it100/2006/index.asp; the data on Intel is from Fortune-500 statistics.

1130 WEI ET AL.
A diagram has been constructed to capture the relations and linkages involved in the production network and value chains (Fig. 6). Firms in technology source and standard-setting control the technological standard and production of the other four categories. The central sector involves firms in brand marketing and management (buyers), who provide essential services such as computer styles, internal and external design, and setting require-ments to manufacturers. OEMs, especially large ones, have close connections with brand manufacturers and parts suppliers, and enjoying the advantages of production networks. Firms in core-component design and manufacturing produce for companies engaged in brand marketing and management as well as OEMs. With advantages in capital and technology, these firms occupy an advantageous position in the network. However, with fierce competition arising from the proliferation of technology, their status in the value and power networks has declined. Firms in general-component design and manufacturing usually develop close relations with OEMs and firms in brand marketing and management. It should also be pointed out that power relations among firms change with their develop-ment conditions, as exemplified by the rise of computer manufacturers in Taiwan.
China in the Global Economy: Trade Data
An analysis of trade data can help to identify a country’s position vis-a-vis global pro-duction networks. China’s total imports and exports reached US$1,154.8 billion in 2004, with more than half consisting of exports. The export of high-tech products was valued at US$161.4 billion, accounting for more than one-quarter of total exports, and underscores the significance of such industries in China. An export coefficient, C
i, was calculated to
analyze the status of China’s ICT industry in the global production network: Ci = (X
i – M
i)/
(Xi + M
i), where C
i is the coefficient of product i; X
i represents exports of product i; M
i
represents imports of product i. The closer Ci is to 1, the larger the trade surplus and the
stronger its international competitiveness; the closer Ci is to –1, the smaller the trade sur-
plus and the weaker its international competitiveness.As shown in Table 4, the main export products were personal laptops and cell phones;
their Cis were 0.82 and 0.38, respectively, reflecting a large trade surplus. Core components
Fig. 6. Network linkages of computer firms.

THE COMPUTER INDUSTRY IN CHINA 1131
and computer integrated manufacturing technology became the major import products, and their C
is were –0.7 (imports of US$60.3 billion vs. exports of US$10.7 billion) and
–0.84 (imports of US$17.4 billion vs. exports of US$1.5 billion). In general, China’s ICT industry, including the computer industry, displays a football shaped pattern. The middle portion of manufacturing and assembly is large and enjoys some competitive advantages, while R&D, brand marketing, and information services are quite weak.
Total exports and imports of the ICT sector grew rapidly during the last few years, reaching US$651.7 billion in 2006, with exports of US$364 billion accounting for 37.6% of total exports in China (Ministry of Information Industry, 2007b). Exports are heavily dominated by FIEs, with their share amounting to US$306.3 billion and accounting for 84.1% of exports in the sector. Exports in the computer industry were US$149.8 billion, accounting for 41.2% of ICT exports. Comparing the 2006 data with 2004, major export items increased dramatically, such as portable digital automatic data processing equipment (US$53.1 billion), LCD monitors (US$17.7 billion), drivers (US$10.7 billion), hand-held wireless phone parts (US$ 16.2 billion), and integrated circuits (US$ 23.5 billion). The top five exporting provinces were Guangdong, Jiangsu, Shanghai, Tianjin, and Zhejiang.
GLOBAL NETWORKS, DEVELOPMENT TRAJECTORIES, AND DIVISION OF LABOR
Globalization, Development Trajectories, and Glocal Networks
Since the onset of China’s reform and opening up to the world in the late 1970s, the international computer manufacturing industry has been attracted to China because of its
Table 4. imports and Exports oF thE computEr industry in china, 2004 (us$billion)
GoodsImports
(US$ billion)
Proportion of high-tech
imports(%)
Export(US$
billion)
Proportion of high-tech
export(%)
Ci(%)
1. Computers 28.58 17.7 83.93 50.7 0.49
(a) Automatic data-processing equipment 2.42
1.5 24.43 14.8 0.82
Portable digital automatic data processing equipment (≤10kg)
0.74 0.5 20.78 12.6 0.93
(b) Monitors 0.89 0.5 14.73 8.9 0.89
2. Communication technology 22.14 13.7 52.44 31.7 0.41
Cell phones 9.36 5.8 20.85 12.6 0.38
3. Electronic technology 77.20 47.8 18.44 11.1 – 0.61
(a) Printed circuits 5.07 3.1 3.82 2.3 – 0.14
(b) Integrated circuits 60.30 37.4 10.70 6.5 – 0.70
4. Computer integrated manufacturing technology
17.40 10.8 1.50 0.9 – 0.84
Source: Compiled from http://cys.mofcom.gov.cn/aarticle/m/cv/200501/20050100341301.html

1132 WEI ET AL.
cheap labor, huge markets, and preferential investment policies. Since the early 1990s, FDI in the computer industry has risen dramatically due to market openness, industrial restruc-turing, and rising demand in China. Both high-end and low-end sectors of the industry have gradually moved to China.
Intel is a good example of the expansion of TNCs in China. The firm opened its first office in Beijing in 1985, followed by the establishment of its manufacturing base, R&D center, and regional headquarters. In terms of the value chain, Intel initially built its research laboratories and then established its R&D centers, which were gradu-ally integrated with China’s innovation and education systems. It also upgraded its manufacturing from packaging and testing chips to assembling the Intel Pentium 4 processor; it then established its 300 mm wafer fabrication facility in Dalian with an investment of US$2.5 billion. Other global computer companies have gone through similar development processes. Microsoft established a global technology center in Shanghai while Hewlett-Packard set up its China headquarters in Beijing. IBM estab-lished the China Innovation Center, China Software Development Center, China Systems Center, IBM China Research Institute, and its global purchasing headquarters.
At the early stages of investment when foreign majority control was prohibited in China, TNCs, in order to penetrate the Chinese market and avoid high transaction costs, had to cooperate with local firms, which helped Chinese firms to develop their management, R&D, and production skills. Such an institutional arrangement led to the development of a number of well-known computer companies in China, such as Lenovo, Founder, Qinghua Ziguang, and Digital China. Lenovo achieved rapid growth in R&D, manufacturing, and marketing by purchasing and acquainting itself with IBM’s PC business, and has become the third-largest PC brand in the world.
In the 1980s, with government policy incentives, FDI was heavily concentrated in the cities of Shenzhen, Guangzhou, and Dongguan in Guangdong Province, where FIEs have established close linkages with the global production system. Since the early 1990s with the opening up of Shanghai’s Pudong the focus of FDI has shifted to that metropolis and its surrounding YRD region, especially the national-level development zones offering better infrastructure, government services, and labor conditions for foreign investors. The YRD has become the new center of FDI and computer manufacturing, with the most rapid development occurring in Shanghai, Suzhou, and Hangzhou. However, FIEs in China are still mainly engaged in computer manufacturing and assembly, and the Sino-foreign collaboration is largely one involving low-end production. Foreign firms are increasingly establishing their companies in China in the form of wholly foreign-owned enterprises (WFOEs) with weak local embeddedness. Local governments in China have been more interested in the volume of FDI, paying less attention to the localization of FDI. This has limited further development of home-grown computer firms in China, which tend to be small and mainly provide low-end supplies to foreign firms or meet the demand of Chinese markets. Export rates of Chinese firms are generally low, which in 2006 were 10.6%, 3.4%, 0.6%, and 11.4% for Lenovo, Founder, Inspur, and Tongfang, respectively (Ministry of Information Industry, 2007c). Some firms such as Shanghai Hongsheng and Shenzhen SEG have relatively high export rates, but mainly serve as OEMs for foreign markets.

THE COMPUTER INDUSTRY IN CHINA 1133
Agglomeration and the Spatial Division of Labor
The computer industry is distributed unevenly in China. The coastal region has become the main base of the industry where all the headquarters of the 16 selected Chinese com-puter firms are located, led by Beijing, Shanghai, and Shenzhen (Table 5). Intraregional differences in value chains can be observed. For the seven firms in brand manufacturing, four of them are located in Beijing, followed by the PRD (one each in Shenzhen and Guangzhou) and Jinan. The two firms in peripherals product manufacturing are located in Beijing and Shenzhen. All of the firms in IC design and manufacturing are located in the YRD and PRD, including three in Shanghai, one each in Nantong and Jiangyin, one in Hong Kong, and one in Shenzhen.
Beijing, Shanghai, and Shenzhen have become the leaders of the computer industry in China, representing the three emerging global city regions of Beijing–Tianjin, the YRD, and the PRD. Company headquarters and the firms in brand manufacturing are concentrated in Beijing for easy access to the central government, robust R&D and human resources, and advantages in marketing and information exchange. Shanghai is the city where IC design and manufacturing firms concentrate because of its advantages in human resources as well as access to the international market and the computer industry chain in the YRD. Shenzhen, as a Special Economic Zone, is most closely tied to southern China, Hong Kong, and Taiwan, leading to remarkable achievements in high-tech industry.
In terms of the location of computer manufacturers, the YRD and PRD are the major centers for notebook computer production. Nine of the top 10 Taiwanese notebook com-puter manufacturers are located in Suzhou. Major facilities bases of notebook computer manufacturers—IBM, Great Wall, and Lenovo—are located in Shenzhen. In 2005, 60 million notebook computers were produced globally, with more than half originating in China, including 15 million produced in Songjiang and another 15 million in Suzhou. The relocation of notebook computers from developed countries and Asian NIEs has also attracted suppliers of computer parts and components to China. Leading Taiwanese firms such as Asus, MSI, and Gigabyte Technology have all transferred their production bases to China. Consequently, highly agglomerated clusters have been formed in the YRD (note-book computers) and PRD (desktop computers), which reduced costs as well as produc-tion and delivery time.
Most of the major Chinese computer firms have expanded the geographic reach of their production and value chains. For example, the Great Wall Corporation is headquartered in
Table 5. hEadquartErs location oF china’s lEading computEr Firms basEd on ValuE chain
Category Cities (no. of firms)
Brand manufacturer Beijing (4); Shenzhen (1); Guangzhou (1); Jinan (1)
Peripherals manufacturing Beijing (1); Shenzhen (1)
IC design and manufacturing Shanghai (3); Jiangyin (1); Nantong (1); Shenzhen (1); Hong Kong (1)
All computer firms Beijing (5); Shanghai (3); Shenzhen (3); Guangzhou (1); Hong Kong (1); Jiangyin (1); Jinan (1); Nantong (1)
Source: Compiled from http://www.mii.gov.cn/art/2007/06/08/art_3079_31052.html

1134 WEI ET AL.
Shenzhen, but its operating facilities are located in Beijing, Hong Kong, Changsha, and Huaihua (Fig. 7). BOE Technology Group is also headquartered in Beijing, but has estab-lished its production facilities in Hong Kong, Shaoxing, and Suzhou. These firms have also begun to expand their low-end manufacturing to the central and western cities of China, such as Xian and Chengdu, while keeping their headquarters in coastal cities.
Taiwanese Computer Firms and the Case of Quanta Computer
China has become a leading producer of notebook computers, a field in which Taiwanese firms are a major player. The value chain of notebook computers mainly includes R&D, production, and marketing. Globally, U.S. firms control R&D, the production of key com-ponents, and brand management (Fig. 8). Taiwan was once the major global manufactur-ing base of notebook computers and is known for its OEMs. With the increase of pro-duction costs in Taiwan and the improvement of the investment environment in China, a large number of notebook production lines have been transferred from Taiwan to China. In 2006, the output of Taiwan-based firms accounted for 90.2% of the market share in China. Thus China has replaced Taiwan as the largest notebook computer production base in the world. Indeed, the strategic coupling of industrial regions in China as production platforms
Fig. 7. Headquarters-subsidiary relationships of the top five computer firms in China.

THE COMPUTER INDUSTRY IN CHINA 1135
is coordinated through Asian partners of leading global firms (Yeung, 2008). Production capacity, scale economies and R&D in China have all been improved, although China itself is still weak in R&D and technology development.
Because U.S. firms are mainly engaged in producing core components such as CPUs, Taiwanese firms specialize in producing components such as motherboards, graphics cards, network interface cards and drives as well as designing the shapes and structures of notebook computers. Taiwan is engaged in important stages of R&D, production of key components, and contract manufacturing. Taiwan’s role in the global production network and division of labor can be divided into two levels. Firms in Taiwan accept orders from top-tier TNCs, mostly located in the United States and Japan with their business relation-ships and advanced technology, while their firms in China are engaged in manufacturing and assembly supported by abundant labor (Table 6). These Taiwanese firms are highly agglomerated in the YRD, especially Shanghai and Suzhou (Table 7).
Fig. 8. The global production networks of the computer industry.
Table 6. oEms oF thE lEading notEbook computEr brand manuFacturErs
Brand manufacturers Major Taiwan OEMs
Hewlett-PackardDellLenovo Think Pad SeriesAppleSonyNECToshibaFujitsu SiemensAcer
Quanta, Compal, Wistron, InventecQuanta, Compal, WistronQuanta, WistronQuanta, ASUSQuanta, ASUSQuanta, Arima, FIC, MitacQuanta, Compal, InventecQuanta, UniwillQuanta, Compal, Wistron
Source: Compiled from Shuiqing Muhua Research Center (2007).

1136 WEI ET AL.
The case of Quanta Computer well represents the business organization and network relations of Taiwanese computer firms. It was established in 1988 and began to produce notebook computers on a large scale in 1990. In December 2000, Quanta Computer started to invest in the Shanghai Songjiang Export Processing Zone and has since experienced rapid growth in China. Quanta Shanghai Manufacturing City (QSMC) has been formed, and includes Shanghai Dafeng Computer as the leading company, eight original subsid-iaries, and a number of sister companies, all enjoying large-scale operations and industry agglomeration. In 2005, Quanta Computer had exports of US$11.5 billion and ranked first in exports among the ICT enterprises in Shanghai. Quanta’s notebook computers produced in China accounted for more than 80% of its total production. Its total sales revenues reached US$400 billion in 2005, and it produced 31.8 million notebook computers in 2007. It is an important OEM for Dell, Apple, IBM, HP, Toshiba, and Sony as well as for Chinese firms such as Lenovo and Qinghua Tongfang.
The Case of Suzhou
Suzhou, located about 100 km west of Shanghai, has risen as a hub of the computer and electronics industries and a major producer of notebook computers. It has been trans-formed from a municipality known for the Sunan model—which attributes the develop-ment of Sunan (Southern Jiangsu) to bottom-up, local state-directed township and village enterprises (TVEs)—toward an externally driven high-technology center (Wei, 2004). Since the early 1990s, globalizing Suzhou has been a major growth pole for industrializa-tion and regional development, spearheaded by the China–Singapore Suzhou Industrial Park and facilitated by its proximity to Shanghai and the surrounding YRD. Computer equipment manufacturing in Suzhou is dominated by FIEs, especially Taiwanese firms. Most of the firms were established after 2000 and are WFOEs. Most are small in size, but there is a substantial number of firms that employ more than 1,000 workers. The software sector is less developed, dominated by locally owned private firms; in 2007 more than 80% of them employed fewer than 100 workers.
Table 7. Foundry capacitiEs oF taiwan’s lEading notEbook computEr manuFacturErs in mainland china
Manufacturer: Quanta Compal Wistron Inventec Arima ASUS
Manufacturing base
Shanghai Songjiang
Kunshan Kunshan Shanghai Caohejing
Wujiang Shanghai Nanhui, Suzhou
Foundry capacity (%)
95 90 60 95 90 60
Manufacturer: Uniwill FIC Mitac Twinhead Lantain Jingying
Manufacturing base
Suzhou Suzhou Kunshan Kunshan Kunshan Shenzhen
Foundry capacity (%)
100 100 90 100 90 90
Source: Compiled from http://market.ccidnet.com/pub/ report/show 6140.html

THE COMPUTER INDUSTRY IN CHINA 1137
In terms of global–local relations, Suzhou is largely a satellite district dominated by TNCs and external organizations. As shown in Table 8, most purchases in computer equip-ment manufacturing are from FIEs; R&D and core-component manufacturing are heavily controlled by their parent firms. Even though a high percentage of firms have subcontrac-tual relations with local firms, most production is low-tech, labor-intensive manufacturing. On the other hand, the infusion of FDI into the YRD is making the region a hub of the ICT industry as extensive regional production networks have formed, evidenced by the heavy concentration of production linkages within Suzhou and the YRD (Table 8).
The weak global–local linkages are further evidenced by the survey on the importance of cooperation. Results suggest that an overwhelming percentage of FIEs have no coop-eration with domestic firms or consider such cooperation unnecessary, especially in the most important types of cooperation such as strategic alliance, cooperative R&D, and technology transfer. Such division is even more serious in the software sector. The func-tion of Suzhou as a global manufacturing platform to some degree has inhibited the city’s development of R&D and advanced business services, which indicates that Suzhou needs further development of its endogenous innovative capacities.
CONCLUSION
In the last 20 years, the global computer industry has experienced major restructuring and global redistribution. GPNs and value chains have been spatially separated but func-tionally integrated to fully explore global resources and economies of scale. Various com-ponents of GPNs are located in different places and serve varied functions. This analysis has found that high-end functions such as R&D and brand marketing are mainly located in developed countries, which enjoy competitive advantages in R&D and engineering technology, whereas manufacturing and the low-end of value chains have been transferred to the developing countries to reduce costs. Developed countries have maintained their
Table 8. production nEtworks oF FiEs in thE computEr and ict industry in suzhou
All ICT FIEsComputer equipment
manufacturers
Domestic purchase as % of total purchase 44.4% 36.0%
% purchase of domestic firms 37.7% 37.5%
% of local purchase (within two-hour driving distance) 49.0% 40.5%
% Yangtze River Delta purchase 60.2% 53.4%
Equipment purchase in recent three years: % domestic 30.5% 25.2%
Subcontracting relations
% subcontracting from FIEs 50.6% 47.5%
% subcontracting from the YRD 67.0% 67.5%
% subcontracting to FIEs 41.8% 37.8%
% subcontracting to the YRD 76.9% 81.1%
Source: The ICT survey.

1138 WEI ET AL.
competitive advantages in R&D and brand management. Asian NIEs are located function-ally between developed and developing countries, and act as intermediate links of GPNs.
This study reveals that China has indeed become a global manufacturing platform, emerging as a key center of global manufacturing wherein TNCs have invested heavily in the computer industry. FDI has greatly improved China’s productive capacities, making the country an essential component of GPNs and GVCs. To maintain competitiveness, TNCs have transferred in some high-technology activities as well as establishing regional headquarters and R&D centers in China. This has accelerated upgrading and networking of the computer industry, making interfirm relations in the GPNs more complex. Beijing, the YRD, and the PRD, China’s three emerging global city regions, have become the domi-nant bases of the computer industry in China. Beijing, in particular, has dominated the control functions of the computer industry, while the YRD and PRD are more production oriented.
However, compared to leading TNCs, China’s computer industry is characterized by lack of innovation, inferior core infrastructure, and weak lead firms, which constrains China’s competitiveness. The smiling curves of China’s computer industry are rather saucer-shaped, indicating an early stage of value chain development and the lack of lead-ing global firms in China. Due to weak FIE embeddedness, China’s home-grown computer industry is not well integrated into the high end of GPNs. In short, China’s computer industry remains at the low end of global value chains, which has heightened the country’s commitment to remake itself into a world-class innovator.
REFERENCES
Bair, J., 2005, Global capitalism and commodity chains: Looking back, going forward. Competition & Change, Vol. 9, 153–180.
Borrus, M., 1997, Left of dead: Asian production networks and the revival of U.S. elec-tronics. In B. Naughton, editor, The China Circle. Washington, DC: Brookings Institu-tion Press, 139–163.
Business Week, 2006, The Info Tech 100. Business Week, July 3, 78–86. Retrieved from http://www.businessweek.com/pdfs/2006/0627_ 06it100.pdf
Depner, H. and Bathelt, H., 2005, Exporting the German model: The establishment of a new automobile industry cluster in Shanghai. Economic Geography, Vol. 81, 53–81.
Dicken, P., 2003, Global Shift. London, UK: Sage.Editorial Committee, 2007, China IT Industrial Map. Beijing, China: Social Sciences
Academic Press.Ernst, D., 1997, Partner of the China circle? The East Asian production network of Japa-
nese electronics. In B. Naughton, editor, The China Circle. Washington, DC: Brookings Institution Press, 210–253.
Ernst, D., 2004, Global production networks in East Asia’s electronics industry and upgrad-ing prospects in Malaysia. In S. Yusuf, M. A. Altaf, and K. Nabeshima, editors, Global Production Networking and Technology Change in East Asia. Washington, DC: World Bank, 89–157.
Ernst, D., 2006, Innovation Offshoring: Asia’s Emerging Role in Global Innovation Net-works. Honolulu, HI: East–West Center, Special Reports, No. 10.

THE COMPUTER INDUSTRY IN CHINA 1139
Ernst, D., Ganiatsos, T., and Mytelka, L., 1998, Technological Capabilities and Export Success. London, UK: Routledge.
Fields, G., 2006, Innovation, time and territory: Space and the business organization of Dell Computer. Economic Geography, Vol. 82, 119–146.
Gereffi, G., Humphrey, J., and Sturgeon, T., 2005, The governance of global value chains. Review of International Political Economy, Vol. 12, 78–104.
Gereffi, G. and Korzeniewicz, M., editors, 1994, Commodity Chains and Global Capital-ism. Westport, CT: Greenwood Press.
Henderson, J., Dicken, P., Hess, M., Coe, N., and Yeung, H. W., 2002, Global produc-tion networks and analysis of economic development. Review of International Political Economy, Vol. 9, 436–464.
Hess, M. and Coe, N., 2006, Making connections. Environment and Planning A, Vol. 38, 1205–1227.
Li, J., Ning, Y. M., and Wang, M. F., 2007, A study of global production networks of the computer industry. Dili Xuebao (Acta Geographica Sinica), Vol. 63, 437–448.
Liu, W. D. and Dicken, P., 2006, Transnational corporations and “obligated embedded-ness”: Foreign direct investment in China’s automobile industry. Environment and Planning A, Vol. 38, 1229–1247.
Miao, C. H., Wei, Y. H. D., and Ma, H. T., 2007, Technological learning and innovation in China in the context of globalization. Eurasian Geography and Economics, Vol. 48, 713–732.
Ministry of Information Industry, 2007a, 2006 Bulletin of Economic Operation on Chinese Information Industry. Retrieved May 23, 2008 from http://www.mii.gov.cn/art/2007/03/20/art_942_29463.html
Ministry of Information Industry, 2007b, Statistical Yearbook of the Electronics and Infor-mation Industry in China. Beijing, China: Electronics Industry Press.
Ministry of Information Industry, 2007c, Top 100 IT Companies in China in 2007. Retrieved March 8, 2008 from http://enterprise.drcnet.com.cn/DRCnet.common.web/docviewsummary .aspx?docid=1517229&leafid=1198
Ning, Y. M. and Li, J., 2006, The transformation of Shanghai City’s functions. China Urban Studies (E-Journal), Vol. 1, 1–8.
Parthasarathy, B. and Aoyama, Y., 2006, From software services to R&D services: Local entrepreneurship in the software industry in Bangalore, India. Environment and Plan-ning A, Vol. 38, 1269–1285.
Sassen, S., 2001, The Global City. Princeton, NJ: Princeton University Press.Shih, S., 2005, The Century Transformation of Acer. Peking, China: Zhongxin Press.Shuiqing Muhua Research Center (SMRC), 2007, The 2007 Report on the Computer
Industry in China. Beijing, China.Sturgeon, T., 2002, Modular production networks: A new American model of industrial
organization. Industrial and Corporate Change, Vol. 11, 451–496.Sturgeon, T., Van Biesebroeck, J., and Gereffi, G., 2008, Value chains, networks and clus-
ters: Reframing the global automotive industry. Journal of Economic Geography, Vol. 8, 297–321.
Tong, X. and Wang, J. C., 1999, Perspectives on the global production networks of the IT industry in Dongguan. Science and Technology Review, Vol. 16, 14–16.

1140 WEI ET AL.
Wang, J. H. and Lee, C. K., 2007, Global production networks and local institution build-ing: The development of the information-technology industry in Suzhou, China. Envi-ronment and Planning A, Vol. 39, 1873–1888.
Wei, Y. H. D., 2004, Trajectories of ownership transformation in China: Implications for uneven regional development. Eurasian Geography and Economics, Vol. 45, 90–113.
Wei, Y. H. D., 2007, Regional development in China: Transitional institutions, embedded globalization, and hybrid economies. Eurasian Geography and Economics, Vol. 48, 16–36.
Wei, Y. H. D., Leung, C. K., and Luo, J., 2006, Globalizing Shanghai: Foreign investment and urban restructuring. Habitat International, Vol. 30, 231–244.
Wei, Y. H. D., Li, W. M., Leung, C. K., and Pan, R., 2008, Institutions, location, and net-work of multinational enterprises in China: A case study of Hangzhou. Urban Geogra-phy, Vol. 29, 639–661.
Yang, Y. R. and Hsia, C. J., 2007, Spatial clustering and organizational dynamics of transborder production networks: A case study of Taiwanese information-technology companies in the Greater Suzhou Area, China. Environment and Planning A, Vol. 39, 1346–1363.
Yeung, H. W., 2008, Observations on China’s dynamic industrial sector. Eurasian Geog-raphy and Economics, Vol. 49, 509–522.
Zhou, Y., 2005, The making of an innovative region from a centrally planned economy: Institutional evolution in Zhongguancun Science Park in Beijing. Environment and Planning A, Vol. 37, 1113–1134.