corporate guide - singapore, april 2014
TRANSCRIPT

1
S i n g a p o r e C o r p o r a t e G u i d e Apr i l 2014
2600
2800
3000
3200
3400
3600
Mar Apr May Jun Jul Aug Sep Oct Nov Dec Jan Feb Mar
From 1/3/2013 to 31/3/2014
Market Outlook & Strategy FSSTI REVIEW: The FSSTI continued its fine run in March, rising 2.5% mom after rebounding 2.8% mom in February. Sentiment was helped by the Fed’s clarification that despite improvements in the economy, the Fed intends to keep monetary policy accommodative while inflation is below the Fed’s long-term objective, and unemployment remains high. On the local front, M&A remains a focus with Temasek making a cash offer for Olam. With this together with the perception of improving global economic growth, commodity stocks such as Noble and plantation stocks outperformed the broader market.
STRATEGY: We have a year-end target of 3,400 for FSSTI and given the upside of only 7%, we would only buy selectively. In terms of valuation, the market’s FY14F PE of 14.2x is trading at a 12% discount to its long-term mean of 16.2x. Investment themes for outperformance include: a) management changes, b) winners/losers of tapering, c) asset monetisation/M&A, and d) stocks with pricing power. Our top picks in the big cap space include SingTel, DBS, CCT, Venture and Keppel Corp. In the mid cap space, we like Sino Grandness, Osim, Pacific Radiance, Nam Cheong, RH Petrogas, Bumitama and Overseas Education. We have SELLs on Tiger Airways and Genting Singapore.
* Refers to business prospects & earnings growth of the sector for the next 12 months.
SECTOR RATINGS & STOCK RECOMMENDATIONS Sector Mar/Feb (% Chg) Weighting* Top Buys
Aviation 1.6 Market Weight SIA Finance 0.6 Overweight DBS Healthcare (1.2) Market Weight Raffles Medical LandTransport 1.9 Market Weight ComfortDelgro Media 1.2 Market Weight - OilServices (0.6) Overweight Pacific Radiance, Nam Cheong Plantation 2.0 Overweight Bumitama, First Resources Property 3.3 Overweight Keppel Land, Ho Bee REITs 1.1 Market Weight CCT, Suntec REIT Shipping 4.7 Overweight NOL Shipyard 1.4 Market Weight Keppel Corp, Yangzijiang Supply Chain 18.9 Market Weight - Technology (1.2) Overweight Venture Telecoms 1.3 Overweight SingTel, M1 Others 0.1 - -
FSSTI 2.5
(S$) Feb Mar % Chg (S$) Feb Mar % Chg
Olam 1.775 2.22 25.1 Shang Asia 2k 13.50 12.00 (11.1) Sinarmas 0.48 0.57 18.8 SIIC Env 0.184 0.172 (6.5) Fragrance 0.22 0.255 15.9 GLP 2.83 2.65 (6.4) Jardine C&C 39.24 45.33 15.5 SuperGroup 3.69 3.48 (5.7) Noble Grp 1.03 1.185 15.0 Yangzijiang 1.135 1.08 (4.8) UE 1.82 2.07 13.7 Yanlord 1.12 1.07 (4.5) DTAC 200 3.10 3.50 12.9 Biosensors 0.975 0.935 (4.1) IndoAgri 0.87 0.975 12.1 EzionHldg 2.25 2.16 (4.0) JMH 400 58.10 63.08 8.6 St Trdg 3.50 3.38 (3.4) THBEV 0.56 0.605 8.0 Kep REIT 1.175 1.14 (3.0) * Top 100 companies by market capitalisation
TOP GAINERS & LOSERS*
Refer to last page for important disclosures.

2
S i n g a p o r e C o r p o r a t e G u i d e Apr i l 2014
Sector Performance
Net Cash Total ------------------- PE ------------------- ------------- EPS Growth ------------ Net --------- Yield --------- Price/ (Debt) to Market Market 2013 2014F 2015F 2013 2014F 2015F Margin ROA ROE 2013 2014F NTA ps Equity Cap. Cap. (x) (x) (x) (%) (%) (%) (%) (%) (%) (%) (%) (x) (%) (%) (S$m)
AVIATION 27.0 22.9 20.4 (11.7) 18.0 12.0 5.4 3.9 7.6 3.3 3.6 2.0 28.6 7.4 33,683
FINANCE 11.8 11.4 10.2 (10.4) 2.9 12.2 n.a. 1.0 12.1 3.6 3.6 1.6 n.a. 25.7 116,997
HEALTHCARE 40.2 37.1 29.2 (19.2) 8.2 26.8 11.1 3.1 4.6 0.7 0.2 4.5 (8.5) 3.0 13,496
LAND TRANSPORT 17.3 16.0 14.3 (0.4) 8.3 11.7 7.1 5.0 19.4 3.1 3.3 2.6 (16.3) 1.3 5,778
MEDIA 15.8 22.6 22.6 (25.1) (31.2) 0.0 34.8 7.3 11.9 9.5 4.4 2.1 (27.6) 1.5 6,791
OIL SERVICES 9.9 9.6 8.0 13.6 (9.7) 21.3 8.9 4.3 11.6 2.3 1.6 1.1 (82.8) 1.0 4,367
PLANTATION 14.9 10.5 9.4 (7.4) 41.7 11.9 3.6 3.1 7.5 2.0 2.0 1.3 (66.7) 8.2 37,490
PROPERTY 10.2 15.4 13.1 14.8 (34.9) 17.7 31.7 3.9 8.4 3.2 2.5 0.8 (42.0) 8.0 36,475
REITS 17.8 17.6 16.7 13.7 (0.8) 4.4 54.7 3.5 5.7 6.2 6.4 1.0 (49.1) 8.4 38,119
SHIPPING n.a. 20.7 8.0 n.a. n.a. 157.8 (0.9) (0.9) (3.6) 0.0 0.8 1.1 (187.0) 0.6 2,579
SHIPYARD 11.3 11.7 10.9 (10.8) (3.7) 6.9 11.1 5.9 18.1 3.5 3.8 2.0 (12.3) 9.6 43,791
SUPPLY CHAIN 21.1 15.1 14.0 (32.4) 40.3 8.4 0.5 1.7 7.2 1.3 2.0 1.7 (153.1) 2.9 13,314
TECHNOLOGY 15.6 14.0 12.6 (6.3) 12.1 10.5 5.6 5.4 7.2 6.7 6.7 1.8 12.5 0.5 2,052
TELECOMS 16.4 15.5 13.9 4.1 5.8 11.6 18.7 9.4 16.7 4.8 4.9 5.8 (33.4) 15.1 68,646
OTHERS 17.9 21.5 21.2 25.5 (16.3) 1.2 26.5 4.3 8.3 3.0 2.8 2.1 (11.3) 7.0 31,865
OVERALL 14.5 14.2 12.7 (3.4) 1.1 11.4 9.1 2.1 10.1 3.7 3.6 1.7 (28.8) 100.0 455,443

3
S i n g a p o r e C o r p o r a t e G u i d e Apr i l 2014
Corporate Statistics Avg Daily Price Last Net Profit EPS PE DPS Yield Hist Net No of Market Book Price/ Net Cash/(Debt) to 52-Wk Price Turnover Company Ticker Rec 31/3/14 Year 2013 2014F 2015F 2013 2014F 2015F 2013 2014F 2015F 2013 2014F 2013 2014F CFPS Margin ROA ROE Shares Cap. NTA ps NTA ps Mkt Cap Equity High Low 52-Wk (S$) End (S$m) (S$m) (S$m) (cents) (cents) (cents) (x) (x) (x) (cents) (cents) (%) (%) (S$) (%) (%) (%) (m) (S$m) (S$) (x) (%) (%) (S$) (S$) ('000)
AVIATION S I A SIA SP BUY 10.47 3/13 390.3 423.3 533.0 32.5 35.3 44.4 32.2 29.7 23.6 19.5 26.0 1.9 2.5 1.66 2.5 1.7 2.9 1,199.9 12,562.4 10.94 1.0 32.6 30.7 11.45 9.41 957 SIA Engg SIE SP SELL 4.84 3/13 266.4 283.4 294.6 23.9 25.4 26.4 20.3 19.0 18.3 21.5 23.0 4.4 4.8 0.28 23.6 16.7 21.1 1,115.2 5,397.4 1.11 4.4 8.2 34.4 5.32 4.59 335 SATS SATS SP HOLD 3.04 3/13 188.5 203.5 223.2 16.8 18.1 19.9 18.1 16.8 15.3 15.0 16.0 4.9 5.3 0.25 10.2 9.0 12.7 1,124.1 3,417.1 1.06 2.9 7.1 17.6 3.53 2.93 1,432 ST Engrg STE SP HOLD 3.82 12/13 580.8 603.4 623.4 18.7 19.4 20.0 20.4 19.7 19.1 15.0 14.7 3.9 3.8 0.23 8.8 6.9 29.0 3,117.0 11,906.8 0.48 8.0 4.8 27.3 4.56 3.56 2,351 Tigerair TGR SP SELL 0.405 3/13 (180.5) (40.9) (25.0) (18.3) (4.1) (2.5) n.a. n.a. n.a. 0.0 0.0 0.0 0.0 (0.10) (5.2) (4.3) (20.3) 986.4 399.5 0.17 2.4 (30.5) (73.4) 0.74 0.39 1,016 Sector 1,245.7 1,472.6 1,649.1 16.6 19.5 21.9 27.0 22.9 20.4 3.3 3.6 5.4 3.9 7.6 33,683.3 2.0 15.5 28.6
FINANCE ARA ARA SP HOLD 1.845 12/13 74.3 83.7 111.3 8.8 9.9 13.2 21.0 18.6 14.0 5.0 5.0 2.7 2.7 0.09 n.a. 23.3 28.5 845.2 1,559.3 0.33 5.6 n.a. n.a. 1.975 1.56 539 DBS DBS SP BUY 16.17 12/13 3,672.0 3,725.6 4,375.2 150.0 151.1 177.6 10.8 10.7 9.1 58.0 58.0 3.6 3.6 n.a. n.a. 1.0 11.3 2,450.6 39,626.9 11.65 1.4 n.a. n.a. 17.9 15.18 4,086 HL Fin @ HLF SP NR 2.74 12/13 70.1 81.0 93.0 15.9 18.3 21.0 17.3 15.0 13.1 12.0 12.0 4.4 4.4 n.a. n.a. 0.6 4.3 442.9 1,213.7 3.72 0.7 n.a. n.a. 2.82 2.47 57 O C B C OCBC SP BUY 9.51 12/13 2,768.0 3,022.0 3,290.9 78.0 84.2 92.1 12.2 11.3 10.3 34.0 34.0 3.6 3.6 n.a. n.a. 0.9 11.9 3,441.2 32,725.6 6.05 1.6 n.a. n.a. 11.2 9.05 3,970 S'pore Exchange SGX SP NR 6.94 6/13 335.9 340.9 379.9 31.4 31.8 35.4 22.1 21.8 19.6 28.0 29.2 4.0 4.2 0.34 47.0 19.1 39.0 1,071.6 7,437.2 0.65 10.7 9.4 87.1 7.85 6.66 1,610 U O B @ UOB SP NR 21.65 12/13 3,008.0 2,987.3 3,241.1 184.0 187.8 203.8 11.8 11.5 10.6 75.0 74.6 3.5 3.4 n.a. n.a. 1.1 12.8 1,590.5 34,434.2 12.73 1.7 n.a. n.a. 22.1 19.3 2,127 Sector 9,928.2 10,240.6 11,491.4 101.2 104.2 116.9 11.8 11.4 10.2 3.6 3.6 n.a. 1.0 12.1 116,996.9 1.6 n.a. n.a.
HEALTHCARE IHH IHH SP HOLD 1.44 12/13 250.7 289.6 374.0 3.1 3.6 4.6 46.6 40.4 31.3 0.8 0.0 0.5 0.0 0.06 9.3 2.4 3.6 8,135.2 11,714.7 0.31 4.6 (7.6) (12.8) 1.8 1.34 308 Raffles Medical RFMD SP BUY 3.21 12/13 84.9 74.5 87.7 15.4 13.4 15.8 20.8 23.9 20.3 5.0 5.0 1.6 1.6 0.17 24.9 15.9 19.7 554.8 1,780.9 0.85 3.8 14.7 55.3 3.54 2.86 357 Sector 335.6 364.2 461.7 3.9 4.2 5.3 40.2 37.1 29.2 0.7 0.2 11.1 3.1 4.6 13,495.7 4.5 (4.7) (8.5)
LAND TRANSPORT ComfortDelGro CD SP BUY 1.985 12/13 263.2 281.2 298.0 12.4 13.2 14.0 16.0 15.0 14.2 7.0 7.1 3.5 3.6 0.28 7.0 5.3 26.2 2,129.1 4,226.3 0.69 2.9 0.5 1.1 2.21 1.7 5,621 SMRT MRT SP HOLD 1.02 3/13 70.0 80.7 106.3 4.6 5.3 7.0 22.2 19.2 14.6 2.1 2.4 2.0 2.3 0.15 7.4 4.2 10.7 1,521.5 1,551.9 0.51 2.0 (32.3) (63.7) 1.55 1.01 1,288 Sector 333.2 361.9 404.2 9.2 9.9 11.1 17.3 16.0 14.3 3.1 3.3 7.1 5.0 19.4 5,778.2 2.6 (8.3) (16.3)
MEDIA S P H SPH SP HOLD 4.20 8/13 431.0 300.0 300.0 27.0 18.6 18.6 15.6 22.6 22.6 40.0 18.6 9.5 4.4 0.31 34.8 7.3 11.9 1,616.9 6,791.2 1.99 2.1 (13.8) (27.6) 4.68 3.91 3,773 Sector 431.0 300.0 300.0 27.0 18.6 18.6 15.8 22.6 22.6 9.5 4.4 34.8 7.3 11.9 6,791.2 2.1 (13.8) (27.6)
OIL SERVICES ASL Marine @ ASL SP NR 0.70 6/13 45.3 34.5 34.2 10.8 8.2 8.1 6.5 8.6 8.6 2.0 2.0 2.9 2.9 0.20 9.7 4.6 12.0 422.0 295.4 0.92 0.8 (134.9) (97.4) 0.75 0.59 184 Ezra EZRA SP HOLD 1.09 8/13 66.7 44.0 79.7 6.9 4.5 7.9 15.9 24.4 13.8 0.5 0.5 0.5 0.5 0.15 4.3 1.9 5.4 977.896 1,065.9 0.95 1.1 (139.3) (120.4) 1.51 0.82 7,176 Marco Polo @ MPM SP NR 0.385 9/13 22.3 17.7 23.6 6.6 5.2 6.9 5.9 7.4 5.6 1.4 1.2 3.6 3.1 0.11 23.9 7.2 14.7 340.8 131.2 0.46 0.8 (109.0) (88.4) 0.44 0.34 301 Mencast @ MCAST SP NR 0.585 12/13 15.7 19.6 23.7 5.4 6.6 8.0 10.8 8.9 7.3 3.0 2.6 5.1 4.4 0.08 15.8 6.4 16.3 296.1 173.2 0.20 2.9 (60.5) (100.6) 0.605 0.47 131 Mermaid @ MMT SP NR 0.45 9/13 19.6 65.9 70.0 2.5 4.7 5.0 18.3 9.7 9.1 1.1 0.6 2.4 1.3 0.07 5.8 2.5 3.5 1,413.1 635.9 0.47 1.0 8.9 8.3 0.55 0.27 3,011 Nam Cheong NCL SP BUY 0.335 12/13 81.7 88.6 109.0 3.9 4.2 5.2 8.6 8.0 6.5 1.0 1.1 3.0 3.3 0.04 16.4 12.0 27.3 2,103.144 704.6 0.17 1.9 (26.8) (52.1) 0.35 0.24 6,763 Pacific Radiance PACRA SP BUY 1.055 12/13 71.0 78.1 93.1 12.3 10.8 12.8 8.6 9.8 8.2 2.0 2.0 1.9 1.9 0.14 33.7 8.7 19.6 725.755 765.7 0.65 1.6 (37.6) (60.7) 1.09 0.84 1,914 Swiber SWIB SP HOLD 0.665 12/13 77.7 74.2 75.5 12.8 11.3 11.5 5.2 5.9 5.8 3.0 0.0 4.5 0.0 0.21 5.9 3.2 13.9 611.4 406.6 1.00 0.7 (207.9) (138.9) 0.81 0.59 3,232 Triyards ETL SP BUY 0.64 8/13 39.1 30.8 37.8 14.6 10.4 12.8 4.4 6.1 5.0 2.0 0.0 3.1 0.0 0.17 11.4 10.3 24.9 295.009 188.8 0.63 1.0 (55.6) (53.8) 0.82 0.60 218 Sector 439.1 453.2 546.5 6.8 6.1 7.4 9.9 9.6 8.0 2.3 1.6 8.9 4.3 11.6 4,367.2 1.1 (80.2) (82.8)

4
S i n g a p o r e C o r p o r a t e G u i d e Apr i l 2014
Corporate Statistics Avg Daily Price Last Net Profit EPS PE DPS Yield Hist Net No of Market Book Price/ Net Cash/(Debt) to 52-Wk Price Turnover Company Ticker Rec 31/3/14 Year 2013 2014F 2015F 2013 2014F 2015F 2013 2014F 2015F 2013 2014F 2013 2014F CFPS Margin ROA ROE Shares Cap. NTA ps NTA ps Mkt Cap Equity High Low 52-Wk (S$) End (S$m) (S$m) (S$m) (cents) (cents) (cents) (x) (x) (x) (cents) (cents) (%) (%) (S$) (%) (%) (%) (m) (S$m) (S$) (x) (%) (%) (S$) (S$) ('000)
PLANTATION Bumitama BAL SP BUY 1.04 12/13 102.5 135.6 147.8 5.8 7.7 8.4 17.8 13.5 12.4 1.2 1.8 1.2 1.7 0.07 21.1 8.7 17.2 1,757.5 1,827.8 0.32 3.2 (20.8) (65.0) 1.09 0.885 706 FirstRes FR SP BUY 2.34 12/13 298.0 275.4 299.6 18.8 17.4 18.9 12.4 13.5 12.4 4.5 5.2 1.9 2.2 0.21 38.0 12.9 22.9 1,584.1 3,706.7 0.71 3.3 (7.4) (21.9) 2.5 1.645 2,206 GoldenAgri GGR SP BUY 0.575 12/13 389.4 518.1 572.7 3.0 4.0 4.5 19.0 14.2 12.9 1.1 0.4 1.9 0.7 0.04 4.7 2.3 3.6 12,837.6 7,381.6 0.85 0.7 (38.6) (25.8) 0.615 0.495 46,533 IndoAgri IFAR SP HOLD 0.975 12/13 65.9 92.9 110.2 4.6 6.4 7.6 21.1 15.2 12.8 0.1 0.1 0.1 0.1 0.11 4.1 1.6 4.2 1,447.8 1,411.6 0.77 1.3 (36.7) (35.6) 1.23 0.72 1,923 KencanaAgri KAGR SP HOLD 0.22 12/13 (13.4) 32.8 41.7 (1.2) 2.9 3.6 n.a. 7.7 6.1 0.3 1.5 1.1 6.9 (0.00) (3.8) (2.1) (5.5) 1,148.0 252.6 0.18 1.2 (97.7) (118.1) 0.325 0.215 153 Mewah MII SP SELL 0.50 12/13 26.2 42.2 57.5 1.7 2.8 3.8 28.8 17.9 13.1 0.9 0.7 1.7 1.4 0.03 0.7 1.8 3.7 1,507.1 753.5 0.47 1.1 (33.9) (36.0) 0.53 0.41 880 Wilmar WIL SP BUY 3.46 12/13 1,650.0 2,473.8 2,767.7 25.8 38.6 43.2 13.4 9.0 8.0 8.0 8.7 2.3 2.5 0.38 3.0 3.0 9.0 6,403.4 22,155.8 2.09 1.7 (82.4) (96.4) 3.65 3.02 7,055 Sector 2,518.6 3,570.7 3,997.2 9.4 13.4 15.0 14.9 10.5 9.4 2.0 2.0 3.6 3.1 7.5 37,489.6 1.3 (60.8) (66.7) PROPERTY CapitaLand CAPL SP BUY 2.89 12/13 849.8 724.6 816.4 20.0 17.0 19.1 14.5 17.0 15.1 8.0 8.0 2.8 2.8 0.21 21.4 2.3 5.5 4,272.0 12,346.0 3.67 0.8 (53.8) (41.3) 3.84 2.68 10,092 City Devt CIT SP BUY 10.10 12/13 670.1 683.9 778.7 73.7 73.8 84.2 13.7 13.7 12.0 16.0 16.0 1.6 1.6 0.93 21.6 4.2 9.0 909.3 9,183.9 8.63 1.2 (21.3) (24.9) 11.7 8.6 933 GuocoLand GUOL SP HOLD 2.19 6/13 40.5 69.2 206.1 3.6 5.9 17.4 61.3 37.4 12.6 5.0 5.0 2.3 2.3 0.04 6.0 0.5 1.7 1,183.4 2,591.6 2.12 1.0 (162.2) (167.6) 2.34 1.915 110 Ho Bee Land HOBEE SP BUY 2.18 12/13 591.8 82.9 88.2 87.4 11.8 12.5 2.5 18.5 17.4 8.0 3.0 3.7 1.4 0.88 424.7 21.8 28.7 703.3 1,533.3 3.48 0.6 (23.0) (15.1) 2.23 1.895 373 Keppel Land KPLD SP BUY 3.36 12/13 885.9 433.9 499.7 57.3 28.1 32.3 5.9 12.0 10.4 12.0 13.0 3.6 3.9 0.58 60.6 7.0 13.5 1,545.9 5,194.3 4.52 0.7 (55.2) (41.0) 4.20 3.07 2,648 OUE OUE SP BUY 2.24 12/13 (36.6) 75.5 85.4 (4.0) 7.7 8.7 n.a. 29.1 25.8 23.0 4.0 10.3 1.8 (0.02) (8.4) (0.6) (1.2) 981.6 2,198.8 3.13 0.7 (91.5) (69.6) 3.01 2.17 1,101 Wheelock WP SP BUY 1.65 12/13 40.0 105.2 142.1 3.4 8.8 11.9 49.3 18.8 13.9 6.0 6.0 3.6 3.6 0.03 34.2 1.1 1.3 1,196.6 1,974.3 2.51 0.7 (8.8) (5.8) 1.98 1.52 181 Wing Tai WINGT SP BUY 1.83 6/13 531.1 189.7 165.4 67.8 23.9 20.8 2.7 7.7 8.8 12.0 6.0 6.6 3.3 0.68 39.9 11.8 20.9 793.9 1,452.9 3.53 0.5 (32.8) (17.0) 2.39 1.67 727 Sector 3,572.6 2,364.9 2,782.0 31.3 20.4 24.0 10.2 15.4 13.1 3.2 2.5 31.7 3.9 8.4 36,475.1 0.8 (51.2) (42.0) SHIPPING N O L NOL SP BUY 0.995 12/13 (95.4) 124.6 321.3 (3.7) 4.8 12.4 n.a. 20.7 8.0 0.0 0.8 0.0 0.8 0.12 (0.9) (0.9) (3.6) 2,591.8 2,578.8 0.92 1.1 (190.3) (187.0) 1.19 0.94 3,133 Sector (95.4) 124.6 321.3 (3.7) 4.8 12.4 n.a. 20.7 8.0 0.0 0.8 (0.9) (0.9) (3.6) 2,578.8 1.1 (190.3) (187.0) SHIPYARD COSCO Corp COS SP HOLD 0.715 12/13 30.6 63.0 93.0 1.4 2.8 4.2 52.2 25.4 17.2 1.0 2.0 1.4 2.8 0.10 0.9 0.4 2.3 2,239.2 1,601.1 0.59 1.2 (109.6) (131.3) 0.915 0.665 1,880 Keppel Corp KEP SP BUY 10.89 12/13 1,845.8 1,725.0 1,790.0 102.3 95.0 98.6 10.6 11.5 11.0 40.0 47.8 3.7 4.4 1.16 14.9 6.2 19.5 1,815.312 19,768.7 5.32 2.0 (7.8) (15.8) 11.38 10.01 3,752 Sembcorp Ind SCI SP BUY 5.49 12/13 820.4 863.0 905.0 45.7 48.3 50.6 12.0 11.4 10.8 17.0 18.0 3.1 3.3 0.63 7.6 6.2 17.2 1,787.5 9,813.6 2.64 2.1 3.6 7.1 5.5 4.66 2,453 Sembcorp Marine SMM SP HOLD 4.05 12/13 555.7 556.3 590.0 26.6 26.6 28.2 15.2 15.2 14.3 13.0 13.3 3.2 3.3 0.31 10.1 8.5 21.7 2,089.8 8,463.5 1.27 3.2 10.7 34.0 4.63 3.9 3,319 Yangzijiang YZJSGD SP BUY 1.08 12/13 629.9 534.5 622.1 16.4 13.9 16.2 6.6 7.8 6.7 5.0 4.2 4.6 3.9 0.18 21.6 8.1 18.7 3,837.1 4,144.0 0.97 1.1 (17.7) (19.8) 1.24 0.795 10,746 Sector 3,882.5 3,741.9 4,000.1 33.0 31.8 34.0 11.3 11.7 10.9 3.5 3.8 11.1 5.9 18.1 43,791.0 2.0 (6.3) (12.3) SUPPLY CHAIN Noble Group NOBL SP SELL 1.185 12/13 267.4 511.8 516.9 4.2 8.1 8.2 27.9 14.7 14.5 1.1 2.6 1.0 2.2 0.10 0.2 1.2 5.4 6,660.2 7,892.3 0.74 1.6 (83.0) (110.3) 1.24 0.785 25,235 Olam OLAM SP HOLD 2.22 6/13 362.6 368.0 436.7 14.4 15.1 17.9 15.5 14.7 12.4 4.0 3.8 1.8 1.7 0.23 1.7 2.5 10.2 2,442.4 5,422.1 1.17 1.9 (145.3) (226.2) 2.24 1.405 5,728 Sector 630.0 879.8 953.6 7.1 10.0 10.9 21.1 15.1 14.0 1.3 2.0 0.5 1.7 7.2 13,314.5 1.7 (108.4) (153.1)

5
S i n g a p o r e C o r p o r a t e G u i d e Apr i l 2014
Corporate Statistics Avg Daily Price Last Net Profit EPS PE DPS Yield Hist Net No of Market Book Price/ Net Cash/(Debt) to 52-Wk Price Turnover Company Ticker Rec 31/3/14 Year 2013 2014F 2015F 2013 2014F 2015F 2013 2014F 2015F 2013 2014F 2013 2014F CFPS Margin ROA ROE Shares Cap. NTA ps NTA ps Mkt Cap Equity High Low 52-Wk (S$) End (S$m) (S$m) (S$m) (cents) (cents) (cents) (x) (x) (x) (cents) (cents) (%) (%) (S$) (%) (%) (%) (m) (S$m) (S$) (x) (%) (%) (S$) (S$) ('000)
TECHNOLOGY Venture Corp VMS SP BUY 7.46 12/13 131.1 147.0 162.4 47.7 53.5 59.1 15.6 14.0 12.6 50.0 50.0 6.7 6.7 0.63 5.6 5.4 7.2 275.0 2,051.6 4.10 1.8 11.2 12.5 8.70 7.06 368 Sector 131.1 147.0 162.4 47.7 53.5 59.1 15.6 14.0 12.6 6.7 6.7 5.6 5.4 7.2 2,051.6 1.8 11.2 12.5 TELECOMS M1 M1 SP BUY 3.47 12/13 160.2 158.2 174.8 17.4 17.1 18.9 19.9 20.3 18.4 21.0 13.7 6.1 4.0 0.30 15.9 16.3 43.1 926.7 3,215.6 0.33 10.4 (6.1) (49.5) 3.52 2.890 1,064 S Telecoms ST SP BUY 3.65 3/13 3,654.7 3,888.0 4,356.1 22.9 24.4 27.3 15.9 15.0 13.4 17.2 18.3 4.7 5.0 0.35 19.3 8.7 14.8 15,943.5 58,193.8 0.74 4.9 (12.1) (31.3) 4.09 3.420 19,037 StarHub STH SP BUY 4.20 12/13 370.7 381.9 409.9 21.5 22.2 23.8 19.5 18.9 17.7 20.0 20.0 4.8 4.8 0.37 15.7 20.3 587.5 1,723.0 7,236.8 (0.17) n.a. (5.8) (508.6) 4.76 3.860 2,017 Sector 4,185.6 4,428.2 4,940.8 22.5 23.8 26.6 16.4 15.5 13.9 4.8 4.9 18.7 9.4 16.7 68,646.1 5.8 (11.2) (33.4) OTHERS Genting HK US$ GENHK SP HOLD 0.39 12/13 691.0 293.2 325.6 8.8 3.8 4.2 5.6 13.0 11.7 1.0 0.0 2.0 0.0 0.10 99.6 15.2 21.2 7,793.2 3,825.0 0.47 1.0 6.6 6.9 0.52 0.37 7,763 Genting SP GENS SP SELL 1.335 12/13 589.4 699.8 640.5 4.8 5.7 5.2 27.7 23.3 25.5 1.0 1.0 0.7 0.7 0.08 20.7 4.5 8.4 12,237.2 16,336.7 0.59 2.3 9.4 21.0 1.64 1.29 19,052 HPH Trust US$ HPHT SP BUY 0.65 12/13 270.1 267.0 285.0 3.1 3.1 3.3 26.4 26.7 25.0 6.7 6.7 8.1 8.2 0.08 13.5 1.2 2.5 8,711.1 7,125.9 0.42 1.9 (64.0) (42.9) 0.86 0.6 17,527 SingPost SPOST SP BUY 1.36 3/13 128.1 137.7 147.9 6.6 7.1 7.6 20.6 19.1 17.8 6.3 6.3 4.6 4.6 0.09 20.7 9.1 43.1 1,938.7 2,636.6 0.08 17.4 5.1 39.6 1.4 1.225 3,234 SuperGroup SUPER SP HOLD 3.48 12/13 99.9 87.1 104.3 17.9 15.6 18.7 19.4 22.3 18.6 9.0 9.0 2.6 2.6 0.21 17.9 17.5 23.1 557.7 1,940.9 0.83 4.2 5.1 21.1 5.05 3.03 683 Sector 1,778.5 1,484.8 1,503.3 5.7 4.8 4.8 17.9 21.5 21.2 3.0 2.8 26.5 4.3 8.3 31,865.2 2.1 (7.9) (11.3) OVERALL 31,452.3 32,103.1 35,802.1 18.1 18.3 20.3 14.5 14.2 12.7 3.7 3.6 9.1 2.1 10.1 455,442.8 1.7 (20.2) (28.8)

6
S i n g a p o r e C o r p o r a t e G u i d e Apr i l 2014
Corporate Statistics Avg Daily Price Last Net Profit EPU DPU Yield Debt to No of Market Book Price/ Net Cash/(Debt) to 52-Wk Price Turnover Company Ticker Rec 31/3/14 Year 2013 2014F 2015F 2013 2014F 2015F 2013 2014F 2015F 2013 2014F 2015F Asset ROA ROE shares Cap. NTA ps NTA ps Mkt Cap Equity High Low 52-Wk (S$) End (S$m) (S$m) (S$m) (cents) (cents) (cents) (cents) (cents) (cents) (%) (%) (%) (%) (%) (%) (m) (S$m) (S$) (x) (%) (%) (S$) (S$) ('000) REITs Ascendasreit AREIT SP BUY 2.26 3/13 335.9 365.6 380.8 14.0 15.2 15.8 14.3 15.5 16.1 6.3 6.9 7.1 29.6 4.5 7.1 2,402.5 5,429.7 1.98 1.1 (38.9) (44.4) 2.86 2.06 8,083 AscottREIT ART SP HOLD 1.195 12/13 62.5 92.0 94.2 4.8 6.0 6.2 8.4 8.4 8.7 7.0 7.0 7.3 35.1 1.9 3.4 1,525.1 1,822.5 1.32 0.9 (50.2) (55.2) 1.455 1.141 1,335 CACHE CACHE SP BUY 1.135 12/13 57.0 59.5 63.4 7.5 7.6 8.1 8.6 8.5 9.0 7.6 7.5 7.9 28.8 5.5 7.9 777.4 882.4 0.98 1.2 (30.5) (35.4) 1.445 1.055 1,493 CapitaComm CCT SP BUY 1.485 12/13 217.3 223.7 241.2 7.6 7.8 8.0 8.1 8.4 8.6 5.5 5.6 5.8 28.6 3.1 4.5 2,880.9 4,278.1 1.70 0.9 (45.8) (39.8) 1.745 1.315 7,662 CapitaMall CT SP HOLD 1.89 12/13 349.1 369.7 384.3 10.1 10.7 11.1 10.3 10.8 11.2 5.4 5.7 5.9 34.4 3.5 6.0 3,459.9 6,539.3 1.74 1.1 (40.0) (43.6) 2.45 1.8 8,332 CDL Htrust CDREIT SP BUY 1.655 12/13 103.7 101.8 110.4 10.7 10.4 11.2 11.0 10.8 11.5 6.6 6.5 7.0 29.7 4.7 6.6 975.8 1,614.9 1.63 1.0 (38.4) (38.8) 2.13 1.5 1,596 FrasersCT FCT SP BUY 1.78 9/13 85.8 87.2 87.6 10.4 10.6 10.6 10.9 11.0 11.1 6.1 6.2 6.2 29.7 4.2 6.3 826.0 1,470.3 1.77 1.0 (38.1) (38.3) 2.34 1.66 1,118 Kep REIT KREIT SP BUY 1.14 12/13 145.7 141.3 167.0 5.3 5.0 5.9 7.9 8.0 7.3 6.9 7.0 6.4 39.6 2.26 4.0 2,794.3 3,185.5 1.4 0.8 (81.38) (66.5) 1.6 1.1 7040 MapletreeInd MINT SP BUY 1.365 3/13 162.3 166.6 170.5 9.7 9.7 9.6 9.8 9.9 9.9 7.2 7.3 7.2 36.3 5.0 8.3 1,690.4 2,307.4 1.11 1.2 (44.7) (55.5) 1.61 1.255 2,896 MapletreeLog MLT SP BUY 1.045 3/13 183.5 192.1 195.4 7.5 7.8 7.9 7.1 7.4 7.5 6.7 7.1 7.2 33.7 3.7 7.2 2,448.7 2,558.9 0.93 1.1 (51.4) (58.0) 1.35 0.98 3,767 PLife REIT PREIT SP HOLD 2.44 12/13 63.0 68.7 70.2 10.4 11.3 11.6 10.8 11.6 11.8 4.4 4.7 4.8 32.8 4.2 6.5 605.0 1,476.2 1.63 1.5 (32.1) (48.1) 2.82 2.12 493 Sabana REIT SSREIT SP HOLD 1.03 12/13 49.6 51.7 52.5 7.5 7.4 7.5 9.4 8.8 8.9 9.1 8.6 8.6 36.2 4.1 6.8 692.0 712.7 1.09 0.9 (60.4) (56.9) 1.385 1.005 1,572 Starhill Gbl SGREIT SP BUY 0.79 12/13 106.1 105.8 108.0 5.2 4.9 5.0 5.0 5.0 5.0 6.3 6.3 6.3 28.7 3.7 5.7 2,153.2 1,701.0 0.92 0.9 (46.3) (39.6) 0.99 0.75 2,162 Suntec REIT SUN SP BUY 1.66 12/13 214.5 143.0 163.1 9.5 6.3 7.1 9.3 9.8 10.7 5.6 5.9 6.5 38.0 2.7 4.5 2,493.8 4,139.7 2.18 0.8 (72.0) (61.5) 2 1.465 8,537 Sector 2,136.0 2,168.6 2,288.6 8.5 8.5 8.9 6.2 6.4 6.5 33.6 3.5 5.7 38,118.6 1.0 (49.0) (49.4)
Note: If year end is before June, earnings are shown in the previous period

7
S i n g a p o r e C o r p o r a t e G u i d e Apr i l 2014
Economics 2012 2013 2014F 2015F 1Q13 2Q13 3Q13 4Q13 Nov 13 Dec 13 Jan 14 Feb 14
GDP by Sector (Real) (yoy % chg) Total GDP 1.9 4.1 4.3 4.0 0.6 4.2 5.8 5.5 n.a. n.a. n.a. n.a. Goods Producing Industries 1.4 2.2 5.8 3.9 (4.5) 1.6 5.4 6.6 n.a. n.a. n.a. n.a. Manufacturing 0.3 1.7 5.5 3.6 (6.3) 0.8 5.3 7.0 n.a. n.a. n.a. n.a. Construction 8.7 5.9 8.0 5.3 5.6 6.6 6.6 4.8 n.a. n.a. n.a. n.a. Services Producing Industries 2.0 5.3 3.6 4.3 3.2 5.7 6.3 5.9 n.a. n.a. n.a. n.a. Wholesale & Retail Trade (1.4) 4.9 2.7 2.7 (0.1) 6.1 6.3 7.3 n.a. n.a. n.a. n.a. Transport & Storage 3.4 3.0 5.4 4.3 (1.0) 2.6 5.8 4.8 n.a. n.a. n.a. n.a. Accommodation & Food Services 2.3 3.0 2.9 3.0 2.5 3.7 3.6 2.2 n.a. n.a. n.a. n.a. Information & Communications 6.2 5.5 4.3 6.4 5.1 5.7 6.0 5.0 n.a. n.a. n.a. n.a. Financial Services 1.3 10.6 4.0 6.2 12.5 10.3 10.0 9.7 n.a. n.a. n.a. n.a. Business Services 5.9 5.1 4.1 4.8 4.4 6.0 5.2 4.6 n.a. n.a. n.a. n.a. Trade Figures (Nominal) (yoy % chg) Total Exports (0.4) 0.8 9.5 5.6 (8.3) (0.2) 5.8 6.0 0.9 8.9 4.2 11.3 Total Imports 3.8 (1.4) 1.5 2.7 (9.2) (3.9) 5.9 1.5 (3.3) 3.4 (0.9) 6.7 Non-oil Domestic Exports 1.1 (5.6) 7.0 3.4 (11.7) (5.1) (3.6) (1.9) (8.9) 6.0 (3.3) 9.1 Monetary Data (End of period) Loans Growth (yoy % chg) 21.3 17.7 15.3 12.6 19.2 18.8 16.2 16.7 17.4 17.0 16.5 14.6 M1 (yoy % chg) 7.2 13.8 13.1 12.8 12.3 15.9 15.2 11.7 11.9 9.9 10.7 7.8 M2 (yoy % chg) 7.2 7.8 11.0 11.1 8.9 9.5 7.4 5.5 5.2 4.3 3.6 2.4 Prime Lending Rate (%) 5.38 5.38 5.38 5.38 5.38 5.38 5.38 5.38 5.38 5.38 5.35 5.35 3mth Interbank Rate (%) 0.38 0.40 0.56 1.70 0.38 0.37 0.37 0.40 0.40 0.40 0.41 0.40 Exchange Rates (S$/US$) 1.2204 1.2589 1.3300 1.3100 1.2466 1.2595 1.2622 1.2589 1.2476 1.2589 1.2726 1.2659 Foreign Reserves (S$b) 316.5 343.8 397.3 431.1 321.9 327.2 338.4 343.8 339.2 343.8 345.6 346.9 Other Macro Variables (yoy % chg) Industrial Production Index (2011=100) 0.5 1.8 5.0 6.0 (6.3) 1.0 5.3 7.1 6.7 6.4 4.4 12.8 Retail Sales Index (Current) 2.7 (5.1) 2.5 1.4 (4.3) (0.6) (7.3) (8.0) (8.7) (5.5) 0.1 n.a. Visitor Arrivals 10.2 7.0 6.0 6.2 8.5 9.9 11.8 (2.2) (4.5) (1.1) 0.0 n.a. Inflation (2009=100) 4.6 2.4 3.3 2.9 4.0 1.6 1.8 2.0 2.6 1.5 1.4 0.4 Unemployment Rate sa (%) (end of period) 1.8 1.8 2.0 2.3 1.9 2.1 1.8 1.8 n.a. n.a. n.a. n.a. Changes in Employment ('000 persons) 129.1 134.9 138.8 121.7 28.9 33.7 33.1 40.6 n.a. n.a. n.a. n.a.
* Advanced estimates Source: CEIC, UOB Economic-Treasury Research

8
S i n g a p o r e C o r p o r a t e G u i d e Apr i l 2014
Ranking By Market Parameters
Highest PE (x) # Forward Highest P/NTA (x) * Hist. Highest Dividend Yield (%) * Hist. Highest 90 days Volatility (%) # Highest Market Cap (S$m) *
IHH 40.4 StarHub 87.4 HPH Trust US$ 8.1 Ezra 41.6 SingTel 58,193.8 GuocoLand 37.4 Dairy Farm 900 US$ 10.3 AscottREIT 7.0 Mermaid 38.0 JMH 400US$ 54,287.0 S I A 29.7 SGX 9.2 Kep REIT 6.9 Nam Cheong 33.6 JSH 500US$ 50,800.4 OUE 29.1 Silverlake 8.6 Far East HTrust 6.9 Olam 30.5 PRU 500 US$ 40,969.6 HPH Trust US$ 26.7 M1 8.1 MapletreeInd 6.8 FirstRes 29.5 DBS 39,627.0 Suntec REIT 26.5 DTAC 200US$ 7.7 Venture 6.7 TigerAir 29.0 UOB 34,434.2 COSCO Corp 25.4 SingPost 7.6 CDL HTrust 6.6 Noble Grp 28.9 OCBC Bk 32,725.6 Ezra 24.4 OSIM 7.2 MapletreeLog 6.6 SuperGroup 28.2 Wilmar 22,155.8 Raffles Medical 23.9 ARA 7.1 Starhill Gbl 6.3 GoldenAgri 28.2 Kep Corp 19,768.8 Genting SP 23.3 SP AusNet 6.5 FrasersCT 6.1 Genting HK US$ 28.2 HKLand US$ 19,249.1
Lowest PE (x) # Forward Lowest P/NTA (x) * Hist. Lowest Dividend Yield (%) * Hist.
Lowest 90 days Volatility (%) #
Lowest Market Cap (S$m) *
Swiber 5.9 Wing Tai 0.5 EzionHldg 0.0 Venture 10.6 CMProp 100 HK$ 1,269.7 Triyards 6.1 Yanlord 0.6 Yeo HS 0.4 K-REIT 10.7 Yeo HS 1,338.7 Wing Tai 7.7 Yuexiu Prop 2k 0.6 IHH 0.5 AscottREIT 11.0 UE 1,356.9 KencanaAgri 7.7 HKLand US$ 0.6 Sinarmas 0.7 DBS 11.1 St Trdg 1,379.4 Yangzijiang 7.8 Fortune Reit HK$ 0.6 JSH 500US$ 0.7 OCBC Bk 11.2 BukitSem 1,403.3 Nam Cheong 8.0 Ho Bee Land 0.6 BukitSem 0.7 SingPost 11.7 IndoAgri 1,411.6 Wilmar 9.0 Wheelock 0.7 Genting SP 0.7 SuntecReit 11.7 Far East HTrust 1,447.2 Pacific Radiance 9.8 GoldenAgri 0.7 CITYDEV 0.8 SGX 12.3 Gallant 1,447.5 DBS 10.7 HPH Trust US$ 0.7 IndoAgri 0.9 MapletreeLog 12.5 Wing Tai 1,452.9 O C B C 11.3 OUE Ltd 0.7 UIC 1.0 SPH 12.7 FrasersCT 1,470.3
# Based on UOB Kay Hian’s universe * Based on top 100 companies by market cap Source: Bloomberg, UOB Kay Hian

9
S i n g a p o r e C o r p o r a t e G u i d e Apr i l 2014
Price (S$) --------- % Change --------- Company 28/2/14 31/3/14 mom yoy ytd
AVIATION S I A 10.22 10.47 2.4 (3.7) 0.6 SIA Engg 4.72 4.84 2.5 2.1 (4.3) SATS 2.99 3.04 1.7 0.0 (5.9) ST Engrg 3.80 3.82 0.5 (11.4) (3.5) Tigerair 0.425 0.405 (4.7) (40.4) (20.6) Sector 1.6 (6.0) (2.7)
FINANCE ARA 1.76 1.845 4.8 (3.9) (0.8) DBS 16.52 16.17 (2.1) 1.1 (5.4) HL Fin 2.68 2.74 2.2 (1.4) (0.4) O C B C 9.56 9.51 (0.5) (10.7) (6.8) S'pore Exchange 6.88 6.94 0.9 (9.9) (4.4) U O B 20.63 21.65 4.9 6.2 1.9 Sector 0.6 (2.0) (3.6)
HEALTHCARE IHH 1.46 1.44 (1.4) 2.5 (4.0) Raffles Medical 3.22 3.21 (0.3) (2.1) 3.2 Sector (1.2) 1.9 (3.1)
LAND TRANSPORT ComfortDelGro 1.93 1.985 2.8 3.9 (1.2) SMRT 1.025 1.02 (0.5) (35.4) (12.1) Sector 1.9 (10.7) (4.4)
MEDIA S P H 4.15 4.20 1.2 (6.3) 1.9 Sector 1.2 (6.3) 1.9
OIL SERVICES ASL Marine 0.70 0.70 0.0 (2.1) 1.4 Ezion 2.25 2.16 (4.0) 19.5 (2.7) Ezra 1.065 1.09 2.3 (5.6) (20.7) Marco Polo 0.39 0.385 (1.3) (9.4) (1.3) Mencast 0.59 0.585 (0.8) 11.6 12.5 Mermaid 0.455 0.45 (1.1) 28.6 (9.1) Nam Cheong 0.34 0.335 (1.5) 26.4 6.3 Pacific Radiance 0.975 1.055 8.2 17.2 19.2 Swiber 0.65 0.665 2.3 (0.7) 0.0 Triyards 0.65 0.64 (1.5) (20.0) (3.8) Sector (0.6) 11.3 (3.3)
Price (S$) --------- % Change --------- Company 28/2/14 31/3/14 mom yoy ytd
PLANTATION Bumitama 0.975 1.04 6.7 1.5 10.6 FirstRes 2.21 2.34 5.9 27.9 10.4 GoldenAgri 0.555 0.575 3.6 (0.9) 5.5 IndoAgri 0.87 0.975 12.1 (21.1) 10.2 KencanaAgri 0.24 0.22 (8.3) (32.3) (10.2) Mewah 0.47 0.50 6.4 5.3 6.4 Wilmar 3.45 3.46 0.3 0.3 1.2 Sector 2.0 1.0 3.3
PROPERTY CapitaLand 2.85 2.89 1.4 (18.1) (4.6) City Devt 9.39 10.10 7.6 (10.9) 5.2 GuocoLand 2.20 2.19 (0.5) (5.6) (3.1) Ho Bee Land 2.19 2.18 (0.5) 13.0 2.8 Keppel Land 3.21 3.36 4.7 (14.7) 0.6 OUE 2.211 2.24 1.3 (22.4) (4.8) Wheelock 1.56 1.65 5.8 (14.3) (2.7) Wing Tai 1.85 1.83 (1.1) (3.9) (6.9) Sector 3.3 (13.6) (1.1)
REITS Ascendasreit 2.16 2.26 4.6 (13.1) 2.7 AscottREIT 1.155 1.195 3.5 (10.4) (0.8) CACHE 1.13 1.135 0.4 (13.0) 1.8 CapitaComm 1.465 1.485 1.4 (6.3) 2.4 CapitaMall 1.90 1.89 (0.5) (9.6) (0.8) CDL Htrust 1.63 1.655 1.5 (19.3) 0.9 FrasersCT 1.75 1.78 1.7 (16.8) 1.1 Frasers Comm 1.265 1.255 (0.8) (11.0) (1.2) Kep REIT 1.175 1.14 (3.0) (16.2) (3.8) MapletreeInd 1.35 1.365 1.1 (2.8) 2.2 MapletreeLog 1.035 1.045 1.0 (14.0) (0.9) PLife REIT 2.29 2.44 6.6 (3.6) 3.8 Sabana REIT 1.025 1.03 0.5 (18.6) (4.6) Starhill Gbl 0.78 0.79 1.3 (11.2) 0.6 Suntec REIT 1.665 1.66 (0.3) (7.8) 7.8 Sector 1.1 (11.0) 1.2
SHIPPING N O L 0.95 0.995 4.7 (16.0) (11.6) Sector 4.7 (16.0) (11.6)
Performance At A Glance*

10
S i n g a p o r e C o r p o r a t e G u i d e Apr i l 2014
* Based on UOB Kay Hian’s universe
Price (S$) --------- % Change --------- Company 28/2/14 31/3/14 mom yoy ytd
SHIPYARD COSCO Corp 0.69 0.715 3.6 (21.4) (5.3) Keppel Corp 10.47 10.89 4.0 0.7 (2.7) Sembcorp Ind 5.41 5.49 1.5 5.8 0.0 Sembcorp Marine 4.11 4.05 (1.5) (8.6) (9.0) Yangzijiang 1.135 1.08 (4.8) 11.3 (8.9) Sector 1.4 (0.3) (4.1)
SUPPLY CHAIN Noble Group 1.03 1.185 15.0 (2.5) 10.7 Olam 1.775 2.22 25.1 29.1 44.6 Sector 18.9 8.3 22.4
TECHNOLOGY Venture Corp 7.55 7.46 (1.2) (13.9) (2.9) Sector (1.2) (13.9) (2.9)
TELECOMS M1 3.40 3.47 2.1 17.2 6.1 S Telecoms 3.60 3.65 1.4 1.7 (0.3) StarHub 4.18 4.20 0.5 (3.4) (2.1) Sector 1.3 1.7 (0.2)
OTHERS Genting HK US$ 0.395 0.39 (1.3) (13.3) (9.3) Genting SP 1.345 1.335 (0.7) (10.7) (10.7) HPH Trust US$ 0.625 0.65 4.0 (23.5) (3.7) SingPost 1.32 1.36 3.0 9.2 2.6 SuperGroup 3.69 3.48 (5.7) (10.8) (8.4) Sector 0.1 (12.4) (8.1)
OVERALL 1.6 (3.6) (1.6)
Performance At A Glance*

11
S i n g a p o r e C o r p o r a t e G u i d e Apr i l 2014
Performance At A Glance*
Aviation
92
94
96
98
100
Jan Feb Mar
(31Dec13=100)
FSSTI
Av iation
Finance
92
94
96
98
100
102
Jan Feb Mar
FSSTI
Finance
(31Dec13=100)
Healthcare
90
92
94
96
98
100
102
Jan Feb Mar
FSSTI
Healthcare
(31Dec13=100)
Land Transport
92
94
96
98
100
102
Jan Feb Mar
FSSTI
Land Transport
(31Dec13=100)
Media
9293949596979899
100101102
Jan Feb Mar
FSSTI
Media
(31Dec13=100)
Oil Services
90
92
94
96
98
100
102
104
Jan Feb Mar
FSSTI
Oil Serv ices
(31Dec13=100)
12
S i n g a p o r e C o r p o r a t e G u i d e Apr i l 2014
Performance At A Glance*
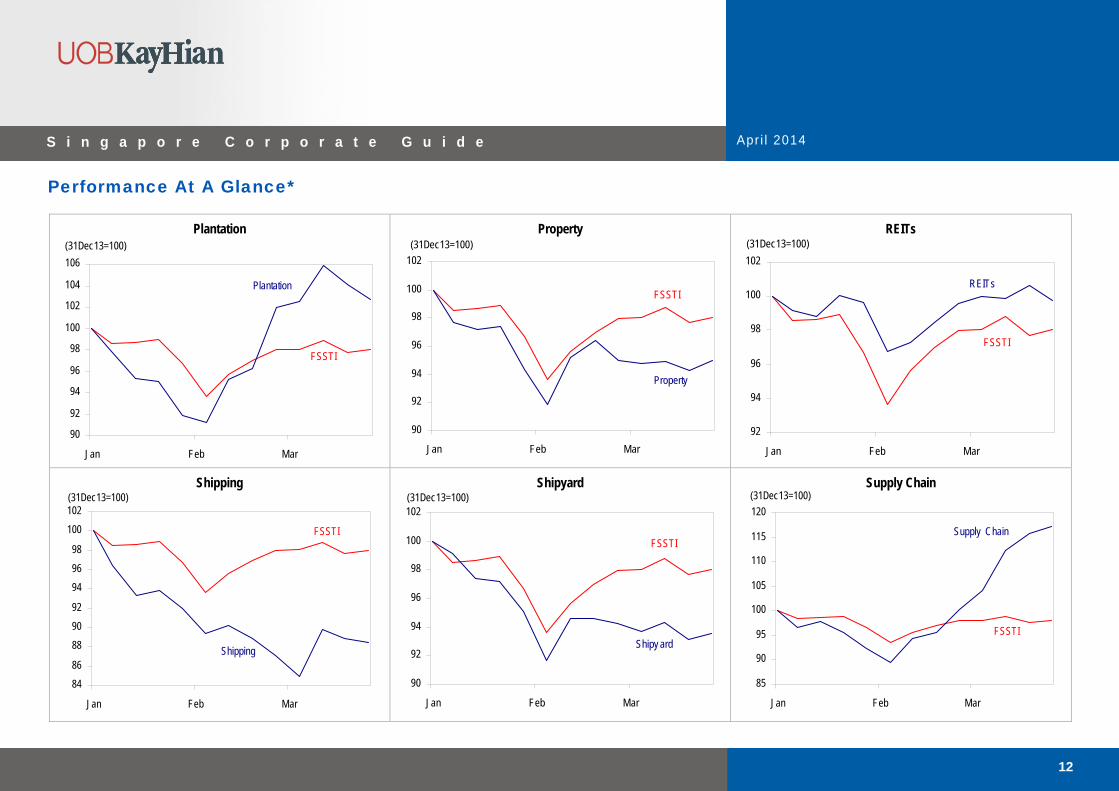
Plantation
90
92
94
96
98
100
102
104
106
Jan Feb Mar
FSSTI
Plantation
(31Dec13=100)
Property
90
92
94
96
98
100
102
Jan Feb Mar
FSSTI
Property
(31Dec13=100)
REITs
92
94
96
98
100
102
Jan Feb Mar
FSSTI
REITs
(31Dec13=100)
Shipping
8486
889092
949698
100102
Jan Feb Mar
FSSTI
Shipping
(31Dec13=100)
Shipyard
90
92
94
96
98
100
102
Jan Feb Mar
FSSTI
Shipy ard
(31Dec13=100)
Supply Chain
85
90
95
100
105
110
115
120
Jan Feb Mar
FSSTI
Supply Chain
(31Dec13=100)

13
S i n g a p o r e C o r p o r a t e G u i d e Apr i l 2014
Performance At A Glance*
Technology
92
94
96
98
100
102
Jan Feb Mar
FSSTI
Technology
(31Dec13=100)
Telecoms
92
94
96
98
100
102
Jan Feb Mar
FSSTI
Telecoms
(31Dec13=100)
Others
90
92
94
96
98
100
102
Jan Feb Mar
FSSTI
Others
(31Dec13=100)
* Based on UOB Kay Hian’s universe

14
S i n g a p o r e C o r p o r a t e G u i d e Apr i l 2014
Diary Of Events
Sunday Monday Tuesday Wednesday Thursday Friday Saturday
– SPH 2Q14* – Ezra 2Q14 – Triyards 2Q14
– Keppel REIT 1Q14*
– Feb 14 Retail Sales – Keppel Land 1Q14* – A-REIT FY14
– Keppel Corp 1Q14* – M1 1Q14
– Mar 14 Trade Figures – CapitaMall Trust 1Q14 – FCT 2Q14 – Mapletree Log FY14 – Sabana REIT 1Q14
– x
5
13 14 15 16 17 18 19
6 7 8 9 10 11 12
1 2 3 4

15
S i n g a p o r e C o r p o r a t e G u i d e Apr i l 2014
Diary Of Events
Sunday Monday Tuesday Wednesday Thursday Friday Saturday
– Mapletree Ind FY13
– Mar 14 CPI – Cache 1Q14* – SGX 3Q14* – HL Finance 1Q14
– Mar 14 IPI – CapitaLand 1Q14 – Ascott REIT 1Q14 – CDL H-Trust 1Q14 – Starhill Global 1Q14 – Suntec REIT 1Q14
– Raffles Medical 1Q14 – Indofood Agri 1Q14 – Wheelock 1Q14
– 1Q14 Unemployment – OCBC 1Q14* – DBS 1Q14* – UOB 1Q14* – SMRT FY14 – Ho Bee 1Q14 – HPHT 1Q14
* Confirmed
27 28 29
20 21 22 23 24 25 26
30

16
S i n g a p o r e C o r p o r a t e G u i d e Apr i l 2014
Disclosures As of 02 April 2014, the analyst and his/her immediate family do not hold positions in the respective securities recommended in this report. We have based this document on information obtained from sources we believe to be reliable, but we do not make any representation or warranty nor accept any responsibility or liability as to its accuracy, completeness or correctness. Expressions of opinion contained herein are those of UOB Kay Hian Research Pte Ltd only and are subject to change without notice. Any recommendation contained in this document does not have regard to the specific investment objectives, financial situation and the particular needs of any specific addressee. This document is for the information of the addressee only and is not to be taken as substitution for the exercise of judgement by the addressee. This document is not and should not be construed as an offer or a solicitation of an offer to purchase or subscribe or sell any securities. UOB Kay Hian and its affiliates, their Directors, officers and/or employees may own or have positions in any securities mentioned herein or any securities related thereto and may from time to time add to or dispose of any such securities. UOB Kay Hian and its affiliates may act as market maker or have assumed an underwriting position in the securities of companies discussed herein (or investments related thereto) and may sell them to or buy them from customers on a principal basis and may also perform or seek to perform investment banking or underwriting services for or relating to those companies. UOB Kay Hian (U.K.) Limited, a UOB Kay Hian subsidiary which distributes UOB Kay Hian research for only institutional clients, is an authorised person in the meaning of the Financial Services and Markets Act 2000 and is regulated by Financial Services Authority (FSA). In the United States of America, this research report is being distributed by UOB Kay Hian (U.S.) Inc (“UOBKHUS”) which accepts responsibility for the contents. UOBKHUS is a broker-dealer registered with the U.S. Securities and Exchange Commission and is an affiliate company of UOBKH. Any U.S. person receiving this report who wishes to effect transactions in any securities referred to herein should contact UOBKHUS, not its affiliate. The information herein has been obtained from, and any opinions herein are based upon sources believed reliable, but we do not represent that it is accurate or complete and it should not be relied upon as such. All opinions and estimates herein reflect our judgement on the date of this report and are subject to change without notice. This report is not intended to be an offer, or the solicitation of any offer, to buy or sell the securities referred to herein. From time to time, the firm preparing this report or its affiliates or the principals or employees of such firm or its affiliates may have a position in the securities referred to herein or hold options, warrants or rights with respect thereto or other securities of such issuers and may make a market or otherwise act as principal In transactions in any of these securities. Any such non-U.S. persons may have purchased securities referred to herein for their own account in advance of release of this report. Further information on the securities referred to herein may be obtained from UOBKHUS upon request. UOB Kay Hian Research Pte Ltd, 8 Anthony Road, #01-01, Singapore 229957 Tel: (65) 6535 6868, Fax: (65) 6509 5137 http://research.uobkayhian.com MCI (P) 116/03/2014 RCB Regn. No. 198700235E