corporate governance compliance and firm value: a cultural ... · corporate governance compliance...
TRANSCRIPT

Corporate Governance Compliance and Firm Value:
A Cultural Perspective
Masanori Orihara Arman Eshraghi
Abstract
We show the corporate governance reforms introduced by the Japanese government since 2014
have not succeeded in increasing aggregate firm value. These policies, of which voluntary
disclosure in the form of ‘comply or explain’ is a major element, have inadvertently led to
overcompliance by target firms listed in the first section of the Tokyo Stock Exchange as well
as a range of non-target firms. We argue this overcompliance behaviour is, inter alia, correlated
with the cultural values of ‘conformity’, ‘respect for authority’ and ‘power distance’, which
permeate the Japanese corporate culture. This results in smaller firms, which are typically not
listed on the first section of the exchange, following the compliance behaviour of larger firms
listed on the first section in the same industry sector. Importantly, this pressure to follow in the
steps of leading firms is to the detriment of board effectiveness and shareholder value. We
document a larger reduction in the market value of young and R&D intensive firms, and firms
appointing outsider directors with lower advising quality. These findings highlight the risks in
adopting corporate governance policies without due attention to cultural nuances.
JEL classifications: G34, M14
Keywords: Voluntary disclosure, National culture, Corporate governance, Compliance, Japan
Masanori Orihara is from the University of Tsukuba ([email protected]) and Arman Eshraghi is from Cardiff University ([email protected]). Corresponding author address is Cardiff Business School, Colum Drive, Cardiff, CF10 3EU, United Kingdom.

18
Acknowledgements:
We are thankful to Iftekhar Hasan, Takashi Hatakeda, Lynn Hodgkinson, Kevin Holland, Katsuhiko Muramiya, Wataru Ohta, Junyu Saito, Takashi Yoshida, Qingwei Wang and the participants at Cardiff Empirical Finance Conference, Cardiff-Newcastle-Xiamen Conference, Gregynog Symposium, Western Economic Association International Conference and seminars at Osaka University, Japan, University of St Andrews, UK and University of Leeds, UK. Masanori Orihara gratefully acknowledges financial support from the Japan Society for Promotion of Science (KAKENHI-18K12819), and Arman Eshraghi gratefully acknowledges support from the Research Institute of Capital Formation at the Development Bank of Japan.

1
Corporate Governance Compliance and Firm Value:
A Cultural Perspective
Abstract
We show the corporate governance reforms introduced by the Japanese government since 2014
have not succeeded in increasing aggregate firm value. These policies, of which voluntary
disclosure in the form of ‘comply or explain’ is a major element, have inadvertently led to
overcompliance by target firms listed in the first section of the Tokyo Stock Exchange as well
as a range of non-target firms. We argue this overcompliance behaviour is, inter alia, correlated
with the cultural values of ‘conformity’, ‘respect for authority’ and ‘power distance’, which
permeate the Japanese corporate culture. This results in smaller firms, which are typically not
listed on the first section of the exchange, following the compliance behaviour of larger firms
listed on the first section in the same industry sector. Importantly, this pressure to follow in the
steps of leading firms is to the detriment of board effectiveness and shareholder value. We
document a larger reduction in the market value of young and R&D intensive firms, and firms
appointing outsider directors with lower advising quality. These findings highlight the risks in
adopting corporate governance policies without due attention to cultural nuances.
JEL classifications: G34, M14
Keywords: Voluntary disclosure, National culture, Corporate governance, Compliance, Japan

2
1. IntroductionVoluntary disclosure policies aimed at improving corporate governance outcomes have
increasingly been adopted across the world (e.g., Zattoni and Cuomo, 2008). The general
argument in favour of voluntary disclosure regimes such as ‘comply or explain’, as opposed to
hard regulations such as the Sarbanes-Oxley Act of 2002, is that the former allows for a more
dynamic and flexible approach to corporate governance. Comply or explain approaches are
“formally nonbinding and voluntary in nature, issued by multi-actor committees, flexible in
their application, built on the market mechanism for evaluation of deviations and evolutionary
in nature” (Haxhi and Aguilera, 2014). Therefore, numerous countries have adopted voluntary
corporate governance policies with the goal of enhancing firm value and improving the general
governance environment of their corporate sectors.
Broadly speaking, however, empirical support for the comply or explain approach is mixed and
inconclusive (see, e.g., Cuomo, Mallin, and Zattoni, 2016; Davies et al., 2011).1 Firstly,
research evidence shows that complying firms often do so more in ‘form’ than in ‘substance’
(Krenn, 2014), and non-complying firms use standard ‘boilerplate’ statements (Arcot, Bruno
and Faure-Grimaud, 2010), possibly due to unenforceability of such regulations. Second and
more closely related to our paper, recent studies point out that country-level factors can mitigate
the effectiveness of voluntary codes (Cuomo, Mallin, and Zattoni, 2016; Price, Román, and
Rountree, 2011). We extend this literature by introducing a so far underexplored factor: the
socio-cultural pressures to ‘conform’ in the corporate sector.
This paper provides evidence from the recent corporate governance reforms in Japan to show
that such soft governance approaches can be less effective in certain cultural environments.
Primarily, we argue that due to specific attributes of the Japanese national culture such as very
high levels of conformity, respect for authority, power distance, uncertainty avoidance, and
long-term orientation, an unusually high proportion of Japanese firms comply with the
voluntary code of governance and other related policies introduced since 2014 (hereafter
referred to as the ‘Code’). Importantly, we illustrate that even listed companies not subject to
this regulation tend to ‘overcomply’. In other words, there is robust evidence of overcompliance
1 Some studies report that such approaches increase firm value. See, for example, Goncharov, Werner and Zimmermann (2006) in Germany; Fernández‐Rodríguez, Gómez‐Ansón and Cuervo‐García (2004) in Spain; and Dahya and McConnell (2007) in the UK. In contrast, for example, Price, Román, and Rountree (2011) report no association between compliance to the voluntary governance code in Mexico and firm performance. The survey by Cuomo, Mallin, and Zattoni (2016) illustrates the range of mixed results in this literature.

3
to the Code across all listed firms in Japan and, crucially, this is associated with a marked
decline in firm value following the introduction of the Code.
The overcompliance problem that we illustrate is theoretically related to the Japanese cultural
preference for loyalty, deference and respect to regulatory authorities, to leading firms in the
sector, and to what is regarded, implicitly or explicitly, as ‘best practice’. While the traditional
corporate governance research often draws on the classic agency problems between managers
and shareholders (lack of loyalty and the principal-agent theory a la Jensen and Meckling,
1976), we argue that the Japanese evidence is more consistent with the agency problems
discussed in Morck (2008). The latter suggests that too much loyalty between the agent and the
principal may lead to similarly adverse effects. In the Japanese context, we argue this loyalty is
fuelled by longstanding socio-cultural values that are unique to this country.
The corporate governance Code we study in this paper was finalized by the Japanese Financial
Services Agency and the Tokyo Stock Exchange (hereinafter, TSE) in December 2014 and
implemented in June 2015. According to the Code, firms have to comply with a set of principles
or explain their reasons for non-compliance. One of the Code’s key requirements is that firms
need at least two outside directors on their board. This requirement, however, applies only to a
subgroup of Japanese firms: those listed on the first section (T1 as in Tier-1) or the second
section (T2 as in Tier 2) of the TSE – an overall group we refer to as T12. In our sample, T1
firms consist of 66% (64%) of TSE (all listed) firms. T2 firms consist of 16% (15%) of TSE
(all listed) firms. Finally, firms listed in other sections of the TSE, which we refer to as non-
T12, make up 19% (18%) of TSE (all listed) firms, respectively.
While the requirement to have two outside directors might appear inconsequential relative to
many other countries, it has a considerable potential to influence corporate governance in Japan.
Traditionally, boards in Japan have had far fewer outside directors than other countries. This,
among other reasons, can be attributed to the distinct corporate structures historically prevalent
in Japan such as the interlocking business relationships and shareholdings commonly referred
to as the Keiretsu. To illustrate this, as of 2012, 45% of Japanese firms had no outside directors
and 30% had only one outside director on their boards. Thus, only 25% of firms had two or
more outside directors. Against this backdrop, the Code was introduced in 2014 and targeted

4
T12 companies with less than two outside directors which made up 54% of all listed firms in
Japan.
Based on our findings, between 2013 and 2017, the mean number of outside directors increased
at an accelerated pace from 1.3 to 2.7 for T1 firms and from 0.8 to 2.1 for T2 firms. This trend
can be seen in Figure 1. The growth within a five-year period was much faster than the relatively
static number of outside directors in the preceding decade from 2003 to 2013. Surprisingly,
non-T12 firms also reacted to the Code. 18% of these firms had two or more outside directors
in 2013 but this rose to 31% in 2014 and further to 52% in 2017. The Code affected non-T12
firms more than T12 firms in the sense that prior to the introduction of the Code, we observe
virtually no change in the number of outside directors. This is in contrast to T12 firms that
experienced a gradual rise. This suggests that the introduction of the Code had a spillover effect
on firms that were not the direct target of the policy.
~ Figure 1 about here ~
Next, we examine the impact of the Code on firm value. Using an Instrumental Variable
approach, we show that an increase in the number or the ratio of outside directors, induced by
the Code, has an opposite effect and reduces firm value as measured by Tobin’s Q. In addition,
we observe this negative association among both T1 and non-T12 firms. This can mean that the
potential signalling of competence by non-T12 firms, proxied by their compliance behaviour,
is not positively interpreted by the market.
Further tests yield three sets of results. First, non-T1 firms comply with the Code following the
compliance of their industry leaders. i.e., T1 firms. Our findings demonstrate that this
compliance herding reduces the follower firms’ market value. Second, market values of firms
that cannot appoint sufficient outside directors declines among non-T1 firms more than T1
firms. These findings suggest that conformity pressures from industry leaders have a negative
effect on these followers. Third, value of R&D intensive firms listed on the T1 section decreases.
Given these firms are likely to be leaders among leaders, this finding suggests that leaders
themselves also suffer possibly due to the respect for authority.

5
Finally, we examine the impact of the Code on board size. The implementation of the Code
seems to have had an unintended consequence. Average board size increased because firms
retained insiders on boards when appointing outsiders. We find these larger boards are
associated with a reduction in firm value. Although this negative association is widely known
from extensive studies since Yermack (1996), it can further illustrate how overcompliance to
the Code has reduced shareholder value in our setting. Crucially, this negative effect is observed
only among T1 firms. A policy recommendation based on this finding is that imposing a
restriction on board size can mitigate problems in comply or explain governance regimes.
Our paper makes several contributions to the corporate governance literature. Firstly, we extend
the body of work on the impact of voluntary corporate governance codes on board size, board
independence and firm value (e.g., Cuomo, Mallin, and Zattoni, 2016). Our findings are in
contrast to Fauver et al. (2017) who find that comply or explain increases firm value. Similarly,
Luo and Salterio (2014) report that Canadian firms exploit the flexibility of the comply or
explain regime strategically and thus increase their firm value. We posit that these differences
in governance outcomes between Japan (with its highly homogenous culture) and countries
such as Canada (with their diverse and fluid cultures) can be explained reasonably well in the
context of socio-cultural differences.
Secondly, therefore, we contribute to the literature on the emerging role of culture in explaining
corporate finance and governance outcomes.2 Our findings are related to Li and Harrison (2008)
who study how national culture affects board structures but do not examine the consequence of
this on firm value. More closely, our results are in line with Frijins, Dodd and Cimerova (2016)
who show the cultural diversity of board of directors can reduce firm value.
Thirdly, we illustrate that firms appointing other firms’ current or former executives experience
a smaller reduction in firm value. This contributes to the body of work on the positive valuation
effects of CEO director appointments (e.g., Fahlenbrach, Minton, and Pan, 2011; Fich 2005,
Fahlenbrach, Low, and Stulz, 2010).
2 For example, there are studies on culture and merger and acquisitions (Ahern, Daminelli, and Fracassi, 2015), executive compensation (Bryan, Nash, and Patel, 2015), internal control disclosures (Hooghiemstra, Hermes and Emanuels, 2015), firm growth (Boubakri and Saffar, 2016), and international portfolio holdings (Karolyi, 2016). See Aggarwal et al. (2016) for a review.

6
The rest of this paper is organized as follows. Section 2 provides policy background on the
Japanese corporate governance and the cultural attributes relevant to the study. Section 3
develops the hypotheses, presents the empirical design and introduces the data and descriptive
statistics. Section 4 presents the main empirical findings and Section 5 concludes.
2. Background2.1. The Japanese Corporate Governance Code
As in other countries, accounting and governance scandals in Japan have encouraged policy
discussions on issues such as board independence. In 2011, Japan experienced two consecutive
accounting scandals: the Olympus Corporation scandal in July and the Daio Paper Corporation
scandal in September. These events led to widespread international concerns about the quality
of Japanese corporate governance, which, in turn, stimulated a policy debate on board
independence. At this time, still about half of Japanese firms had no outside directors.
Following extensive legislative attempts in the following years, in August 2012, the Corporate
Law subcommittee decided that it would not mandate companies to have an outside director.
Instead, the proposal mandated firms to explain the reasons when they choose not to have an
outside director. This was the first time in Japan that comply or explain requirements appeared
in a series of policy discussions. The government accepted this proposal in November 2013, it
passed into law (the Code) in June 2014 and came into force in June 2015.
In fact, the Code was part of a larger policy package introduced by Prime Minister Shinzo Abe
since December 2012 including legal reforms and changes in macroeconomic policy
(informally referred to as Abenomics). The code consists of five General Principles, 30
Principles, and 38 Supplementary Principles; thus 73 items in total. All publicly listed firms are
mandated to comply, or explain their non-compliance, with all the five General Principles. In
contrast, only firms listed on the first or second sections of the TSE are subject to the remaining
68 principles. Compliance or lack thereof must be reported in the corporate disclosures that
firms file annually following their annual shareholder meetings.
In May 2015, a concurrent requirement came into force, which required firms to appoint at least
one outside director. If firms chose not to make this appointment, they had to explain their
reasons at the general shareholders’ meetings. More precisely, the requirement applied only to
‘large firms,’ defined as having a stated capital of 500 million yen or liabilities of 20 billion

7
yen. 97% of firms in our final sample are classified as ‘large firms.’ The law also introduced
the audit and supervisory committee system. This is an elective framework. If a firm adopts it,
the firm must place an audit and supervisory committee inside its board. At least three directors
need to be on this committee and a half of them must be outside directors. These directors
monitor other directors. Non-committee member directors can oversee decision making. Thus,
the framework encourages firms to separate management and monitoring inside the board.
2.2. Culture in Corporate Governance
The finance literature has recently opened up to discussing and measuring the impact of culture
in finance. A seminal study in this area is by Grinblatt and Keloharju (2001) who document
that investors are more likely to hold, buy, and sell the stocks of Finnish firms that are
geographically proximate to the investor, that communicate in the investor's native tongue, and
that have CEOs of the same cultural background. Culture for their 97 publicly-traded Finnish
firms is identified by the CEO's name and native tongue (Finnish or Swedish).
Similarly, Chui, Lloyd, and Kwok (2002) show that firms in countries with high scores on the
cultural dimensions of conservatism and mastery – both adapted from Hofstede's construct by
Schwartz (1994) – are associated with lower debt ratios. Shao, Kwok, and Guedhami (2010)
associate these same values with higher dividend payouts. The propensity for corporate
investment in longer-term, riskier projects or to employ excess cash for R&D expenditures is
further associated with firms domiciled in countries with higher scores on Hofstede's
individualism index (Shao, Kwok, and Zhang, 2013).
This trend has also spilled over to corporate governance research. Stulz and Williamson (2003)
explore the link between national cultural and international differences in corporate
governance. The authors measure cultural differences by religion and language and show that
cultural differences can explain differences in investor protection for a set of countries with the
same legal systems. For example, compared to Protestant countries, Catholic countries provide
much weaker protection for creditors.
The Japanese culture provides an excellent setting for studying the impact of culture on
corporate outcomes. By most measures, the Japanese culture has unique features which can be
attributed, inter alia, to the historical and geographical seclusion of Japan prior to recent times.

8
Figure 2 provides a quick comparison of Hofstede cultural measures between Japan and the US,
the latter providing the basis and data for most of corporate governance literature to date.
As Figure 2 shows, the Japanese culture score very highly on Power Distance (the extent to
which the less powerful members of organizations and institutions accept and expect that power
is distributed unequally), Masculinity (preference in society for achievement, heroism,
assertiveness and material rewards for success), Uncertainty Avoidance (society’s tolerance for
ambiguity, the extent to which people embrace or avert an event of something unexpected,
unknown, or away from the status quo), and Long-term Orientation (viewing adaptation and
circumstantial, pragmatic problem-solving as a necessity).
~ Figures 2 about here ~
World Values Survey also supports our argument on the Japanese culture. Their fourth survey
(WVS Wave 4) asks the following: ‘People have different ideas about following instructions at
work. Some say that one should follow one's superior's instructions even when one does not
fully agree with them. Others say that one should follow one's superior's instructions only when
one is convinced that they are right.’ Only 9.2% of the 1362 Japanese respondents answer they
must be convinced first. The average across all countries is 43.9%, and the ratio is at least 20%
in any other country but Japan. Ahern et al. (2015) use the answer to this question to measure
the degree of hierarchical culture.
Other studies on Japanese social behaviour (for example Benedict, 1946, Caudill and Scarr,
1962) have similarly emphasized the importance of 1) Conformity, 2) Group membership, and
3) Respect for authority in the Japanese culture. We will use these constructs in the rest of the
paper to argue why smaller and younger Japanese companies have the tendency to comply with
their leaders, and at a higher level, with government authority. Some examples of conformity
in Japanese culture are illustrated in Figure 3.
~ Figures 3 about here ~

9
3. Research Design3.1. Hypothesis Development
Our first two hypotheses are concerned with board composition and independence. The Code
clearly stipulates the requirement to have at least two outside directors on the board. In the
Japanese context where a majority of companies did not have any or had only one outside
director prior to the introduction of the Code, this can only mean that we should expect the
board size, and the number/ratio of outside directors to increase following the introduction of
the Code.3 Of course, a voluntary code, by its very nature, may mean that a majority of
companies may not choose to comply with it. However, given the Japanese institutional context
and conformity pressures, we do not expect this to be the case ex ante.
Hypothesis 1: The voluntary Code increases board size.
Hypothesis 2: Number and ratio of outside directors increases following adoption of the Code.
As we expect the voluntary nature of the Code to lead to overcompliance, we should also
observe a decline in firm value when the firm appoints outside directors in response to the
introduction of the code. Any such decision by the firm is, by nature, a knee-jerk reaction to a
regulatory change and not driven by company fundamentals. As such, it is not likely to increase
shareholder value. In particular, this negative effect should be large among non-T1 firms
because foreign investors, who care more about the quality of corporate governance relative to
other investors, invest in such firms to a much lesser extent. Therefore, strictly speaking and
apart from the cultural pressures, there is no good reason for these firms to comply with the
Code en masse. Therefore:
Hypothesis 3: Firm value decreases following overcompliance to the Code.
In the next section, we lay out the empirical strategy for testing these hypotheses.
3.2. Empirical Design
Unlike general studies on voluntary disclosure that often face the problem of endogeneity,
studies on regulatory settings can use changes in disclosure regulation as an exogenous shock
3 Board size can stay constant if firms replace insiders with outsiders. We will empirically investigate this point in Section 5.2.
10
to corporate information environment to avoid self-selection issues (e.g., Atanasov and Black,
2016). However, the regulatory approach faces challenges as new rules often arrive with
changes in institutional settings, following an economic crisis or a major corporate scandal. For
instance, the Asian crisis of 1997 was followed by introduction of a corporate governance code
in Asian countries, namely, Hong Kong, Indonesia, Malaysia, the Philippines, Singapore, South
Korea, Taiwan and Thailand (Nowland 2008). Having said that, we have no good reason to
suspect similarly significant or systemic changes in the institutional settings of the Japanese
corporate sector during the past few years prior to the introduction of the Code.
We use an Instrumental Variable (IV) approach in our empirical design. An IV approach can
identify the Local Average Treatment Effect, i.e., the treatment effect for the subset of the
sample that takes the treatment. This allows us to examine the link between appointment of
outside directors, induced by the introduction of the code, and firm value. We first identify the
effect of outside directors through a change in the introduction of the code and then regress
Tobin’s Q on the number/ratio of outsider directors in an IV setting.
Our instrument reflects policy pressure from the introduction of the code. To construct the
instrument, we use two variables. The first is a treatment variable which takes the value of one
if the number of the firm’s outside directors is less than zero or one prior to the reform. We use
one of the following three dummy variables that takes one if: i) the firm had no outside directors;
ii) the firm had no outside directors and takes a missing value if the firm had one outside
director; or iii) the firm had less than two outside directors. The second is a dummy variable
that takes the value of one after the reform.
We choose March 2015 as the timing of the effective introduction of the code. Firms with fiscal
year ending in March generally have their annual shareholder meeting in June, and this is the
same timing as the implementation of the Code. The instrument is the intersection of the first
and second variables. We thus employ three instruments to fully ensure the robustness of our
findings. These instruments exhibit a cross-sectional variation, either zero or one, only after the
effective introduction of the code. Given the prior observation that the code affected both T12
and non-T12 firms, we do not interact a T12 dummy with this instrument. We then estimate the
parameters of the following two equations:

11
, (1)𝑂𝑢𝑡𝐷𝑖𝑟𝑒𝑐𝑖𝑡 = 𝛼𝑖 + 𝛽1𝑇𝑟𝑒𝑎𝑡𝑖 ∗ 𝐴𝑓𝑡𝑒𝑟𝑡 + 𝛾𝑋𝑖𝑡 + 𝜂𝑡 + 𝜖𝑖𝑡
(2)𝑄𝑖𝑡 = 𝛼'𝑖 + 𝛽2𝑂𝑢𝑡𝐷𝑖𝑟𝑒𝑐𝑖𝑡 + 𝛾'𝑋𝑖𝑡 + 𝜂 '
𝑡 + 𝜖 '𝑖𝑡,
where indexes i and t respectively indicate firm and fiscal year, is the number/ratio 𝑂𝑢𝑡𝐷𝑖𝑟𝑒𝑐𝑖𝑡
of outsider directors, is one if the firm is in the treatment group, is one if after 𝑇𝑟𝑒𝑎𝑡𝑖 𝐴𝑓𝑡𝑒𝑟𝑡
the reform, includes control variables, is the Tobin’s Q, is the fitted value 𝑋𝑖𝑡 𝑄𝑖𝑡 𝑂𝑢𝑡𝐷𝑖𝑟𝑒𝑐𝑖𝑡
of from regression (1), is year dummies, is firm-fixed effects, and is 𝑂𝑢𝑡𝐷𝑖𝑟𝑒𝑐𝑖𝑡 𝜂𝑡 𝛼𝑖 𝜖𝑖𝑡
error terms. Standard errors are clustered at the firm level. We use the two stage least squares
for estimation.
3.3. Data
We use data provided by Nikkei NEEDS FinancialQUEST and Executive Data respectively
covering basic financial and governance information of Japanese public firms. The sample runs
from 2010 to 2017 and we keep firms whose end of fiscal year is in March, which account for
over 70% of Japanese firms. The sample includes those listed on the first section (T1) of the
TSE, on the second section (T2), other sections of the TSE and finally those listed in other
Japanese exchanges apart from the TSE such as Nagoya, Fukuoka, or Sapporo Stock
Exchanges. We evaluate the section where the firm lists its stock as of 2014 when performing
subsample analyses to use a within-firm variation across same firms. We winsorize the variables
at the 1% level.
Table 1 shows the summary statistics, and Table 11 shows all variable definitions. The sample
size of 14915 is considerably larger than that in many other countries with comply-or-explain
rules: for example, it is 122 in Germany (Goncharov, Werner and Zimmermann, 2006); 57 in
Spain (Fernández‐Rodríguez, Gómez‐Ansón and Cuervo‐García, 2004); and 518 in Mexico
(Price, Román, and Rountree, 2011). This large sample size enables various subsample analyses
to understand the effect of such regulations better. The average firm in our sample has 1.6
outside directors which corresponds with a 18% ratio of outside directors to board size. It is
also shown that the average firm in our sample is 367 billion JPY in size and about 51% levered.
~ Table 1 about here ~

12
4. Empirical Findings4.1. Baseline Results
Table 2 presents the first stage estimation results. The results unambiguously show that
following the introduction of the Code, both the number of outside directors and their
proportion in the board has increased significantly among the treated firms - at the 1% level in
all specifications. In particular, Panels D and E show that non-T12 firms have also increased
the number/ratio of outside directors. The magnitudes of the coefficient on 𝑇𝑟𝑒𝑎𝑡𝑖 ∗ 𝐴𝑓𝑡𝑒𝑟𝑡
are broadly comparable across firms in different sections. This finding suggests that the Code
affected both target and non-target firms’ board composition as suggested in Figure 1.
~ Table 2 about here ~
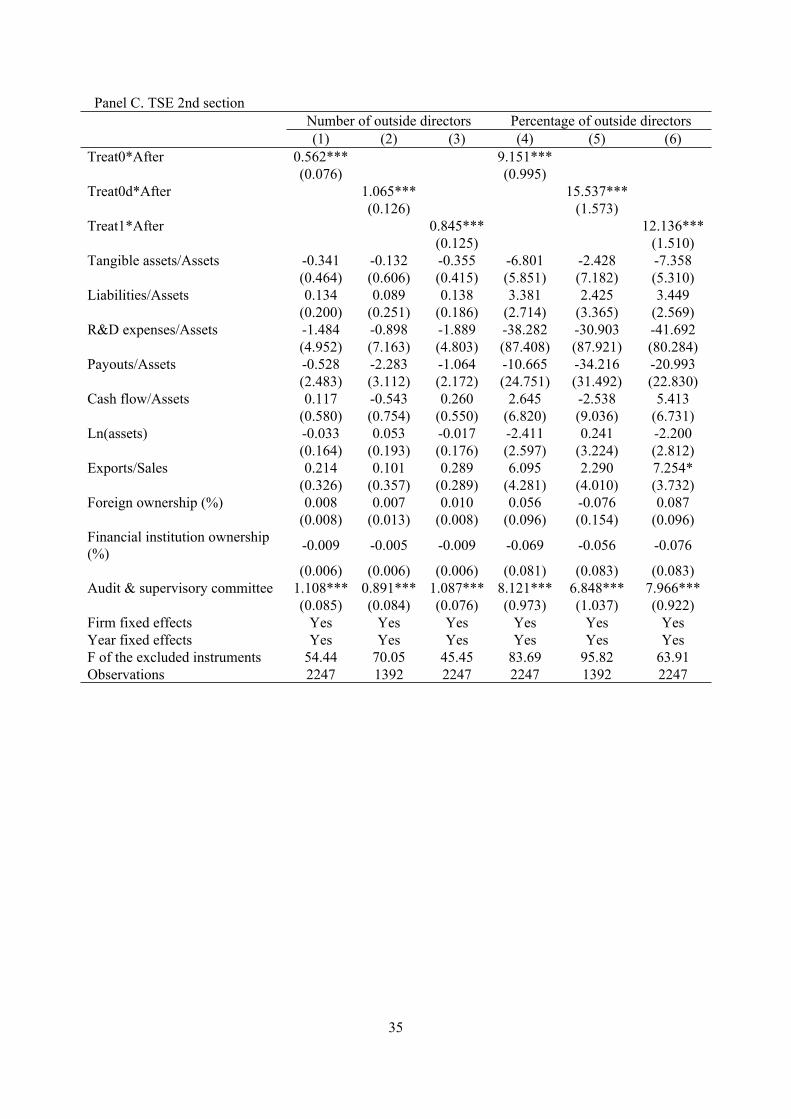
Next, we investigate the negative impact the rise in outside directors has on firm value, with
results reported in Panel A of Table 3. Each column reports the second stage estimation result
that corresponds to the first stage estimation in Table 2. For example, column (1) of Table 3
uses as the instrument. We observe the negative impact at the 1% level in 𝑇𝑟𝑒𝑎𝑡0𝑖 ∗ 𝐴𝑓𝑡𝑒𝑟𝑡
all specifications. The findings are economically significant. A change in outside directors from
zero to two and one to two respectively reduces firm value by 78.5 billion and 31.2 billion Yen
from columns (1) and (3) of Panel A. Bearing in mind Fauver et al. (2017)’s finding that
introducing a comply or explain increases firm value by 0.18 of Tobin’s Q, our results suggest
that the negative cultural pressure in Japan is large enough to reverse the sign of the effect.
Standard deviation of Tobin’s Q is three times larger in Fauver et al. (2017) than in our paper.
Considering this difference makes the negative economic significance of our paper even larger
relative to their results. Among other variables, we notice that foreign ownership has a
significant and positive impact on Tobin’s Q.
~ Table 3 about here ~
These results are consistent with the empirical evidence in support of smaller boards (see, for
example, Yermack, 1996) and may highlight the underlying problems of larger boards such as
poor communication and ineffective decision making. In addition, we argue that any change in
board composition in response to regulatory requirements is, by nature, a reactionary move
rather than a proactive and organic decision made by the management for the sole benefit of

13
the firm. Another possibility is that it is not clear to the market whether companies judge that
they should comply with the Code or respond to conformity pressure.
4.2. Board Independence and Firm Value in Different Market Sections
Now we turn our attention to the different market sections present in the sample. Panels B to E
of Table 3 shows these effects clustered by market section. While we notice a reduction in firm
value across the board, this reduction is not statistically significant among T2 firms. Among
non-T2 TSE firms, the negative effect is generally larger when we define the treated firms with
no outside directors prior to the reform (i.e., specifications 1, 2, 4, and 5). In contrast, among
non-TSE firms, firm value declines significantly when the number rises from one to two (i.e.,
specifications 3 and 6). This suggests that appointing two outside directors, under cultural
influences we describe in this paper, has a markedly negative impact on these firms.
We provide further support for our hypothesis, exploiting differences between T1 and non-T1
firms. Most firms in the T1 section are industry leaders and those in non-T1 section are
relatively small. We expect the former’s decision leads to the latter’s compliance. We construct
an additional instrument: an interaction term of the lagged average compliance rate of T1 firms
in the industry and . Table 4 first shows that industry pressure measured by 𝑇𝑟𝑒𝑎𝑡𝑖 ∗ 𝐴𝑓𝑡𝑒𝑟𝑡
this variable encourages non-T1 firms’ decision to appoint outside directors. It also reports that
this decision reduces firm value. The magnitude is larger especially among non-T12 TSE firms.
These findings are consistent with our hypothesis of overcompliance among non-T1 firms
following the lead of T1 firms in complying with the code, and this mimicking is detrimental
to firm value.
~ Table 4 about here ~
4.3. Firm Attributes, Value and Board Independence
Table 5 shows the effect clustered by firm age. We divide firms into young and mature clusters.
We categorise firms in to these two groups based on comparison with fixed age thresholds (40,
45 and 50) suitable for the Japanese context. The findings suggest that value of young firms
declined more than old firms on average (i.e., across all listed firms) in all specifications. This
is consistent with our general finding that culture-induced governance compliance is most
damaging to less established firms.

14
~ Table 5 about here ~
We also look at the level of R&D investment and divide firms into two groups compared to
firm medians. Results are illustrated in Table 6.
~ Table 6 about here ~
Importantly, the reduction in firm value is larger when the firm is more R&D-intensive on
average in Panel A. This finding suggests that the cultural pressure to conform and comply
exerts a particularly large negative effect on firms in their growth phase. In other words, these
are the firms that should not prioritise compliance with the voluntary code and instead should
focus on their investments and attention on their complex growth journeys. Consequently, the
firms which are more R&D intensive are not necessarily better off by recruiting outside
directors in order to comply with the Code. This finding is also in line with Balsmeier, Fleming,
and Manso (2017) reporting that outside directors discourage explorative innovation.
Table 6 provides further support for our cultural explanation. We observe the negative effect
among R&D-intensive firms especially among T1 ones. Given that these firms should be
industry leaders even among T1 firms, this finding supports our argument that these leaders
react to the governmental policy due to respect for authority.
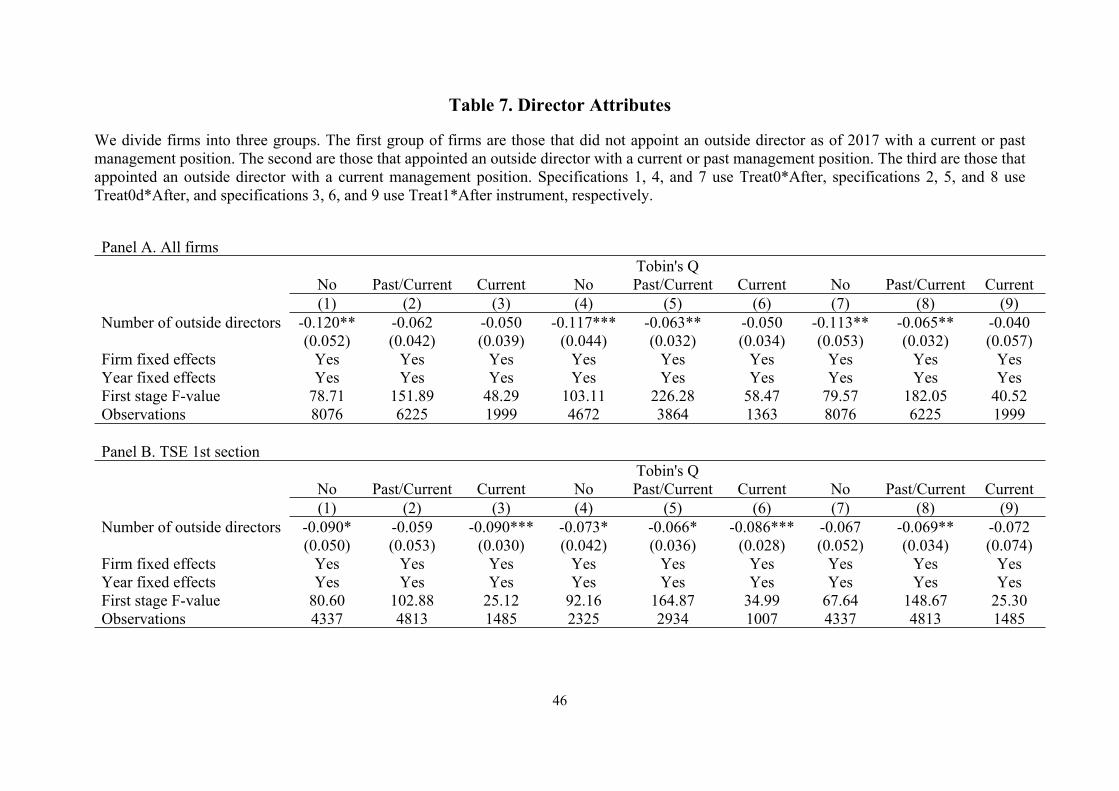
4.4. Director Attributes, Value and Board Independence
Prior literature measures the quality of board advice using the connections that a director has
with other firms at any given time. The focus is often on such connections because they arise
when a director has qualities that make them valuable to many firms as CEO directors (see,
Coles, Daniel, and Naveen, 2012; Nguyen, Hagendorff and Eshraghi, 2017; Fich 2005).
Table 7 shows the results by director characteristics. We find that this reduction in firm value
is larger when the firm appoints outside directors who are/were not managers of other firms. In
other words, outside directors with more expertise, better information and contacts are a better
investment for the firm, although not, in aggregate, sufficient to counteract the negative impact
of overcompliance as previously discussed. On average and particularly for non-T1 firms,

15
appointing outside directors with past experience or current positions is a better strategy than
appointing non-experienced directors. This negative effect among non-T1 firms also suggests
that they were less successful in appointing qualified outside directors due to their scarce supply
(Masulis and Mobbs, 2014).
~ Table 7 about here ~
5. Robustness testsIn this section, we conduct additional analysis to improve the robustness of our findings. First,
we run the main test for firms that were listed on the Osaka Stock Exchange (OSE) and were
forced to move to TSE as a result of a merger of OSE with TSE. In July 2012 a planned merger
with the TSE was approved by the Japan Fair Trade Commission and it was implemented in
the coming year. As a consequence, these firms became directly subject to the Code.
As Table 8 illustrates, the results remain qualitatively similar. We observe this pattern
especially among firms in the first or second sections of OSE. This finding suggests that firm
value declines among relatively mature firms that previously listed their stocks on Osaka Stock
Exchange. It is important to note that the listing requirements of OSE and TSE are mainly
similar.
~ Table 8 about here ~
We then turn our attention from the number of outside directors to board size, i.e., the total
number of directors. A rise in the number of outside directors can increase board size so the
two variables may be positively correlated. Alternatively, firms can replace outside directors
with inside directors to hold board size constant.
~ Table 9 about here ~
In Table 9, we replace the number of outside directors to that of all directors in equations (1)
and (2). This table demonstrates that the Code increases board size on average, which in turn
has a negative impact on Tobin’s Q. This is particularly true for T1 firms.

16
In addition, we run a placebo test to find the sensitivity of the results to the year the reforms
were introduced. Using eight-year periods in each specification, we have four years both before
and after the reform. Therefore, we assume that the reforms were implemented in 2008 or 2009
to avoid including periods after the introduction of the Code. As expected, the results in Table
10 do not indicate any significant link between the number of outside directors and firm value.
Further, the instruments do not have explanatory power on the appointment of outside directors.
~ Table 10 about here ~
6. ConclusionsRecent corporate governance scandals such as Petrobras in Brazil, Deutsche Bank and
Volkswagen in Germany, and Toshiba in Japan continue to drive the debate on the best form
of governance to mitigate corporate misconduct and increase firm value. Among the large
family of corporate governance approaches, voluntary codes in the form of comply or explain
have found increasing acceptance across the world. This comes with a challenge, however.
While voluntary approaches can help reduce poor governance, they are less effective in
promoting best governance practices (Haxhi and Aguilera, 2014).
This paper provides empirical evidence on the causal effects of disclosure regulation on market
outcomes – an underexplored area of the literature as discussed in Leuz and Wysocki (2016).
Unlike studies on voluntary disclosure that often face the problem of endogeneity, studies on
regulatory settings can use changes in regulation as exogenous shock to the corporate
information environment of the firm to avoid self-selection issues.
Drawing on the recent Japanese experience with voluntary codes of corporate governance, we
identify another area where comply or explain regimes may fail to be effective, or in Japan’s
case, have a negative effect. That is when, due to institutional and cultural pressures, a majority
of listed firms choose to comply, although they do not have to, and even though this comes at
the cost of lower shareholder value.
While the concept of national culture may pose definitional and measurement challenges for
large and diverse nations such as the US or China whose populations consist of many different
ethnicities and immigrant backgrounds, it does not so for Japan. For much of its history, Japan

17
remained uninvaded, and due to the isolationist foreign policy of the Japanese shogunate
(known as Sakoku meaning ‘closed country’), relations and trade with other countries were
severely limited for close to 250 years. This and several other reasons have resulted in a high
degree of ethnic, religious and cultural homogeneity among the Japanese, and importantly for
our research purposes, in the Japanese corporate sector and among its senior management.
Although we have not provided a clear channel through which compliance reduces firm value,
we can provide some conjectures. Apart from our finding that the Code has increased board
size, it may have also confused the shareholders. These regulations trust the companies to better
judge whether they should or should not comply with the corporate governance principles stated
in the code. However, it is not clear to the market whether their compliance is driven by
corporate fundamentals or a knee-jerk reaction to a regulatory change. Future research in this
area can usefully shed light on the nexus between national culture and institutional settings.

19
References
Aggarwal, R., Faccio, M., Guedhami, O. and Kwok, C.C., 2016. Culture and Finance: An Introduction. Journal of Corporate Finance, 100(41), pp.466-474.
Arcot, S., Bruno, V., and Faure-Grimaud, A., 2010. Corporate Governance in the UK: Is the Comply or Explain Approach Working? International Review of Law and Economics, 30(2), pp.193-201.
Atanasov, V. and Black, B., 2016. Shock-based Causal Inference in Corporate Finance and Accounting Research. Critical Finance Review, 5, pp.207-304.
Balsmeier, B., Fleming, L., and Manso, G., 2017. Independent Boards and Innovation. Journal of Financial Economics, 123(3), pp.536-557.
Boubakri, N. and Saffar, W., 2016. Culture and Externally Financed Firm Growth. Journal of Corporate Finance, 41, pp.502-520.
Bryan, S., Nash, R., and Patel, A., 2015. The Effect of Cultural Distance on Contracting Decisions: The Case of Executive Compensation. Journal of Corporate Finance, 33, pp.180-195
Chui, A.C.W., Lloyd, A.E., Kwok, C.C.Y., 2002. The Determination of Capital Structure: Is National Culture a Missing Piece to the Puzzle?. Journal of International Business Studies, 33(1), pp.99-127.
Coles, J., Daniel, N. and Naveen, L., 2012. Board Advising. working paper.
Cuomo, F., Mallin, C. and Zattoni, A., 2016. Corporate Governance Codes: A Review and Research Agenda, Corporate Governance: An International Review, 24(3), pp.222-241.
Dahya, J. and McConnell, J.J., 2007. Board Composition, Corporate Performance, and the Cadbury Committee Recommendation. Journal of Financial and Quantitative Analysis, 42(3), pp.535-564.
Davies, P., Ferrarini, G., Hopt, K., Pietrancosta, A., Skog, R., Soltysinski, S., Winter, J. and Wymeersch, E., 2011. Response to the European Commission’s Green Paper “The EU Corporate Governance Framework”. working paper.
Fahlenbrach, R., Low, A., and Stulz, R.M., 2010. Why Do Firms Appoint CEOs as Outside Directors?. Journal of Financial Economics, 97(1), pp.12-32.
Fahlenbrach, R., Minton, B.A., and Pan, C.H., 2011. Former CEO Directors: Lingering CEOs or Valuable Resources?. Review of Financial Studies, 24(10), pp.3486-3518.
Fauver, L. and Fuerst, M.E., 2006. Does good corporate governance include employeerepresentation? Evidence from German corporate boards. Journal of financial economics, 82(3), pp.673-710.

20
Fernández‐Rodríguez, F., Gómez‐Ansón, S., and Cuervo‐García, Á., 2004, The Stock Market Reaction to the Introduction of Best Practices Codes by Spanish Firms. Corporate Governance: An International Review, 12(1), pp.29-46.
Fich, E.M., 2005, Are Some Outside Directors Better than Others? Evidence from Director Appointments by Fortune 1000 Firms. Journal of Business, 78(5), pp.1943-1972.
Frijins, B., Dodd, O. and Cimerova, H., 2016. The Impact of Cultural Diversity in Corporate Boards on Firm Performance, Journal of Corporate Finance, 41, pp.521-541.
Goncharov, I., Werner, J.R., and Zimmermann, J., 2006. Does Compliance with the German Corporate Governance Code Have an Impact on Stock Valuation? An Empirical Analysis. Corporate Governance: An International Review, 14(5), pp.432-445.
Grinblatt, M. and Keloharju, M., 2001. How Distance, Language, and Culture Influence Stockholdings and Trades. The Journal of Finance, 56(3), pp.1053-1073.
Haxhi, I. and Aguilera, R.V., 2017. An Institutional Configurational Approach to Cross‐national Diversity in Corporate Governance. Journal of Management Studies, 54(3), pp.261-303.
Holderness, C.G., 2017. Culture and the Ownership Concentration of Public Corporations around the World. Journal of Corporate Finance, 44, pp.469-486.
Jensen, M.C. and Meckling, W.H., 1976. Theory of the Firm: Managerial Behavior, Agency Costs and Ownership Structure. Journal of Financial Economics, 3(4), pp.305-360.
Karolyi, G.A., 2016. The Gravity of Culture for Finance. Journal of Corporate Finance, 41, pp.610-625.
Krenn, M., 2014. Decoupling as a Sustainable Firm Response to Pressures for Convergence and Divergence in Corporate Governance: The Case of Codes of Good Corporate Governance. Journal of Management Policy and Practice, 15(4), p.103.
Li, J. and Harrison, J.R., 2008. National Culture and the Composition and Leadership Structure of Boards of Directors. Corporate Governance: An International Review, 16(5), pp.375-385.
Leuz, C. and Wysocki, P.D., 2016. The Economics of Disclosure and Financial Reporting regulation: Evidence and Suggestions for Future Research. Journal of Accounting Research, 54(2), pp.525-622.
Luo, Y. and Salterio, S.E., 2014. Governance Quality in a “Comply or Explain” Governance Disclosure Regime. Corporate Governance: An International Review, 22(6), pp.460-481.
Masulis, R.W. and Mobbs, S., 2014. Independent Director Incentives: Where Do Talented Directors Spend Their Limited Time and Energy?, Journal of Financial Economics, 111(2), pp.406-429.

21
Morck, R., 2008. Behavioral Finance in Corporate Governance: Economics and Ethics of the Devil’s Advocate. Journal of Management & Governance, 12(2), pp.179-200.
Nakano, M. and Nguyen, P., 2012. Board Size and Corporate Risk Taking: Further Evidence from Japan. Corporate Governance: An International Review, 20(4), pp.369-387.
Nguyen, D.D., Hagendorff, J. and Eshraghi, A., 2015. Can Bank Boards Prevent Misconduct? Review of Finance, 20(1), pp.1-36.
Nowland, J., 2008. The Effect of National Governance Codes on Firm Disclosure Practices: Evidence from Analyst Earnings Forecasts. Corporate Governance: An International Review, 16(6), pp.475-491.
Price, R., Román, F.J., and Rountree, B., 2011, The Impact of Governance Reform on Performance and Transparency. Journal of Financial Economics, 99(1), pp.76-96.
Schwartz, S.H., 1994. Beyond Individualism/Collectivism: New Cultural Dimensions of Values. In Kim, U., Triandis, H. C., Kâğitçibaşi, Ç., Choi, S.-C., and Yoon G. (Eds.), Cross-cultural Research and Methodology Series, Vol. 18. Individualism and Collectivism: Theory, Method, and Applications (pp. 85-119). Thousand Oaks, CA, US: Sage Publications, Inc.
Shao, L., Kwok, C.C.Y., and Guedhami, O., 2010. National Culture and Dividend Policy. Journal of International Business Studies, 41(8), pp.1391-1414.
Shao, L., Kwok, C.C. and Zhang, R., 2013. National Culture and Corporate Investment. Journal of International Business Studies, 44(7), pp.745-763.
Stulz, R.M. and Williamson, R., 2003. Culture, Openness, and Finance. Journal of Financial Economics, 70(3), pp.313-349.
Yermack, David, 1996. Higher Market Valuation of Companies with a Small Board of Directors, Journal of Financial Economics, 40(2), pp.185-211.
Zattoni, A. and Cuomo, F., 2008. Why Adopt Codes of Good Governance? A Comparison of Institutional and Efficiency Perspectives. Corporate Governance: An International Review, 16(1), pp.1-15.

22
Figure 1. Changes in Board Composition, Board Size and Compliance Rate
These figures show the change in the board composition, board size and compliance rate among all firms, firms that list their stocks on the first section of the Tokyo Stock Exchange (TSE-1st firms), TSE-2nd, TSE-other, and non-TSE firms between 2003 and 2017.
Figure 1A. Number of Outside Directors
2 0 0 3 2 0 0 4 2 0 0 5 2 0 0 6 2 0 0 7 2 0 0 8 2 0 0 9 2 0 1 0 2 0 1 1 2 0 1 2 2 0 1 3 2 0 1 4 2 0 1 5 2 0 1 6 2 0 1 70
1
2
3
All TSE-1st TSE-2nd TSE-other Non-TSE

23
Figure 1B. Percentage of Outside Directors
2 0 0 3 2 0 0 4 2 0 0 5 2 0 0 6 2 0 0 7 2 0 0 8 2 0 0 9 2 0 1 0 2 0 1 1 2 0 1 2 2 0 1 3 2 0 1 4 2 0 1 5 2 0 1 6 2 0 1 7
-10%
0%
10%
20%
30%
All TSE-1st TSE-2nd TSE-other Non-TSE

24
Figure 1C. Compliance Rate
2 0 0 3 2 0 0 4 2 0 0 5 2 0 0 6 2 0 0 7 2 0 0 8 2 0 0 9 2 0 1 0 2 0 1 1 2 0 1 2 2 0 1 3 2 0 1 4 2 0 1 5 2 0 1 6 2 0 1 70%
20%
40%
60%
80%
100%
All TSE-1st TSE-2nd TSE-other Non-TSE

25
Figure 1D. Number of Total Directors
2 0 0 3 2 0 0 4 2 0 0 5 2 0 0 6 2 0 0 7 2 0 0 8 2 0 0 9 2 0 1 0 2 0 1 1 2 0 1 2 2 0 1 3 2 0 1 4 2 0 1 5 2 0 1 6 2 0 1 76
7
8
9
10
11
All TSE-1st TSE-2nd TSE-other Non-TSE

26
Figure 2. Cultural Comparison between Japan and the US
This figure provides a comparison of the six cultural measures of Hofstede between Japan and the United States.
0
50
100
Power Distance Individualism Masculinity Uncertainty Avoidance Long Term Orientation Indulgence
Japan U.S.

27
Figure 3. Compliance and Conformity in Japanese Culture
This figure shows a long orderly line formed following a train evacuation in Japan.

28
Table 1. Summary Statistics
This table reports summary statistics for the entire sample from 2010 to 2017.
Panel A. All firms Mean SD Min Median Max Obs.Tobin’s Q 1.075 0.537 0.436 0.944 5.488 14915Number of outside directors 1.560 1.288 0.000 1.000 6.000 14915Percentage of outside directors 18.434 14.549 0.000 16.667 62.500 14915Number of total directors 8.446 2.974 3.000 8.000 19.000 14915Tangible assets/Assets 0.292 0.183 0.005 0.273 0.855 14915Liabilities/Assets 0.511 0.207 0.098 0.507 1.151 14915R&D expenses/Assets 0.014 0.021 0.000 0.005 0.112 14915Payouts/Assets 0.013 0.015 0.000 0.008 0.111 14915Cash flow/Assets 0.063 0.048 -0.141 0.060 0.260 14915Ln(assets) 11.023 1.659 7.378 10.822 15.662 14915Exports/Sales 0.182 0.260 0.000 0.000 1.175 14915Foreign ownership (%) 11.506 11.947 0.000 7.335 50.147 14915Financial institution ownership (%) 19.385 12.452 0.036 17.614 50.584 14915Audit & supervisory committee 0.088 0.284 0.000 0.000 1.000 14915Firm age 58.968 23.960 3.000 62.000 121.000 14915

29
Panel B. TSE 1st section Mean SD Min Median Max Obs.Tobin’s Q 1.099 0.502 0.436 0.972 5.488 9504Number of outside directors 1.758 1.316 0.000 2.000 6.000 9504Percentage of outside directors 19.526 14.288 0.000 20.000 62.500 9504Number of total directors 9.124 2.989 3.000 9.000 19.000 9504Tangible assets/Assets 0.298 0.182 0.005 0.275 0.855 9504Liabilities/Assets 0.517 0.201 0.098 0.511 1.151 9504R&D expenses/Assets 0.016 0.022 0.000 0.007 0.112 9504Payouts/Assets 0.014 0.016 0.000 0.010 0.111 9504Cash flow/Assets 0.068 0.044 -0.141 0.064 0.260 9504Ln(assets) 11.781 1.483 7.378 11.567 15.662 9504Exports/Sales 0.221 0.277 0.000 0.079 1.175 9504Foreign ownership (%) 15.638 12.054 0.000 13.162 50.147 9504Financial institution ownership (%) 24.593 11.346 0.055 24.153 50.584 9504Audit & supervisory committee 0.082 0.275 0.000 0.000 1.000 9504Firm age 62.454 24.374 3.000 65.000 121.000 9504

30
Panel C. TSE 2nd section Mean SD Min Median Max Obs.Tobin’s Q 0.919 0.418 0.436 0.834 5.488 2247Number of outside directors 1.283 1.141 0.000 1.000 6.000 2247Percentage of outside directors 16.756 14.142 0.000 16.667 60.000 2247Number of total directors 7.664 2.574 3.000 7.000 19.000 2247Tangible assets/Assets 0.309 0.178 0.005 0.293 0.855 2247Liabilities/Assets 0.510 0.199 0.101 0.507 1.151 2247R&D expenses/Assets 0.009 0.013 0.000 0.004 0.096 2247Payouts/Assets 0.009 0.011 0.000 0.007 0.111 2247Cash flow/Assets 0.054 0.047 -0.141 0.051 0.260 2247Ln(assets) 9.914 0.797 7.378 9.931 13.369 2247Exports/Sales 0.105 0.181 0.000 0.000 0.997 2247Foreign ownership (%) 3.938 7.159 0.000 0.969 49.891 2247Financial institution ownership (%) 11.883 8.628 0.036 10.289 50.584 2247Audit & supervisory committee 0.106 0.308 0.000 0.000 1.000 2247Firm age 62.902 19.462 3.000 65.000 121.000 2247
31
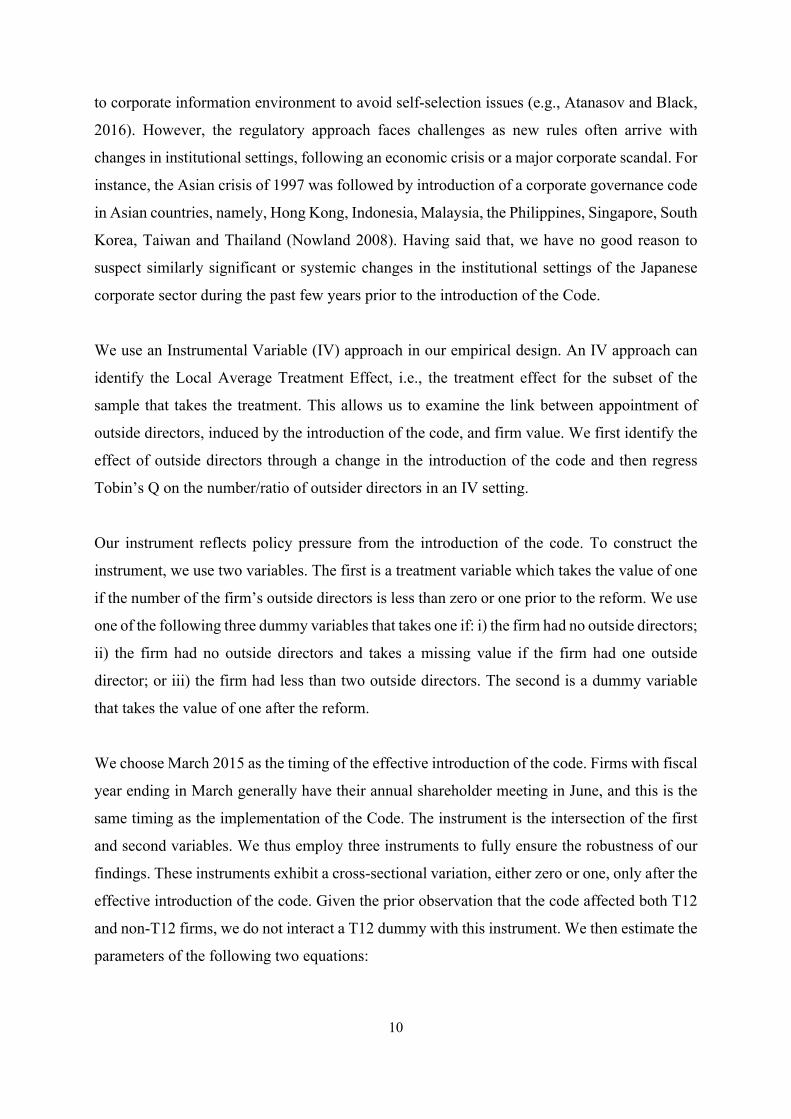
Panel D. TSE other sections Mean SD Min Median Max Obs.Tobin’s Q 1.151 0.703 0.436 0.920 5.488 2743Number of outside directors 1.128 1.139 0.000 1.000 6.000 2743Percentage of outside directors 16.429 15.410 0.000 14.286 62.500 2743Number of total directors 6.706 2.233 3.000 6.000 18.000 2743Tangible assets/Assets 0.249 0.185 0.005 0.227 0.855 2743Liabilities/Assets 0.488 0.224 0.098 0.491 1.151 2743R&D expenses/Assets 0.012 0.022 0.000 0.001 0.112 2743Payouts/Assets 0.012 0.016 0.000 0.007 0.111 2743Cash flow/Assets 0.058 0.060 -0.141 0.055 0.260 2743Ln(assets) 9.442 1.002 7.378 9.451 13.251 2743Exports/Sales 0.132 0.244 0.000 0.000 1.175 2743Foreign ownership (%) 4.757 7.943 0.000 1.244 50.147 2743Financial institution ownership (%) 7.818 6.799 0.036 6.142 44.155 2743Audit & supervisory committee 0.091 0.288 0.000 0.000 1.000 2743Firm age 44.229 19.977 3.000 45.000 118.000 2743

32
Panel E. Non-TSE Mean SD Min Median Max Obs.Tobin’s Q 0.873 0.409 0.436 0.799 3.995 421Number of outside directors 1.359 1.297 0.000 1.000 6.000 421Percentage of outside directors 15.800 14.224 0.000 15.385 62.500 421Number of total directors 8.641 3.234 3.000 8.000 19.000 421Tangible assets/Assets 0.334 0.164 0.006 0.323 0.855 421Liabilities/Assets 0.544 0.244 0.098 0.523 1.151 421R&D expenses/Assets 0.003 0.006 0.000 0.000 0.033 421Payouts/Assets 0.007 0.009 0.000 0.005 0.111 421Cash flow/Assets 0.053 0.039 -0.137 0.049 0.236 421Ln(assets) 10.124 1.167 7.378 10.358 12.823 421Exports/Sales 0.052 0.128 0.000 0.000 0.945 421Foreign ownership (%) 2.567 4.912 0.000 0.217 28.225 421Financial institution ownership (%) 17.234 10.017 0.036 17.394 36.153 421Audit & supervisory committee 0.114 0.318 0.000 0.000 1.000 421Firm age 55.316 22.874 3.000 62.000 111.000 421

33
Table 2. Change in Number and Percentage of Outside Directors
This table illustrates the change in the number and ratio of outside directors following the Japan’s corporate governance reform.
Panel A. All firms Number of outside directors Percentage of outside directors (1) (2) (3) (4) (5) (6)Treat0*After 0.437*** 7.950***
(0.033) (0.431)Treat0d*After 0.755*** 12.507***
(0.046) (0.566)Treat1*After 0.612*** 9.702***
(0.041) (0.487)Tangible assets/Assets 0.123 -0.094 0.049 -1.590 -3.461 -2.787
(0.182) (0.238) (0.175) (2.433) (3.000) (2.324)Liabilities/Assets -0.195* -0.094 -0.171* -1.160 0.324 -0.784
(0.103) (0.141) (0.100) (1.424) (1.936) (1.399)R&D expenses/Assets -0.508 -0.087 -1.197 18.264 25.246 8.360
(1.590) (1.910) (1.550) (21.628) (25.913) (21.336)Payouts/Assets 1.144 1.497* 1.123* 8.934 16.255 7.277
(0.717) (0.902) (0.681) (9.154) (10.890) (8.746)Cash flow/Assets -0.299 -0.330 -0.152 -3.981 -4.181 -1.237
(0.221) (0.299) (0.217) (2.985) (3.767) (2.940)Ln(assets) 0.151** 0.161* 0.128** -0.270 -0.581 -0.732
(0.067) (0.089) (0.065) (0.941) (1.214) (0.916)Exports/Sales -0.021 0.024 0.001 -0.142 0.606 0.167
(0.097) (0.119) (0.090) (1.398) (1.638) (1.301)Foreign ownership (%) 0.013*** 0.012*** 0.013*** 0.132*** 0.116** 0.122***
(0.003) (0.004) (0.003) (0.035) (0.048) (0.032)Financial institution ownership (%) 0.001 0.002 0.001 -0.008 -0.022 -0.009
(0.003) (0.003) (0.003) (0.033) (0.043) (0.033)Audit & supervisory committee 1.372*** 1.269*** 1.344*** 10.675*** 9.880*** 10.385***
(0.041) (0.055) (0.040) (0.515) (0.692) (0.501)Firm fixed effects Yes Yes Yes Yes Yes YesYear fixed effects Yes Yes Yes Yes Yes YesF of the excluded instruments 175.43 270.93 223.02 339 486.11 395.92Observations 14915 8937 14915 14915 8937 14915

34
Panel B. TSE 1st section Number of outside directors Percentage of outside directors (1) (2) (3) (4) (5) (6)
Treat0*After 0.546*** 8.804***(0.042) (0.534)
Treat0d*After 0.861*** 13.154***(0.054) (0.645)
Treat1*After 0.646*** 9.444***(0.045) (0.519)
Tangible assets/Assets 0.421* 0.033 0.367 2.529 -0.704 1.852(0.248) (0.331) (0.237) (3.259) (3.990) (3.097)
Liabilities/Assets -0.383*** -0.303 -0.314** -3.718** -2.719 -2.706
(0.141) (0.194) (0.135) (1.855) (2.420) (1.743)R&D expenses/Assets 1.835 2.173 0.612 50.241** 51.585* 32.713
(1.723) (1.993) (1.710) (22.966) (27.717) (23.403)Payouts/Assets 0.995 1.687* 1.046 13.132 23.173** 13.172
(0.759) (0.934) (0.717) (9.894) (10.999) (9.314)Cash flow/Assets -0.322 -0.322 -0.150 -2.897 -3.924 -0.188
(0.299) (0.400) (0.298) (3.998) (5.342) (3.954)Ln(assets) 0.348*** 0.359*** 0.279*** 1.919 0.806 0.858
(0.094) (0.130) (0.091) (1.253) (1.703) (1.172)Exports/Sales -0.098 -0.015 -0.083 -0.971 0.164 -0.797
(0.108) (0.131) (0.103) (1.558) (1.904) (1.512)Foreign ownership (%) 0.004 0.003 0.003 0.045 0.034 0.032
(0.004) (0.005) (0.003) (0.039) (0.050) (0.036)Financial institution ownership (%) -0.003 0.000 -0.003 -0.051 -0.046 -0.050
(0.003) (0.004) (0.003) (0.039) (0.056) (0.038)Audit & supervisory committee 1.329*** 1.222*** 1.296*** 9.418*** 8.161*** 9.060***
(0.054) (0.080) (0.053) (0.661) (0.957) (0.644)Firm fixed effects Yes Yes Yes Yes Yes YesYear fixed effects Yes Yes Yes Yes Yes YesF of the excluded instruments 171.33 254.21 205.24 271.23 414.29 330.07Observations 9504 5485 9504 9504 5485 9504
35
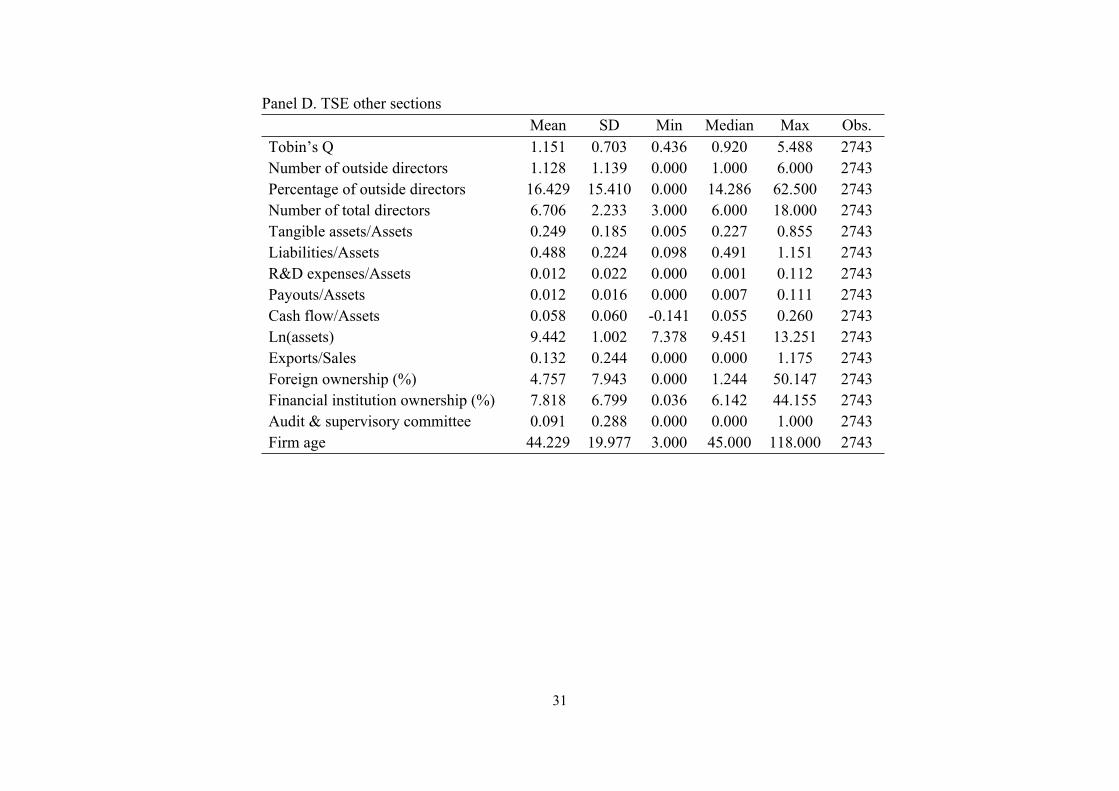
Panel C. TSE 2nd section Number of outside directors Percentage of outside directors (1) (2) (3) (4) (5) (6)
Treat0*After 0.562*** 9.151***(0.076) (0.995)
Treat0d*After 1.065*** 15.537***(0.126) (1.573)
Treat1*After 0.845*** 12.136***(0.125) (1.510)
Tangible assets/Assets -0.341 -0.132 -0.355 -6.801 -2.428 -7.358(0.464) (0.606) (0.415) (5.851) (7.182) (5.310)
Liabilities/Assets 0.134 0.089 0.138 3.381 2.425 3.449(0.200) (0.251) (0.186) (2.714) (3.365) (2.569)
R&D expenses/Assets -1.484 -0.898 -1.889 -38.282 -30.903 -41.692(4.952) (7.163) (4.803) (87.408) (87.921) (80.284)
Payouts/Assets -0.528 -2.283 -1.064 -10.665 -34.216 -20.993(2.483) (3.112) (2.172) (24.751) (31.492) (22.830)
Cash flow/Assets 0.117 -0.543 0.260 2.645 -2.538 5.413(0.580) (0.754) (0.550) (6.820) (9.036) (6.731)
Ln(assets) -0.033 0.053 -0.017 -2.411 0.241 -2.200(0.164) (0.193) (0.176) (2.597) (3.224) (2.812)
Exports/Sales 0.214 0.101 0.289 6.095 2.290 7.254*(0.326) (0.357) (0.289) (4.281) (4.010) (3.732)
Foreign ownership (%) 0.008 0.007 0.010 0.056 -0.076 0.087(0.008) (0.013) (0.008) (0.096) (0.154) (0.096)
Financial institution ownership (%) -0.009 -0.005 -0.009 -0.069 -0.056 -0.076
(0.006) (0.006) (0.006) (0.081) (0.083) (0.083)Audit & supervisory committee 1.108*** 0.891*** 1.087*** 8.121*** 6.848*** 7.966***
(0.085) (0.084) (0.076) (0.973) (1.037) (0.922)Firm fixed effects Yes Yes Yes Yes Yes YesYear fixed effects Yes Yes Yes Yes Yes YesF of the excluded instruments 54.44 70.05 45.45 83.69 95.82 63.91Observations 2247 1392 2247 2247 1392 2247

36
Panel D. TSE other sections Number of outside directors Percentage of outside directors (1) (2) (3) (4) (5) (6)
Treat0*After 0.489*** 8.247***(0.074) (1.135)
Treat0d*After 0.920*** 15.348***(0.139) (1.928)
Treat1*After 0.793*** 13.275***(0.135) (1.807)
Tangible assets/Assets 0.137 -0.222 0.022 -4.892 -7.492 -6.823(0.282) (0.371) (0.297) (4.572) (5.949) (4.699)
Liabilities/Assets 0.012 0.179 -0.057 1.314 4.512 0.156(0.171) (0.248) (0.176) (2.883) (4.363) (3.010)
R&D expenses/Assets -3.734 -2.710 -2.134 -45.074 -20.861 -18.262(2.594) (3.245) (2.322) (41.560) (46.972) (39.731)
Payouts/Assets 1.263 0.435 0.851 -3.355 -4.100 -10.300(1.783) (2.206) (1.713) (23.346) (29.852) (22.632)
Cash flow/Assets -0.343 0.082 -0.157 -6.927 -1.660 -3.790(0.355) (0.474) (0.345) (5.679) (6.531) (5.644)
Ln(assets) -0.021 -0.006 0.001 -1.567 -1.680 -1.214(0.092) (0.135) (0.098) (1.469) (2.050) (1.588)
Exports/Sales -0.324* -0.193 -0.227 -5.656* -3.154 -4.017(0.187) (0.232) (0.174) (2.938) (2.917) (2.590)
Foreign ownership (%) 0.016** 0.013 0.016*** 0.212** 0.186 0.208***(0.006) (0.008) (0.006) (0.087) (0.113) (0.075)
Financial institution ownership (%) 0.014** 0.009 0.015** 0.129 0.054 0.136
(0.006) (0.007) (0.006) (0.091) (0.096) (0.083)Audit & supervisory committee 1.692*** 1.649*** 1.681*** 16.157*** 16.054*** 15.975***
(0.093) (0.100) (0.089) (1.357) (1.631) (1.333)Firm fixed effects Yes Yes Yes Yes Yes YesYear fixed effects Yes Yes Yes Yes Yes YesF of the excluded instruments 43.24 43.17 34.41 52.33 62.46 53.51Observations 2743 1757 2743 2743 1757 2743

37
Panel E. Non-TSE Number of outside directors Percentage of outside directors (1) (2) (3) (4) (5) (6)
Treat0*After 0.540*** 7.576***(0.140) (1.699)
Treat0d*After 0.899*** 11.994***(0.165) (1.927)
Treat1*After 0.736*** 10.100***(0.151) (1.989)
Tangible assets/Assets -1.308** -1.694** -1.440** -8.530 -15.509 -10.271(0.639) (0.830) (0.576) (9.551) (12.474) (8.720)
Liabilities/Assets 0.602 0.696 0.691 9.881 11.495 11.072(0.518) (0.549) (0.429) (8.162) (10.171) (7.924)
R&D expenses/Assets -33.300 -3.541 -26.878 -334.820 -198.592 -249.278(24.618) (35.282) (28.127) (293.540) (473.261) (340.700)
Payouts/Assets -0.308 -2.695 -0.345 -16.061 -85.088 -16.577(4.046) (6.362) (4.018) (65.975) (132.577) (64.939)
Cash flow/Assets 2.037 2.000 2.590 -22.644 -16.318 -15.152(1.865) (1.909) (1.669) (27.686) (27.785) (24.360)
Ln(assets) -0.185 0.049 -0.188 -6.735** -2.565* -6.782*(0.146) (0.109) (0.194) (2.768) (1.422) (3.601)
Exports/Sales 0.191 -0.060 -0.008 -0.442 -2.638 -3.306(0.551) (0.462) (0.531) (6.193) (5.667) (5.783)
Foreign ownership (%) 0.018 0.001 0.016 0.174 -0.122 0.135(0.022) (0.025) (0.022) (0.234) (0.168) (0.223)
Financial institution ownership (%) -0.006 -0.015 0.002 -0.022 -0.072 0.086
(0.016) (0.024) (0.020) (0.189) (0.149) (0.158)Audit & supervisory committee 1.741*** 1.538*** 1.729*** 15.642*** 14.576*** 15.529***
(0.180) (0.202) (0.162) (2.150) (2.382) (2.015)Firm fixed effects Yes Yes Yes Yes Yes YesYear fixed effects Yes Yes Yes Yes Yes YesF of the excluded instruments 13.98 27.41 22.43 18.72 35.61 24.28Observations 421 303 421 421 303 421
38
Table 3. Impact of Reforms on Firm Value
This table reports the impact of the rise in number and ratio of outside directors in firm value. Specifications 1 and 4 use Treat0*After, specifications 2 and 5 use Treat0d*After, and specifications 3 and 6 use Treat1*After instrument, respectively.
Panel A. All firms Tobin’s Q (1) (2) (3) (4) (5) (6)Number of outside directors -0.107*** -0.097*** -0.085***
(0.035) (0.028) (0.031)Percentage of outside directors -0.006*** -0.006*** -0.005***
(0.002) (0.002) (0.002)Tangible assets/Assets -0.620*** -0.582*** -0.623*** -0.643*** -0.593*** -0.642***
(0.096) (0.121) (0.096) (0.097) (0.123) (0.097)Liabilities/Assets 0.412*** 0.277*** 0.416*** 0.426*** 0.288*** 0.426***
(0.083) (0.102) (0.084) (0.084) (0.103) (0.084)R&D expenses/Assets -1.312* -1.619* -1.311* -1.150 -1.463 -1.164
(0.777) (0.877) (0.775) (0.778) (0.893) (0.772)Payouts/Assets 4.658*** 4.471*** 4.645*** 4.588*** 4.421*** 4.589***
(0.541) (0.726) (0.540) (0.537) (0.722) (0.537)Cash flow/Assets 1.170*** 1.166*** 1.173*** 1.179*** 1.174*** 1.179***
(0.175) (0.222) (0.174) (0.175) (0.222) (0.175)Ln(assets) -0.008 -0.012 -0.010 -0.025 -0.031 -0.025
(0.062) (0.084) (0.062) (0.063) (0.085) (0.063)Exports/Sales 0.050 0.047 0.051 0.051 0.048 0.052
(0.052) (0.072) (0.052) (0.052) (0.072) (0.052)Foreign ownership (%) 0.010*** 0.008*** 0.010*** 0.009*** 0.007*** 0.009***
(0.001) (0.002) (0.001) (0.001) (0.002) (0.001)Financial institution ownership (%) 0.017*** 0.017*** 0.017*** 0.017*** 0.017*** 0.017***
(0.002) (0.002) (0.002) (0.002) (0.002) (0.002)Audit & supervisory committee 0.168*** 0.152*** 0.136*** 0.084*** 0.087** 0.078**
(0.055) (0.049) (0.049) (0.030) (0.034) (0.030)Firm fixed effects Yes Yes Yes Yes Yes YesYear fixed effects Yes Yes Yes Yes Yes YesObservations 14915 8937 14915 14915 8937 14915

39
Panel B. TSE 1st section Tobin’s Q
(1) (2) (3) (4) (5) (6)Number of outside directors -0.079** -0.076*** -0.069**
(0.036) (0.026) (0.029)Percentage of outside directors -0.005** -0.005*** -0.005**
(0.002) (0.002) (0.002)Tangible assets/Assets -0.733*** -0.750*** -0.738*** -0.754*** -0.756*** -0.755***
(0.128) (0.164) (0.129) (0.130) (0.168) (0.131)Liabilities/Assets 0.214** 0.093 0.218** 0.226** 0.103 0.227**
(0.090) (0.129) (0.091) (0.090) (0.129) (0.091)R&D expenses/Assets -2.194** -2.662*** -2.216** -2.093** -2.571*** -2.105**
(0.899) (0.985) (0.891) (0.904) (0.993) (0.892)Payouts/Assets 4.780*** 4.590*** 4.775*** 4.766*** 4.578*** 4.765***
(0.622) (0.847) (0.623) (0.618) (0.844) (0.619)Cash flow/Assets 1.332*** 1.180*** 1.334*** 1.343*** 1.185*** 1.343***
(0.238) (0.331) (0.238) (0.238) (0.331) (0.238)Ln(assets) 0.169*** 0.110 0.165*** 0.151*** 0.087 0.150***
(0.059) (0.075) (0.058) (0.058) (0.076) (0.058)Exports/Sales 0.117** 0.161*** 0.118** 0.120** 0.163*** 0.120**
(0.047) (0.060) (0.047) (0.048) (0.061) (0.048)Foreign ownership (%) 0.009*** 0.008*** 0.009*** 0.009*** 0.008*** 0.009***
(0.002) (0.002) (0.002) (0.002) (0.002) (0.002)Financial institution ownership (%) 0.014*** 0.015*** 0.014*** 0.014*** 0.015*** 0.014***
(0.002) (0.003) (0.002) (0.002) (0.003) (0.002)Audit & supervisory committee 0.122** 0.123*** 0.106** 0.063** 0.071** 0.060**
(0.053) (0.047) (0.045) (0.031) (0.036) (0.030)Firm fixed effects Yes Yes Yes Yes Yes YesYear fixed effects Yes Yes Yes Yes Yes YesObservations 9504 5485 9504 9504 5485 9504
40
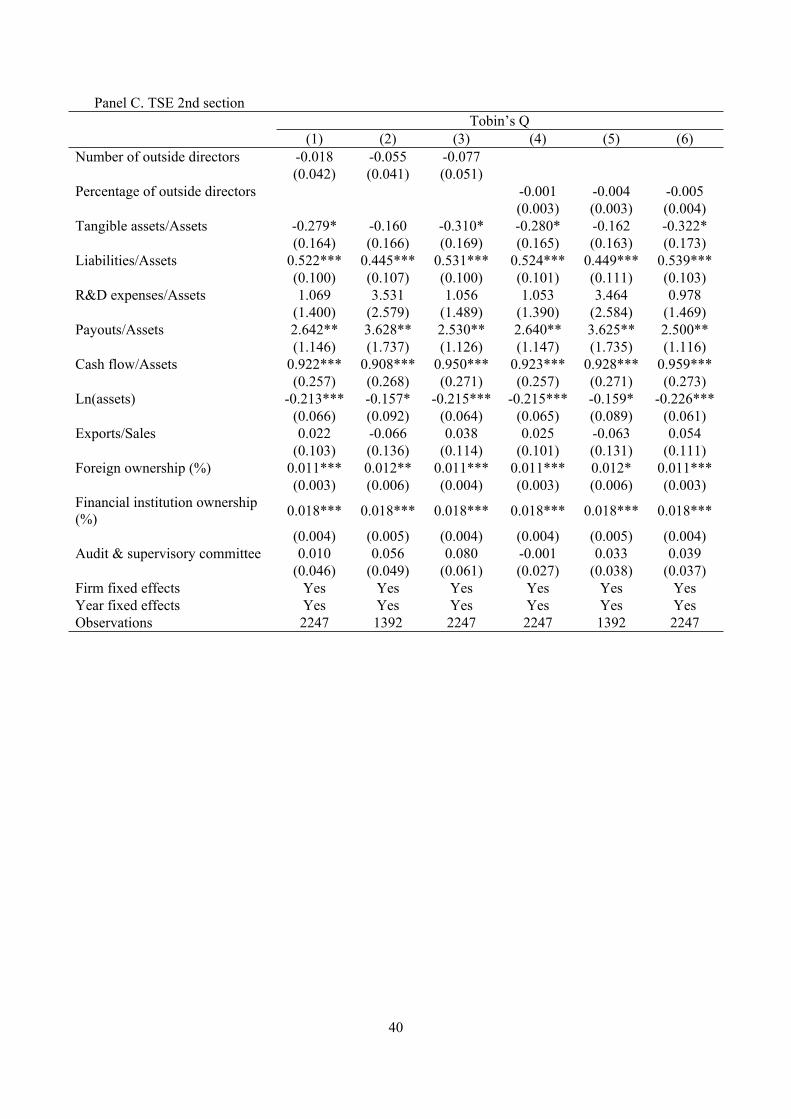
Panel C. TSE 2nd section Tobin’s Q (1) (2) (3) (4) (5) (6)
Number of outside directors -0.018 -0.055 -0.077(0.042) (0.041) (0.051)
Percentage of outside directors -0.001 -0.004 -0.005(0.003) (0.003) (0.004)
Tangible assets/Assets -0.279* -0.160 -0.310* -0.280* -0.162 -0.322*(0.164) (0.166) (0.169) (0.165) (0.163) (0.173)
Liabilities/Assets 0.522*** 0.445*** 0.531*** 0.524*** 0.449*** 0.539***(0.100) (0.107) (0.100) (0.101) (0.111) (0.103)
R&D expenses/Assets 1.069 3.531 1.056 1.053 3.464 0.978(1.400) (2.579) (1.489) (1.390) (2.584) (1.469)
Payouts/Assets 2.642** 3.628** 2.530** 2.640** 3.625** 2.500**(1.146) (1.737) (1.126) (1.147) (1.735) (1.116)
Cash flow/Assets 0.922*** 0.908*** 0.950*** 0.923*** 0.928*** 0.959***(0.257) (0.268) (0.271) (0.257) (0.271) (0.273)
Ln(assets) -0.213*** -0.157* -0.215*** -0.215*** -0.159* -0.226***(0.066) (0.092) (0.064) (0.065) (0.089) (0.061)
Exports/Sales 0.022 -0.066 0.038 0.025 -0.063 0.054(0.103) (0.136) (0.114) (0.101) (0.131) (0.111)
Foreign ownership (%) 0.011*** 0.012** 0.011*** 0.011*** 0.012* 0.011***(0.003) (0.006) (0.004) (0.003) (0.006) (0.003)
Financial institution ownership (%) 0.018*** 0.018*** 0.018*** 0.018*** 0.018*** 0.018***
(0.004) (0.005) (0.004) (0.004) (0.005) (0.004)Audit & supervisory committee 0.010 0.056 0.080 -0.001 0.033 0.039
(0.046) (0.049) (0.061) (0.027) (0.038) (0.037)Firm fixed effects Yes Yes Yes Yes Yes YesYear fixed effects Yes Yes Yes Yes Yes YesObservations 2247 1392 2247 2247 1392 2247

41
Panel D. TSE other sections Tobin’s Q (1) (2) (3) (4) (5) (6)
Number of outside directors -0.361*** -0.282** -0.256**(0.117) (0.115) (0.124)
Percentage of outside directors -0.021*** -0.017** -0.015**(0.007) (0.007) (0.007)
Tangible assets/Assets -0.459* -0.443* -0.461** -0.613*** -0.508* -0.571***(0.236) (0.265) (0.227) (0.236) (0.268) (0.220)
Liabilities/Assets 0.667*** 0.599** 0.667*** 0.691*** 0.625** 0.684***(0.203) (0.241) (0.199) (0.205) (0.250) (0.200)
R&D expenses/Assets -0.002 -0.275 0.342 0.381 0.136 0.609(2.109) (2.843) (2.078) (2.188) (3.003) (2.122)
Payouts/Assets 5.810*** 5.256*** 5.724*** 5.282*** 5.065*** 5.348***(1.490) (1.881) (1.413) (1.444) (1.865) (1.406)
Cash flow/Assets 0.806** 1.061** 0.821** 0.781** 1.010** 0.803**(0.364) (0.432) (0.352) (0.371) (0.444) (0.358)
Ln(assets) -0.278* -0.248 -0.269* -0.304** -0.275 -0.288*(0.148) (0.195) (0.147) (0.150) (0.199) (0.150)
Exports/Sales -0.152 -0.215 -0.123 -0.156 -0.214 -0.127(0.196) (0.286) (0.192) (0.189) (0.272) (0.186)
Foreign ownership (%) 0.014** 0.008 0.012** 0.012** 0.007 0.011**(0.005) (0.006) (0.005) (0.005) (0.006) (0.005)
Financial institution ownership (%) 0.032*** 0.029*** 0.031*** 0.030*** 0.027*** 0.029***
(0.006) (0.007) (0.006) (0.006) (0.007) (0.006)Audit & supervisory committee 0.686*** 0.527** 0.502** 0.421*** 0.333** 0.316**
(0.227) (0.238) (0.236) (0.149) (0.166) (0.151)Firm fixed effects Yes Yes Yes Yes Yes YesYear fixed effects Yes Yes Yes Yes Yes YesObservations 2743 1757 2743 2743 1757 2743

42
Panel E. Non-TSE Tobin’s Q (1) (2) (3) (4) (5) (6)Number of outside directors -0.081 -0.121* -0.203**
(0.075) (0.067) (0.098)Percentage of outside directors -0.006 -0.009* -0.015**
(0.006) (0.005) (0.007)Tangible assets/Assets -1.173*** -1.619*** -1.304*** -1.116** -1.555*** -1.164**
(0.454) (0.538) (0.499) (0.446) (0.539) (0.491)Liabilities/Assets 0.454 0.530* 0.511* 0.462 0.550 0.535*
(0.292) (0.313) (0.270) (0.311) (0.348) (0.323)R&D expenses/Assets 8.015 16.555** 2.955 8.777 15.178** 4.718
(5.754) (8.117) (6.295) (5.725) (7.559) (5.698)Payouts/Assets 2.599 3.949 2.555 2.532 3.503 2.379
(2.222) (3.178) (2.162) (2.209) (3.252) (2.194)Cash flow/Assets 2.576*** 2.571*** 2.791*** 2.281*** 2.180*** 2.042***
(0.882) (0.940) (0.900) (0.720) (0.793) (0.634)Ln(assets) 0.368*** 0.551*** 0.345** 0.344*** 0.522*** 0.283*
(0.127) (0.088) (0.148) (0.126) (0.077) (0.170)Exports/Sales -0.184 -0.031 -0.212 -0.202 -0.047 -0.259
(0.147) (0.173) (0.143) (0.168) (0.186) (0.189)Foreign ownership (%) 0.005 -0.006 0.008 0.005 -0.007 0.007
(0.010) (0.011) (0.011) (0.010) (0.010) (0.010)Financial institution ownership (%) 0.024** 0.026 0.023* 0.025** 0.028 0.024*
(0.012) (0.018) (0.013) (0.012) (0.018) (0.013)Audit & supervisory committee 0.177 0.208 0.409** 0.126 0.154 0.288**
(0.147) (0.130) (0.186) (0.111) (0.103) (0.133)Firm fixed effects Yes Yes Yes Yes Yes YesYear fixed effects Yes Yes Yes Yes Yes YesObservations 421 303 421 421 303 421

43
Table 4. Industry Instrument
We calculate the compliance rate of firms on the TSE 1st section and use the lagged variable as an additional instrument. Results suggest that firms in a particular industry comply with their industry leaders listed on the 1st section of TSE. Specifications 1 and 4 use Treat0*After, specifications 2 and 5 use Treat0d*After and specifications 3 and 6 use Treat1*After instrument, respectively.
Panel A. All but the TSE 1st section and the TSE 2nd section Tobin’s Q
All but the TSE-1st TSE-2nd(1) (2) (3) (4) (5) (6)
Number of outside directors -0.167*** -0.158*** -0.159** -0.019 -0.041 -0.058(0.054) (0.058) (0.067) (0.041) (0.035) (0.043)
Other control variables Yes Yes Yes Yes Yes YesFirm fixed effects Yes Yes Yes Yes Yes YesYear fixed effects Yes Yes Yes Yes Yes YesFirst stage F-value 49.83 52.38 37.49 26.84 31.91 20.06Observations 5557 3512 5557 2184 1352 2184
First stage: Number of outside directors
Treat*After 0.464*** 0.697*** 0.570*** 0.522*** 0.828*** 0.624***(0.063) (0.099) (0.095) (0.092) (0.128) (0.127)
Treat*After*TSE 1st compliance 0.092 0.401*** 0.325*** 0.052 0.310*** 0.269**
(0.078) (0.115) (0.102) (0.102) (0.118) (0.112)
Panel B. TSE other sections and non-TSETobin’s Q
TSE-other Non-TSE (1) (2) (3) (4) (5) (6)
Number of outside directors -0.334*** -0.257** -0.236* -0.024 -0.084 -0.170(0.109) (0.110) (0.122) (0.082) (0.081) (0.122)
Other control variables Yes Yes Yes Yes Yes YesFirm fixed effects Yes Yes Yes Yes Yes YesYear fixed effects Yes Yes Yes Yes Yes YesFirst stage F-value 23.69 22.09 16.82 7.08 11.35 9.28Observations 2660 1714 2660 410 294 410
First stage: Number of outside directors
Treat*After 0.395*** 0.543*** 0.508*** 0.543*** 0.697*** 0.500**(0.090) (0.163) (0.154) (0.186) (0.241) (0.197)
Treat*After*TSE 1st compliance 0.177 0.609*** 0.439** -0.028 0.294 0.301
(0.119) (0.201) (0.181) (0.251) (0.333) (0.267)

44
Table 5. Firm Age
This Table illustrates the impact of corporate governance reforms on firm value clustered by age. Young and Mature are defined in relation fixed thresholds (40, 45, 50) suitable for the Japanese context. Specifications 1 and 2 use Treat0*After, specifications 3 and 4 use Treat0d*After and specifications 5 and 6 use Treat1*After instrument, respectively.
Panel A. Young: Age 50 or below; 31.5% of firms are young Tobin’s Q
Young Mature Young Mature Young Mature (1) (2) (3) (4) (5) (6)Number of outside directors -0.197** -0.077*** -0.157** -0.068*** -0.121* -0.067**
(0.083) (0.029) (0.063) (0.022) (0.065) (0.027)Firm fixed effects Yes Yes Yes Yes Yes YesYear fixed effects Yes Yes Yes Yes Yes YesFirst stage F-value 51.26 132.56 92.73 183.28 86.48 139.88Observations 4691 10224 2865 6072 4691 10224
Panel B. Young: Age 45 or below; 26.5% of firms are young Tobin’s Q
Young Mature Young Mature Young Mature (1) (2) (3) (4) (5) (6)Number of outside directors -0.237** -0.063** -0.182** -0.055** -0.130* -0.054**
(0.097) (0.031) (0.075) (0.023) (0.074) (0.026)Firm fixed effects Yes Yes Yes Yes Yes YesYear fixed effects Yes Yes Yes Yes Yes YesFirst stage F-value 36.03 146.27 66.55 201.06 68.6 151.97Observations 3948 10967 2432 6505 3948 10967
Panel C. Young: Age 40 or below; 21.1% of firms are young Tobin’s Q
Young Mature Young Mature Young Mature (1) (2) (3) (4) (5) (6)Number of outside directors -0.238** -0.075** -0.182** -0.061*** -0.133 -0.054**
(0.110) (0.032) (0.086) (0.023) (0.084) (0.027)Firm fixed effects Yes Yes Yes Yes Yes YesYear fixed effects Yes Yes Yes Yes Yes YesFirst stage F-value 29.08 154.18 54.58 215.28 58.93 162.55Observations 3139 11776 1965 6972 3139 11776

45
Table 6. Level of R&D Investment
This Table illustrates the impact of corporate governance reforms on firm value clustered by the level of R&D investment. High and low R&D are defined in relation to firm medians. Specifications 1 and 2 use Treat0, specifications 3 and 4 use Treat0d, and specifications 5 and 6 use Treat1 instrument, respectively.
Panel A. All firms Tobin’s Q
Low R&D High R&D Low R&D High R&D Low R&D High R&D (1) (2) (3) (4) (5) (6)Number of outside directors -0.099 -0.106*** -0.079* -0.106*** -0.057 -0.104***
(0.062) (0.039) (0.047) (0.032) (0.049) (0.038)Firm fixed effects Yes Yes Yes Yes Yes YesYear fixed effects Yes Yes Yes Yes Yes YesFirst stage F-value 64.14 121.28 103.64 179.69 88.98 141.21Observations 7462 7453 4525 4412 7462 7453
Panel B. TSE 1st section Tobin’s Q
Low R&D High R&D Low R&D High R&D Low R&D High R&D (1) (2) (3) (4) (5) (6)
Number of outside directors -0.033 -0.125*** -0.026 -0.124*** -0.001 -0.126***(0.055) (0.047) (0.038) (0.038) (0.040) (0.043)
Firm fixed effects Yes Yes Yes Yes Yes YesYear fixed effects Yes Yes Yes Yes Yes YesFirst stage F-value 83.23 83.07 116.56 129.44 88.13 118Observations 4752 4752 2706 2779 4752 4752
46
Table 7. Director Attributes
We divide firms into three groups. The first group of firms are those that did not appoint an outside director as of 2017 with a current or past management position. The second are those that appointed an outside director with a current or past management position. The third are those that appointed an outside director with a current management position. Specifications 1, 4, and 7 use Treat0*After, specifications 2, 5, and 8 use Treat0d*After, and specifications 3, 6, and 9 use Treat1*After instrument, respectively.
Panel A. All firms Tobin's Q
No Past/Current Current No Past/Current Current No Past/Current Current(1) (2) (3) (4) (5) (6) (7) (8) (9)
Number of outside directors -0.120** -0.062 -0.050 -0.117*** -0.063** -0.050 -0.113** -0.065** -0.040(0.052) (0.042) (0.039) (0.044) (0.032) (0.034) (0.053) (0.032) (0.057)
Firm fixed effects Yes Yes Yes Yes Yes Yes Yes Yes YesYear fixed effects Yes Yes Yes Yes Yes Yes Yes Yes YesFirst stage F-value 78.71 151.89 48.29 103.11 226.28 58.47 79.57 182.05 40.52 Observations 8076 6225 1999 4672 3864 1363 8076 6225 1999 Panel B. TSE 1st section Tobin's Q
No Past/Current Current No Past/Current Current No Past/Current Current(1) (2) (3) (4) (5) (6) (7) (8) (9)
Number of outside directors -0.090* -0.059 -0.090*** -0.073* -0.066* -0.086*** -0.067 -0.069** -0.072(0.050) (0.053) (0.030) (0.042) (0.036) (0.028) (0.052) (0.034) (0.074)
Firm fixed effects Yes Yes Yes Yes Yes Yes Yes Yes YesYear fixed effects Yes Yes Yes Yes Yes Yes Yes Yes YesFirst stage F-value 80.60 102.88 25.12 92.16 164.87 34.99 67.64 148.67 25.30 Observations 4337 4813 1485 2325 2934 1007 4337 4813 1485

47
Panel C. Non-TSE 1st section Tobin's Q
No Past/Current Current No Past/Current Current No Past/Current Current(1) (2) (3) (4) (5) (6) (7) (8) (9)
Number of outside directors -0.172** -0.128** -0.010 -0.195** -0.103* -0.029 -0.225** -0.102 0.024(0.082) (0.060) (0.044) (0.085) (0.063) (0.035) (0.105) (0.074) (0.070)
Firm fixed effects Yes Yes Yes Yes Yes Yes Yes Yes YesYear fixed effects Yes Yes Yes Yes Yes Yes Yes Yes YesFirst stage F-value 41.80 76.12 34.14 41.81 90.05 37.85 29.43 57.46 21.94 Observations 3739 1412 514 2347 930 356 3739 1412 514

48
Table 8. Osaka Stock Exchange
This table tests the relationship between the number of outside directors and firm value for the Osaka Stock Exchange. The main findings remain robust. Specifications 1 and 4 use Treat0*After, specifications 2 and 5 use Treat0d*After, and specifications 3 and 6 use Treat1*After instrument, respectively.
Panel A. All OSE firms Tobin’s Q
All OSE(1) (2) (3)
Number of outside directors -0.149** -0.112* -0.097
(0.074) (0.066) (0.075)Other control variables Yes Yes YesFirm fixed effects Yes Yes YesYear fixed effects Yes Yes YesFirst stage F-value 75.74 118.08 95.10 Observations 3351 2130 3351
Panel B. OSE 1st or 2nd section and OSE other section Tobin’s Q
OSE-1st or OSE-2nd OSE-other(1) (2) (3) (4) (5) (6)
Number of outside directors -0.080** -0.092** -0.111** -0.721 -1.205 -1.585
(0.039) (0.036) (0.054) (0.604) (1.195) (2.191)Other control variables Yes Yes Yes Yes Yes Yes
Firm fixed effects Yes Yes Yes Yes Yes YesYear fixed effects Yes Yes Yes Yes Yes YesFirst stage F-value 59.32 80.92 44.62 41.64 73.18 62.41 Observations 851 559 851 2500 1571 2500
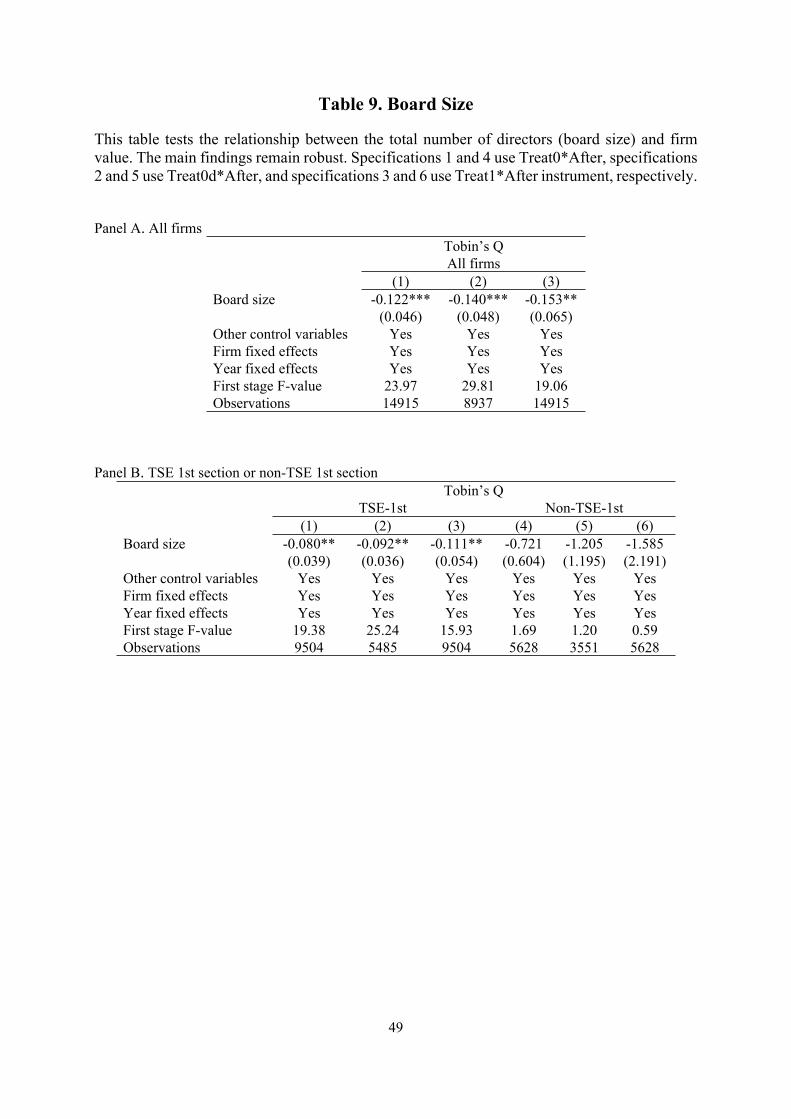
49
Table 9. Board Size
This table tests the relationship between the total number of directors (board size) and firm value. The main findings remain robust. Specifications 1 and 4 use Treat0*After, specifications 2 and 5 use Treat0d*After, and specifications 3 and 6 use Treat1*After instrument, respectively.
Panel A. All firms Tobin’s Q
All firms(1) (2) (3)
Board size -0.122*** -0.140*** -0.153**(0.046) (0.048) (0.065)
Other control variables Yes Yes YesFirm fixed effects Yes Yes YesYear fixed effects Yes Yes YesFirst stage F-value 23.97 29.81 19.06 Observations 14915 8937 14915
Panel B. TSE 1st section or non-TSE 1st section Tobin’s Q
TSE-1st Non-TSE-1st(1) (2) (3) (4) (5) (6)
Board size -0.080** -0.092** -0.111** -0.721 -1.205 -1.585(0.039) (0.036) (0.054) (0.604) (1.195) (2.191)
Other control variables Yes Yes Yes Yes Yes YesFirm fixed effects Yes Yes Yes Yes Yes YesYear fixed effects Yes Yes Yes Yes Yes YesFirst stage F-value 19.38 25.24 15.93 1.69 1.20 0.59 Observations 9504 5485 9504 5628 3551 5628

50
Table 10. Placebo Test
This table uses 2008 and 2009 as the hypothetical (placebo) year of the reform. We use eight-year periods in each specification so that we have four years both before and after the reform. We do not find any significant relation between the number of outside directors and firm value. Specifications 1 and 4 use Treat0*After, specifications 2 and 5 use Treat0d*After, and specifications 3 and 6 use Treat1*After instrument, respectively.
Tobin’s QHypothetical year of the reform 2008 2009
(1) (2) (3) (4) (5) (6)Number of outside directors -0.710 -0.538 -0.537 0.350 0.516 0.657
(0.489) (0.426) (0.548) (0.283) (0.519) (0.862)Other control variables Yes Yes Yes Yes Yes YesFirm fixed effects Yes Yes Yes Yes Yes YesYear fixed effects Yes Yes Yes Yes Yes YesFirst stage F-value 2.84 2.45 1.44 2.83 1.33 0.70 Observations 13906 10836 13906 14186 10889 14186

51
Table 11. Definition and Data Sources
Definition Data sourceTobin’s Q Market capitalization plus total liabilities divided by
book value of total assetsFinancialQUEST
Number of outside directors
The total number of outside directors NEEDS Executive Data
Percentage of outside directors
The ratio of outside directors to total directors in percentage
NEEDS Executive Data
Number of total directors
The total number of directors NEEDS Executive Data
Tangible assets/Assets Tangible assets divided by lagged total assets FinancialQUESTLiabilities/Assets Total liabilities divided by lagged total assets FinancialQUESTR&D expenses/Assets R&D expenses divided by lagged total assets FinancialQUESTPayouts/Assets Dividends plus share repurchases divided by lagged
total assetsFinancialQUEST
Cash flow/Assets Operating earnings plus depreciation divided by total assets
FinancialQUEST
Ln(assets) Natural Logarithm of total assets FinancialQUESTExports/Sales Exports divided by lagged sales FinancialQUESTForeign ownership (%)
The share of stocks held by foreign investors in percentage
FinancialQUEST
Financial institution ownership (%)
The share of stocks held by financial institutions in percentage
FinancialQUEST
Audit & supervisory committee
Dummy variable that takes one if the firm adopts the audit & supervisory committee system
NEEDS Executive Data
Firm age Years since the establishment FinancialQUESTTreat0 Dummy variable that takes one if the firm had no
outside directors in FY2013 (i.e., March 2014)Treat0d Dummy variable that takes one if the firm had no
outside directors in FY2013 and takes a missing value if the firm had one outside director in FY2013
Treat1 Takes one if the firm had less than two outside directors in FY 2013
After Dummy variable that takes one from FY2014 (i.e., March 2015) onwards
TSE-1st compliance Compliance rate of the Code among firms on the 1st section of the TSE in a certain industry