corporate finance v escp-eap - european executive mba 14-15 dec. 2005, london risk, return,...
TRANSCRIPT

CORPORATE FINANCEV
ESCP-EAP - European Executive MBA
14-15 Dec. 2005, London
Risk, Return, Diversification and CAPM
I. Ertürk
Senior Fellow in Banking


Capital Asset Pricing Model
Re = Rf + B ( Rm - Rf )
CAPM
Re = cost of equityRf = risk free rate (Current Treasury bill yield)B = beta (market risk)Rm = long-term return on market portfolio (stock market index)Rf = long-term return on risk free asset (Treasury bill)(Rm- Rf) = market risk premium

Capital Asset Pricing Model (CAPM)
Return
BETA
Rf
1.0
Security Market Line
Cost of equity (Re) = Rf + B ( Rm - Rf )

Betas
Company Beta
Shell 1.53
Tesco 0.43
Barclays 1.22
Vodafone 0.84
Glaxo 0.71
Man 1.59
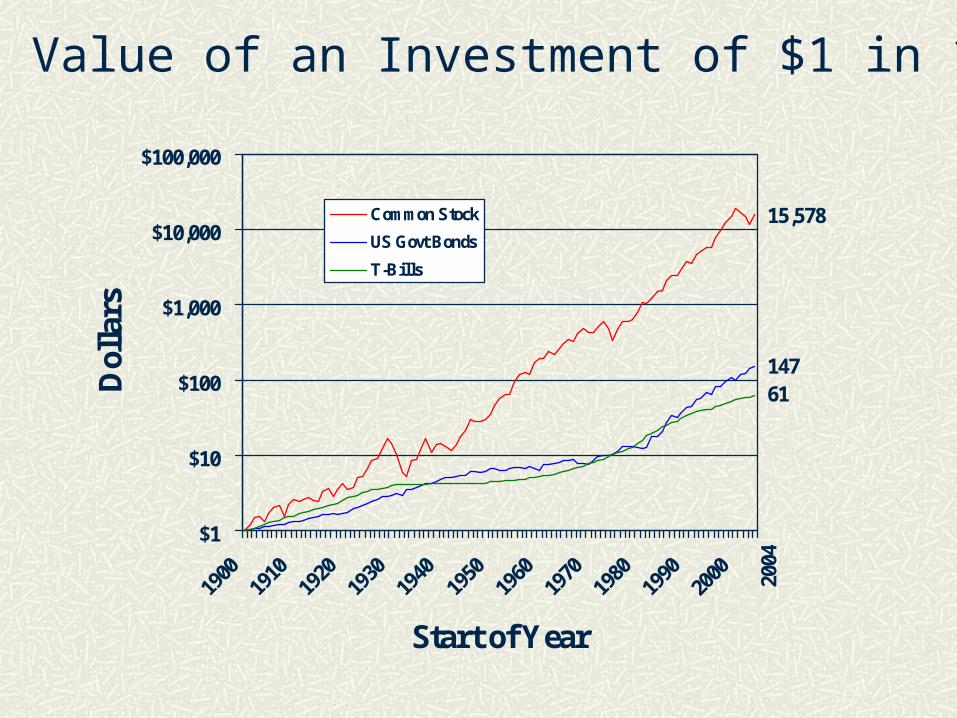
The Value of an Investment of $1 in 1900
$1
$10
$100
$1,000
$10,000
$100,000
1900
1910
1920
1930
1940
1950
1960
1970
1980
1990
2000
Start of Year
Dol
lars
Common Stock
US Govt Bonds
T-Bills
15,578
14761
2004

Rates of Return 1926-1997
Source: Ibbotson Associates
-60
-40
-20
0
20
40
60
26 30 35 40 45 50 55 60 65 70 75 80 85 90 95
Common Stocks
Long T-Bonds
T-Bills
Year
Per
cent
age
Ret
urn

Rates of Return 1900-2003
Source: Ibbotson Associates
-60%
-40%
-20%
0%
20%
40%
60%
80%
1900 1920 1940 1960 1980 2000
Year
Per
cent
age
Ret
urn
Stock Market Index Returns

Measuring Risk
1 14
1012
19
15
24
13
32
0
4
8
12
16
20
24
-50
to -
40
-40
to -
30
-30
to -
20
-20
to -
10
-10
to 0
0 to
10
10 t
o 20
20 t
o 30
30 t
o 40
40 t
o 50
50 t
o 60
Return %
# of Years
Histogram of Annual Stock Market ReturnsHistogram of Annual Stock Market Returns


Distribution of returns for Telus
0
1
2
3
4
5
6
7
-35% -30% -25% -20% -15% -10% -5% 0% 5% 10% 15% 20% 25% 30% 35%
Series1

-0.400
-0.300
-0.200
-0.100
0.000
0.100
0.200
0.300
0.400
0.500
04
/01
/19
99
04
/03
/19
99
04
/05
/19
99
04
/07
/19
99
04
/09
/19
99
04
/11
/19
99
04
/01
/20
00
04
/03
/20
00
04
/05
/20
00
04
/07
/20
00
04
/09
/20
00
04
/11
/20
00
04
/01
/20
01
04
/03
/20
01
04
/05
/20
01
04
/07
/20
01
04
/09
/20
01
04
/11
/20
01
04
/01
/20
02
04
/03
/20
02
04
/05
/20
02
04
/07
/20
02
04
/09
/20
02
04
/11
/20
02
04
/01
/20
03
04
/03
/20
03
04
/05
/20
03
04
/07
/20
03
04
/09
/20
03
04
/11
/20
03
XOM
HNZ
PFE
KO
Stock returns

Measuring Risk
Variance - Average value of squared deviations from mean. A measure of volatility.
Standard Deviation - Average value of squared deviations from mean. A measure of volatility.

Measuring Risk
Calculating variance and standard deviation
(1) (2) (3)
Percent Rate of Return Deviation from Mean Squared Deviation
+ 40 + 30 900
+ 10 0 0
+ 10 0 0
- 20 - 30 900
Variance = average of squared deviations = 1800 / 4 = 450
Standard deviation = square of root variance = 450 = 21.2%

Year Telus Market Index1973 -14.40% -0.51%1974 0.00% -22.57%1975 21.49% 15.35%1976 23.55% 8.80%1977 19.95% 9.64%1978 15.02% 29.10%1979 3.41% 43.94%1980 3.53% 29.70%1981 -6.12% -10.00%1982 18.36% 5.67%1983 32.17% 32.72%1984 3.77% -2.48%1985 24.36% 24.63%1986 7.02% 7.84%1987 -1.38% 6.24%1988 10.63% 10.88%1989 -32.63% 20.91%1990 12.61% -14.82%1991 24.57% 11.28%1992 -9.18% -1.70%1993 35.35% 31.90%1994 -0.59% -0.16%1995 9.46% 14.40%1996 23.84% 28.05%1997 54.64% 14.89%1998 -2.58% -1.58%1999 -12.87% 31.42%2000 22.19% 7.52%
Arithmetic average10.22% 11.82%STD 17.85% 15.82%correlation 73-2000 0.26
90-00 0.29
Beta 0.29
Markowitz Portfolio Theory
Combining stocks into portfolios can reduce standard deviation, below the level obtained from a simple weighted average calculation.
Correlation coefficients make this possible.
The various weighted combinations of stocks that create this standard deviations constitute the set of efficient portfolios.
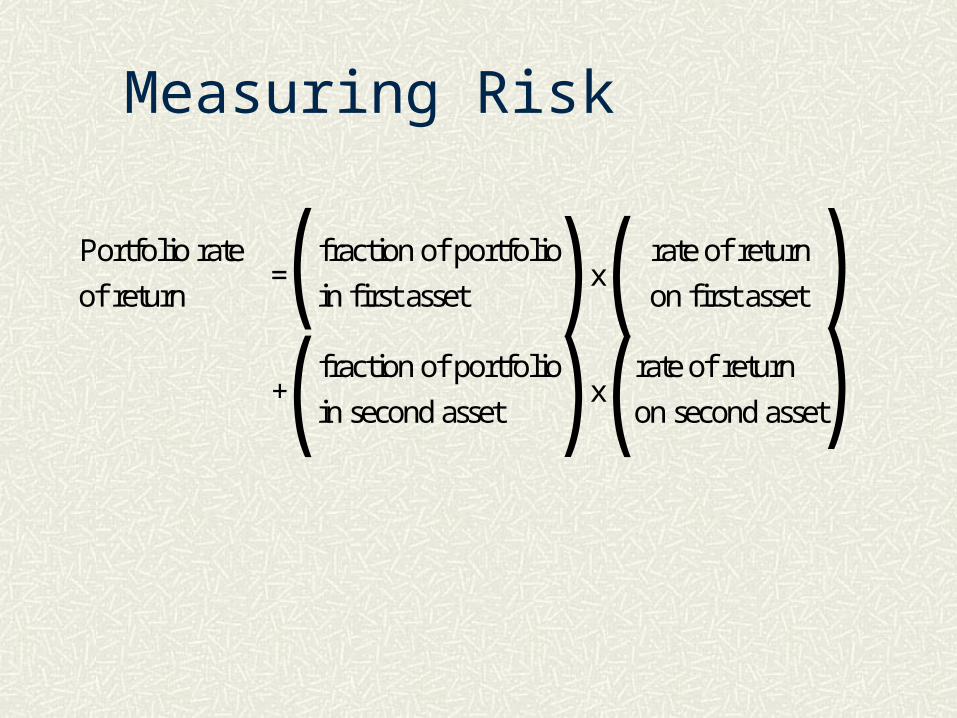
Measuring Risk
Portfolio rate
of return=
fraction of portfolio
in first assetx
rate of return
on first asset
+fraction of portfolio
in second assetx
rate of return
on second asset
((
(())
))
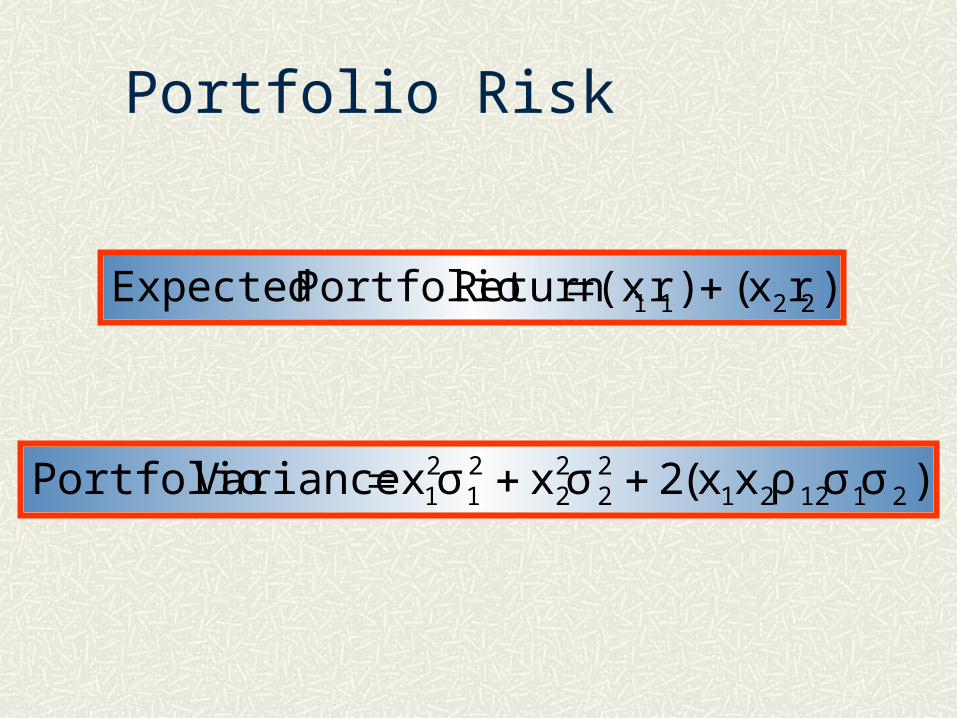
Portfolio Risk
)rx()r(x Return PortfolioExpected 2211
)σσρxx(2σxσxVariance Portfolio 21122122
22
21
21

Efficient FrontierExample Correlation Coefficient = .4
Stocks % of Portfolio Avg Return
ABC Corp 28 60% 15%
Big Corp 42 40% 21%
Standard Deviation = Portfolio = 28.1
Return = weighted avg = Portfolio = 17.4%
Let’s Add stock New Corp to the portfolio

Efficient FrontierExample Correlation Coefficient = .3
Stocks % of Portfolio Avg Return
Portfolio 28.1 50% 17.4%
New CorpNew Corp3030 50%50% 19% 19%
NEW Standard Deviation = Portfolio = 23.43
NEW Return = weighted avg = Portfolio = 18.20%

Efficient FrontierExample Correlation Coefficient = .3
Stocks % of Portfolio Avg Return
Portfolio 28.1 50% 17.4%
New Corp 30 50% 19%
NEW Standard Deviation = Portfolio = 23.43
NEW Return = weighted avg = Portfolio = 18.20%
NOTE: Higher return & Lower risk
DIVERSIFICATION

Efficient Frontier
A
BN
Return
Risk
AB
Goal is to move up and left.
ABN

Efficient Frontier
Return
Risk
Low Risk
High Return
High Risk
High Return
Low Risk
Low Return
High Risk
Low Return

INTEGRATED MARKETS & DIVERSIFICATION BENEFITS C20A.WK1
F10 will graph the portfolio return-risk profile.
ASSUMPTION SET---------------- ---------------- ---------------- ----------------
Stock Return Risk Correlation---------------- ---------------- ---------------- ----------------
Boeing (US) 18.60% 22.80% 0.80Unilever (UK) 16.00% 24.00%
PORTFOLIO ANALYSIS---------------- ---------------- ---------------- ----------------
Weight of Weight of Expected ExpectedBoeing in Unilever in Return RiskPortfolio Portfolio (percent) (percent)
---------------- ---------------- ---------------- ----------------1.00 0.00 18.60% 22.80%0.95 0.05 18.47% 22.63%0.90 0.10 18.34% 22.49%0.85 0.15 18.21% 22.36%0.80 0.20 18.08% 22.27%0.75 0.25 17.95% 22.19%0.70 0.30 17.82% 22.15%0.65 0.35 17.69% 22.12%0.60 0.40 17.56% 22.12%0.55 0.45 17.43% 22.15%0.50 0.50 17.30% 22.20%0.45 0.55 17.17% 22.28%0.40 0.60 17.04% 22.38%0.35 0.65 16.91% 22.50%0.30 0.70 16.78% 22.65%0.20 0.80 16.52% 23.01%0.25 0.75 16.65% 22.82%0.20 0.80 16.52% 23.01%0.15 0.85 16.39% 23.23%0.10 0.90 16.26% 23.46%0.05 0.95 16.13% 23.72%0.00 1.00 16.00% 24.00%
---------------- ---------------- ---------------- ----------------

Benefits of Portfolio Diversification(two asset portfolio)
15.0
15.5
16.0
16.5
17.0
17.5
18.0
18.5
19.0
19.5
20.0
15.0 16.0 17.0 18.0 19.0 20.0 21.0 22.0 23.0 24.0 25.0
Risk (standard deviation, %)
Ret
urn
(%)

Measuring Risk
05 10 15
Number of Securities
Po
rtfo
lio
sta
nd
ard
dev
iati
on

Measuring Risk
05 10 15
Number of Securities
Po
rtfo
lio
sta
nd
ard
dev
iati
on
Market risk
Uniquerisk
Measuring Risk
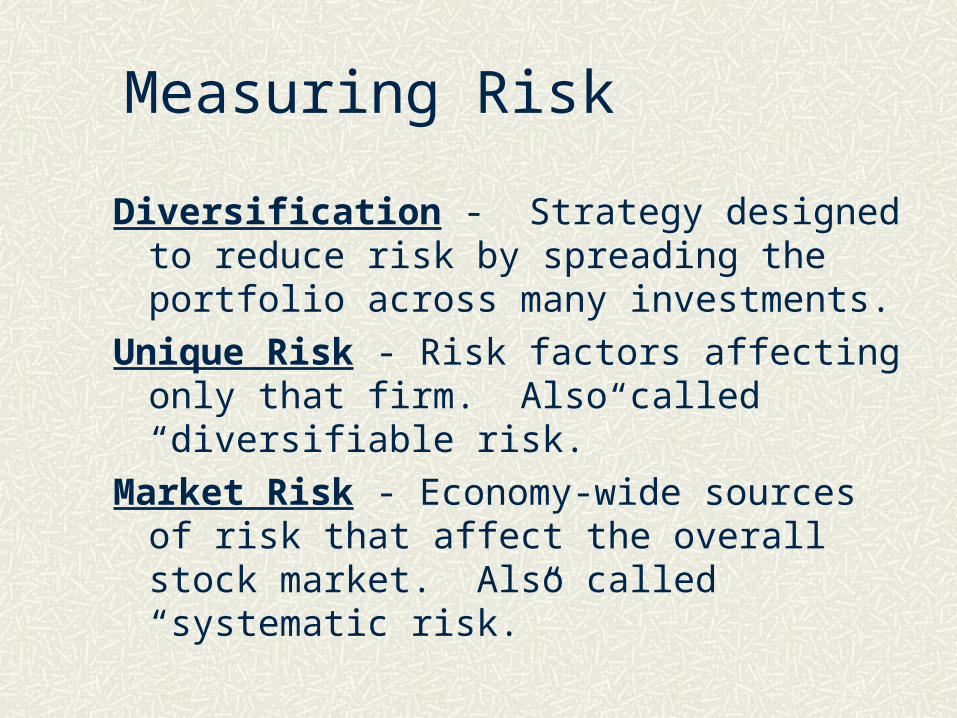
Diversification - Strategy designed to reduce risk by spreading the portfolio across many investments.
Unique Risk - Risk factors affecting only that firm. Also called “diversifiable risk.”
Market Risk - Economy-wide sources of risk that affect the overall stock market. Also called “systematic risk.”

Security Market LineReturn
Risk
.
rf
Risk Free
Return =
Efficient Portfolio
Market Return = rm

0%
5%
10%
15%
20%
25%
30%
35%
40%
0% 10% 20% 30% 40% 50% 60%
Standard Deviation
Exp
ecte
d R
etu
rn
Stocks
Tangency Portfolio
Minimum Variance Frontier
Efficient Frontier (with rf)
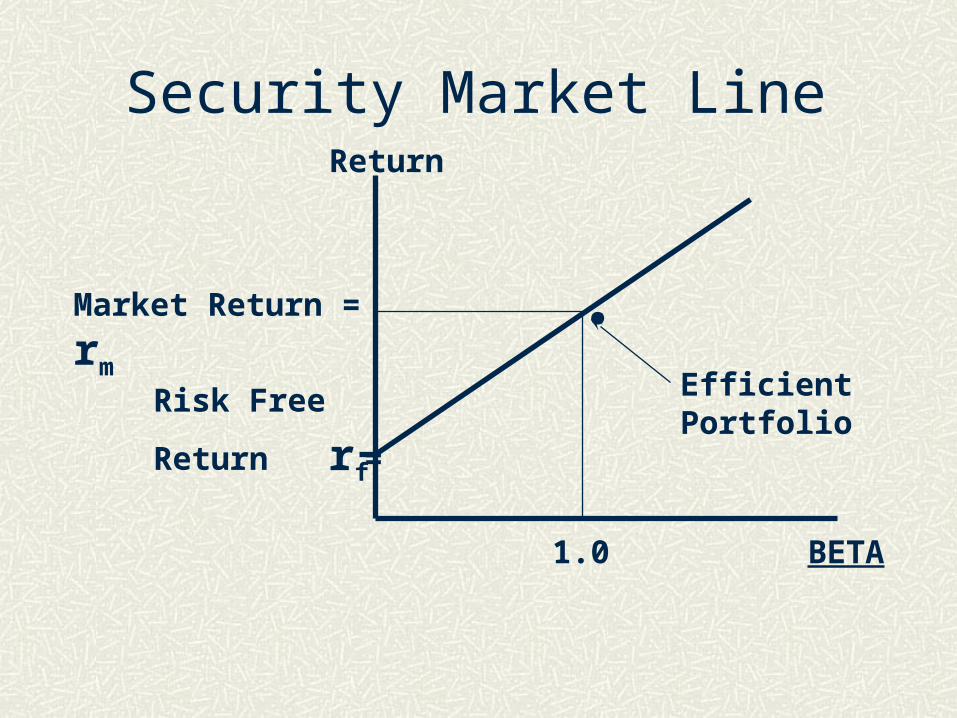
Security Market LineReturn
.
rf
Risk Free
Return =
Efficient Portfolio
Market Return = rm
BETA1.0
Beta and Unique RiskMarket Portfolio - Portfolio of all assets in the economy. In practice a broad stock market index, such as the S&P Composite, is used to represent the market.
Beta - Sensitivity of a stock’s return to the return on the market portfolio.

Measuring Betas
The SML shows the relationship between return and risk.
CAPM uses Beta as a proxy for risk.
Beta is the slope of the SML, using CAPM terminology.
Other methods can be employed to determine the slope of the SML and thus Beta.
Regression analysis can be used to find Beta.

Beta and Unique Risk
beta
Expected
return
Expectedmarketreturn
10%10%- +
-10%+10%
stock
-10%
1. Total risk = diversifiable risk + market risk2. Market risk is measured by beta, the sensitivity to market changes

Beta and Unique Risk
2m
imiB
Covariance with the market
Variance of the market

Measuring Betas
Hewlett Packard Beta
Slope determined from 60 months of prices and plotting the line of best fit.
Price data - Jan 78 - Dec 82
Market return (%)
Hew
lett-Packard return (%
)
R2 = .53
B = 1.35

Measuring Betas
Hewlett Packard Beta
Slope determined from 60 months of prices and plotting the line of best fit.
Price data - Jan 83 - Dec 87
Market return (%)
Hew
lett-Packard return (%
)
R2 = .49
B = 1.33

Measuring Betas
Hewlett Packard Beta
Slope determined from 60 months of prices and plotting the line of best fit.
Price data - Jan 88 - Dec 92
Market return (%)
Hew
lett-Packard return (%
)
R2 = .45
B = 1.70

Measuring Betas
Hewlett Packard Beta
Slope determined from 60 months of prices and plotting the line of best fit.
Price data - Jan 93 - Dec 97
Market return (%)
Hew
lett-Packard return (%
)
R2 = .35
B = 1.69

Security Market LineReturn
BETA
rf
1.0
SML
SML Equation = rf + B ( rm - rf )

Capital Asset Pricing Model
R = rf + B ( rm - rf )
CAPM

Beta Stability % IN SAME % WITHIN ONE RISK CLASS 5 CLASS 5 CLASS YEARS LATER YEARS LATER
10 (High betas) 35 69
9 18 54
8 16 45
7 13 41
6 14 39
5 14 42
4 13 40
3 16 45
2 21 61
1 (Low betas) 40 62
Source: Sharpe and Cooper (1972)