corpor - fremantle ports home - welcome page underground conveyor system destroyed by a coal...
TRANSCRIPT

20
FREMANTLE PORTS ANNUAL REPORT 2013
Performance Corporate Scorecard
Each year in the Annual Report, Fremantle Ports publishes a range of key targets covering economic, social and environmental performance. These performance targets are used to identify and respond to emerging trends in trade development, measure Fremantle Ports’ capability for the future, monitor the financial performance of operations and ensure business excellence and sustainability. The following corporate scorecard shows the extent to which these business objectives were achieved.
Service Delivery
<1% 0 <5 0
Total vessels affected Average hours per delay
Inner Harbour – Container Vessel
Unavailability of Services
Unavailability of Berths
<12% 6.3% <20 18.3
Total vessels affected Average hours per delay
<1% 0.01% <5 25.3
Total vessels affected Average hours per delay
Kwinana Bulk Terminal
Unavailability of Services
<25% 49.3% <80 112
Total vessels affected Average hours per delay
Unavailability of Berths
Kwinana Bulk Jetty
Unavailability of Services
<2% 2.9% <5 19
Total vessels affected Average hours per delay
<25% 17.8% <50 73.8
Total vessels affected Average hours per delay
Unavailability of Berths90% of shipping line customers satisfied with services provided by Fremantle Ports, based on shipping line/agents survey.
Maintain at least 80 to 90% overall customer satisfaction with agents/shipping lines.
Result 90%Target 80-90%
Customer Satisfaction
$24.696m profit after tax
$37.042m profit after tax
Financial Results
ResultTarget
Economic
Containers - Annual growth rate
Target Result
Trade Results
Total trade - Annual growth rate
13.2%6.5 %
HOW WE PLANNED TO SUCCEED
2.0%4.0%

21
FREMANTLE PORTS ANNUAL REPORT 2013
Performance Corporate Scorecard
Certification to ISO 14001 was maintained in external audit of safety, environment and quality management systems.
Continue to comply with ISO 14001, and further improve Environmental Management System.
Result
Best practice environmental, safety and other business systems
Compliance with international environmental standard ISO 14001
Target
The total number of risks rated greater than ‘moderate’ was 11. Over the past five years, risks greater than moderate have been reduced by 73 per cent from a peak of 42 in 2008.
Continue to implement treatment actions to ensure risk profile is reduced.
ResultOverall risk profile Target
14Zero lost time injuries.
ResultTime lost to injuries Target
The number of workplace injuries was 43 compared with 64 the previous year.
Reduce workplace injuries.
ResultTarget
Certification to AS/NZS 4801 (Occupational Health and Safety Management Systems) was maintained following a triennial external audit.
Maintain certification to AS/NZS 4801.
ResultTarget
Social
Overall satisfaction (based on community survey results): Inner Harbour 73% Outer Harbour 58%
Support for the Inner Harbour in its role as a busy working port was: Inner Harbour 83% Outer Harbour 82%
70 to 80% overall satisfaction.
ResultCommunity satisfaction
Target
Complaints followed up with actions electronically monitored. Attention given to reducing truck traffic impacts for East Street residents.
Follow up all complaints and continue to implement improvement opportunities.
ResultActions on complaints and suggestions
Target

22
FREMANTLE PORTS ANNUAL REPORT 2013
Performance Service Delivery
Work undertaken at the Kwinana Bulk Terminal has improved operational efficiency.
OBJECTIVE:
Providing reliable and efficient services that meet customer expectations
Key outcomes sought:
• Understanding changing customer needs and being responsive to them. • Completion of major infrastructure projects.
Bulk Terminals maintenanceA shutdown of the Kwinana Bulk Berth 2 occurred from 15 to 27 March 2013 to enable major upgrades and modifications to the ship loader and unloader, conveyors and infrastructure.
The works carried out were to:
• improve load out rates to match optimal landside cargo handling rates• upgrade ageing infrastructure • reduce the risk of product spillage.
The deconstruction of a ship unloader which had been used to unload products for CSBP’s fertiliser plant was a significant project completed this year. The unloader had passed its service life, was expensive to maintain and had been unused for the past two years. CSBP is currently using either Fremantle Ports’ Siwertell auger-style unloader or ships’ gear and hoppers to unload their cargo from ships at this jetty.
Electrical substations upgradingWork is well advanced on the upgrading of high-voltage electrical infrastructure across North Quay. This is a major project which is necessary to improve the security of electricity supply to port tenants and to minimise operational risk to employees undertaking the high-voltage switching. It also involves installation of electrical infrastructure to service the new tenancies on land reclaimed at Rous Head and now being developed.
Three new 11kV intake substations from Western Power are now fully operational as part of the overall project, with the overall project scheduled for completion in the first half of 2014.

23
FREMANTLE PORTS ANNUAL REPORT 2013
Performance Service Delivery
Small craft capability The pilot boat Parmelia was fitted with two new engines. This vessel, one of two operated by Fremantle Ports to transfer marine pilots to and from shipping, has been in service for ten years. The new engines are smaller than those replaced but have a higher horsepower, enabling fuel economy without loss of performance.
The engine replacements and other refurbishing have avoided the cost of replacing Parmelia with a new pilot boat for some years to come.
A new 3D mapping system installed on Fremantle Ports’ response vessel FP Response is enabling harbour maintenance dredging to be done more simply and accurately.
The combined 2D plotting system and 3D mapping system takes depth soundings and when it has enough information it builds a 3D topographical profile of the bottom that is accurate to within 10 centimetres. This gives a very accurate image of the harbour floor, with fine details of the depths of the berths and showing any high spots that need to be smoothed out.
Towage licences issuedNon-exclusive towage licences for a maximum term of seven years were finalised in June 2013 with Svitzer Australia, Total AMS and PB Towage Australia. A further licence has been issued to Defence Maritime Services for towage services to naval vessels. The licences will expire on 31 May 2020.
Fendering and wharf decking A damaged section of decking on North Quay Berth 1 was replaced with a new section of deck. As well as installing a new timber beam, this involved the installation of three new piles along the front of the deck, steel beams to support the new structure, and new deck steel reinforcement.
Work of this kind requires careful scheduling to enable the maintenance to be carried out in a way that does not interrupt shipping requirements.
Design work was completed and tenders called for installation of new fendering for E Berth on Victoria Quay and part of D Berth.
In 1997, almost two thirds of the D Berth timber fendering was replaced with steel piles, steel beams and conical rubber fenders. With the increased size of ships now using these berths, the remaining section of wooden fendering on D Berth and all of the E Berth fendering will be replaced.
The new fendering system has been designed to be totally independent of the existing wharf and thus able to be incorporated into any future new wharf structure. It is expected to be completed in April 2014.
Parmelia back in action.
Pilot boat Parmelia undergoing re-fit.
Licensing of towage services was first introduced in Fremantle Port in 2001.

24
FREMANTLE PORTS ANNUAL REPORT 2013
Increasing reliability of navigation aidsFremantle Ports’ navigational lighting system of buoys and beacons is critically important for the safe passage of ships in and out of port. Three navigation buoys and their associated mooring systems have been replaced as part of a three-year program to improve the efficiency, reliability and longevity of navigation aids.
A new buoy type being trialled has a wider base, which stabilises movement in rough weather conditions and makes working conditions safer for technical personal when carrying out maintenance. Improved electronics within the buoys provide intelligent monitoring of battery voltage, solar power and light condition.
A new mooring system being trialled for the navigation buoys uses rubber ties which have a longer lifespan than chain. As the rubber is continually stretching, there is also less marine growth.
Rebuilt conveyor system commissionedAn underground conveyor system destroyed by a coal stockpile fire in 2007 has been completely rebuilt to be safer and more efficient and is now operating with iron ore fines at the Kwinana Bulk Terminal.
The newly reconstructed tunnel and conveyor system commissioned during the year includes an automated feed chute, cameras for remote operation, and construction to current Australian Standards and legislation. The automated system reduces the exposure of staff to potential injury and cameras provide immediate visual feedback to the control room on the effect of any changes to belt speed or product feed rate.
Rail Bridge protection In preparation for constructing some protective piling to prevent vessel collisions damaging the Fremantle Rail Bridge, geotechnical work was undertaken to test soil composition and design was finalised.
This is a Public Transport Authority project, with Fremantle Ports assisting.
Statutory consultation with Aboriginal elders was completed in relation to the planned installation of the protective piling and an application under Section 18 of the Aboriginal Heritage Act 1972 was granted.
Fremantle Ports has made some procedural changes to reduce the risk of vessel collision with the bridge and at the time of preparation of this report the timing and urgency for the project were under review by the PTA.
Performance Service Delivery
Core sampling for geotechnical analysis at the Fremantle Rail Bridge.
The new buoy being trialled has better stabilisation, safer storage of electronics and batteries, advanced communication and monitoring technology for maintenance purposes and tracking and rubber mooring, which keeps the buoy in correct position.

25
FREMANTLE PORTS ANNUAL REPORT 2013
Woodman Point Jetty safety work Although the Woodman Point Jetty is no longer in Fremantle Ports’ waters, urgent work was undertaken in January 2013 for the safety of the public.
The two wings which formed part of the tee head at the seaward end of the jetty were demolished, with the steel support piles cut off at seabed level. Some local areas of concrete damage were also repaired.
The demolition works were agreed with the Department of Transport as a necessary public safety step in light of the difficulty in maintaining a prohibited access zone. Barricading and fencing previously installed to keep people out of the unsafe seaward end of the jetty had twice been vandalised.
The long-term future of the jetty is being considered.
Maritime Security Identification Cards Fremantle Ports is an issuing agency for Maritime Security Identification Cards (MSIC), which are required under federal legislation for access to maritime security zones within the port area. Applications for the MSIC are referred to ASIO and the Australian Federal Police for background checks.
The total number of Fremantle Ports MSIC processed in 2012-13 financial year was 3473, with a further 5791 processed for regional ports in Western Australia.
To make the card renewal year process easier for MSIC holders at larger companies, Fremantle Ports has continued to operate a mobile unit so that applicants do not have to leave their workplaces to lodge their forms.
Security systems enhancements to the MSIC system were implemented this year to directly support the Federal Government’s continuing measures to strengthen security at the nation’s sea ports.
Performance Service DeliveryAsset & Infrastructure Management DivisionAsset Maintenance & Service Costs 2012/2013
39% Cargo Handling Equipment
11.1% Buildings and Improvements
4.0% Land Improvements
1.3% Railways1.4% Roads
7.3% Utilities
0.9% Land Unimproved
21.6% Interface Structures3.3% Navigational Aids
0.2% Dredged Areas
9.7% Plant & Equipment
Fremantle Ports Asset and Infrastructure
Management Division Asset Maintenance and Service Costs
2012-2013

26
FREMANTLE PORTS ANNUAL REPORT 2013
Performance Service Delivery
4G mobile networkMobile communications in and around the Inner Harbour have been significantly enhanced with Telstra’s installation of 4G mobile network technology on the observation deck of Fremantle Ports’ administration building.
Those with compatible mobile phones, tablets or data modems now have much faster access to the internet, with significant benefits for commercial shipping and recreational boating. Information such as tidal movements and weather data can be downloaded at speeds up to five times faster than 3G networks.
Anemometer refurbishedFrom its location on the signal station tower, Fremantle Ports’ anemometer measures Inner Harbour wind speed and direction. The device had become worn over time and was serviced this year to ensure accuracy of the data streams to Fremantle Ports’ Signal Station and Administration Building foyer.
The data is used by Vessel Traffic Services Officers assessing requirements for safe navigation of ships entering and departing port.
Telstra Area General Manager Guy Champion (left), Harbour Master/General Manager Port Operations Captain Allan Gray (centre) and Phil Scanlon, of Fremantle Sea Rescue, check out the 4G capacity on their mobile phones at the Signal Station.
Hydrographic Coordinator, Jay Illingworth organised the anemometer servicing.

27
FREMANTLE PORTS ANNUAL REPORT 2013
Performance Capability for the Future
OBJECTIVE:
Ensuring sound planning for all aspects of our business, including resources, services and infrastructure
Key outcomes sought:
• Completing important planning projects critical to our future.
Bulk businessWork has been completed on investigating designs and cost estimates for Kwinana Bulk Terminal import and export infrastructure upgrade projects to facilitate additional trade.
Rous Head Industrial Park developmentDevelopment of new land reclaimed at Rous Head as a product of harbour and channel deepening is progressing well. The 27 hectares represents about 20 per cent of the overall area of Rous Head and has provided an important opportunity to expand availability of Inner Harbour land and to plan the area to improve landside access and efficiency.
Following an Expressions of Interest process, agreements have been reached with proponents to establish new or expanded port-related developments. The new leases include a range of performance measures aimed at improving the efficiency of landside logistics associated with Inner Harbour operations.
Part of the land will be used for truck marshalling to provide improvement to traffic flows, especially when truck congestion is occurring. Other land uses include container logistics, storage, short-term warehousing and empty container parks. The design of the area will improve traffic flows and allow for the consolidation of some operations onto larger sites. The relocation of some operations will also release land to allow for the extension of the North Quay Rail Terminal so that longer trains can be handled.
The new truck marshalling area (TMA) and associated Caltex truck stop, with improved amenities for drivers were opened in June 2013. The TMA has an electronic call-up system for drivers to let them know when it is their turn to enter the container terminals to deliver or collect sea containers.
Fremantle Ports awarded a $13m contract to local civil and mining contractor Brierty Ltd to construct roads and install services on the reclaimed land. Construction of the roads and other infrastructure started in January 2013 and is expected to be completed towards the end of 2013.
A new vehicle fuelling centre and truck stop facility were completed at Rous Head.
Truck marshalling area.

28
FREMANTLE PORTS ANNUAL REPORT 2013
Performance Capability for the Future
A new public access road with dual use pedestrian/cycle path is currently under construction, providing improved and safer public access to the very popular North Mole. The Rous Head development also includes plans for a landscaped public area with seating, shade and a viewing platform next to the southern end of Port Beach.
Fremantle Ports has registered the Rous Head Industrial Park construction works for an Infrastructure Sustainability rating with the Australian Green Infrastructure Council. This is a member-based industry association committed to the delivery of more sustainable, innovative outcomes in the planning, design, engineering, environmental, financial, construction and social aspects of infrastructure development. Members include both public and private organisations.
Landside Logistics
Rail
A tender process to determine the future operator of the North Quay Rail Terminal was finalised, and Intermodal Link Services (ILS) was appointed for the next five years. The tender covered the management and operation of the North Quay Rail Terminal, growth of rail volumes, and development of intermodal facilities in the Kewdale/Forrestfield area.
In association with this, the State Government accepted recommendations that financial assistance to rail services should be maintained for another five years. This provides some certainty to rail operators that government support will continue, rather than having the funding on a year-to-year basis only.
While ILS has forecast strong growth in rail volumes over the five-year period, slower than expected trade growth and strong road competition has so far limited rail expansion.
Commonwealth and State Government funding of $38m was secured for development of rail infrastructure, enabling planning to proceed for expansion of the North Quay Rail Terminal and development of a “passing loop” at Spearwood. Both projects are due for completion by mid-2014.
Increased use of rail for transporting containers to and from the Inner Harbour terminals is a key strategy for managing trade growth in a sustainable way.

29
FREMANTLE PORTS ANNUAL REPORT 2013
Performance Capability for the Future
Road
The annual truck survey carried out in September indicated a lower level of truck productivity than in previous years, due mainly to an increase in empty running. In discussion with industry a number of possible causes for this were suggested but most of this was based on anecdotal and partial evidence. As a result, Fremantle Ports has begun a thorough investigation into trucking operations at the port and possible means to improve productivity. This study is due for completion in late 2013.
Significant steps were taken to improve the servicing of trucks through the container terminals and empty container parks (ECPs). A booking system for trucks at ECPs is now fully operational and has resulted in more orderly truck arrivals to the benefit both of park operators and road carriers. Changes to terminal operating procedures have resulted in historically low truck turn times, significantly better than the Australian average.
TE
Us
(Tho
usan
ds)
Market Share of Container on Rail - TEUs2001-02 to 2012-13
200
100
0
300
400
500
600
700
800
2011-12 2012-132010-112009-102008-092007-082006-072005-062004-052003-042001-02
Rail
Road
2%
98%
3%
97%
7%
93%
6%
94%
4%
96%
8%
92%
13%
87%
15%
85%
11%
89%
11%
89%
13%
87%
14%
86%
2002-03
Market Share of Containers on Rail
TEUs 2001- 02 to 2012 -13
Reducing average turnaround times is one of the goals in overall improvement of truck productivity.
Variable messaging signs are in use to provide directions for trucks in normal and congestion conditions.

30
FREMANTLE PORTS ANNUAL REPORT 2013
Performance Capability for the Future
Peak Season
Following a difficult Christmas peak season in 2011 due to an unprecedented spike in import volumes, Fremantle Ports worked closely with industry through the WA Port Operations Task Force to ensure the 2012 peak operated smoothly. A range of measures was introduced and these proved successful. The general consensus was that 2012 was one of the best-managed peak seasons for a number of years.
Importer Survey
Following on from the exporter survey conducted in 2011-12, Fremantle Ports undertook a survey of container importers via an online survey and face-to-face interviews with major participants. The survey focused on operations at importer premises, peak season planning considerations and issues related to container logistics.
The importer sector is notoriously difficult to communicate effectively with due both to the large number of small businesses involved and the fact that most importers prefer to leave port-related matters to their agents. Despite this, a response rate of almost 50 per cent was achieved, a good result for this type of survey.
Workshops were held with industry participants to discuss survey findings and prioritise future actions. One of the major findings related to the lack of engagement of the importer sector with the supply chain and a range of actions was identified to address this. A working group of industry participants is being set up to take these actions forward.
Trucks off road and rail share
Trucks Off Road
Rail Share
Tru
cks
Off
Ro
ad (
’000
)
0
10
20
30
40
50
60
70
80
12-1311-1210-1109-1008-0907-0806-0705-0604-0503-0402-03
Trucks Off Road and Rail Share - 2002-03 to 2012-13
Rai
l Sha
re o
f To
tal T
rade
(%
)
0%
2%
4%
6%
8%
10%
12%
14%
16%
Senior Logistics Analyst Jennifer Hall ran a series of industry workshops in April, relating to the importer survey.

31
FREMANTLE PORTS ANNUAL REPORT 2013
Performance Capability for the Future
Monitoring performance and promoting higher standards of service delivery
The opening up of a number of new sites on the reclaimed land at Rous Head has provided an opportunity to incorporate key performance indicators into new leases. These indicators will enable performance of port service providers to be monitored on a continuous basis. Incentives and penalties will be applied to maintain and, where possible, improve performance. Fremantle Ports’ aim is to widen the application of key performance indicators as existing leases come up for renewal.
Post-panamax cranes deliveredTwo new cranes were delivered to Asciano’s Patrick Terminal at North Quay during the year. The cranes, manufactured in China, are used to load and unload containers from large container ships now calling at Fremantle.
Victoria Quay Waterfront
Precinct plans take shape
Fremantle Ports engaged Fremantle-based CODA Studio to provide urban design services in the preparation of three precinct plans for the Commercial Precinct area of Victoria Quay, and the areas surrounding the Fremantle Train Station and Pioneer Park.
In co-operation and close consultation with the Public Transport Authority and the City of Fremantle, and in consultation with community, the aim is to achieve further revitalisation of these areas. Achieving improved links and integration with Fremantle city central is another important aim and opportunity.
The three plans being developed will provide a framework that will guide future development proposals for the areas nominated. It is envisaged that when ultimately developed, the Commercial Precinct on Victoria Quay will include an office component, an appropriate level of retail uses, cafes and restaurants as well as public spaces, walkways and plazas.
Key issues analysed include town planning, urban design, transport and traffic, economic development, land uses, social, cultural and heritage issues and environmental considerations.
There has been wide-ranging community input into the development of the high-level plans. Consultation undertaken included meetings with community representatives, a community workshop and a planning development and design forum, followed by design studio and community feedback sessions.
Interested members of the community and other stakeholders will be invited to attend community open days once the preferred plans have been developed to a stage where they are ready for presentation.
Students at the University of Notre Dame were among those consulted on the precinct planning.
Zhen Hua arrives from Shanghai with a new crane for Asciano’s Patrick Terminal at North Quay. Three other cranes on board were bound for Patrick terminals in Brisbane and Melbourne.
The enabling precinct plans being developed will provide a greater level of land use detail and will be used as a framework in the future to assess specific development proposals.

32
FREMANTLE PORTS ANNUAL REPORT 2013
Performance Trade and Business Growth
OBJECTIVE:
Promoting and facilitating trade and business growth opportunities
Key outcomes sought:
• Maintaining existing trade and business and capturing new trade and business opportunities.
Working with Customers Fremantle Ports has continued to conduct a regular formal customer liaison program. This has been successful in developing positive relationships and customer loyalty. The information provided by customers during the year has allowed Fremantle Ports to understand not only the priority areas when dealing with customers but also to assist in forward planning for port infrastructure such as cargo-handling equipment.
Fremantle Ports has introduced quarterly catch-up meetings with major customers and this has been successful in improving communication.
In the 2012-13 annual survey of shipping lines, 90 per cent of respondents were satisfied or very satisfied with Fremantle Ports’ services.
A motor vehicle forum held in August 2012 with representatives from the imported motor vehicle industry examined the value chain and agreed actions towards achieving improvements.
As a result of findings in a break-bulk customer forum, a break-bulk reference group with the assistance of industry conducted trials with steel imports which involved importers remaining open longer and an off-wharf distribution centre which proved successful. However, industry was reluctant to continue trials due to extra costs involved.
The motor vehicle import trade increased by 18.1 per cent over the past 12 months, exceeding forward projections. An increasing factor in availability of stacking space on Victoria Quay is the used of the specially constructed heavy-duty ramp on H Berth for roll-on roll-off project imports which take up considerable stacking area. There is a need to provide sufficient stacking to cater for anticipated growth in new motor vehicle imports and the ability to handle shipments of up to 6000 vehicles.
Fremantle Ports has undertaken further investigation this year on the feasibility of introducing multi-level car decking and is also looking at how to achieve greater efficiency in discharge operations to reduce the number of days it takes to clear a large shipment from Victoria Quay.
Fremantle Ports’ Inner Harbour handles almost all of Western Australia’s container trade.
There were 216 visits from vehicle carriers during the year.

33
FREMANTLE PORTS ANNUAL REPORT 2013
Performance Trade and Business Growth
Re-commencement of lead exportsRosslyn Hill Mining (previously Magellan Metals) began lead exports from Fremantle Ports’ Inner Harbour in April 2013.
The product arrives at the port by rail in double-bagged form within locked sea containers which have been inspected independently at the mine site before departure. There are strict compliance conditions associated with the Ministerial approval for the export of the lead. The company is reporting its monitoring results to Fremantle Ports which then forwards these on to its Inner Harbour Community Liaison Group. The results of monitoring are publically available on the company’s website.
The company estimates the annual tonnage through Fremantle to be 95,000 to 98,000 tonnes.
Cruise ShippingFremantle Port had 17 visits in 2012-13 compared with 40 the previous year.
The total number of calls was impacted by the cancellation of nine planned visits by the Pacific Sun in the second half of 2012, with a further nine that had been scheduled for 2013. This followed an announcement by Carnival Australia that the ship had been sold and her cruises in Australia would cease in July 2012. Also contributing to the reduced number of calls was the cancellation of Athena’s summer cruise season in Australia when the operator, Classic International Cruises went into voluntary administration.
One of the visitors calling for the first time at Fremantle was the huge cruise liner, Voyager of the Seas. This ship, which carries up to 3,800 passengers, called on 9 March. Celebrity Solstice called at Fremantle Port on 15 February for the first time and Queen Mary 2 was back for a fourth visit on 26 March.
Fremantle Ports looks forward to welcoming a new cruise liner to Fremantle in December 2013, when the 620-passenger capacity Astor arrives for its inaugural seasonal basing. The Astor, which is on charter for three years to privately owned cruise operator Cruise and Maritime Voyages, will make 15 calls in its first season based in Fremantle.
Complimentary wi-fi for cruise ship passengers
Fremantle Ports, with support from Tourism WA, has installed a wireless connection for cruise ship passengers and the visiting public while they are in and around the Fremantle Passenger Terminal on Victoria Quay.
The complimentary internet connection helps passengers to plan their day in WA as well as enable them to check their emails and social media while off the cruise vessel.
Queen Mary2 departs port, with STS Leeuwin in the foreground.
Fremantle Ports has received positive feedback on the availability of wi-fi in the Fremantle Passenger Terminal.

34
FREMANTLE PORTS ANNUAL REPORT 2013
Performance Trade and Business Growth
Passengers can also make the most of their Fremantle visit by downloading Tourism WA’s free ‘Experience WA Mobile App’, which has information on thousands of places to see and explore in the metropolitan area and around the State.
Property managementSince taking over the management of the E Shed Markets in 2011, Fremantle Ports has undertaken significant upgrading of the premises.
Promotion of E Shed Markets as a visitor destination has also been stepped up and Fremantle Ports has initiated and coordinated a number of free activities to attract patrons.
International 5 5 7 11 7 8
13 8 18 5 9 17
14
14
14
25
11
18
17
23
12
5Home Base
Ves
sels
0
5
10
15
20
25
30
2012-132011-122010-112009-102008-092007-082006-072005-062004-052003-042002-03
Cruise vessels visiting Fremantle Ports
Cruise vessels visiting Fremantle Port
Passengers through Fremantle Port
Transit Pax 20,492 10,386 4,954 8,181 2,920 9,000
850 3,669 3,775 2,933 3,700 11,500
13,788
12,080
17,763
37,127
11,134
20,508
14,705
37,207
11,348
21,244Disembarking Pax
Pas
seng
ers
0
5000
10000
15000
20000
25000
30000
35000
40000
est 13-142012-132011-122010-112009-102008-092007-082006-072005-062004-052003-042002-03
Passengers visiting Fremantle Port - 2013
950 1,745 4,060 2,991 3,500 12,500 12,366 37,644 20,679 38,053 22,507Embarking Pax
19,276
23,328
24,981

35
FREMANTLE PORTS ANNUAL REPORT 2013
Performance Trade and Business Growth
An internal team was established to review Fremantle Ports’ property inspection program and to make recommendations in relation to the nature of any future programs, including type and frequency of inspections and the process of managing follow-up actions.
The outcome sought is to ensure that tenants’ and Fremantle Ports’ obligations in respect to leases are discharged, contributing to improved safety and environmental performance, improved relationships, reduced liability risk and protection of assets.
Rous Head MarinaFremantle Ports is continuing to progress plans for the development of a new recreational marina within Rous Head Harbour. Following a multi-stage public request for expressions of interest process, Fremantle Ports selected a preferred proponent for the development in 2012. Negotiations have been continuing since to finalise a development agreement and long-term lease under which the proponent will develop and operate the proposed facility.
While there are a number of significant challenges associated with the project that still need to be overcome, Fremantle Ports is confident that the agreements will be finalised in the near future and that a development application will be submitted to the Western Australian Planning Commission. Current plans for the site allow for the provision of more than 150 marina pens, 400 dry storage pens and a substantial commercial development that will potentially include cafés, restaurants and other marina-related businesses.
Flotel visitThe first floating hotel (flotel) and service vessel in the world to be built exclusively for the offshore oil and gas industry visited Fremantle for a few days in February. MV Edda Fides can accommodate up to 600 people and has a 1400m2 deck area, hospital and helicopter deck. The ship was working in Bass Strait before arriving in Fremantle and leaving for Singapore.
Duyfken returnsThe Premier, the Hon Colin Barnett MLA visited Victoria Quay on 23 September 2012 to welcome the Duyfken back to Western Australia. The Fremantle-built replica of this 17th century ship will be home-based in Western Australia for the next 10 years with financial support from the State Government.
MV Edda Fides was an unusual visitor to the Inner Harbour.
The Duyfken 1606 replica received a warm reception on return to Fremantle.
E Shed Markets, Victoria Quay

36
FREMANTLE PORTS ANNUAL REPORT 2013
Performance Trade and Business Growth
Trade Results Total port trade reached 32.0 million tonnes in 2012-13, 13.2 per cent up on the 28.2 million mass tonnes in 2011-12. The main reason for the increase in trade volumes in 2012-13 was a rise in Outer Harbour bulk exports, particularly iron ore and grain exports.
Total imports increased by 0.4 million tonnes or 2.7 per cent and total exports increased by 3.4 million tonnes or 23.1 per cent for this period.
Bulk cargo contributed 24.6 million mass tonnes or 77.0 per cent of total port trade in 2012-13, 2.8 per cent higher than last year. Bulk grains and oilseeds exports increased by 1.1 million tonnes or 28.9 per cent and iron ore exports increase by 1.7 million tonnes or 93.9 per cent. The port’s principal bulk cargo, petroleum products, increased from 8.0 million mass tonnes in 2011-12 to 8.6 million mass tonnes in 2012-13. Crude petroleum imports were up 0.2 million tonnes or 3.5 per cent compared with 2011-12. Refined petroleum imports increased by 7.6 per cent and refined petroleum exports (including bunkers) increased by 16.0 per cent.
Inner Harbour imports decreased by 1.3 per cent and exports increased by 3.8 per cent. Total containers handled increased by 2.0 per cent in 2012-13 to 670,282 TEU (twenty-foot equivalent units), an increase of 13,370 TEU on the previous year. Full container trade increase by 2.8 per cent in 2012-13 compared with 2011-12.
Non-container cargoes in the Inner Harbour decreased by 4.4 per cent compared with the previous year. Imports decreased slightly by 0.9 per cent compared with the previous year mainly due to reductions in industrial and agricultural vehicles, other transport equipment and iron and steel products. Exports decreased by 8.5 per cent compared with last year, mainly due a decline in metal scrap.
Total Port Trade 2003-2004 to 2012 -2013
0
5
10
15
20
25
30
35
12-1311-1210-1109-1008-0907-0806-0705-0604-0503-04
Imports 11.728 11.545 11.236 12.010 13.009 12.545 12.103 13.102 13.663 14.030
Exports 14.234 14.108 13.937 13.043 13.122 14.043 14.065 13.043 14.579 17.950
Total 25.939 25.546 25.112 25.053 26.131 26.603 26.168 26.145 28.242 31.980
Mas
s T
onn
es (
Mill
ions
)
Total Port Trade 2003-04 - 2012-13
Equipment for the mining industry is an increasingly significant component of break-bulk cargo handled through Fremantle Port.
Loading iron ore for export at the Kwinana Bulk Terminal.

37
FREMANTLE PORTS ANNUAL REPORT 2013
Performance Trade and Business Growth
In volume terms the port’s principal export commodities are grain, iron ore, alumina, refined petroleum and coal which together account for 80.8 per cent by volume of total exports.
Major Trading Regions Trade with East, South East and Southern Asia amounted to 58.9 per cent of total port trade in 2012-13, 2.1 percentage points higher than 2011-12. Over the period 2001- 02 to 2012 -13, trade with East, South East and Southern Asia has grown at an annual rate of 6.8 per cent. Trade with East Asia increased by 16.5 per cent compared with last year, mainly due to an increase in trade with South Korea and China. South East Asia trade has increased by 10.7 per cent mainly due to trade with Malaysia and the Philippines.
Australian coastal cargo accounts for 12 per cent of total port trade, the Middle East for 16 per cent, UK and Europe 4 per cent, North America 3 per cent, Africa 2 per cent and New Zealand 1 per cent. A cautionary note is that some of these figures could be deflated because of trans-shipments through Singapore. (A graphical presentation showing the link with world trade is shown in the appendix of Statistical Information).
ImportsTotal imports increased by 2.7 per cent during 2012-13 to 14.0 million tonnes. Inner Harbour imports decreased by 1.3 per cent, mainly due to a decline in non-containerised cargo. Imports in the Outer Harbour increased by 4.4 per cent mainly due to a rise in crude petroleum and sulphur.
11% Iron Ore
1% Barley
1% Manufacturers of Metal
1% Canola Seed
1% Metal Scrap
1% Animal Feeds
1% Sulphur
2% Iron and Steel Products
2% Chemicals and Related Products
2% Phosphates - Fertilisers, Manure
3% Caustic Soda
2% Cement Clinker
2% Black Coal
13% Wheat
9% Alumina
21% Other
27% Petroleum
Principal Commodities Imports/Exports 2012/2013
Principal Commodities Imports/Exports 2012 -2013
38
FREMANTLE PORTS ANNUAL REPORT 2013
Performance Trade and Business Growth
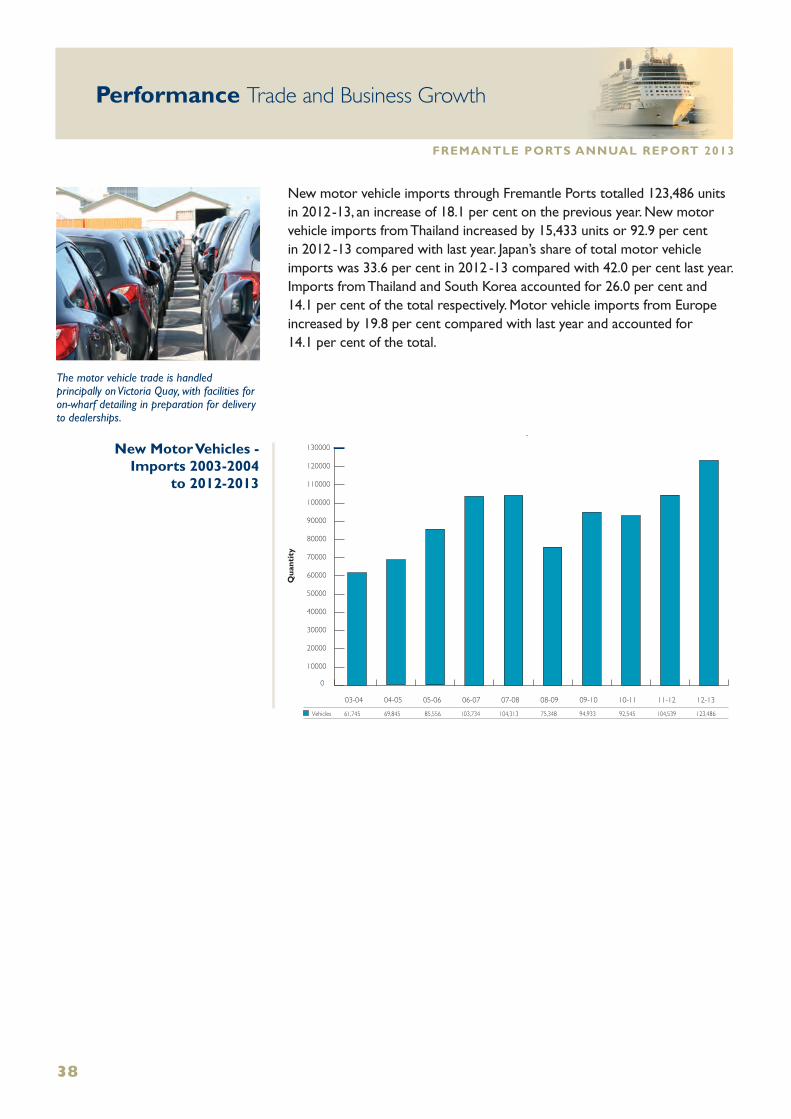
New motor vehicle imports through Fremantle Ports totalled 123,486 units in 2012 -13, an increase of 18.1 per cent on the previous year. New motor vehicle imports from Thailand increased by 15,433 units or 92.9 per cent in 2012 -13 compared with last year. Japan’s share of total motor vehicle imports was 33.6 per cent in 2012 -13 compared with 42.0 per cent last year. Imports from Thailand and South Korea accounted for 26.0 per cent and 14.1 per cent of the total respectively. Motor vehicle imports from Europe increased by 19.8 per cent compared with last year and accounted for 14.1 per cent of the total.
0
10000
20000
30000
40000
50000
60000
70000
80000
90000
100000
110000
120000
12-1311-1210-1109-1008-0907-0806-0705-0604-0503-04
Qua
ntit
y
New Motor Vehicles - Imports 2003-04 to 2012-13
Vehicles 61,745 69,845 85,556 103,734 104,313 75,348 94,933 92,545 104,539 123,486
130000New Motor Vehicles - Imports 2003-2004
to 2012-2013
The motor vehicle trade is handled principally on Victoria Quay, with facilities for on-wharf detailing in preparation for delivery to dealerships.

39
FREMANTLE PORTS ANNUAL REPORT 2013
Performance Trade and Business Growth
Bulk 2011-12 2012-13
Crude Petroleum 5,360 5,546
Refined Petroleum 920 991
Caustic Soda 790 897
Cement Clinker 797 737
Sulphur 348 478
Phosphates - Fertilisers, Manures 541 454
Slag Residue 191 276
Urea 193 189
Ammonia 128 151
Urea Ammonium Nitrate (Uan) 143 109
Other 213 252
Totals 9,624 10,080
Non Container General Cargo 2011-12 2012-13
New Motor Vehicles 167 201
Iron and Steel Products 175 159
Vehicles - Industrial and Agricultural 188 151
Machinery - Agricultural, Industrial 37 64
Other Transport Equipment and Parts 57 33
Manufactures of Metal 16 17
Rubber Manufactures 15 17
Ammonium Nitrate 20 8
Miscellaneous Manufactured Articles 20 0
Unclassified Goods 3 3
Other 7 8
Totals 705 661
Container 2011-12 2012-13
Iron and Steel Products 375 317
Chemicals and Related Products 353 335
Manufactures of Metal 256 317
Paper, Paperboard and Articles of Paper 167 184
Machinery - Agricultural, Industrial 163 147
Plastic Wares and Other Manufactures 150 142
Furniture and Parts Thereof 128 123
Rubber Manufactures 114 123
Bricks, Tiles, Pavers 117 115
Ale, Beer and Stout; Cider (Alcoholic) 111 112
Other 1,399 1,373
Totals 3,333 3,288
Import Cargo Classified According to Cargo Class -
Thousands of Tonnes
Asciano’s Patrick terminal, North Quay
Common user Berths 1 and 2 on North Quay are used for some break-bulk cargo.

40
FREMANTLE PORTS ANNUAL REPORT 2013
Performance Trade and Business Growth
ExportsTotal exports increased by 23.1 per cent during 2012-13 to 17.9 million tonnes. Inner Harbour exports increased by 3.8 per cent compared with the previous year. Containerised cargo increased by 4.5 per cent in 2012-13 mainly due to increases in hay, other cereals and non-ferrous metals. Non-containerised cargo decreased 8.5 per cent in 2012-13 mainly due to metal scrap and bunkers.
Outer Harbour exports increased by 29.1 per cent mainly due to the rise in grain and iron ore. Bulk wheat exports increased by 38.3 per cent or 1.1 million tonnes in 2012-13. Iron exports increased by 1.7 million tonnes or 93.9 per cent compared with the previous year.
In 2012-13, Fremantle Ports’ major overseas export markets by volume (percentage of total exports) were China, 29.9 per cent, South Korea 7.6 per cent, Indonesia 6.7 per cent, India 6.1 per cent, Japan 6.0 per cent, Singapore 4.3 per cent, Malaysia 3.7 per cent and Philippines 3.3 per cent. Exports to China increased by 13.0 per cent in 2012-13 and represent 5.4 million tonnes or 29.9 per cent of total exports, making China Fremantle’s principal export trading partner. Iron ore and alumina are the major exports to China representing 3.4 million tonnes and 0.75 million tonnes respectively in 2012-13. Iron ore exports to China are estimated to grow to 4 million tonnes within a few years.
Exports to other Australian ports were 2.3 million tonnes in 2012-13, 7.5 per cent higher than last year, predominantly due to an increase in alumina shipments to the ports of Geelong and Portland.
DP World Terminal, North Quay

41
FREMANTLE PORTS ANNUAL REPORT 2013
Performance Trade and Business Growth
Bulk 2011-12 2012-13
Wheat 2,877 3,977
Iron Ore 1,828 3,545
Alumina 2,877 2,894
Refined Petroleum 1,678 2,017
Black Coal 488 689
Barley 619 461
Canola Seed 328 347
Ships Bunkers 155 110
Sulphuric Acid 200 82
Animal Feeds 77 71
Other 205 364
Totals 11,332 14,557
Non Container General Cargo 2011-12 2012-13
Metal Scrap 313 285
Sheep 89 85
Cattle and Calves 30 32
Vehicles - Industrial and Agricultural 8 12
Machinery - Agricultural, Industrial 6 8
New Motor Vehicles 3 7
Ammonium Nitrate 8 4
Other Transport Equipment and Parts 3 3
Manufactures of Metal 1 3
Other Crude Minerals 11 0
Other 4 5
Totals 476 444
Container 2011-12 2012-13
Animal Feeds 246 338
Waste Paper 229 236
Mineral Sands 147 193
Non Ferrous Metals 117 178
Malt 174 157
Titanium Dioxide 174 137
Oats 103 133
Chemicals and Related Products 125 127
Metal Scrap 93 118
Fresh Fruit and Vegetables 106 96
Other 1,224 1,235
Totals 2,738 2,948
Export Cargo Classified According to Cargo Class -
Thousands of Tonnes

42
FREMANTLE PORTS ANNUAL REPORT 2013
Performance Trade and Business Growth
Container TradeWhen compared with 2011-12:
• Total container trade increased by 2.0 per cent. Exports increased by 4.5 per cent and imports decreased 0.2 per cent.
• Full container exports increased by 8.6 per cent or 13,762 TEU and full imports decreased marginally by 35 TEU.
• Empty container exports increased by 0.1 per cent and empty imports decreased by 3.6 per cent.
• Coastal container throughput decreased by 9.4 per cent or 6,986 TEU. Coastal full container throughput totalled 57,701 TEU, a decrease of 7.3 per cent.
Imports 299,077 287,960 288,474
281,274 277,529 268,984
580,351 565,489 557,458
310,180
288,796
598,976
344,453
312,459
656,912
343,900
326,382
670,282
Exports
Total
TE
Us
TEUs - Twenty foot equivalent unitsGrowth p.a. 2007-08 to 2012-13 - 2.9%
0
75000
150000
225000
300000
375000
450000
525000
600000
675000
750000
12-1311-1210-1109-1008-0907-08
Container Trade - Comparison 2007-08 to 2012-13
Container Trade Comparison 2007-2008
to 2012-2013
Imports 255,713 255,765 263,815 293,210 329,999
198,842 190,791 178,892 168,869 160,758
454,555 446,556 442,707 462,079 490,757
Exports
Total
TE
Us
TEUs - Twenty foot equivalent unitsGrowth p.a. 2007-08 to 2012-13 - 2.1%
0
100000
200000
300000
400000
500000
600000
2012-132011-122010-112009-102008-092007-08
329,964
174,520
504,484
Full Container TradeComparison 2007-08 to 2012-13
Full Container Trade Comparison 2007-2008
to 2012-2013

43
FREMANTLE PORTS ANNUAL REPORT 2013
Performance Trade and Business Growth
Major Container Commodities Imported - TEU
Commodities 2011-12 2012-13 Variance %
Furniture 30,768 29,966 -2.61%
Manufactures of Metal 25,352 29,001 14.39%
Iron and Steel Products 25,180 21,210 -15.77%
Machinery - Agricultural, Industrial 21,923 20,213 -7.80%
Chemicals and Related Products 19,995 19,370 -3.13%
Paper, Paperboard and Articles of Paper Pulp 17,362 19,540 12.54%
Plastic Wares and Other Manufactures 18,327 18,161 -0.91%
Rubber Manufactures 16,342 17,974 9.99%
Household Appliances 12,832 14,323 11.62%
Fabricated Construction Materials 10,262 10,589 3.19%
Unclassified Goods 10,572 9,004 -14.83%
Total 208,915 209,351 0.21%
Percentage of Total Full TEU Imports 63.3% 63.4%
Major Container Commodities Exported - TEU
Commodities 2011-12 2012-13 Variance %
Animal Feeds 19,165 26,790 39.79%
Waste Paper 19,969 21,197 6.15%
Malt 12,567 10,500 -16.45%
Chemicals and Related Products 7,574 7,619 0.59%
Titanium Dioxide 8,423 6,691 -20.56%
Oats 6,417 7,807 21.66%
Mineral Sands 5,947 7,662 28.84%
Non Ferrous Metals 5,482 8,034 46.55%
Fresh Fruit and Vegetables 6,887 6,500 -5.62%
Metal Scrap 5,319 7,118 33.82%
Fresh Meat - Chilled or Frozen 4,556 5,661 24.25%
Unclassified Goods 5,761 3,835 -33.43%
Total 108,067 119,414 10.50%
Percentage of Total Full TEU Exports 67.2% 68.4%
Top Ten Container Commodities
Imported and Exported

44
FREMANTLE PORTS ANNUAL REPORT 2013
Performance Trade and Business Growth
Fremantle’s Trading PartnersFremantle Ports’ top 10 overseas trading partners collectively account for 66.3 per cent of total non trans-shipment full container trade (refer table below). Australian coastal container trade accounts for a further 11.3 per cent.
TOP TEN CONTAINER TRADING PARTNERS
Percentage of Total Full Container TradeCountry 2011-12 2012-13
China 133,452 144,925
Japan 28,847 32,479
Malaysia 25,491 27,447
South Korea 24,662 25,406
Indonesia 21,801 23,083
Thailand 21,339 22,587
United States of America 21,300 21,614
Singapore (1) 18,579 16,740
Vietnam 10,165 9,829
India 9,045 9,083
Top 10 Countries percentage of Total Country Trade 64.1% 66.3%
Excludes all trans-shipment and empty containers
(1) Hub Port: May include cargo trans-shipped through Singapore to and from other destinations and origins.
Livestock
LIVESTOCK ExPORTS 2012 -13
Destination Sheep CattleOther
LivestockTotal
No.% of
Total
Africa 656 656 0.04%
Asia East 3,550 3,550 0.20%
Asia South-East 4,187 17,297 21,484 1.19%
Asia Southern 1,627 1,627 0.09%
Indian Ocean - Mauritius 1,600 1,600 0.09%
Mediterranean - Turkey 76,017 15,412 91,429 5.06%
Middle East 1,620,102 63,309 1,683,411 93.24%
Russia 1,701 1,701 0.09%
Totals 1,700,306 105,152 1,805,458 100%
Live sheep 1,700,306 head of live sheep were exported through the Port of Fremantle in 2012-13, a decrease of 85,014 head or 5.0 per cent compared with 2011-12.
DP World terminal, North Quay

45
FREMANTLE PORTS ANNUAL REPORT 2013
Performance Trade and Business Growth
Fremantle Ports’ share of total Australian live sheep exports was 83 per cent in 2012 -13, compared to 70 per cent in 2011-12 and 77 per cent in 2010 -11. The value of live sheep exports through Fremantle Ports in 2012 -13 was $A164 million.
Exports from Australia during 2012-13 were 2.06 million head, 19.5 per cent lower than the previous year. The Middle East was the destination of almost all of Australian live sheep exports in 2012 -13.
Kuwait was the largest export market for Australian live sheep in 2012 -13 with 0.7 million head exported, followed by Qatar, Jordan, Turkey, Israel, Saudi Arabia, Bahrain, United Arab Emirates and Oman.
Source of total Australian live sheep export statistics and value of trade: Australian Bureau of Statistics.
Live CattleLive cattle exports from Fremantle reached 105,152 head in 2012 -13, an increase of 8,248 head or 8.5 per cent on the 2011-12 total.
Fremantle Ports’ share of total Australian live cattle exports was 11.6 per cent in 2012 -13. The value of live cattle exports through Fremantle Ports in 2012 -13 was $A80.5 million.
In 2012 -13, the largest export markets served from Fremantle were Israel and Turkey which account for 65.3 per cent of total live cattle exports.
Source of total Australian live cattle export statistics and value of trade: Australian Bureau of Statistics.
Source of information on live sheep and cattle trade: Meat and Livestock Australia, Australian Cattle and Sheep Industry Projections 2013 and ABARE - Australian Commodities Forecasts and Issues June Quarter 2013.
Live Sheep Exports 2008-2009 to 2012 -2013
0.0
0.5
1.0
1.5
2.0
2.5
3.0
3.5
12-1311-1210-1109-1008-09
3.10 2.23 2.27 1.79 1.70
Live Sheep Exports2008-09 to 2012-13
Hae
d o
f Liv
e S
heep
(M
illio
ns)
Head
Livestock carrier Ocean Outback arrives to take on stock.

46
FREMANTLE PORTS ANNUAL REPORT 2013
Performance Trade and Business Growth
OUTLOOK
Treasury projectionsAverage growth in the State’s main trading partners is expected to be stronger than for the rest of the world, but there are several risks to this outlook that could impact Western Australia. Three key risks include a sharper than expected slowing in China’s economic growth, the risk that sovereign debt concerns in the euro area could worsen, and the possibility that early signs of recovery in the US economy are not sustained.
The Western Australian economy is expected to undergo a transition from business investment-led growth to export driven growth over the medium-term. This change is reflected in a forecast moderation in domestic economic growth (which includes business investment, household spending and dwelling investment) and a stronger contribution to growth from the external trade sector.
Consistent with a high Australian dollar reducing price pressure on imported goods, and modest quarterly CPI growth over the year, Perth’s CPI increased by 2.3% in 2012 -13. Perth’s CPI is forecast to increase by 2.5% in 2013 -14 and beyond. This is in line with national CPI forecasts by the Reserve Bank of Australia (RBA), though slightly higher than projections by the Commonwealth Treasury for 2013 -14 and 2014 -15. The difference in forecasts reflects the recent depreciation of the Australian dollar, which (all else equal) will increase the price of imported goods.
Data: Government of WA 2013 - 2014 Budget, Economic and Fiscal Outlook, Budget Paper No. 3.
Trade outlook for 2013-14 Fremantle’s total full container trade increased by 2.8 per cent in 2012 -13. Full container imports in 2012 -13 were similar to 2011-12 with zero percent growth. The nil growth in import containers was driven to a large extent by weaker domestic demand and slower growth in several key emerging market economies. Full container exports increased by 8.6 per cent mainly due to a strong hold on markets for commodities hay and waste paper. The total container throughput in 2013 -14 is forecast to increase by 13,353 TEU or 2.0 per cent.
Fremantle Port’s new motor vehicle imports increased by 18.1 per cent in 2012 -13 compared with 2011-12. Further growth is expected in new motor vehicle imports in 2013 -14 though the Federal Government’s recent changes to fringe benefit tax have impacted on previous more optimistic forecasts. Non-containerised imports in 2012 -13 have steadied after imports increased significantly in 2011-12, predominately due to the growth in North West development. Non-containerised cargo is forecast to decrease in 2013 -14 mainly due to the slowing of Western Australia’s mining boom.
Navios Vector departs Victoria Quay.

47
FREMANTLE PORTS ANNUAL REPORT 2013
Performance Trade and Business Growth
Fremantle’s live sheep exports decreased by 4.8 per cent to 1.7 million head in 2012 -13. The forecast for 2013 -14 is for this trade to decrease to 1.2 million head. The forecast for Australia for live sheep exports is for a decrease to around 2.0 million head in 2013, the lowest for more than 20 years. Meat and Livestock Australia has predicted that this total figure could decline further if seasonal conditions improve, especially in Western Australia, to the point where flock retention becomes a more viable option, or if there is a substantial increase in wool prices in 2013.
Fremantle Ports’ Kwinana Bulk Jetty and Kwinana Bulk Terminal bulk cargo tonnages represent around 29.6 per cent of total port bulk cargo volumes. Kwinana Bulk Jetty trade increased by 0.1 million tonnes or 4.6 per cent to 2.1 million tonnes in 2012 -13. The increase was mainly due to rises in imports of sulphur and refined petroleum. Trade throughput at Kwinana Bulk Jetty is forecast to be around 2.1 million tonnes in 2013 -14.
The total trade throughput at Kwinana Bulk Terminal increased by 1.8 million tonnes or 55.0 per cent to 5.2 million tonnes in 2012 -13, predominantly due to increases in iron ore exports. An increase in total trade at KBT of 0.25 million tonnes is expected in 2013-14 mainly due to cement clinker imports.
Exports of grains from Co-operative Bulk Handling’s Kwinana terminal reached 5.0 million tonnes in the 2012 -13, an increase of 1.1 million tonnes compared with 2011-12. While Western Australia’s 2012 -13 winter crop harvest decreased by an estimated 35 per cent compared with 2011-12, grain shipments from Kwinana reached the highest level in seven years. The winter crop report by ABARE has forecast winter crop production to increase by 25 per cent to 13.6 tonnes following the very dry season in 2012 -13. The export of grain throughput at CBH in Kwinana is forecast to be around 4.5 million tonnes in 2013 -14.
Petroleum product, Fremantle Port’s major bulk commodity, is forecast to be around 8.5 million tonnes in 2013 -14, and dry bulk alumina exports are expected to remain at levels similar to 2012 -13 or 2.9 million tonnes.
Iron ore carrier at Kwinana Bulk Terminal
Loading grain at the Kwinana Grain Jetty

48
FREMANTLE PORTS ANNUAL REPORT 2013
Performance Support Services
OBJECTIVE:
Ensuring appropriate and cost effective resources, processes and systems to support service delivery
Key outcomes sought:
• Support services are focused on improvements in service delivery and organisational culture
Our People
Staffing
Fremantle Ports’ full-time equivalent employees total at 30 June 2013 was 334, compared with 338.65 last year. The natural attrition rate was 1.5 per cent and resignations comprised 4.19 per cent. The total attrition rate was 5.59 per cent.
Organisational Culture and Capability
Fremantle Ports’ People Plan, first developed in 2006, helps set strategic direction for human resource management at Fremantle Ports. It was revised this year to reflect the organisation’s business objectives and targets. The 2013-2018 People Plan focuses on growing Fremantle Ports’ constructive culture and performance effectiveness with key objectives of developing and maintaining a high performing team culture, living the corporate values, commitment to success and attracting and keeping the right people.
Since the assessment of Fremantle Ports’ leadership culture in 2012, each division has developed actions to address the opportunities identified. Of particular relevance is the need to continue to focus on building cooperative and collaborative relations and practices organisation-wide. Extensive coaching of managers and other employees has focused on developing personal and leadership skills linked with 360 degree feedback.
Succession planning forms part of the People Plan, with this process strongly linked with planned retirements of people in key positions and developing potential successors.
Employee Relations
Two new enterprise agreements for Bulk and General Stevedoring and Operations and Services employees were approved by Fair Work Australia during the past year. Negotiations will begin in the second half of 2013 for the replacement of the Administration and Management Enterprise Agreement 2010 due to expire in January 2014.
Sean Ireland (right) receives his Certificate IV in Vessel Traffic Service from Deputy Harbour Master Alec Millett.

49
FREMANTLE PORTS ANNUAL REPORT 2013
Performance Support Services
Occupational Safety, Health and Injury Management
This topic is covered in the Disclosures section of the Report on Page 130.
Health and Wellness
A wide-ranging program was offered to employees again this year on health and wellness awareness opportunities. These included skin cancer checks, flu vaccinations, heart checks and first aid training. Topics for awareness sessions included mental health, ergonomics, stress management, fatigue and sleep management, nutrition and healthy eating choices, hydration and working in high temperatures, glaucoma and other eye diseases and back care. The program was expanded to include financial health, with a financial education program on offer.
Fremantle Ports has continued to offer an offsite confidential employee assistance program for employees and immediate family members experiencing personal problems. In addition, a recently introduced program focuses on building constructive and resilient thinking and behaviours.
Employee Professional Development
The Employee Development Program has been revised recently, resulting in a simpler and more flexible approach in reviewing and monitoring people performance, professional development and aligning individual employee plans and development to strategic and business plans and objectives.
Work experience and traineeships
Fremantle Ports has hosted 14 work experience students in the past year, significantly up on previous years and has drawn people into short-term graduate roles.
Michelle Lee spent the second semester of 2012 at Fremantle Ports as an intern in the External Affairs branch. She has since achieved a Bachelor of Marketing and Public Relations degree from Notre Dame University.
Fremantle Ports entered a crew in the Fremantle Rowing Club Corporate Challenge.
Training in facilitation for 16 employees has increased Fremantle Ports’ ability to provide in-house support where facilitation skills are required.
Technical Computing trainee, Emily Williamson with Help Desk Officer Roseann Blackburn.

50
FREMANTLE PORTS ANNUAL REPORT 2013
Performance Support Services
Information systems and technologyThe focus of Fremantle Ports’ information systems development in 2012 -13 was on providing new capability to users while increasing the robustness, stability and sustainability of existing systems.
There were several noteworthy achievements including:
• enhanced reporting of safety key performance indicators and analysis and mapping of safety procedures;
• implementing a new customer relationship management system which is improving engagement between Fremantle Ports, its customers and other key stakeholders;
• delivery of systems initiatives and improvements covering safety and customer relationship management;
• introduction of payments to suppliers by electronic funds transfer;
• developing and piloting a new key performance indicator program to enhance operational reporting in Fremantle Ports’ bulk business and improve the capability for “root cause” analysis, leading to improved customer service; and
• significantly enhancing the stability, resilience and the performance of the port operations information management system, in particular the processing of manifest.
There were several other achievements with enhancements and underlying technology platform upgrades to systems that are needed by internal and external users to undertake their core business operations and tasks. These included areas such as MSIC Security, Corporate Budgeting, Maintenance Management, Job Planning and progressing with the implementation of the Business Intelligence systems strategy.
Strategic Asset Management Fremantle Ports continues to develop and implement a best-practice strategic and asset management framework. When fully developed and integrated with Fremantle Ports’ business practices, this will provide a simple, logical and innovative approach for optimising the whole of life cost of asset delivery in meeting the agreed level of service whilst minimising risk exposure.
The strategic asset management project continues to be a corporate priority project. Initiatives implemented over the past 12 months, include:
• review of the condition and risk data for all of Fremantle Ports’ assets determined through a new series of asset investigation workshops;
• preparation of the second edition of the State of the Assets report, incorporating revised data from the asset investigation workshops to provide a high-level snapshot of asset performance with respect to asset condition, risk and expenditure;
Windows 7 software was introduced this year. Team members for the roll-out, Bill Perger, Emily Williamson and Kylie Black with a bank of new computers.

51
FREMANTLE PORTS ANNUAL REPORT 2013
Performance Support Services
• completion of the first asset class management plan. Covering wharves and jetties and provides guidance on an agreed life cycle management plan for the entire asset class (includes long-term capital and maintenance forecasts, providing the basis for annual corporate budgeting processes, key performance indicators and recommended intervention points);
• development of asset class management plans for Fremantle Ports’ railways, navigational aids and cargo handling equipment, with progress well underway and completion expected by December 2013;
• review of the strategic asset management framework against the proposed ISO 5500 International Standard for Asset Management is underway to ensure Fremantle Ports’ strategic asset management plan is developed in accordance with world best-practice guidelines; and
• collaboration with other Australian ports to develop a wharf structures condition assessment manual to achieve a more strategic approach to collecting and analysing condition assessment data for port assets through standardisation; this will enable the exchange of condition data between ports, creating an increased knowledge base, linking condition assessments with rehabilitation options to minimise cost of ownership and decrease cost of ownership of port assets by optimising intervention strategies.
The main focus of strategic asset management for the 2013 -14 year will be the completion of asset class management plans for Fremantle Ports’ railways, navigational aids, cargo-handling equipment and electrical services.
Lisa Cortez and Raj Saddi were part of the team which worked on enhancements to Fremantle Ports’ Labour Resource Module, a timesheet management and costing system for operations and maintenance employees.

52
FREMANTLE PORTS ANNUAL REPORT 2013
Performance Business Sustainability
OBJECTIVE:
Ensuring business sustainability through our excellent performance in all areas, innovation, business improvement and community and stakeholder engagement
Key outcomes sought:
• Favourable financial outcomes;• Maintaining stakeholder support;• Contributing to the community and maintaining community support;• Organisational Safety;
Safety, Environmental and Quality (SEQ) Certification AuditsFremantle Ports’ safety, environmental and quality management systems have been undergoing development since 1994. Certification of the environmental management system to the International Standard ISO 14001 was first achieved in 2001 and this was subsequently extended to include safety (AS/NZS4801 and quality (ISO9001).
The tri-ennial external audit by SAI Global of these three systems in April-May 2013 found zero non-conformances. Re-certification was achieved.
The auditors found there had been significant improvements since the last audits, with good evidence that issues identified had been followed up and closed-out.
Among numerous good practices commented on were:
• an “impressive” process for managing customer relationships• plans for strategic asset management at a very high level• mature and well deployed management review processes• evidence of a strong and enthusiastic team culture• rigorous and effective permit to work system in the Outer Harbour• real-time continuous dust monitoring processes at Kwinana facilities.
The assessors’ report will be used in improvement planning for the coming 12 months.
The dedicated permit control room at Kwinana Bulk Terminal has led to a clear reduction in risk levels on site.
Environmental Advisor Matt Oswald preparing to dive for mussel samples and cores in the Inner Harbour.

53
FREMANTLE PORTS ANNUAL REPORT 2013
Performance Business Sustainability
Policy and procedure reviewsA review of Fremantle Ports’ Safety, Environment and Quality Policy was undertaken to ensure that it remains appropriate to current business needs, operations and targets. The policy was circulated to a wide group of internal and external stakeholders inviting feedback and this was consolidated, reviewed and incorporated as appropriate.
The Procedure Control System was reviewed, with some consolidation of policies, reclassification and archiving occurring as a result. The high-level Corporate Process Map, which helps managers to meet their responsibilities and to document, understand and communicate the key processes and priorities to their staff, was also reviewed and updated.
Marine Safety planFremantle Ports’ Marine Safety Plan, which is required under the Port Authorities Act 1999, was updated during the year for approval by the Board and submission to the Minister for Transport.
The plan applies to all marine operations and activities within the Port of Fremantle limits, including commercial shipping operations and marine operations undertaken by any support or service organisation, such as towage and pilot transport. The interaction between commercial shipping and recreational craft is also included.
The plan covers:
• marine safety objectives• quality and environmental systems• controls in place to manage marine risks and incidents• responsibilities for marine safety.
Business ContinuityFurther work has been done over the past 12 months on Fremantle Ports’ Business Continuity System. This is about well-planned response and recovery strategies to reduce the impact of an emergency or other significant event on critical business activities. A particular focus has been on identifying resources.
Business continuity management in ports was one of the topics looked at in the Western Australian Auditor General’s Public Sector Performance Report 2012. This assessment concluded that Fremantle Ports’ business continuity management was the most advanced of the four ports studied and had reached a high level of maturity.
Safe transfer of marine pilots from Fremantle Ports’ pilot boats is a skilful operation that requires experience and precise timing.

54
FREMANTLE PORTS ANNUAL REPORT 2013
Performance Business Sustainability
The audit found that there was clear Board and Executive commitment to the process and that Fremantle Ports had identified critical business activities and maximum allowable outage times. Response plans had been developed and tested for the most critical areas, key responsibilities had been identified and responsible staff had been trained. Business continuity was linked to the broader risk management processes of the port and resource requirements had been identified.
Environmental Management
Saving energy
A Greenhouse Gas and Energy Management Plan developed by a cross divisional team led by the Manager Electrical Services is being implemented with the help of the Energy Management Team. The plan outlines Fremantle Ports’ objectives and strategies for energy management and emissions reduction in line with Fremantle Ports’ Climate Protection and Energy Management Policy. It incorporates a Greenhouse Gas and Energy Management Framework which is intended to be a living or dynamic document that will be further developed as it is implemented.
The Greenhouse Gas and Energy Management Plan builds on previous work on energy management and will help enable Fremantle Ports to achieve its vision of becoming a carbon neutral organisation.
A survey of staff has been undertaken to test the level of awareness of energy conservation opportunities and to capture suggestions.
Reducing Waste
Fremantle Ports also has a new Waste Management Plan to ensure that the more than 30 separate waste sources are both measured and minimised.
The scope of waste covered includes all waste generated at Fremantle Ports’ three sites: Inner Harbour, Kwinana Bulk Terminal and Kwinana Bulk Jetty. It also includes all quarantine waste collected by Fremantle Ports and disposed of under agreement with AQIS (Australian Quarantine Inspection Service).
A Waste Management Team will work to promote and help achieve the plan’s objectives. Its key functions include monitoring and reporting on waste disposal, identifying best-practice waste management, implementing programs to minimise waste and securing the support of management and staff.
Addressing Clinker Dust
Upgrading the shed used to store clinker imports at the Kwinana Bulk Terminal has improved the management of dust emissions at this site. Clinker is a dusty product and management of the dust when the product is being loaded had been an issue of concern.
Extensions to the load-out bays ensures the trucks are enclosed during clinker loading and plans are in place to extend dust extraction equipment into the loading bays.
Installation of energy efficient LED lighting at E Shed.

55
FREMANTLE PORTS ANNUAL REPORT 2013
Performance Business Sustainability
Lighting efficiencies
A solar-powered lighting tower has been installed on the Kwinana Bulk Terminal iron ore and coal stock pad. As well as the savings on diesel fuel, solar-powered lights have a reduced requirement for servicing and eliminate noise and exhaust emissions. They are lighter than conventional diesel generator towers and can easily be manoeuvred and positioned.
LED lighting is being progressively introduced through the port, with environmental benefits as well as being cheaper to run. On Victoria Quay, LED lighting has now been installed at B Shed Café, in the car park, Slip Street, Fleet Street, Peter Hughes Drive, in the Administration Building, around the workshop sheds, in E Shed Markets and on the Signal Tower mast. The lights are very bright, use less power and require less maintenance.
Seven of the nine electronic variable messaging signs for trucks in the Rous Head area are now solar-powered. The signs, on key approach roads, provide container redirection messaging as well as diverting trucks in congestion situations to a truck marshalling area.
Valuing our CommunityFremantle Ports engages with the community through community liaison groups and via involvement with a wide range of organisations. Information and views are shared to help with mutual understanding of priorities and this information is taken into account in strategic planning. The Fremantle Ports Inner Harbour Community Liaison Group met four times during the reporting period.
Specific consultation with the community was undertaken late in 2012 for planning for three precincts areas: the Commercial Precinct on Fremantle Ports’ Victoria Quay, the Public Transport Authority land around the Fremantle Train Station and the City of Fremantle’s nearby Pioneer Park. The extensive consultation, principally hosted by Fremantle Ports, took place to provide wide-ranging input into the development of precinct plans. Further information on this project is available on page 31.
Community contributionFremantle Ports provides monetary and in-kind sponsorship for a wide range of community organisations in the Inner and Outer Harbour areas. The support reflects Fremantle Ports’ priorities and values as well as community priorities identified through surveys and other consultation.
Employees volunteered for a number of events, including handing out free Australian flags at the Fremantle Anzac Day parade, working at the annual port expo and tin rattling at the Fremantle Dockers Starlight Purple Haze Game.
The Fremantle Chamber Orchestra received support from Fremantle Ports for a concert series.
Solar powered lighting tower installed at Kwinana Bulk Terminal.
Eliza and Elizabeth Oxenburgh with their artworks at East Fremantle Primary School’s art exhibition in B Shed, Victoria Quay.
56
FREMANTLE PORTS ANNUAL REPORT 2013
Performance Business Sustainability
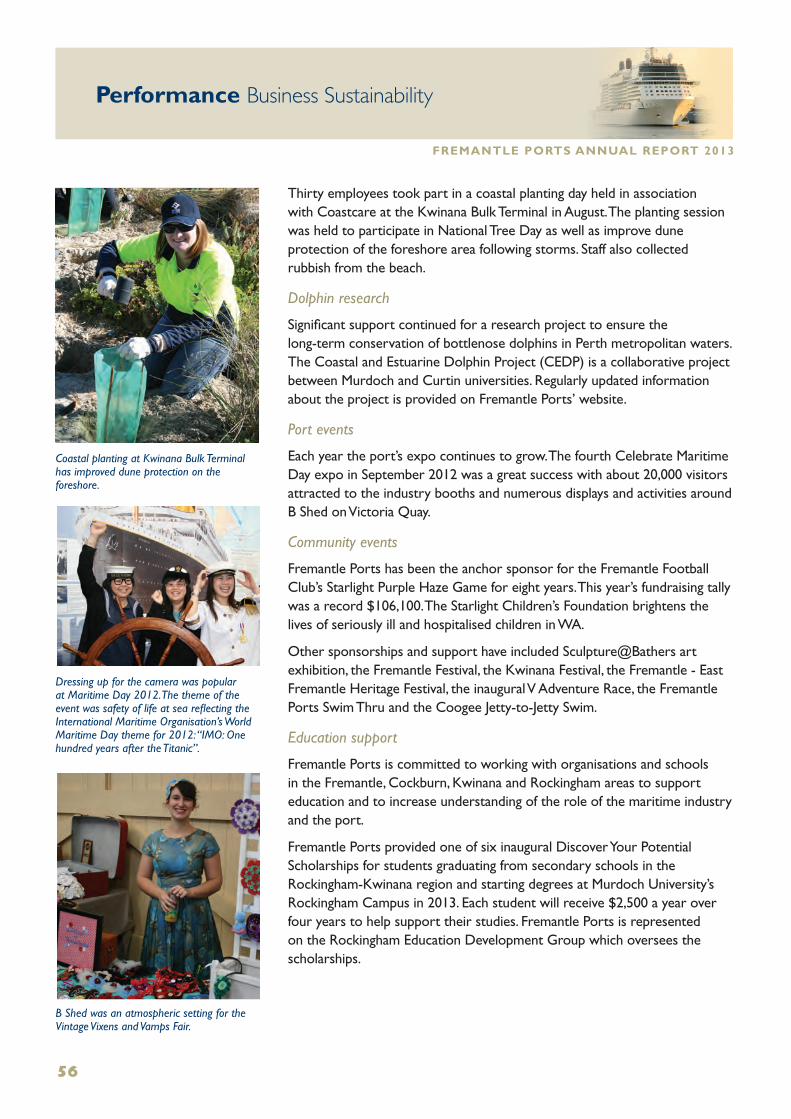
Thirty employees took part in a coastal planting day held in association with Coastcare at the Kwinana Bulk Terminal in August. The planting session was held to participate in National Tree Day as well as improve dune protection of the foreshore area following storms. Staff also collected rubbish from the beach.
Dolphin research
Significant support continued for a research project to ensure the long-term conservation of bottlenose dolphins in Perth metropolitan waters. The Coastal and Estuarine Dolphin Project (CEDP) is a collaborative project between Murdoch and Curtin universities. Regularly updated information about the project is provided on Fremantle Ports’ website.
Port events
Each year the port’s expo continues to grow. The fourth Celebrate Maritime Day expo in September 2012 was a great success with about 20,000 visitors attracted to the industry booths and numerous displays and activities around B Shed on Victoria Quay.
Community events
Fremantle Ports has been the anchor sponsor for the Fremantle Football Club’s Starlight Purple Haze Game for eight years. This year’s fundraising tally was a record $106,100. The Starlight Children’s Foundation brightens the lives of seriously ill and hospitalised children in WA.
Other sponsorships and support have included Sculpture@Bathers art exhibition, the Fremantle Festival, the Kwinana Festival, the Fremantle - East Fremantle Heritage Festival, the inaugural V Adventure Race, the Fremantle Ports Swim Thru and the Coogee Jetty-to-Jetty Swim.
Education support
Fremantle Ports is committed to working with organisations and schools in the Fremantle, Cockburn, Kwinana and Rockingham areas to support education and to increase understanding of the role of the maritime industry and the port.
Fremantle Ports provided one of six inaugural Discover Your Potential Scholarships for students graduating from secondary schools in the Rockingham-Kwinana region and starting degrees at Murdoch University’s Rockingham Campus in 2013. Each student will receive $2,500 a year over four years to help support their studies. Fremantle Ports is represented on the Rockingham Education Development Group which oversees the scholarships.
Coastal planting at Kwinana Bulk Terminal has improved dune protection on the foreshore.
Dressing up for the camera was popular at Maritime Day 2012. The theme of the event was safety of life at sea reflecting the International Maritime Organisation’s World Maritime Day theme for 2012: “IMO: One hundred years after the Titanic”.
B Shed was an atmospheric setting for the Vintage Vixens and Vamps Fair.

57
FREMANTLE PORTS ANNUAL REPORT 2013
Performance Business Sustainability
Fremantle Ports funded a special Junior Master Mariner Course at South Fremantle Senior High School during second semester 2012. The course comprised six one-hour sessions on the marine ecosystem, navigation, working in maritime industries, Fremantle Marine Sea Rescue, marine sustainability and dive skills plus a presentation ceremony for participants and parents.
For the second time, Fremantle Ports coordinated the Kwinana Industries Youth Art Awards, an event that supports visual arts in secondary schools in the Kwinana, Cockburn and Rockingham areas. The artwork of 140 finalists from 11 schools was selected from about 1500 entries. About 340 people attended the awards presentation evening in March 2013.
A group of 23 Year 10 female students from 10 schools visited Fremantle Ports in April 2013 as part of the iWomen Project, a Kwinana Industries Council partnership program to provide the girls with an understanding of the breadth of industry in the Kwinana Industrial Area and the broad range of career options available. The students enjoyed a harbour tour and discussions with female employees about their careers.
Scholarships have been provided for students entering Gilmore College and maritime and marine studies programs at Rockingham and South Fremantle senior high schools. As well, there was support for the North Fremantle Community Arts Development Spring Concert and a Musica Viva program for primary school students.
Sponsorship continued for Surf Life Saving WA’s Life Skills for Life (first aid) education program being delivered to Year 7 classes a year in schools in the Fremantle and Rockingham - Kwinana areas and the Paraplegic Benefit Fund’s PBFPREVENTION-aqua program in schools.
Community Sponsorship 2012 -2013
8% Arts
31% Appeals
8% Education
3% Sport
1% Heritage/History
7% Health
12% Events/Festivals
10% Environment
20% Business
Community Sponsorship 2012/2013
Sophie Wall with her winning art work, Disconnected, at the Kwinana Industries Youth Art Awards.
Fremantle Ports supported the purchase of an inflatable rescue boat for the Fremantle Surf Lifesaving Club this year.

58
FREMANTLE PORTS ANNUAL REPORT 2013
Performance Business Sustainability
Complaints Management Fremantle Ports received 73 complaints in 2012-13 compared with 83 the previous year. Of these, 35 were environmental complaints (principally noise, odour and dust), 15 related to traffic issues and 10 related to safety.
Modifications to Gate 3, Victoria Quay
In response to community concerns about the use of East Street by trucks entering and exiting Victoria Quay’s eastern end via Gate 3, a number of traffic control changes have been made in recent years and further modifications were undertaken in 2012 -13.
Main Roads WA, in discussion with Fremantle Ports, has installed bollards and extended the curbing at the entrance to the cargo gate. The changes made were designed to force the large trucks to turn right when leaving Victoria Quay rather than turning east from Gate 3 into Beach Street and then up East Street.
As an additional measure, plans were put in place for a height restriction bar to be installed by Main Roads WA so that even the smaller trucks have to turn right into Beach Street when leaving Gate 3 and then use the link road to Canning Highway.
Envir
onmen
t - D
ust
Envir
onmen
t - N
oise
Othe
r
Envir
onmen
t - O
ther
Passe
nger
Term
inal
Envir
onmen
t - W
ater P
olluti
on
Secu
rity
Acces
s
Vehic
le tra
ffic
Inter
nal Is
sue
Envir
onmen
t - O
dour
Safet
y
Custo
mer Is
sues
0.0
2.5
5.0
7.5
10.0
12.5
15.0
17.5
20.0
2011-12 2012-13
Num
ber
of C
om
plai
nts
Type of Complaint
Complaints 2011-12 compared to 2012-2013
Fremantle Ports - Complaints Register
2012-13 compared to 2011-12
The height restriction bar installed at Gate 3, Victoria Quay is proving effective in reducing truck traffic at the lower end of East Street.

59
FREMANTLE PORTS ANNUAL REPORT 2013
Performance Business Sustainability
Community satisfaction with rail noise response
A warm letter of thanks was received, written on behalf of Fremantle inner city residents who live near the Roundhouse and very close to the rail freight line. This was to acknowledge the efforts of Fremantle Ports, the Public Transport Authority and rail operators to successfully resolve the issue of rail noise. A water spray system which automatically turns on as trains approach the section of track on the Roundhouse curve has dramatically reduced wheel squeal.
Container train negotiates the relatively tight curve of the freight line as it passes the Roundhouse at Fremantle.
Strongly Oppose Oppose SupportNeither Strongly Support
Inner Harbour (n=197)
Outer Harbour (n=198)
0 20 40 60 80 100
13 28 55
3 9 19 69
2
Community Support for Increased Use of Rail
2013