corp financial analysis
TRANSCRIPT

i
Financial Analysis Financial Analysis
OfOf
SSquare quare TTextilesextiles
LLtd.td.

Prepared for:
Dr. Masud Rahman
Professor
Prepared by:
Shehreen Kamal, RQ 03Sumaya Mahmud, RQ18
Nusrat Sharmin Moutusi, RQ 38
BBA 17th Batch
Institute of Business Administration
University of Dhaka
Financial Analysis
Square Textiles Ltd.
Course: Corporate Finance

Letter of Transmittal
Dr. Masud RahmanProfessor BBA Program Institute of Business AdministrationUniversity of Dhaka
RE: Submission of term paper on “Financial Analysis of Square Textiles Ltd.”
Dear Sir
We do hereby feel privileged to submit our term paper on “Financial Analysis of Square Textiles Ltd.”, with an intention to have a better understanding of the course “Corporate Finance”.
We greatly value the opportunity you gave us.
With Regards,
Shehreen Kamal, RQ 03Sumaya Mahmud, RQ18Nusrat Sharmin Moutusi, RQ 38

Acknowledgement
We would like to convey sincere thanks to our teacher and mentor, Dr. Masud Rahman, for
assigning us with an independent term paper that allowed us to explore ‘Corporate Finance’
according to our own interests. This led us to research an important issue such as ‘Financial
Analysis of Square Textiles Ltd’.

Executive Summary
The objective of this case study is to find out the policy decisions made by Square Textiles Ltd. that influenced share price movement. We were also interested to analyze its investment decisions and the impact on share price. We also tried to forecast the share price by identifying growth opportunity of the firm.
Corporate Finance course is planned to comprehend the students with tools and concepts to have a sight of the financial functions and process highlighting the financial analysis.
The particular group conducted the study “Financial Analysis of Square Textiles Ltd” to evaluate and present the current issues regarding the topic. The members of the working group collected data on selected variable.
We got proper guidance and support from our instructor & mentor Dr. Masud Rahman during the course to prepare this term paper. Without your help, this term paper would have been impossible to complete. To prepare the term paper we collected what we believe to be most relevant information to make the term paper as analytical and reliable as possible. We have concentrated our best effort to achieve the objectives of the report and hope that our endeavor will serve the purpose. Throughout the duration of this course, the group members were conducting the study under topic and finally prepared the report.
The practical knowledge and experience gathered during report preparation will immeasurably help in our future professional life. I request you to excuse us for any mistake that may occur in the report despite of our best effort. I would really appreciate if you enlighten the whole group with your thoughts and views regarding the term paper.
The report helped us to understand some of the concepts and understandings that were critical for the successful completion of our course. We hope that the results of the study will be useful to the government, data analyst and other users of data.

Table of ContentsLetter of Transmittal...................................................................................................................................iii
Acknowledgement.........................................................................................................................................iv
Executive Summary........................................................................................................................................v
1.0 Introduction..............................................................................................................................................9
1.1 Square Textiles Ltd. at a glance........................................................................................................................ 9
1.2 Objective of the study............................................................................................................................................ 9
1.3 Limitations of the study........................................................................................................................................ 9
2.0 Methodology...........................................................................................................................................10
2.1 Financial Analysis techniques......................................................................................................................... 10
2.1.1 Bench mark Analysis.................................................................................................................................... 10
2.1.2 Time Series (Trend) Analysis..................................................................................................................... 10
2.1.3 Cross – Section Analysis.............................................................................................................................. 10
2.2 Statistical Techniques......................................................................................................................................... 10
2.3 Nature and Source of Data............................................................................................................................... 11
2.4 Time – Period under Consideration.............................................................................................................. 11
2.5 Standard of comparison.................................................................................................................................... 11
3.0 Analysis & Interpretation of Financial Data...............................................................................11
3.1 Balance Sheet Analysis....................................................................................................................................... 11
3.1.1 Sources of “Discrepancies” in the Balance Sheet............................................................................13
3.2 Cash Flow Analysis............................................................................................................................................... 15
3.2.1 Analysis of the Cash Flow:........................................................................................................................ 16
3.3 Ratio Analysis......................................................................................................................................................... 16
3.3.1 Liquidity Ratio............................................................................................................................................... 17
3.3.2 Asset Management Ratio.......................................................................................................................... 19
3.3.3 Debt Management Ratio........................................................................................................................... 23
3.3.4 Profitability Ratio........................................................................................................................................ 25
3.4 Market Value Ratio.............................................................................................................................................. 28
3.4.1 Market Value / Book Value Ratio.......................................................................................................... 29
4.0 Stock Price Movement.........................................................................................................................31
4.1 Account Closing..................................................................................................................................................... 31
4.2 Dividend Declaration.......................................................................................................................................... 31
4.3 Record Date............................................................................................................................................................. 32
4.4 Annual General Meeting.................................................................................................................................... 32
4.5 M&A Activities........................................................................................................................................................ 32
5.0 Prospective Analysis............................................................................................................................33
5.1 Different Growth Rates...................................................................................................................................... 33

5.1.1 Scenario 1: Growth at Sustainable Growth Rate............................................................................33
5.1.2 Scenario 2: Growth as per Gordon Model..........................................................................................34
5.1.3 Scenario 3: Growth at GDP growth rate.............................................................................................34
5.1.4 Scenario 4: Optimistic................................................................................................................................ 35
5.1.5 Scenario 5: Pessimistic............................................................................................................................... 35
5.2 Choice of Growth Rate........................................................................................................................................ 35
5.3 The Plug Variable................................................................................................................................................. 36
5.4 Weighted Average Cost of Capital................................................................................................................. 36
5.6 Share Price according to Gordon Model.....................................................................................................36
6.0 Findings and Conclusions..................................................................................................................37
6.1 Financial Performance....................................................................................................................................... 37
6.2 Stock Price Movement........................................................................................................................................ 37
6.3 Growth Prospect and Future Share Price.................................................................................................. 37
7.0 Appendix..................................................................................................................................................38
7.1 Regression results................................................................................................................................................. 38
7.1.1 Account closing............................................................................................................................................. 38
7.1.2 Dividend Declaration.................................................................................................................................. 39
7.1.3 Record Date.................................................................................................................................................... 41
7.1.4 AGM.................................................................................................................................................................... 42
7.1.5 M&A Activities................................................................................................................................................ 44
7.2 Weighted Average Cost of Capital................................................................................................................. 45
7.2.1 Calculationβ .................................................................................................................................................. 45
7.2.2 Average Market Return............................................................................................................................. 45
7.3 Financial Statements & Performance Data...............................................................................................46
7.4 References.................................................................................................................................................................... 47
Content of Tables & Figures
Figure 1 Comparison between Market Value & Book Value of Square Textiles Shares.....................13Figure 2 Acid Test Ratio Trend................................................................................................................................... 18Figure 3 Inventory Turnover Trend......................................................................................................................... 20Figure 4 Days Sales Outstanding Trend.................................................................................................................. 21Figure 5 Fixed Asset Turnover Trend....................................................................................................................... 22Figure 6 Total Asset Turnover Trend....................................................................................................................... 23Figure 7 Debt Ratio trend............................................................................................................................................. 24Figure 8 Times Interest Earned Trend.................................................................................................................... 25Figure 9 Profit Margin on Sales Trend.................................................................................................................... 26Figure 10 Return on Assets Trend............................................................................................................................ 27Figure 11 Return on Equity trend............................................................................................................................. 28Figure 12 Price / Earning Ratio Trend................................................................................................................... 29Figure 13 Market Value Book Value Trend........................................................................................................... 30
Table 1 Balance sheet of Square Textiles Ltd. based on book value of share (Figures in Taka)....12

Table 2 Balance sheet of Square Textiles Ltd. based on Market value of share....................................15Table 3 Cash Flow Statement for Square Textiles Ltd. for the year 2009................................................16Table 4 Current Ratio for Square Textiles Ltd. & Apex Spinning & Knitting Mills Ltd.......................17Table 5 Current Ratio Trend........................................................................................................................................ 17Table 6 Acid Test (Quick) Ratio for Square Textiles Ltd. & Apex Spinning & Knitting Mills Ltd....18Table 7 Inventory Turnover for Square Textiles Ltd. & Apex Spinning & Knitting Mills Ltd...........19Table 8 Days Sales Outstanding for Square Textiles Ltd. & Apex Spinning & Knitting Mills Ltd.. .20Table 9 Fixed Asset Turnover of Square Textiles Ltd. & Apex Spinning & Knitting Mills Ltd..........21Table 10 Total Asset Turnover of Square Textiles Ltd. & Apex Spinning & Knitting Mills Ltd........22Table 11 Debt Ratio for Square Textiles Ltd. & Apex Spinning & Knitting Mills Ltd...........................24Table 12 Times Interest Earned for Square Textiles Ltd. & Apex Spinning & Knitting Mills Ltd.. .24Table 13 Profit Margin on Sales for Square Textiles Ltd. & Apex Spinning & Knitting Mills Ltd.. .26Table 14 Return on Assets for Square Textiles Ltd. & Apex Spinning & Knitting Mills Ltd...............26Table 15 Return on Equity for Square Textiles Ltd. & Apex Spinning & Knitting Mills Ltd..............27Table 16 Return on Equity for Square Textiles Ltd. & Apex Spinning & Knitting Mills Ltd..............28Table 17 Market / Book Value for Square Textiles Ltd. & Apex Spinning & Knitting Mills Ltd......29

1.0 Introduction
This case study is prepared with an intention to meet partial requirement of the course ‘Corporate Finance’ and to have a better insight of the subject matter. We have chosen Square textiles Ltd., one of the leading yarn manufacturers of the country for this purpose. We performed an analysis of the company and tried to evaluate its justification with the acquired knowledge from this course.
1.1 Square Textiles Ltd. at a glanceSquare Textiles Ltd. was established as a public company in 1994. As a group company Square Group with a business line of manufacturing and marketing of yarn. The company started its operation on 1997 and was listed at both Dhaka Stock Exchange and Chittagong Stock Exchange in 2004. At the end of 2009 paid-up capital of the company was Tk. 705.84 million with 70,584,053 shares outstanding. The company is very profitable and doing very good in terms of share price also. Dividend payout in both cash and bonus share form has also been very consistent through the last few years.
Square Textiles got Oeko-Tex Standard 100 and ISO-9002 certification in 2000.
At end of 2009, the production capacity of the company stands at 11,582,899 Kg Ring Yarn and 12,329,688 Kg of O/E yarn.
1.2 Objective of the study
The objective of this Case Study is to: Identify policy decisions that has an impact on share price movement Relate consequences of financial activities with the valuation of the firm
1.3 Limitations of the study
Like all other term papers, this too has got its limitations. Following are the areas where we had our limitations
Unable to conduct direct interview with Square Textiles employees to get a better insight of our findings.
Unavailability of information in a “Soft Copy” which consumed lot of time. No information was available on the overall market share in the yarn industry in
Bangladesh. Moreover, the industry averages were not also available which would have been a better option to compare with.
Financial year of Square Textiles and ASKML ends in different months which can create inaccuracies in cross-section analysis
Due to time constraint, cross section analysis was done only for last year. It would be better if it was compared for last 7 years.
Due to unavailability of project data, we could not perform an analysis of investment decisions made by Square Textiles
Page 9 of 48

2.0 Methodology
There are a number of methods and techniques which were used towards reaching a conclusion.-
2.1 Financial Analysis techniques
A balance sheet analysis was performed to identify the sources of discrepancies in balance sheet that
causes book value and market value of share to be different.
A cash flow analysis was performed to study the cash dealings of the firm and to identify its financial
position.
We also performed a ratio analysis to evaluate the firm’s financial strengths or weaknesses. The most
prominent Financial Analysis techniques include the following 3 methods: -
2.1.1 Bench mark Analysis
This method is literally unusable in Bangladesh as no industry data is widely available regardless of any
sector. This led to high dependency on the remaining two methods.
2.1.2 Time Series (Trend) Analysis
The time series analysis is predominantly known as “Trend Analysis”, where we try to find a trend of a
specific performance of the company. Different ratios are computed over time and comment is made
whether any increasing / decreasing trend is found.
2.1.3 Cross – Section Analysis
In this type of analysis, Company’s financial ratios are compared with other industry ratio averages. This
can also be performed by issuing comparison between two companies of similar business.
For the sake of the case study, we will perform Time Series analysis on the seven year data that we have
and a Cross Section analysis between our company of interest Square Textiles Ltd. and Apex Spinning &
Knitting Mills Ltd (ASKML).
2.2 Statistical Techniques
To relate share price movement with different events or policy decisions e.g. account closing, record date,
dividend declaration, AGM etc. we relied on simple regression by populating dummy variable against the
event.
Page 10 of 48
2.3 Nature and Source of Data
The data used in this study is secondary data collected from annual reports and Dhaka Stock Exchange web
site and data archive
2.4 Time – Period under Consideration
We collected seven (08) years of data of Square Textiles Ltd., and considered data from 2003 to 2010. For
enquiry into share price movement we’ve used only the data from 2008 – 2010 since news about different
events were only available for this period. For trend analysis, we used data of 2003 – 2009 since annual
report of 2010 is yet to be published. We accept that only seven year data is not good enough to comment
on the financial performance of the company, but it can at least give us a glimpse of the recent trend that
the company is going through.
2.5 Standard of comparison
As the industry benchmark was not available to us, we decided to compare the ratios of our company with
that of another one. We chose Apex Spinning & Knitting Mills Ltd. for the comparison as this company’s
performance was the best among the companies whose data were available.
3.0 Analysis & Interpretation of Financial Data
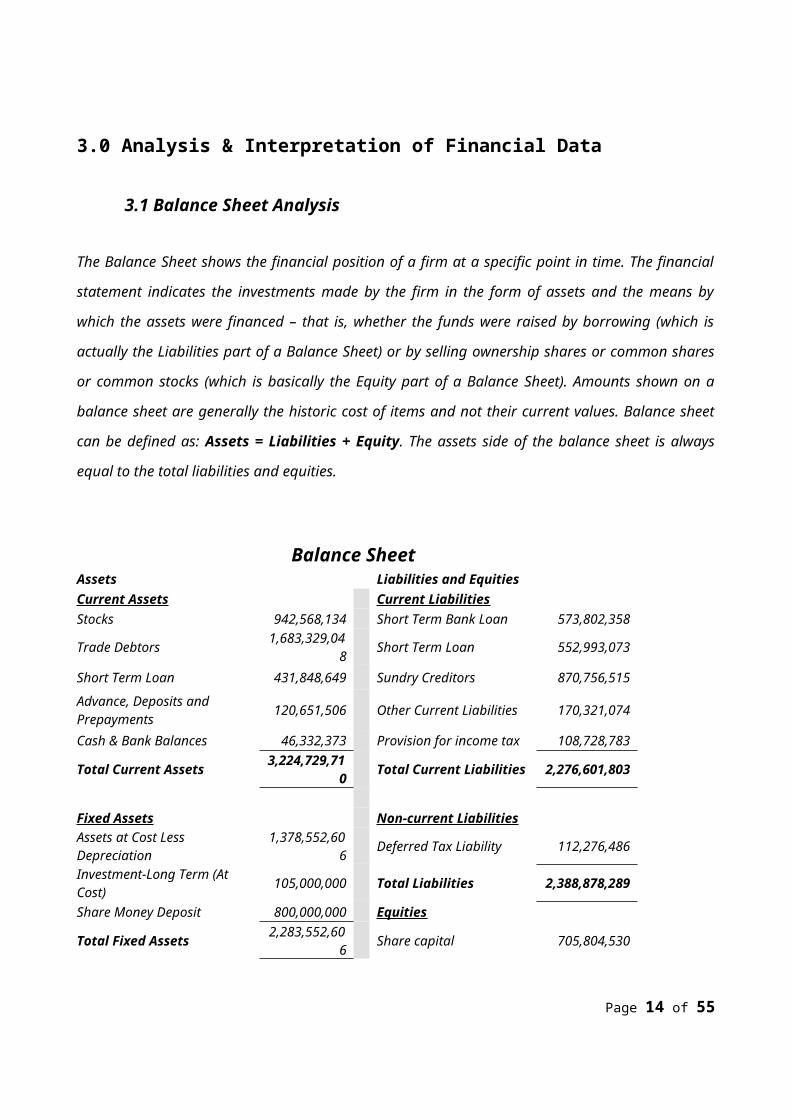
3.1 Balance Sheet Analysis
The Balance Sheet shows the financial position of a firm at a specific point in time. The financial statement
indicates the investments made by the firm in the form of assets and the means by which the assets were
financed – that is, whether the funds were raised by borrowing (which is actually the Liabilities part of a
Balance Sheet) or by selling ownership shares or common shares or common stocks (which is basically the
Equity part of a Balance Sheet). Amounts shown on a balance sheet are generally the historic cost of items
and not their current values. Balance sheet can be defined as: Assets = Liabilities + Equity. The assets side
of the balance sheet is always equal to the total liabilities and equities.
Page 11 of 48
Balance SheetAssets Liabilities and EquitiesCurrent Assets Current LiabilitiesStocks 942,568,134 Short Term Bank Loan 573,802,358
Trade Debtors 1,683,329,048 Short Term Loan 552,993,073
Short Term Loan 431,848,649 Sundry Creditors 870,756,515
Advance, Deposits and Prepayments
120,651,506 Other Current Liabilities 170,321,074
Cash & Bank Balances 46,332,373 Provision for income tax 108,728,783Total Current Assets 3,224,729,710 Total Current Liabilities 2,276,601,803
Fixed Assets Non-current LiabilitiesAssets at Cost Less Depreciation 1,378,552,606 Deferred Tax Liability 112,276,486Investment-Long Term (At Cost) 105,000,000 Total Liabilities 2,388,878,289Share Money Deposit 800,000,000 EquitiesTotal Fixed Assets 2,283,552,606 Share capital 705,804,530
General Reserve and Surplus 2,413,563,497
Tax Holiday -Total Equities 3,119,404,027
Total Assets 5,508,282,316 Total Liabilities & Equities 5,508,282,316Table 1 Balance sheet of Square Textiles Ltd. based on book value of share (Figures in Taka)
The above table shows the Balance Sheet of Square Textiles Ltd. as presented in their annual report.
According to this balance sheet the book value of Square Textiles shares for the day December 31, 2009
should be 44.19 Taka. But in reality we can see that the actual market price on that day was much higher
than that, 111.54 Taka.
Page 12 of 48

Figure 1 Comparison between Market Value & Book Value of Square Textiles Shares
Having a look at the trend analysis of the market value and book value of Square Textiles Ltd., it was found
that the Market value has been much higher than the book value by a huge margin. These values indicate
that there exists some sort of discrepancy between these two types of values. Our intention is to identify
these discrepancies and thus propose a Balance Sheet based on the Market Value.
3.1.1 Sources of “Discrepancies” in the Balance Sheet
In order to identify the sources of discrepancies we now concentrate on the Balance Sheet for the year
2009, of Square Textiles Ltd. After a thorough analysis of balance sheet items, the following items were
identified as factors contributing towards raising discrepancies between the book value and market value: -
Fixed Assets are “Undermined”: The financial statements have been prepared under the historical cost
convention and fixed assets are stated at cost less accumulated depreciation. But, as suggested by the Time
Value of Money concept, price changes as time passes. Moreover, the depreciation was charged using the
Straight – Line method. From this analysis above we reach to a conclusion that the values of fixed assets are
undermined. The asset composition shows that a significant 30% of fixed assets are land and building which
have been recorded at historical cost. But over the years these assets’ market price has significantly
increased which has not been reflected in the balance sheet.
No Intangible Assets section: It was found that the company did not incorporate any Intangible assets in
the balance sheet. One of the most important intangible assets is “Trademark” which was not considered in
preparing the balance sheet. Square Textiles Ltd. is in operation in Bangladesh for the last 11 years, since
Page 13 of 48
1997, and has been holding a healthy position for last several years. They have been profitable with a fair
performance in share market also. So, this is certainly an evidence of their goodwill which should be valued.
The firm recently acquired Mithapur Textiles and also merged with Square Spinning Ltd. These M&A
activities have been recorded as cost/share price. But the brand value acquired from these activities has not
been recorded.
Equity “Understated”: As we can find from the balance sheet here that equity of Square Textiles Ltd. has
been severely understated. The company calculates its equity from the period of 2004 when it was first
listed with Dhaka Stock Exchange, but with reference to the Time Value of Money concept the equity has
increased a lot over this period of time. Gain from price increase in land and building has not been
recognized.
Upon identifying the above mentioned discrepancies, we adjusted the balance sheet in terms of the market
value of stocks. In order to standardized in terms of market value the following three values were changed
in the original balance sheet.
The Value of Assets Less Depreciation was changed from taka 1,378,552,606 to Taka 4,132,057,851
Goodwill was added valued as taka 2,000,000,000.
General Reserve and Surplus has been changed from 2,413,563,497 taka to 7,167,104,742 taka.
As a result the Total Assets and Total Liabilities & Equities sides balanced at taka 10,261,787,561.
Balance SheetAssets Liabilities and EquitiesCurrent Assets Current LiabilitiesStocks 942,568,134 Short Term Bank Loan 573,802,358Trade Debtors 1,683,329,048 Short Term Loan 552,993,073Short Term Loan 431,848,649 Sundry Creditors 870,756,515Advance, Deposits and Prepayments 120,651,506 Other Current Liabilities 170,321,074Cash & Bank Balances 46,332,373 Provision for income tax 108,728,783Total Current Assets 3,224,729,710 Total Current Liabilities 2,276,601,803
Fixed Assets Non-current LiabilitiesAssets Less Depreciation 4,132,057,851 Deferred Tax Liability 112,276,486Investment-Long Term (At Cost) 105,000,000 Total Liabilities 2,388,878,289Share Money Deposit 800,000,000Intangible Assets 2,000,000,000 EquitiesTotal Fixed Assets 7,037,057,851 Share capital 705,804,530
General Reserve and Surplus 7,167,104,742
Page 14 of 48

Tax Holiday -Total Equities 7,872,909,272
Total Assets 10,261,787,561 Total Liabilities & Equities 10,261,787,561Table 2 Balance sheet of Square Textiles Ltd. based on Market value of share
3.2 Cash Flow Analysis
The statement of cash flows is designed to show how the firm’s operations have affected its cash position
by examining the investment and financing decisions of the firm. Often time, the information contained in
the statement of cash flows answer questions like: Is the firm generative the cash needed to purchase
additional fixed assets for growth? Does it have excess cash flows that can be used to repay debt or to
invest in new products? Information contained in the Cash Flow Statement is useful both for financial
managers and investors. Following is the cash flow analysis of Square Textiles Ltd.:-
2009 2008Cash flow from operating activitiesReceipts:Cash from sales revenue 3,888,585,244 2,763,272,886Cash from other income 259,007 23,676
Total cash receipts 3,888,844,251 2,763,296,562
Payments:Purchase for raw & packing materials (2,840,712,628) (1,951,063,214)Manufacturing & operating expense (517,209,344) (482,296,269)Finance Cost (112,410,317) (114,091,254)Income tax (41,934,432) (77,675,961)Workers profit participation fund (16,355,199) (13,369,264)
Total payment (3,528,621,920) (2,638,495,962)
Net Cash Flow From Operating Activities 360,222,331 124,800,600
Cash flow from investing activitiesCash flow from investing activitiesPurchase of fixed assets (97,332,491) (130,606,406)Profit from disposal of Fixed Assets 295,000 1,047,111Cash Receiver from Merger of SSL (10,000,000) 13,198,790Net Cash Flow From Investing Activities (107,037,491) (116,360,505)
Cash flow from financing activitiesShort term Bank loan (203,726,227) (27,451,291)Short term loan from/(to) sister Concern 58,058,364 129,959,939Payment of Dividend (105,876,079) (98,583,425)Net Cash Flow From Financing Activities (251,543,942) 3,925,223
Net cash position 1,640,898 12,365,318Opening cash & cash equivalents 44,691,475 32,326,157
Page 15 of 48

Closing Cash & Cash Equivalent 46,332,373 44,691,475Table 3 Cash Flow Statement for Square Textiles Ltd. for the year 2009
3.2.1 Analysis of the Cash Flow:
Net Cash Flow from Operating Activities: The net cash flow from operating activities was much higher than
previous year mainly due to increase in sales which shows a good sign for the company.
Net Cash Flow from Investment Activities: There is no significant change in net cash flow from investment
activities compared to the previous year.
Net Cash Flow from Financing Activities: The company has paid off a large amount of short term loan
which caused a large amount of cash outflow..
Net cash after 2009 position is weaker than 2008 even after a significant rise in sales. This happened mainly
due to paying off a large amount of short term loan.
3.3 Ratio Analysis
The real value of financially statements lies in the fact that they can be used to help predict a firm’s
financial position in the future and to determine expected earnings and dividends. An analysis of the firm’s
ratios generally is the first step in a financial analysis. The ratios are designed to show relationships
between financial statement accounts within firms and between firms.
Sources for these ratios are the company Financial Statements within the industry that contains figures on
assets, liabilities, profits, and losses. Industry ratios are only meaningful when compared with other
information. Since individual companies are most often compared with industry data, ratios help an
individual understand a company's performance relative to that of competitors and are often used to trace
performance over time.
There are 5 major categories when ratio analysis is considered. These categories are:
Liquidity Ratio which gives a picture of a company’s short term financial situation or solvency.
Asset Management Ratio uses turnover measures to show how efficient a company is in its operations and
use of assets.
Debt Management Ratio shows the extent that debt is used in a company's capital structure.
Page 16 of 48

Profitability Ratio uses margin analysis and show return on sales and capital employed.
Market Value Ratio shows company’s standing in the capital market.
3.3.1 Liquidity Ratio
Liquid asset is an asset that can be converted to cash without significant loss of its original value. This
basically indicates the strength of a company in terms of meeting the current obligations or liabilities, e.g.
employee salary. Sometimes low liquidity even leads to bankruptcy. Two commonly used Liquidity Ratios
are (1) Current Ratio and (2) Acid Test Ratio.
Current RatioCurrent Ratio is the ratio of current assets to current liabilities, which refers to the short term solvency of
the company and calculated as: -
Company Square Textiles Ltd. ASKMLYear 2009 2008 2007 2006 2005 2004 2003 2009Current Ratio 1.35 1.21 1.38 1.12 1.41 1.14 1.01 1.10
Table 4 Current Ratio for Square Textiles Ltd. & Apex Spinning & Knitting Mills Ltd.
We can see from the above data that the current ratio for Square Textiles is 1.35, which is below the
benchmark standard for any company. But comparing with Apex Spinning & Knitting Mills Ltd., it is higher
as Apex Spinning & Knitting Mills Ltd. has a Current Ratio of 0.89.
Table 5 Current Ratio Trend
Page 17 of 48

The trend line of current ratio for Square textiles shows that the company has maintained a somewhat
steady current ratio for the last 7 years and also there has been improvement in current ratio from last
year.
Acid Test Ratio (Quick) Ratio
Acid Test Ratio is a better measure than Current Ratio as it deducts inventories from Current assets and thus
provides a better idea about the liquidity of the firm. It is calculated as follows:
Company Square Textiles Ltd. ASKMLYear 2009 2008 2007 2006 2005 2004 2003 2009Acid Test Ratio 0.96 0.76 0.96 0.73 0.91 0.80 0.75 0.76
Table 6 Acid Test (Quick) Ratio for Square Textiles Ltd. & Apex Spinning & Knitting Mills Ltd.
Currently Square Textiles is maintaining a quick ratio of 0.96, which is lower than the Benchmark ratio of 1.
But comparing with Apex Spinning & Knitting Mills Ltd., it is much higher as Apex Spinning & Knitting Mills
Ltd. has a Quick Ratio of 0.075.
Figure 2 Acid Test Ratio Trend
As we can see from the graph above, the quick ratio trend is not steady. It may indicate that the company
has gone for multiple projects/investments in last few years. The company’s quick ratio is pretty much close
to the benchmark of 1.
Overall Comment on Liquidity
Page 18 of 48

The overall liquidity position of the company is not very good but it is getting better. Both the ratios have
increased in 2009. Considering the length of operation of Square Textiles the performance is quite good
especially in terms of quick ratio as it is pretty close to benchmark. The kind of ups and downs found in the
trend analysis is mainly due to the fact that the company has gone for multiple projects/investments in last
few years. This eventually is good news for a firm like Square Textiles who has very strong financial support
from the group. Also the company’s position is much better compared to Apex Spinning & Knitting Mills.
3.3.2 Asset Management Ratio
Whether the assets of the company are being used effectively or in other words is able to generate sales, is
suggested by the asset management ratio.
Inventory Turnover
It shows that how many times the inventory of a firm is sold and replaced in a specific period.
Company Square Textiles Ltd. ASKMLYear 2009 2008 2007 2006 2005 2004 2003 2009Inventory Turnover 3.55 2.04 3.39 4.18 3.79 5.14 5.28 9.56
Table 7 Inventory Turnover for Square Textiles Ltd. & Apex Spinning & Knitting Mills Ltd.
The inventory turnover for Square Textiles is 3.55 whereas, Apex Spinning & Knitting Mills Ltd. has inventory
turnover of 9.56. So, in this regard, Square Textiles is in a much worse position.
Page 19 of 48

Figure 3 Inventory Turnover Trend
The trend line does not look very impressive. Inventory turnover is getting lower. This might be due to
increasing price of raw materials and also due to price reduction to cope up with the competitive market.
However, there is a very sharp rise from 2008 to 2009. This can primarily be attributed to the handsome
increase in export sales.
Days Sales OutstandingDays Sales Outstanding refers to the average time a company takes to turn the receivables into cash.
Company Square Textiles Ltd. ASKMLYear 2009 2008 2007 2006 2005 2004 2003 2009DSO 158.26 202.06 117.67 114.36 115.52 123.93 145.83 54.16
Table 8 Days Sales Outstanding for Square Textiles Ltd. & Apex Spinning & Knitting Mills Ltd.
During the last year Square Textiles had a DSO of 158.26 days whereas, Apex Spinning & Knitting Mills Ltd.
has DSO of 54.16 days. So, in this regard, Square Textiles is in a much worse position.
Page 20 of 48

Figure 4 Days Sales Outstanding Trend
The trend analysis shows that during the period 2008 Square Textiles had the worst DSO of 202.06. in 2009,
it improved a bit. But DSO is still too high. This may be due to the fact that most of Square Textiles’ dales
are export sales which naturally take longer to be collected.
Fixed Asset TurnoverThis ratio refers to how much sales or revenue is generated by employing the fixed assets of the company.
Company Square Textiles Ltd. ASKMLYear 2009 2008 2007 2006 2005 2004 2003 2009Fixed Asset Turnover 1.70 1.29 1.62 1.54 2.00 2.08 1.73 4.63
Table 9 Fixed Asset Turnover of Square Textiles Ltd. & Apex Spinning & Knitting Mills Ltd.
Square Textiles had Fixed Asset Turnover Ratio of 1. 70, which means their Taka 1 of fixed asset can
generate taka 1.70 of sales whereas, Apex Spinning & Knitting Mills Ltd. has Fixed Asset turnover of 4.63.
So, in this regard, Square Textiles is in a much worse position. But a further inquiry shows that ASKML is
very low on fixed assets, which is an indication of off-balance sheet financing. On the other hand, Square
Textiles did not go for leasing option.
Page 21 of 48

Figure 5 Fixed Asset Turnover Trend
The trend analysis shows that Square Textiles’ Fixed Asset Turnover deteriorated for during 2007 and 2008.
But in 2009 it got a little better.
Total Asset TurnoverLike the fixed asset, this ratio refers to how much sales or revenue is generated by employing the fixed
assets of the company.
Company Square Textiles Ltd. ASKMLYear 2009 2008 2007 2006 2005 2004 2003 2009Total Asset Turnover 0.70 0.53 0.73 0.84 0.92 0.97 0.84 1.93
Table 10 Total Asset Turnover of Square Textiles Ltd. & Apex Spinning & Knitting Mills Ltd.
Square Textiles had Total Asset Turnover Ratio of 0.70, which means their Taka 1 of total asset can
generate taka 0.70 of sales whereas, Apex Spinning & Knitting Mills Ltd. has Total Asset turnover of 1.93.
This is once again due to the fact that ASKML has opted for off-balance sheet financing
Page 22 of 48
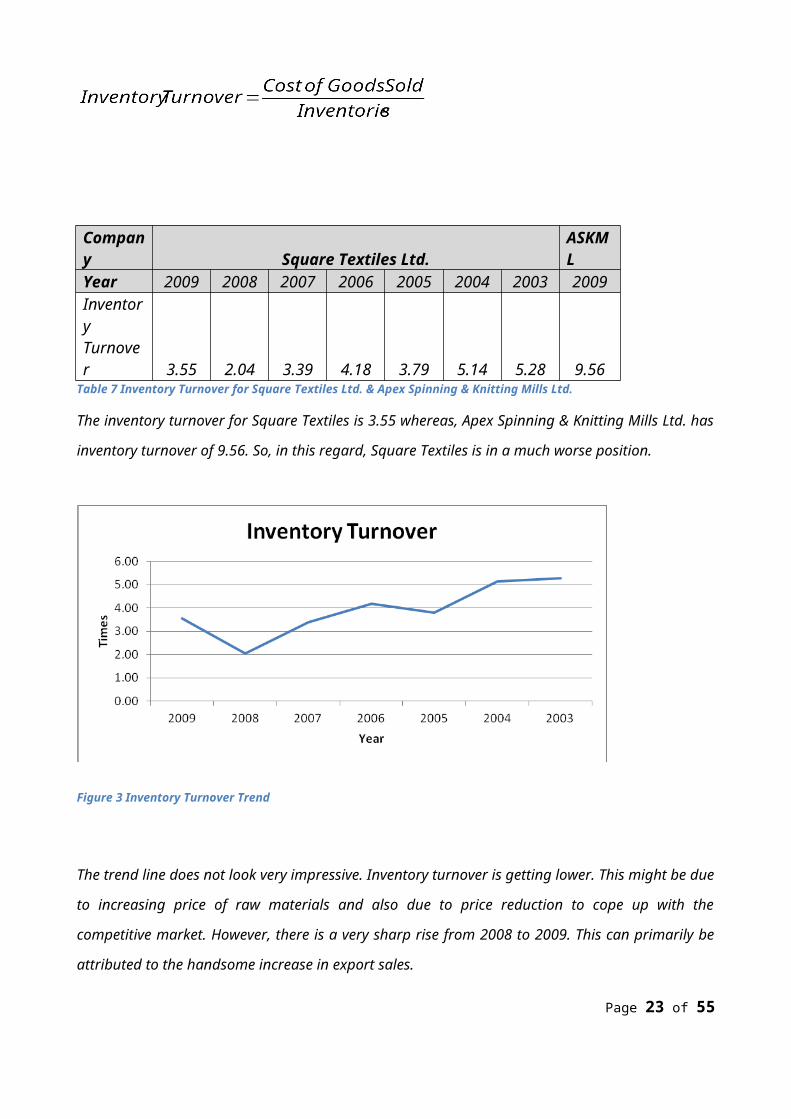
Figure 6 Total Asset Turnover Trend
The total asset turnover of Square Textiles was increasing during the period 2003-2004 but then it started
to drop and reached a lowest in 2008. It stands at 0.70 in 2009, which shows a turning point in turnover
trend.
Overall Comment on Asset ManagementSquare Textiles is in a worse position than Apex Spinning & Knitting Mills Ltd. in all the Asset Management
Ratio, except for DSO. Though high DSO is explainable, but the other ratios are not impressive at all.
It seems that the company is not managing its assets very well though there is an indication that the
company is getting better in asset management.
3.3.3 Debt Management Ratio
Debt Management Ratios judge the debt management performance of a company. If a company goes for
too much debt for financing its operations, it might end up in a very hard financial situation.
Debt RatioThe Debt Ratio measures the percent of total funds provided by creditors. Debt includes both current
liabilities and long-term debt.
Company Square Textiles Ltd. ASKMLYear 2009 2008 2007 2006 2005 2004 2003 2009Debt 43.37 48.95 39.70 40.69 38.26 46.82 50.67 53.07
Page 23 of 48

Ratio % % % % % % % %Table 11 Debt Ratio for Square Textiles Ltd. & Apex Spinning & Knitting Mills Ltd.
Square Textiles Ltd. has a much lower debt ratio than Apex Spinning & Knitting Mills Ltd. Last year the debt
ratio of Square Textiles Ltd. was 43.37% which is lower than the industry recommended average of 50%. It
looks like the company prefers capital financing to debt financing.
Figure 7 Debt Ratio trend
The trend analysis shows that Square Textiles Bangladesh had a high debt ratio at the end of the year 2003.
But after that the debt ratio has started to go down dramatically. This is actually a very good sign for the
company. The company is managing debt in very efficient way.
Times Interest Earned
Company Square Textiles Ltd. ASKMLYear 2009 2008 2007 2006 2005 2004 2003 2009TIE 3.56 3.53 4.88 6.22 6.85 4.26 2.46 2.06
Table 12 Times Interest Earned for Square Textiles Ltd. & Apex Spinning & Knitting Mills Ltd.
Last year Square Textiles Ltd. had Times Interest Earning of 3.56. It means that Square Textiles Ltd. has got
Taka 3.56 to pay interest of Taka 1 whereas Apex Spinning & Knitting Mills Ltd. had TIE of 2.06. In this
respect Square Textiles Ltd. was in a better position.
Page 24 of 48

Figure 8 Times Interest Earned Trend
Square Textiles have maintained a pretty good TIE for the last 7 years. From the trend, it is seen that TIE
declined between 2005 and 2008. But last year it improved a bit.
Overall comment on Debt ManagementDebt Ratio of Square Textiles Ltd. is much lower than Apex Spinning & Knitting Mills Ltd. It is less than the
benchmark of 50%. This indicates that Square Textiles Ltd. is not a highly levered firm.
Square Textiles Ltd. had much lower debt ratio last year. Higher profitability might be the reason for what
Square Textiles Ltd. did not take more loans.
Last year Square Textiles Ltd. had much high TIE, which can also be justified by high profit of the last year.
Square Textiles’ overall debt management performance is very impressive which is very good news for the
company.
3.3.4 Profitability Ratio
Profitability is the company's ability to generate revenues in excess of the costs incurred in producing those
revenues. Profitability Ration is the measure of performance showing how much the firm is earning
compared to its sales, assets or equity.
Profit Margin on Sales
Page 25 of 48

Company Square Textiles Ltd. ASKMLYear 2009 2008 2007 2006 2005 2004 2003 2009Profit Margin 6.71% 7.75% 13.87% 13.31% 10.69% 8.08% 7.98% 0.87%
Table 13 Profit Margin on Sales for Square Textiles Ltd. & Apex Spinning & Knitting Mills Ltd.
Last year, Square Textiles had profit margin of 6.71%. It means by utilizing Taka 100 of sales, it can have net
income of Taka 6.71. The profit margin of Square Textiles is much better compared to Apex Spinning &
Knitting Mills.
Figure 9 Profit Margin on Sales Trend
The trend analysis shows that Square Textiles profit margin had been increasing till 2007. But for the last 2
years, we see a declining trend. Though sales has increased in last few years, the profit margin has gone
down due to decline in price of finished goods and also due to increase in raw material price
Return on Asset
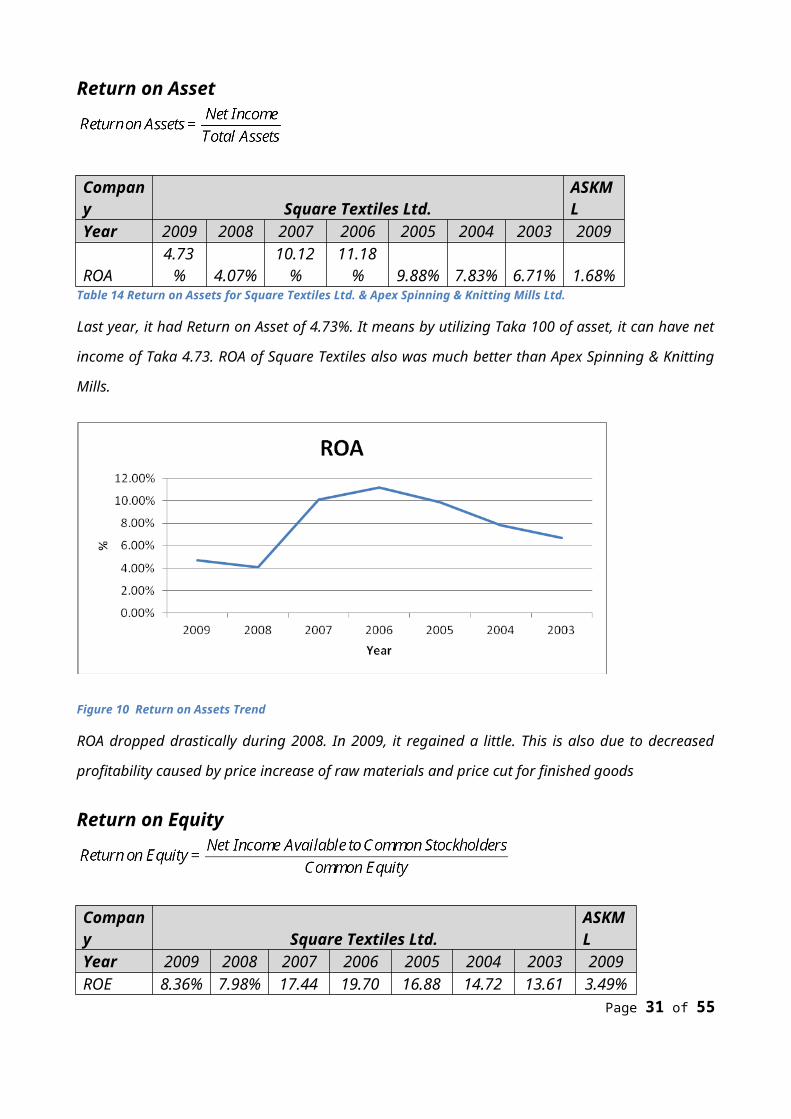
Company Square Textiles Ltd. ASKMLYear 2009 2008 2007 2006 2005 2004 2003 2009ROA 4.73% 4.07% 10.12% 11.18% 9.88% 7.83% 6.71% 1.68%
Table 14 Return on Assets for Square Textiles Ltd. & Apex Spinning & Knitting Mills Ltd.
Last year, it had Return on Asset of 4.73%. It means by utilizing Taka 100 of asset, it can have net income of
Taka 4.73. ROA of Square Textiles also was much better than Apex Spinning & Knitting Mills.
Page 26 of 48

Figure 10 Return on Assets Trend
ROA dropped drastically during 2008. In 2009, it regained a little. This is also due to decreased profitability
caused by price increase of raw materials and price cut for finished goods
Return on Equity
Company Square Textiles Ltd. ASKMLYear 2009 2008 2007 2006 2005 2004 2003 2009
ROE 8.36% 7.98%17.44
%19.70
%16.88
%14.72
%13.61
% 3.49%Table 15 Return on Equity for Square Textiles Ltd. & Apex Spinning & Knitting Mills Ltd.
Last year, it had Return on Equity of 8.36%. It means by utilizing Taka 100 of total equity available to
common shareholders, it can have net income of Taka 8.36. ROE of Square Textiles was better than Apex
Spinning & Knitting Mills’ ROE of 3.49%.
Page 27 of 48

Figure 11 Return on Equity trend
The ROE trend is quite similar to ROA.
Overall comment on profitabilitySquare Textiles has been a profitable company almost since its establishment and during the past few years
the Profit Margin ratio has improved a lot. But in last couple of years, profitability has gone down to
changing economy. But still the firm has considerable offset compared to its competitor.
3.4 Market Value Ratio
Market value is the most critical ratio while making any kind of investment decision about the company.
Price / Earning Ratio
Company Square Textiles Ltd. ASKMLYear 2009 2008 2007 2006 2005 2004 2003 2009P/E Ratio 30.23 24.90 14.25 8.54 12.61 27.44 10.12 48.02
Table 16 Return on Equity for Square Textiles Ltd. & Apex Spinning & Knitting Mills Ltd.
P/E Ratio of Square Textiles Ltd. in the last year was higher than that of Apex Spinning & Knitting Mills Ltd.
Page 28 of 48

Figure 12 Price / Earning Ratio Trend
P/E Ratio of Square Textiles Ltd. climbed up in the last year from 2008. The company has maintained a
healthy P/E ratio for the last 7 years.
3.4.1 Market Value / Book Value Ratio
Company Square Textiles Ltd. ASKMLYear 2009 2008 2007 2006 2005 2004 2003 2009M/B Ratio 2.52 2.34 2.49 1.46 1.65 2.84 0.97 1.67
Table 17 Market / Book Value for Square Textiles Ltd. & Apex Spinning & Knitting Mills Ltd.
M/B Ratio of Square Textiles Ltd. is higher than that of Apex Spinning & Knitting Mills Ltd.
Page 29 of 48

Figure 13 Market Value Book Value Trend
M/B trend shows that for Square Textiles Ltd. it was steady for last 3 years after some ups and downs in the
earlier years.
Overall comment on Market ValueSquare Textiles’ P/E ratio of last 7 years suggest that shareholders are willing to spend a much higher price for the company’s shares compared to the earnings. This indicates trust on the company. All the previous ratios also suggest that the company is doing quite well for last several years. The company’s performance has gained trust among the share market investors and as a result the share price is quite high compared to book value which is also reflected in M/B ratio.
Page 30 of 48
4.0 Stock Price Movement
In this section of the report, we try to relate stock price movement with different events/corporate decisions like AGM, account closing, dividend declaration, M&A etc. by doing a simple regression of share price against a dummy variable populated indicating the event. The value of the dummy variable is taken as 0 for all dates before the event and 1 for all dates after the event. Regression was done with a 95% confidence interval.
4.1 Account Closing
Year R2 FSignificance
FCo-efficient
P-Value of Co-
efficient2008 0.78464 134.805 6.73182E-14 13.3031746 6.73182E-
142009 0.207308 10.46094 0.002447 -4.07143 0.0024472010 0.006267 0.239632 0.627286 0.3 0.627286
There is significant statistical evidence that the share price was positively correlated with account closing in 2008. And we also see a significant negative correlation in 2009. But there is no statistical evidence that the share price was correlated to account closing in 2010.
4.2 Dividend Declaration
YearDividend
PaidR2 F
Significance F
Co-efficient
P-Value of Co-
efficient
200825% Cash
20% Bonus
0.1537 5.993255 0.019845 4.672222 0.019845
200918% Cash
20% Bonus
0.300204 17.58851 0.000143 -3.59545 0.000143
201016% Cash
15% Bonus
0.565958 53.46095 6E-09 -10.7548 6E-09
We see significant positive correlation between dividend declaration and share price in 2008. In later years the correlation is more significant and there is an increase in R2 which indicates the correlation becoming higher. If we observe the dividend payout for these years, we find that the company has declared lesser and lesser dividends in the later years and the relation is
Page 31 of 48

significantly negative. This suggests that the stockholders definitely did not like the decrease in dividend payout.
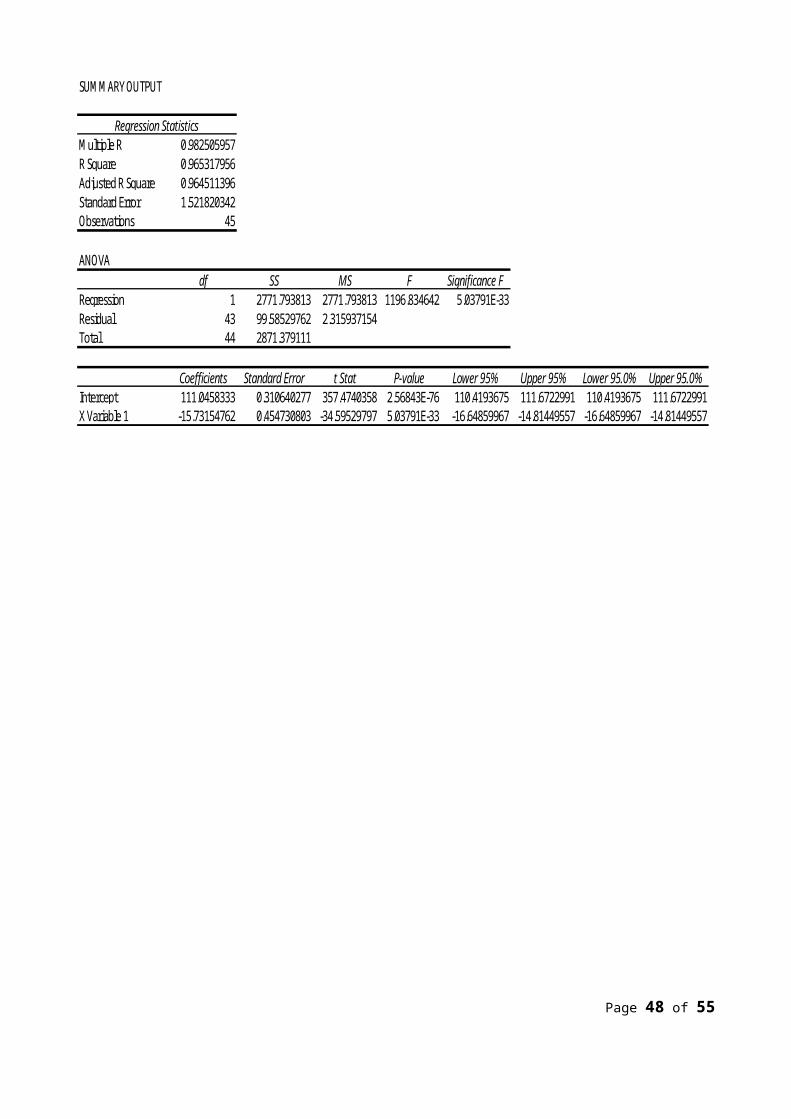
4.3 Record Date
Year R2 FSignificance
FCo-efficient
P-Value of Co-
efficient2008 0.298928 16.62913 0.000217 -8.16857 0.0002172009 0.965318 1196.835 5.04E-33 -15.7315 5.04E-332010 0.886335 304.1134 5.17E-20 -13.826 5.17E-20
The regression results indicate significant negative relation between record date and share price. Decrease in share price after record date is mainly due to that fact that shareholders who likes to get dividends holds the share until record date and sells them afterwards.
4.4 Annual General Meeting
Year R2 FSignificance
FCo-efficient
P-Value of Co-
efficient2008 0.158764 7.549105 0.00896 -5.84909 0.008962009 0.131547 6.36187 0.015537 -3.83354 0.0155372010 0.581957 55.68386 4.3E-09 9.795 4.3E-09
The regression results indicate significant relation between AGM and share price. However the relation was negative in 2008 and 2009 while we find a significant positive correlation in year 2010. The change in sign of correlation cannot be explained with available data.
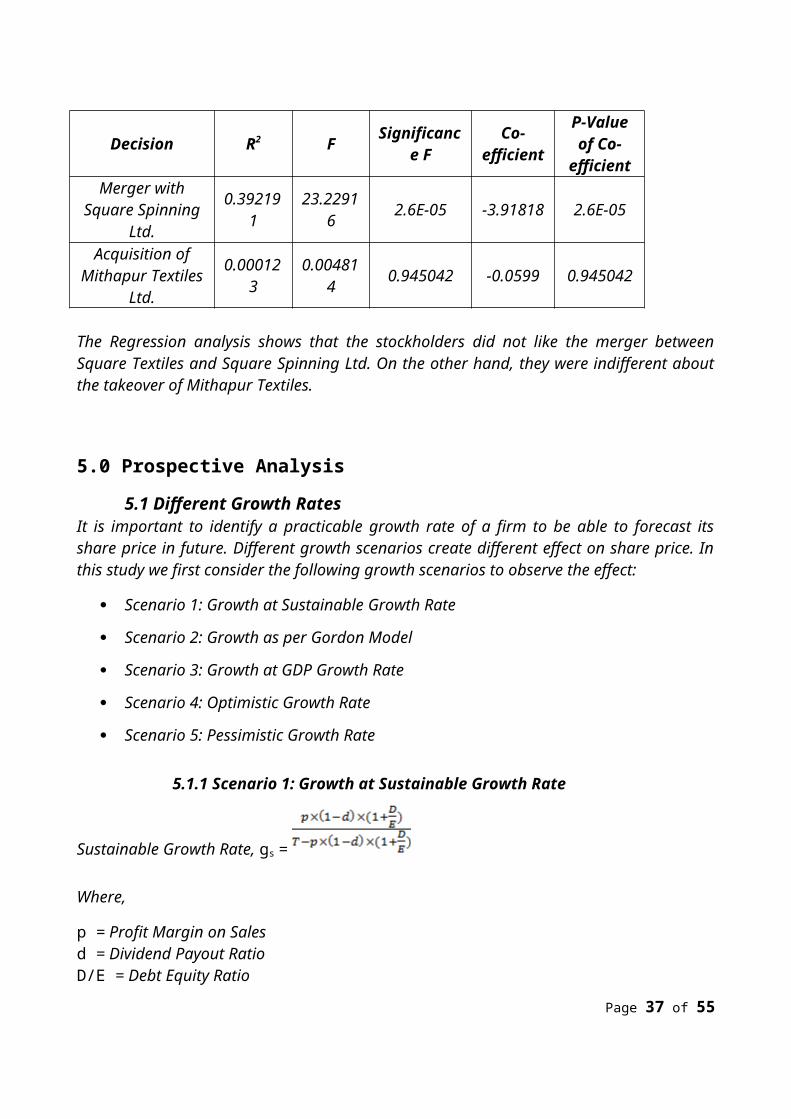
4.5 M&A ActivitiesApart from the regular annual events, we were interested to observe the effect on share price caused by 2 very big decisions made by Square Textiles in recent years: merger with Square Spinning Ltd. and acquisition of Mithapur Textiles Ltd.
Decision R2 FSignificance
FCo-
efficient
P-Value of Co-
efficientMerger with
Square Spinning Ltd.
0.392191 23.22916 2.6E-05 -3.91818 2.6E-05
Acquisition of Mithapur Textiles
Ltd.0.000123 0.004814 0.945042 -0.0599 0.945042
Page 32 of 48

The Regression analysis shows that the stockholders did not like the merger between Square Textiles and Square Spinning Ltd. On the other hand, they were indifferent about the takeover of Mithapur Textiles.
5.0 Prospective Analysis
5.1 Different Growth RatesIt is important to identify a practicable growth rate of a firm to be able to forecast its share price in future. Different growth scenarios create different effect on share price. In this study we first consider the following growth scenarios to observe the effect:
Scenario 1: Growth at Sustainable Growth Rate
Scenario 2: Growth as per Gordon Model
Scenario 3: Growth at GDP Growth Rate
Scenario 4: Optimistic Growth Rate
Scenario 5: Pessimistic Growth Rate
5.1.1 Scenario 1: Growth at Sustainable Growth Rate
Sustainable Growth Rate, gs =
Where, p = Profit Margin on Salesd = Dividend Payout RatioD/E = Debt Equity RatioT =Ratio of total assets to salesIn our case, gs = 1.36%Table: 3 yrs Forecast at g = gs 2009 2010 2011 2012Sales 3,882,244,01
03,935,002,59
33,988,478,15
04,042,680,42
4Net Income 260,634,002 264,175,943 267,766,019 271,404,882Dividend 218,810,564 221,784,137 224,798,120 227,853,062Addition to Retained Earnings 41,823,438 42,391,806 42,967,899 43,551,820Total Assets 5,508,282,31
65,583,138,29
35,659,011,54
25,735,915,88
6Total Debt 2,388,878,28
92,421,342,46
02,454,247,81
02,487,600,33
4Common Stock 705,840,530 705,840,530 705,840,530 705,840,530Retained Earnings 2,413,563,49
72,455,955,30
32,498,923,20
22,542,475,02
2Total Financing 5,508,282,31 5,583,138,29 5,659,011,54 5,735,915,88
Page 33 of 48

6 3 2 6External Funds Needed 0 0 0 0Debt: Equity Ratio 0.77 0.77 0.77 0.77Sustainable Growth Rate 1.36% 1.36% 1.36% 1.36%EPS 3.69 3.74 3.79 3.85Price (P/E = 30.227) 111.61 113.13 114.67 116.23
5.1.2 Scenario 2: Growth as per Gordon Model
According to Gordon Model, g=Retention Rate × ROEIn our case, Retention Rate = 16%
ROE = 8.36%
So, Growth Rate, g = 1.34%
Table: 3 yrs Forecast at g = 1.34% 2009 2010 2011 2012Sales 3,882,244,01
03,934,149,61
23,986,749,19
34,040,052,02
9Net Income 260,634,002 264,118,679 267,649,945 271,228,425Dividend 218,810,564 221,736,062 224,700,673 227,704,921Addition to Retained Earnings 41,823,438 42,382,617 42,949,273 43,523,504Total Assets 5,508,282,31
65,581,928,05
15,656,558,42
95,732,186,61
5Total Debt 2,388,878,28
92,420,817,59
22,453,183,92
32,485,982,99
2Common Stock 705,840,530 705,840,530 705,840,530 705,840,530Retained Earnings 2,413,563,49
72,455,946,11
42,498,895,38
72,542,418,89
1Total Financing 5,508,282,31
65,582,604,23
65,657,919,84
05,734,242,41
3External Funds Needed 0 -583,858 -1,175,539 -1,775,149Debt: Equity Ratio 0.77 0.77 0.77 0.76Sustainable Growth Rate 1.36% 1.36% 1.36% 1.36%EPS 3.69 3.74 3.79 3.84Price (P/E = 30.227) 111.61 113.11 114.63 116.16
5.1.3 Scenario 3: Growth at GDP growth rate
GDP growth rate = 5.8%
Table: 3 yrs Forecast at g = 5.8% 2009 2010 2011 2012Sales 3,882,244,01
04,107,414,16
34,345,644,18
44,597,691,54
7
Page 34 of 48

Net Income 260,634,002 275,750,774 291,744,319 308,665,490Dividend 218,810,564 231,501,577 244,928,668 259,134,531Addition to Retained Earnings 41,823,438 44,249,197 46,815,651 49,530,958Total Assets 5,508,282,31
65,827,762,69
06,165,772,92
66,523,387,75
6Total Debt 2,388,878,28
92,527,433,23
02,674,024,35
72,829,117,77
0Common Stock 705,840,530 705,840,530 705,840,530 705,840,530Retained Earnings 2,413,563,49
72,457,812,69
42,504,628,34
52,554,159,30
3Total Financing 5,508,282,31
65,691,086,45
45,884,493,23
26,089,117,60
3External Funds Needed 0 136,676,236 281,279,695 434,270,153Debt: Equity Ratio 0.77 0.84 0.92 1.00Sustainable Growth Rate 1.36% 1.42% 1.48% 1.54%EPS 3.69 3.91 4.13 4.37Price (P/E = 30.227) 111.61 118.09 124.94 132.18
5.1.4 Scenario 4: Optimistic
We assume an optimistic growth rate of 20%
Table: 3 yrs Forecast at g = 20% 2009 2010 2011 2012Sales 3,882,244,01
04,658,692,81
25,590,431,37
46,708,517,64
9Net Income 260,634,002 312,760,802 375,312,963 450,375,555Dividend 218,810,564 262,572,677 315,087,213 378,104,655Addition to Retained Earnings 41,823,438 50,188,125 60,225,750 72,270,900Total Assets 5,508,282,31
66,609,938,77
97,931,926,53
59,518,311,84
2Total Debt 2,388,878,28
92,866,653,94
73,439,984,73
64,127,981,68
3Common Stock 705,840,530 705,840,530 705,840,530 705,840,530Retained Earnings 2,413,563,49
72,463,751,62
22,523,977,37
32,596,248,27
3Total Financing 5,508,282,31
66,036,246,09
96,669,802,63
97,430,070,48
6External Funds Needed
0 573,692,6801,262,123,89
62,088,241,35
6Debt: Equity Ratio 0.77 1.09 1.46 1.88Sustainable Growth Rate 1.36% 1.61% 1.89% 2.23%EPS 3.69 4.43 5.32 6.38Price (P/E = 30.227) 111.61 133.94 160.72 192.87
5.1.5 Scenario 5: Pessimistic
We assume a pessimistic growth rate of -10%
Page 35 of 48

Table: 3 yrs Forecast at g = -10% 2009 2010 2011 2012Sales 3,882,244,01
03,494,019,60
93,144,617,64
82,830,155,88
3Net Income 260,634,002 234,570,602 211,113,542 190,002,187Dividend 218,810,564 196,929,508 177,236,557 159,512,901Addition to Retained Earnings 41,823,438 37,641,094 33,876,985 30,489,286Total Assets 5,508,282,31
64,957,454,08
44,461,708,67
64,015,537,80
8Total Debt 2,388,878,28
92,149,990,46
01,934,991,41
41,741,492,27
3Common Stock 705,840,530 705,840,530 705,840,530 705,840,530Retained Earnings 2,413,563,49
72,451,204,59
12,485,081,57
52,515,570,86
2Total Financing 5,508,282,31
65,307,035,58
15,125,913,52
04,962,903,66
4External Funds Needed 0 -349,581,497 -664,204,844 -947,365,856Debt: Equity Ratio 0.77 0.57 0.40 0.25Sustainable Growth Rate 1.36% 1.21% 1.07% 0.96%EPS 3.69 3.32 2.99 2.69Price (P/E = 30.227) 111.61 100.45 90.41 81.37
5.2 Choice of Growth RateIn the earlier scenarios, we see that high growth rate is not sustainable and it requires a very high D/E ratio which is not desired. In the trend analysis section, we found that the firm maintains a Debt Ratio below 50%. Considering this capital structure policy, it is very less likely that the company will go for debt financing to achieve high growth rates.
We also found out that the sustainable growth rate is also quite similar to the growth rate found from Gordon Model. So, it seems that the firm is actually looking to grow at sustainable growth rate. So, we take the sustainable growth rate to predict future stock price of the company.
5.3 The Plug VariableAs the company policy is to keep the debt ratio below a certain level, the company has been changing the dividend payout ratio every year. So, dividend payout is the plug variable here.
5.4 Weighted Average Cost of CapitalFrom the financial reports, we find that the cost of debt is 15.8%
To find out the cost of equity, we take help of CAPM which says that
Cost of equity, Rj = Rf + (Rβ m – Rf)
Where,
Rf = Risk free return
=β company risk
Rm = Average market return
Page 36 of 48
We consider risk free rate as 8% which is the average rate of return of bonds.
To calculate Rm and , we took monthly closing DSE index and share price of Square Textiles.β From regression, β = 0.76
Rm = 50.43%
From these values, cost of equity Rj = 40.25%
The firm has a debt ratio = 43.37%
Weighted Average Cost of Capital = 29.65%
5.6 Share Price according to Gordon Model
According to Gordon Model, share price
P = D1/(k-g) = D0(1+g)/(k-g)
D0 = 3.1 k = 29.65% g = 1.36%
So, P = 12.42
We see that the stock of Square Textiles is highly overpriced. So, it is highly likely that the share price will go down in future.
6.0 Findings and Conclusions
Square Textiles share price at the end of 2009 BDT 111.54 while its net asset value per share is only BDT 44.19. So, we were interested to find out the reasons behind this difference and also to predict future price movement. Following are the key findings in the study:
6.1 Financial Performance Square Textiles is a profitable company
It is not utilizing its assets efficiently. ROA is very low.
The company is not highly levered
The company may have some hidden profit in terms of market value of their fixed assets
especially land and buildings
6.2 Stock Price Movement Stock price of the company is highly affected by dividend declaration, record date, AGM
Page 37 of 48

The stockholders did not like the decrease in dividend in recent years
There was a merger with Square Spinning which also did not please the shareholders
which resulted in a negative correlation with share price
6.3 Growth Prospect and Future Share Price The company seems to maintain a debt equity ratio of below 1
If the firm continues with this policy, it has a very low growth opportunity
With current growth opportunity, the shares of this company is highly overpriced and
expected to fall in future
With the above observations, we come to a conclusion that the prevailing share price of the firm is expected to be decreasing in future. However, we still need to explain why the share price is so high with a high M/B ratio. This can be attributed to the brand value of ‘Square’ which has created a lot of trust among the investors. As a result, investors are ready to invest in the share even with a low return and growth opportunity.
7.0 Appendix
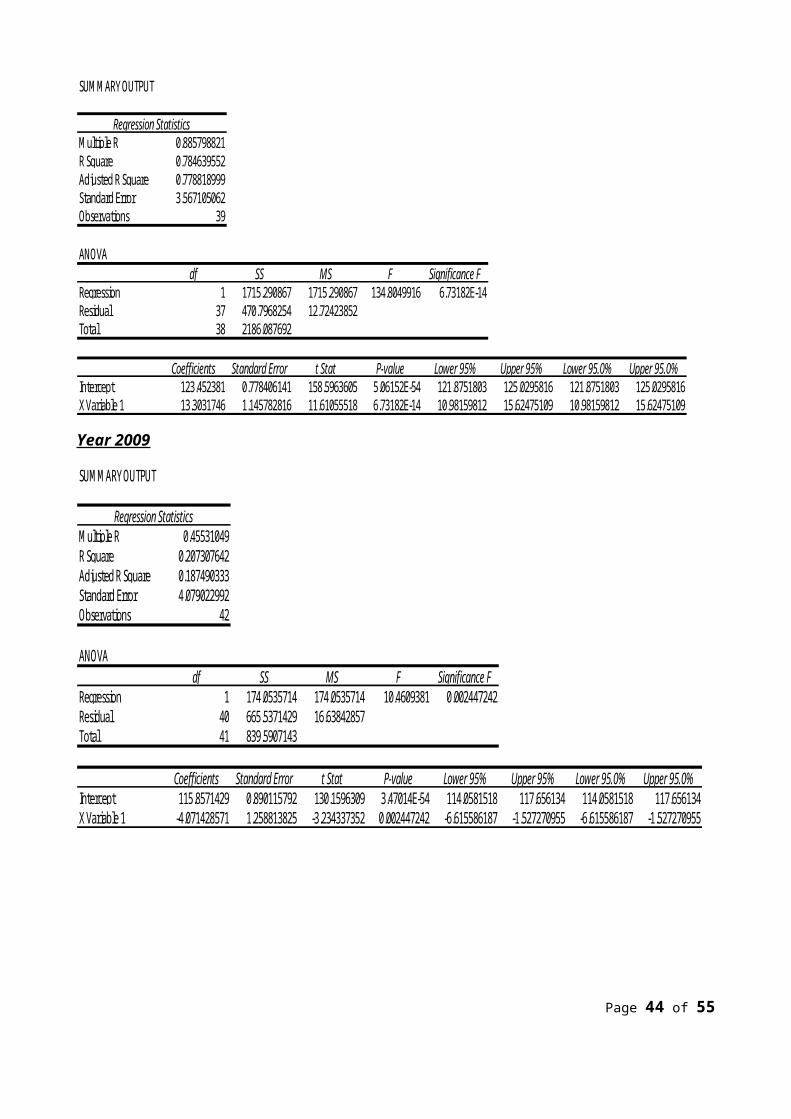
7.1 Regression results
7.1.1 Account closing
Year 2008
SUMMARY OUTPUT
Regression StatisticsMultiple R 0.885798821R Square 0.784639552Adjusted R Square 0.778818999Standard Error 3.567105062Observations 39
ANOVAdf SS MS F Significance F
Regression 1 1715.290867 1715.290867 134.8049916 6.73182E-14Residual 37 470.7968254 12.72423852Total 38 2186.087692
Coefficients Standard Error t Stat P-value Lower 95% Upper 95% Lower 95.0% Upper 95.0%Intercept 123.452381 0.778406141 158.5963605 5.06152E-54 121.8751803 125.0295816 121.8751803 125.0295816X Variable 1 13.3031746 1.145782816 11.61055518 6.73182E-14 10.98159812 15.62475109 10.98159812 15.62475109
Page 38 of 48

Year 2009
SUMMARY OUTPUT
Regression StatisticsMultiple R 0.45531049R Square 0.207307642Adjusted R Square 0.187490333Standard Error 4.079022992Observations 42
ANOVAdf SS MS F Significance F
Regression 1 174.0535714 174.0535714 10.4609381 0.002447242Residual 40 665.5371429 16.63842857Total 41 839.5907143
Coefficients Standard Error t Stat P-value Lower 95% Upper 95% Lower 95.0% Upper 95.0%Intercept 115.8571429 0.890115792 130.1596309 3.47014E-54 114.0581518 117.656134 114.0581518 117.656134X Variable 1 -4.071428571 1.258813825 -3.234337352 0.002447242 -6.615586187 -1.527270955 -6.615586187 -1.527270955
Page 39 of 48

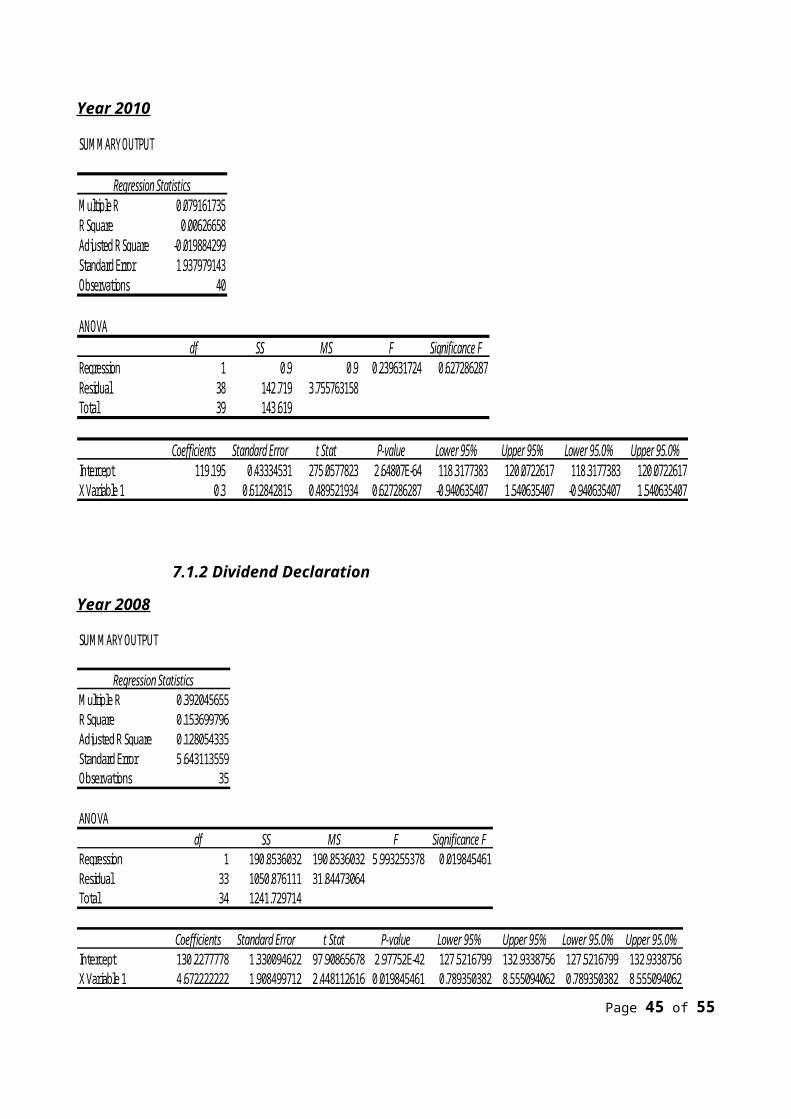
Year 2010
SUMMARY OUTPUT
Regression StatisticsMultiple R 0.079161735R Square 0.00626658Adjusted R Square -0.019884299Standard Error 1.937979143Observations 40
ANOVAdf SS MS F Significance F
Regression 1 0.9 0.9 0.239631724 0.627286287Residual 38 142.719 3.755763158Total 39 143.619
Coefficients Standard Error t Stat P-value Lower 95% Upper 95% Lower 95.0% Upper 95.0%Intercept 119.195 0.43334531 275.0577823 2.64807E-64 118.3177383 120.0722617 118.3177383 120.0722617X Variable 1 0.3 0.612842815 0.489521934 0.627286287 -0.940635407 1.540635407 -0.940635407 1.540635407
7.1.2 Dividend Declaration
Year 2008
SUMMARY OUTPUT
Regression StatisticsMultiple R 0.392045655R Square 0.153699796Adjusted R Square 0.128054335Standard Error 5.643113559Observations 35
ANOVAdf SS MS F Significance F
Regression 1 190.8536032 190.8536032 5.993255378 0.019845461Residual 33 1050.876111 31.84473064Total 34 1241.729714
Coefficients Standard Error t Stat P-value Lower 95% Upper 95% Lower 95.0% Upper 95.0%Intercept 130.2277778 1.330094622 97.90865678 2.97752E-42 127.5216799 132.9338756 127.5216799 132.9338756X Variable 1 4.672222222 1.908499712 2.448112616 0.019845461 0.789350382 8.555094062 0.789350382 8.555094062
Page 40 of 48

Year 2009
SUMMARY OUTPUT
Regression StatisticsMultiple R 0.5479088R Square 0.300204054Adjusted R Square 0.28313586Standard Error 2.810127787Observations 43
ANOVAdf SS MS F Significance F
Regression 1 138.8932452 138.8932452 17.58850743 0.000142899Residual 41 323.7695455 7.896818182Total 42 462.6627907
Coefficients Standard Error t Stat P-value Lower 95% Upper 95% Lower 95.0% Upper 95.0%Intercept 114.3 0.613220157 186.3930901 1.14049E-61 113.0615768 115.5384232 113.0615768 115.5384232X Variable 1 -3.595454545 0.857312803 -4.193865452 0.000142899 -5.326832856 -1.864076235 -5.326832856 -1.864076235
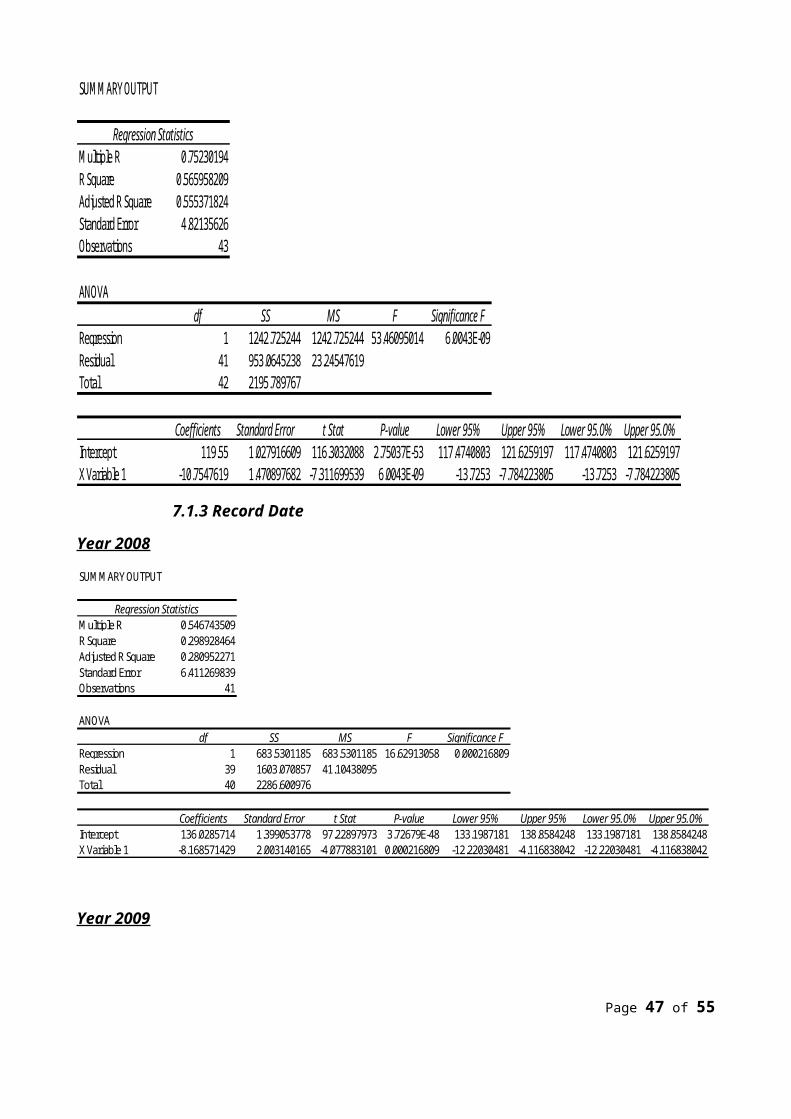
Year 2010
SUMMARY OUTPUT
Regression StatisticsMultiple R 0.75230194R Square 0.565958209Adjusted R Square 0.555371824Standard Error 4.82135626Observations 43
ANOVAdf SS MS F Significance F
Regression 1 1242.725244 1242.725244 53.46095014 6.0043E-09Residual 41 953.0645238 23.24547619Total 42 2195.789767
Coefficients Standard Error t Stat P-value Lower 95% Upper 95% Lower 95.0% Upper 95.0%Intercept 119.55 1.027916609 116.3032088 2.75037E-53 117.4740803 121.6259197 117.4740803 121.6259197X Variable 1 -10.7547619 1.470897682 -7.311699539 6.0043E-09 -13.7253 -7.784223805 -13.7253 -7.784223805
Page 41 of 48

7.1.3 Record Date
Year 2008
SUMMARY OUTPUT
Regression StatisticsMultiple R 0.546743509R Square 0.298928464Adjusted R Square 0.280952271Standard Error 6.411269839Observations 41
ANOVAdf SS MS F Significance F
Regression 1 683.5301185 683.5301185 16.62913058 0.000216809Residual 39 1603.070857 41.10438095Total 40 2286.600976
Coefficients Standard Error t Stat P-value Lower 95% Upper 95% Lower 95.0% Upper 95.0%Intercept 136.0285714 1.399053778 97.22897973 3.72679E-48 133.1987181 138.8584248 133.1987181 138.8584248X Variable 1 -8.168571429 2.003140165 -4.077883101 0.000216809 -12.22030481 -4.116838042 -12.22030481 -4.116838042
Year 2009
SUMMARY OUTPUT
Regression StatisticsMultiple R 0.982505957R Square 0.965317956Adjusted R Square 0.964511396Standard Error 1.521820342Observations 45
ANOVAdf SS MS F Significance F
Regression 1 2771.793813 2771.793813 1196.834642 5.03791E-33Residual 43 99.58529762 2.315937154Total 44 2871.379111
Coefficients Standard Error t Stat P-value Lower 95% Upper 95% Lower 95.0% Upper 95.0%Intercept 111.0458333 0.310640277 357.4740358 2.56843E-76 110.4193675 111.6722991 110.4193675 111.6722991X Variable 1 -15.73154762 0.454730803 -34.59529797 5.03791E-33 -16.64859967 -14.81449557 -16.64859967 -14.81449557
Page 42 of 48

Year 2010
SUMMARY OUTPUT
Regression StatisticsMultiple R 0.941453645R Square 0.886334965Adjusted R Square 0.883420477Standard Error 2.537522924Observations 41
ANOVAdf SS MS F Significance F
Regression 1 1958.193241 1958.193241 304.1134293 5.16655E-20Residual 39 251.121881 6.439022589Total 40 2209.315122
Coefficients Standard Error t Stat P-value Lower 95% Upper 95% Lower 95.0% Upper 95.0%Intercept 114.4809524 0.553732899 206.7439963 6.60641E-61 113.3609219 115.6009829 113.3609219 115.6009829X Variable 1 -13.82595238 0.792824856 -17.43884828 5.16655E-20 -15.429592 -12.22231276 -15.429592 -12.22231276
7.1.4 AGM
Year 2008
SUMMARY OUTPUT
Regression StatisticsMultiple R 0.398452496R Square 0.158764391Adjusted R Square 0.137733501Standard Error 6.890366793Observations 42
ANOVAdf SS MS F Significance F
Regression 1 358.4100087 358.4100087 7.549104661 0.008960466Residual 40 1899.086182 47.47715455Total 41 2257.49619
Coefficients Standard Error t Stat P-value Lower 95% Upper 95% Lower 95.0% Upper 95.0%Intercept 128.1090909 1.469031136 87.20651846 2.97137E-47 125.1400683 131.0781136 125.1400683 131.0781136X Variable 1 -5.849090909 2.128828365 -2.747563404 0.008960466 -10.15161348 -1.546568334 -10.15161348 -1.546568334
Page 43 of 48
Year 2009
SUMMARY OUTPUT
Regression StatisticsMultiple R 0.362694405R Square 0.131547231Adjusted R Square 0.110869784Standard Error 5.035642262Observations 44
ANOVAdf SS MS F Significance F
Regression 1 161.322349 161.322349 6.361870105 0.015537277Residual 42 1065.023106 25.35769299Total 43 1226.345455
Coefficients Standard Error t Stat P-value Lower 95% Upper 95% Lower 95.0% Upper 95.0%Intercept 98.94782609 1.050003996 94.23566624 1.64766E-50 96.82883226 101.0668199 96.82883226 101.0668199X Variable 1 -3.833540373 1.519874199 -2.522274788 0.015537277 -6.900770648 -0.766310097 -6.900770648 -0.766310097
Year 2010
SUMMARY OUTPUT
Regression StatisticsMultiple R 0.762860847R Square 0.581956672Adjusted R Square 0.571505589Standard Error 4.248557108Observations 42
ANOVAdf SS MS F Significance F
Regression 1 1005.106929 1005.106929 55.6838617 4.29564E-09Residual 40 722.0095 18.0502375Total 41 1727.116429
Coefficients Standard Error t Stat P-value Lower 95% Upper 95% Lower 95.0% Upper 95.0%Intercept 102 0.905795419 112.6082092 1.12173E-51 100.1693192 103.8306808 100.1693192 103.8306808X Variable 1 9.795 1.312622267 7.462161999 4.29564E-09 7.142091466 12.44790853 7.142091466 12.44790853
Page 44 of 48
7.1.5 M&A Activities
Merger with Square Spinning
SUMMARY OUTPUT
Regression StatisticsMultiple R 0.626251758R Square 0.392191264Adjusted R Square 0.375307688Standard Error 2.474271651Observations 38
ANOVAdf SS MS F Significance F
Regression 1 142.209378 142.209378 23.22915856 2.60356E-05Residual 36 220.3927273 6.122020202Total 37 362.6021053
Coefficients Standard Error t Stat P-value Lower 95% Upper 95% Lower 95.0% Upper 95.0%Intercept 132.4181818 0.527516488 251.0218822 5.49862E-60 131.3483288 133.4880348 131.3483288 133.4880348X Variable 1 -3.918181818 0.812957507 -4.819663739 2.60356E-05 -5.56693605 -2.269427587 -5.56693605 -2.269427587
Acquisition of Mithapur Textiles
SUMMARY OUTPUT
Regression StatisticsMultiple R 0.011108975R Square 0.000123409Adjusted R Square -0.025514452Standard Error 2.743636038Observations 41
ANOVAdf SS MS F Significance F
Regression 1 0.036234241 0.036234241 0.004813558 0.945041827Residual 39 293.5740097 7.527538709Total 40 293.6102439
Coefficients Standard Error t Stat P-value Lower 95% Upper 95% Lower 95.0% Upper 95.0%Intercept 108.8043478 0.572087661 190.1882443 1.70733E-59 107.6471913 109.9615043 107.6471913 109.9615043X Variable 1 -0.059903382 0.86341235 -0.069379806 0.945041827 -1.806319687 1.686512923 -1.806319687 1.686512923
Page 45 of 48

7.2 Weighted Average Cost of Capital
7.2.1 Calculationβ
SUMMARY OUTPUT
Regression StatisticsMultiple R 0.555401544R Square 0.308470875Adjusted R Square 0.301691177Standard Error 0.050658261Observations 104
ANOVAdf SS MS F Significance F
Regression 1 0.116762778 0.116762778 45.49921043 9.40568E-10Residual 102 0.261758461 0.002566259Total 103 0.378521239
Coefficients Standard Error t Stat P-value Lower 95% Upper 95% Lower 95.0% Upper 95.0%Intercept -0.00112883 0.005051618 -0.223459041 0.823625186 -0.01114869 0.008891031 -0.01114869 0.008891031Rm-Rf 0.75919073 0.112550898 6.745310255 9.40568E-10 0.535946562 0.982434897 0.535946562 0.982434897
7.2.2 Average Market Return
Average weekly return = 0.97%
So, average annual return = 0.97*52 = 50.43%
A.2.2 Cost of Equity
Ri = .08 + 0.76 (.5043 - .08) = 40.25%
A.2.2 WACC
Cost of Debt = 15.8%
Debt Ratio = 43.37%
WACC = 0.4337 X 15.8 + (1-0.4337) X 40.25 = 29.65%
Page 46 of 48
7.3 Financial Statements & Performance DataSquare Textiles Ltd.
ASKML2009 2008 2007 2006 2005 2004 2003
Current Assets 3,224,729,710 3,437,049,714 1,909,672,000 1,417,780,000 1,391,410,000 1,357,092,000 1,284,065,000 481,192,792Current Liabilities 2,388,878,289 2,843,250,860 1,382,789,000 1,269,821,000 989,212,000 1,187,839,000 1,267,503,000 436,833,644Inventory 942,568,134 1,267,785,890 577,163,363 487,871,798 487,753,824 405,449,809 329,015,503 150,077,244COGS 3,348,870,289 2,589,019,736 1,958,696,404 2,041,065,393 1,847,818,461 2,083,702,523 1,737,055,759 1,434,176,589Accounts Receivable
1,683,329,048 1,689,670,282 819,360,445 821,199,524 756,736,173 834,989,837 840,066,283 235,362,912
Sales 3,882,244,010 3,052,235,640 2,541,543,000 2,620,966,000 2,390,979,000 2,459,201,000 2,102,670,000 1,586,094,474Fixed Assets 2,283,552,606 2,370,847,250 1,573,559,000 1,702,906,000 1,193,767,000 1,180,203,000 1,217,332,000 342,491,610Total Assets 5,508,282,316 5,807,896,964 3,483,231,000 3,120,686,000 2,585,177,000 2,537,295,000 2,501,397,000 823,684,402Total Debt 2,388,878,289 2,843,250,860 1,382,789,000 1,269,821,000 989,212,000 1,187,839,000 1,267,503,000 437,134,519EBIT 433,507,033 387,282,778 517,149,366 481,315,121 465,778,608 300,290,342 305,414,202 35,344,028Interest Expenses 121,730,159 109,701,045 106,026,180 77,350,086 67,966,406 70,530,935 124,160,747 17,176,247Net Income 260,634,002 236,529,908 352,447,136 348,833,453 255,494,330 198,689,678 167,893,727 13,814,819Common Equity 3,119,404,027 2,964,646,104 2,020,482,000 1,770,905,000 1,513,511,000 1,349,457,000 1,233,894,000 396,170,995Market Price 111.54 117.3 127.4 75.6 81.7 138.3 43.1 790EPS 3.69 4.71 8.94 8.85 6.48 5.04 4.26 16Book Value 44.19 50.04 51.23 51.65 49.66 48.7 44.53 472No. of shares 70,584,053 58,820,044 39,433,370 34,289,887 30,479,900 27,709,000 25,190,000 840,000Dividend payout 218,810,564 223,516,167 177,450,165 154,304,492 129,539,575 110,836,000 100,760,000Dividend per share 3.10 3.80 4.50 4.50 4.25 4.00 4.00
Source: Annual Reports
Page 47 of 48
7.4 References
1. Dewaelheyns and Hulle (2009),Capital Structure, Journal Of Economic Perspectives, Vol. 11, No. 2, Pp 8-10.
2. Harris, M and Raviv A, (1991), The Theory Of Capital Structure, Journal Of Finance, Vol. 46, Pp. 297- 355.
3. Shah ,Hijazi T (2004), The Theory Of Capital Structure, Journal Of Finance, Vol. 46, Pp. 297-355
4. Lima, (2009), The Determinants Of Capital Structure, Journal Of Finance, Vol. Pp 1- 19.
5. Modigliani F and Miller H, (1958), The Cost Of Capital, Corporation Finance And The Theory Of Investment, American Economic Review Pp. 261-297.
6. Modigliani F And Miller H, (1963), Corporation Income, Taxes And The Cost Of Capital: A Correction, American Economic Review
7. Myers S (1984), The Capital Structure Puzzle, Journal Of Finance, 39, Pp 572-92
8. http://textile.squaregroup.com/sqtextile.html
9. http://textile.squaregroup.com/tex_financialStat.html
10. http://textile.squaregroup.com/downloads/square_textiles_3rdquarter_ended12.pdf
11. http://textile.squaregroup.com/downloads/stxl_half_yearly_report_2012.pdf
Page 48 of 48