coronary artery bypass surgery - user:upstatenyer/new york
TRANSCRIPT

CORONARYARTERYBYPASSSURGERYinNew York State
1994-1996
New York State Department of HealthOctober 1998


New York State Department of HealthMembers of the State Cardiac Advisory CommitteeChairKenneth I. Shine, M.D.Institute of MedicineNational Academy of SciencesWashington, DC
Vice ChairO. Wayne Isom, M.D.Professor and ChairmanDepartment of Cardiothoracic SurgeryNew York Hospital - CornellNew York, NY
MembersDjavad T. Arani, M.D.Clinical Associate Professor of MedicineSUNY at Buffalo School of MedicineThe Buffalo General Hospital, Buffalo, NY
Edward V. Bennett, M.D.Chief of Cardiac SurgerySt. Peter’s Hospital, Albany, NY
Luther Clark, M.D.Chief, Division of Cardiovascular MedicineUniversity Hospital of Brooklyn, NY
Jeffrey P. Gold, M.D.Chairman, Cardiac & Thoracic SurgeryMontefiore Medical CenterBronx, NY
Alan Guerci, M.D.Executive Vice President for Medical AffairsSt. Francis Hospital, Roslyn, NY
Alan Hartman, M.D.Department of Cardiovascular SurgeryWinthrop University Hospital, Mineola, NY
Robert Jones, M.D.Mary & Deryl Hart Professor of SurgeryDuke University Medical CenterDurham, NC
Rae-Ellen Kavey, M.D.Professor of Pediatric CardiologySUNY Health Science CenterSyracuse, NY
Ben D. McCallister, M.D.Endowed Chair and DirectorCardiovascular ResearchMid America Heart InstituteKansas City, MO
Barbara J. McNeil, M.D., Ph.D.Head, Department of Health Care PolicyHarvard Medical School, Boston, MA
Alvin Mushlin, M.D., Sc.M.Professor, Community Medicine & MedicineUniversity of Rochester Medical CenterRochester, NY
Jan M. Quaegebeur, M.D., Ph.D.Department of SurgeryColumbia-Presbyterian Hospital, New York, NY
Eric Rose, M.D.Chairman, Department of SurgeryColumbia University, New York, NY
Thomas J. Ryan, M.D.Professor of MedicineBoston University Medical CenterBoston, MA
Tomas Salerno, M.D.Chief, Division of Cardiothoracic SurgeryThe Buffalo General Hospital, Buffalo, NY
Rev. Robert S. SmithStony Brook, NY
Valavanur A. Subramanian, M.D.Director, Department of SurgeryLenox Hill Hospital, New York, NY
Gary Walford, M.D.Director, Cardiac Catheterization LaboratorySt. Joseph’s Hospital, Syracuse, NY
Roberta Williams, M.D.Chairman, Department of PediatricsUniversity of North Carolina, Chapel Hill, NC


TABLE OF CONTENTSINTRODUCTION . . . . . . . . . . . . . . . . . . . . . . . . . . . . . . . . . . . . . . . . . . . . . . . . . . . . . . . . . . . . . . . . .1
CORONARY ARTERY BYPASS GRAFT SURGERY (CABG) . . . . . . . . . . . . . . . . . . . . . . . . . . . . . . . . . .3
THE HEALTH DEPARTMENT PROGRAM . . . . . . . . . . . . . . . . . . . . . . . . . . . . . . . . . . . . . . . . . . . . . . .4
PATIENT POPULATION . . . . . . . . . . . . . . . . . . . . . . . . . . . . . . . . . . . . . . . . . . . . . . . . . . . . . . . . . . .4
RISK ADJUSTMENT FOR ASSESSING PROVIDER PERFORMANCE . . . . . . . . . . . . . . . . . . . . . . . . . . . . .4
Data Collection, Data Validation and Identifying In-Hospital Deaths . . . . . . . . . . . . . . . . . . . . . . . . .4
Assessing Patient Risk . . . . . . . . . . . . . . . . . . . . . . . . . . . . . . . . . . . . . . . . . . . . . . . . . . . . . . . . . . .5
Predicting Patient Mortality Rates for Providers . . . . . . . . . . . . . . . . . . . . . . . . . . . . . . . . . . . . . . . . .5
Computing the Risk-Adjusted Rate . . . . . . . . . . . . . . . . . . . . . . . . . . . . . . . . . . . . . . . . . . . . . . . . . .5
Interpreting the Risk-Adjusted Mortality Rate . . . . . . . . . . . . . . . . . . . . . . . . . . . . . . . . . . . . . . . . . .5
How This Contributes to Quality Improvement . . . . . . . . . . . . . . . . . . . . . . . . . . . . . . . . . . . . . . . . .6
RESULTS . . . . . . . . . . . . . . . . . . . . . . . . . . . . . . . . . . . . . . . . . . . . . . . . . . . . . . . . . . . . . . . . . . . .6
1996 Risk Factors for CABG Surgery . . . . . . . . . . . . . . . . . . . . . . . . . . . . . . . . . . . . . . . . . . . . . . . . . .6
Table 1 Multivariable Risk Factor Equation for CABG HospitalDeaths in New York State in 1996 . . . . . . . . . . . . . . . . . . . . . . . . . . . . . . . . . . . . . . . . . . .7
1996 HOSPITAL OUTCOMES FOR CABG SURGERY . . . . . . . . . . . . . . . . . . . . . . . . . . . . . . . . . . . . . . .8
Table 2 Hospital Observed, Expected and Risk-Adjusted MortalityRates (RAMR) for CABG Surgery in New York State, 1996 Discharges . . . . . . . . . . . . . . . .9
Figure 1 Risk-Adjusted Mortality Rates for CABG inNew York State, 1996 Discharges . . . . . . . . . . . . . . . . . . . . . . . . . . . . . . . . . . . . . . . . . . 10
1994-1996 HOSPITAL AND SURGEON DATA FOR CABG SURGERY . . . . . . . . . . . . . . . . . . . . . . . . . . 11
Table 3 Observed, Expected and Risk-Adjusted Hospital andSurgeon In-Hospital Mortality Rates for CABG Surgery,1994-1996 . . . . . . . . . . . . . . . . . . . . . . . . . . . . . . . . . . . . . . . . . . . . . . . . . . . . . . . . . . . 11
Table 4 Summary Information for Surgeons Practicing at MoreThan One Hospital, 1994-1996 . . . . . . . . . . . . . . . . . . . . . . . . . . . . . . . . . . . . . . . . . . . . 19
SURGEON AND HOSPITAL VOLUMES FOR ADULT CARDIACSURGERY AND FOR ISOLATED CABG SURGERY (1994-1996) . . . . . . . . . . . . . . . . . . . . . . . . . . . . . . 23
Table 5 Total Cardiac Surgery and Isolated CABG SurgeryVolumes by Hospital and Surgeon, 1994-1996 . . . . . . . . . . . . . . . . . . . . . . . . . . . . . . . . . 23
MEDICAL TERMINOLOGY . . . . . . . . . . . . . . . . . . . . . . . . . . . . . . . . . . . . . . . . . . . . . . . . . . . . . . . . 31
NYS CARDIAC SURGERY CENTERS . . . . . . . . . . . . . . . . . . . . . . . . . . . . . . . . . . . . . . . . . . . . . . . . . . 32


INTRODUCTIONThe information contained in this booklet is intended for health care providers, patients and families ofpatients who are considering coronary artery bypass surgery. It provides data on risk factors associatedwith bypass surgery mortality and lists hospital and physician-specific mortality rates which have been risk-adjusted to account for differences in patient severity of illness.
New York State has taken a leadership role in setting standards for cardiac services, monitoring outcomesand sharing performance data with patients, hospitals and physicians. Hospitals and doctors involved incardiac care have worked in cooperation with the Department of Health and the Cardiac AdvisoryCommittee to compile accurate and meaningful data which can and has been used to enhance quality ofcare. We believe that this process has been instrumental in achieving the excellent outcomes that areevidenced in this report for centers across New York State.
We encourage doctors to discuss this information with their patients and colleagues as they developtreatment plans. While these statistics are an important tool in making informed health care choices,individual treatment plans must be made by doctors and patients together after careful consideration of allpertinent factors. It is important to recognize that many factors can influence the outcome of coronaryartery bypass surgery. These include the patient’s health before the procedure, the skill of the operatingteam and general after care. In addition, keep in mind that the information in this booklet does not includedata from 1997 or 1998. Important changes may have taken place in some hospitals during that timeperiod.
In developing treatment plans, it is important that patients and physicians alike give careful considerationto the importance of healthy lifestyles for all those affected by heart disease. While some risk factors, suchas heredity, gender and age cannot be controlled, others certainly can. Controllable risk factors thatcontribute to a higher likelihood of developing coronary artery disease are high cholesterol levels, cigarettesmoking, high blood pressure, obesity and a lack of exercise. Limiting these risk factors after bypasssurgery will continue to be important in minimizing the occurrence of new blockages.
Providers of this state and the Cardiac Advisory Committee are to be commended for the excellent resultsthat have been achieved through this cooperative quality improvement system. The Department of Healthwill continue to work in partnership with hospitals and physicians to ensure the continued high quality ofcardiac surgery available to New York residents.
1


chest is used to construct the bypass. One ormore bypasses may be performed during a singleoperation, since providing several routes for theblood supply to travel is believed to improvelong-term success for the procedure. Triple andquadruple bypasses are often done for thisreason, not necessarily because the patient’scondition is more severe. CABG surgery is one ofthe most common, successful major operationscurrently performed in the United States.
As is true of all major surgery, risks must beconsidered. The patient is totally anesthetized,and there is generally a substantial recoveryperiod in the hospital followed by several weeksrecuperation at home. Even in successful cases,there is a risk of relapse causing the need foranother operation.
Those who have CABG surgery are not cured ofcoronary artery disease; the disease can still occurin the grafted blood vessels or other coronaryarteries. In order to minimize new blockage,patients should continue to reduce their riskfactors for heart disease.
Heart disease is, by far, the leading cause ofdeath in New York State, and the most commonform of heart disease is atherosclerotic coronaryartery disease. Different treatments arerecommended for patients with coronary arterydisease. For some people, changes in lifestyle,such as dietary changes, not smoking and regularexercise, can result in great improvements inhealth. In other cases, medication prescribed forhigh blood pressure or other conditions canmake a significant difference.
Sometimes, however, an interventional procedureis recommended. The two common proceduresperformed on patients with coronary arterydisease are coronary artery bypass graft (CABG)surgery and percutaneous transluminal coronaryangioplasty (PTCA).
Coronary artery bypass graft surgery is aprocedure in which a vein or artery from anotherpart of the body is used to create an alternatepath for blood to flow to the heart, bypassing thearterial blockage. Typically, a section of one ofthe large (saphenous) veins in the leg, the radialartery in the arm or the mammary artery in the
3
CORONARY ARTERY BYPASS GRAFT SURGERY (CABG)

THE HEALTH DEPARTMENT PROGRAMThe New York State Department of Health hasbeen studying the effects of patient and treatmentcharacteristics (called risk factors) on outcomesfor patients with heart disease. Detailed statisticalanalyses of the information received from thestudy have been conducted under the guidanceof the New York State Cardiac AdvisoryCommittee, a group of independent practicingcardiac surgeons, cardiologists and otherprofessionals in related fields.
The results have been used to create a cardiacprofile system which assesses the performance ofhospitals and surgeons over time, independent ofthe severity of individual patients’ pre-operativeconditions.
Designed to improve health in people with heartdisease, this program is aimed at:
• understanding the health risks of patientswhich adversely affect how they will fare incoronary artery bypass surgery;
• improving the results of different treatmentsof heart disease;
• improving cardiac care;
• providing information to help patients makebetter decisions about their own care.
4
PATIENT POPULATIONAll patients undergoing isolated coronary arterybypass graft surgery (CABG surgery with no othermajor heart surgery during the same admission)in New York State hospitals who were dischargedin 1996 are included in the one-year results forcoronary artery bypass surgery. Similarly, allpatients undergoing isolated CABG surgery whowere discharged between January 1, 1994, and
December 31, 1996, are included in the three-year results.
Isolated CABG surgery represented 73.92 percentof all adult cardiac surgery for the three-yearperiod covered by this report. Total cardiacsurgery volume and isolated CABG volume aretabulated in Table 5 by hospital and surgeon forthe period 1994 through 1996.
Provider performance is directly related to patientoutcomes. Whether patients recover quickly,experience complications or die following aprocedure is in part a result of the kind ofmedical care they receive. It is difficult, however,to compare outcomes across hospitals whenassessing provider performance, because differenthospitals treat different types of patients.Hospitals with sicker patients may have higherrates of complications and death than otherhospitals in the state. The following describeshow the New York State Department of Healthadjusts for patient risk in assessing provideroutcomes.
Data Collection, Data Validation and IdentifyingIn-Hospital DeathsAs part of the risk-adjustment process, New YorkState hospitals where CABG surgery is performedprovide information to the Department of Healthfor each patient undergoing that procedure.Cardiac surgery departments collect dataconcerning patients’ demographic and clinicalcharacteristics. Approximately 40 of these
RISK ADJUSTMENT FOR ASSESSING PROVIDER PERFORMANCEcharacteristics (called risk factors) are collectedfor each patient. Along with information aboutthe procedure, physician and the patient’s statusat discharge, these data are entered into acomputer, and sent to the Department of Healthfor analysis.
Data are verified through review of unusualreporting frequencies, cross-matching of cardiacsurgery data with other Department of Healthdatabases and a review of medical records for aselected sample of cases. These activities areextremely helpful in ensuring consistentinterpretation of data elements across hospitals.
The analysis bases mortality on deaths occurringduring the same hospital stay in which a patientunderwent cardiac surgery. In the past, the datavalidation activities have focused on the acutecare stay at the surgery center. However, changesin the health care system have resulted in anincreasing number of administrative dischargeswithin the hospital. For example, a patient maybe discharged from an acute care bed to ahospice or rehabilitation bed within the samehospital stay in order to differentiate

reimbursement for differing levels of care. Datavalidation activities for 1996 identified one facilitywhere such administrative discharges lead to asubstantial misrepresentation of cardiac surgerymortalities for that program. In order to assureconsistency across all programs, a review ofstatewide discharge patterns was instituted toconfirm all deaths occuring within the premisesof the cardiac surgery center. It should be notedthat the bulk of the additional deaths identifiedwere at one facility and that reporting practices atthat facility have been scrutinized by theDepartment of Health and the Cardiac AdvisoryCommittee. The program will be carefullymonitored in the future.
In this report, an in-hospital death is defined as apatient who died subsequent to CABG surgeryduring the same acute care admission; wasdischarged to another unit of the same hospital(e.g., hospice care, rehabilitation) and died; orwas transferred to a formally affiliated cardiacsurgery program and died.
Assessing Patient RiskEach person who develops coronary arterydisease has a unique health history. A cardiacprofile system has been developed to evaluatethe risk of treatment for each individual patientbased on his or her history, weighing theimportant health facts for that person based onthe experiences of thousands of patients whohave undergone the same procedures in recentyears. All important risk factors for each patientare combined to create a risk profile.
An 80-year-old patient with a history of two heartattacks, for example, has a very different riskprofile than a 40-year-old with no previous heartproblems.
The statistical analyses conducted by theDepartment of Health consist of determiningwhich of the risk factors collected aresignificantly related to in-hospital death for CABGsurgery, and determining how to weight thesignificant risk factors to predict the chance eachpatient will have of dying in the hospital, givenhis or her specific characteristics.
Doctors and patients should review individualrisk profiles together. Treatment must be made bydoctors and patients together after considerationof all the information.
Predicting Patient Mortality Rates for ProvidersThe statistical methods used to predict mortalityon the basis of the significant risk factors are
tested to determine if they are sufficientlyaccurate in predicting mortality for patients whoare extremely ill prior to undergoing theprocedure as well as for patients who arerelatively healthy. These tests have confirmed thatthe models are reasonably accurate in predictinghow patients of all different risk levels will farewhen undergoing coronary bypass surgery.
The mortality rate for each hospital and surgeonis also predicted using the statistical model. Thisis accomplished by summing the predictedprobabilities of death for each of the provider’spatients and dividing by the number of patients.The resulting rate is an estimate of what theprovider’s mortality rate would have been if theprovider’s performance were identical to the stateperformance. The percentage is called thepredicted or expected mortality rate.
Computing the Risk-Adjusted RateThe risk-adjusted mortality rate represents thebest estimate, based on the associated statisticalmodel, of what the provider’s mortality ratewould have been if the provider had a mix ofpatients identical to the statewide mix. Thus, therisk-adjusted mortality rate has, to the extentpossible, ironed out differences among providersin patient severity of illness, since it arrives at amortality rate for each provider for an identicalgroup of patients.
To get the risk-adjusted mortality rate, theobserved mortality rate is first divided by theprovider’s expected mortality rate. If the resultingratio is larger than one, the provider has a highermortality rate than expected on the basis of itspatient mix; if it is smaller than one, the providerhas a lower mortality rate than expected from itspatient mix. The ratio is then multiplied by theoverall statewide mortality rate (2.44% in 1996) toobtain the provider’s risk-adjusted rate.
Interpreting the Risk-Adjusted Mortality RateIf the risk-adjusted mortality rate is lower than thestatewide mortality rate, the provider has a betterperformance than the state as a whole; if the risk-adjusted mortality rate is higher than thestatewide mortality rate, the provider has a worseperformance than the state as a whole.
The risk-adjusted mortality rate is used in thisreport as a measure of quality of care providedby hospitals and surgeons. However, there arereasons that a provider’s risk-adjusted mortalityrate may not be indicative of its true quality.
5

For example, extreme outcome rates may occurdue to chance alone. This is particularly true forlow-volume providers, for whom very high or verylow mortality rates are more likely to occur thanfor high-volume providers. To preventmisinterpretation of differences caused by chancevariation, confidence intervals are reported in theresults. The interpretations of those terms areprovided later when the data are presented.
Differences in hospital coding of risk factors couldbe an additional reason that a provider’s risk-adjusted rate may not be reflective of quality ofcare. The Department of Health monitors thequality of coded data by reviewing patients’medical records to ascertain the presence of keyrisk factors. When significant coding problemshave been discovered, hospitals have beenrequired to recode these data and have beensubjected to subsequent monitoring.
A final reason that risk-adjusted rates may bemisleading is that overall preprocedural severity ofillness may not be accurately estimated becauseimportant risk factors are missing. This is notconsidered to be an important factor, however,because the New York State data system containsvirtually every risk factor that has ever beendemonstrated to be related to patient mortality innational and international studies.
Although there are reasons that risk-adjustedmortality rates presented here may not be a perfectreflection of quality of care, the Department ofHealth feels that this information is a valuable aidin choosing providers for CABG surgery.
How This Contributes to Quality ImprovementThe goal of the Department of Health and theCardiac Advisory Committee is to improve thequality of care in relation to coronary arterybypass graft surgery in New York State. Providingthe hospitals and cardiac surgeons in New YorkState with data about their own outcomes forthese procedures allows them to examine thequality of their own care, and to identify areasthat need improvement.
The data collected and analyzed in this programare given to the Cardiac Advisory Committee.Committe members assist with interpretation andadvise the Department of Health regarding whichhospitals and surgeons may need specialattention. Committee members have alsoconducted site visits to particular hospitals, andhave recommended that some hospitals obtainthe expertise of outside consultants to designimprovements for their programs.
The overall results of this program of ongoingreview in CABG surgery show that significantprogress is being made. In response to theprogram’s results for CABG surgery, facilitieshave refined patient criteria, evaluated patientsmore closely for preoperative risks and directedthem to the appropriate surgeon. Moreimportantly, many hospitals have identifiedmedical care process problems that have led toless than optimal outcomes, and have alteredthose processes to achieve improved results.
6
RESULTS
1996 Risk Factors for CABG SurgeryThe significant preoperative risk factors forcoronary artery bypass surgery in 1996 arepresented in Table 1.
Roughly speaking, the odds ratio for a risk factorrepresents the number of times more likely apatient with that risk factor is of dying in thehospital during or after CABG surgery than apatient without the risk factor, all other riskfactors being the same. For example, the oddsratio for the risk factor “diabetes” is 1.688. Thismeans that a patient who has diabetes isapproximately 1.688 times as likely to die in thehospital as a patient who does not have diabetesbut who has the same other significant riskfactors.
For most of the risk factors in the table, there areonly two possibilities: having the risk factor ornot having it (for example, a patient either hasdiabetes or does not have it). Exceptions are age,body surface area (which is calculated using thepatient’s height and weight), ejection fraction(which is a measure of the heart’s ability to pumpblood), and previous myocardial infarction (MI,or heart attack).
For body surface area, the odds ratio roughlyrepresents the number of times more likely apatient is to die in the hospital than a patientwith a body surface area that is one unit smaller.
For age and age2, the relationship is morecomplicated because there is a quadratic

Table 1: Multivariable risk factor equation for CABG hospital deaths in New York State in 1996.
Logistic Regression
Patient Risk Factor Coefficient P-Value Odds Ratio
DemographicAge -0.1327 0.0040 ....
(Age)2/100 0.1345 <.0001 ....
Female Gender 0.5448 <.0001 1.724
Body Surface Area -0.8177 0.0011 0.441
Hemodynamic StateUnstable 0.8470 <0.0001 2.333
Shock 2.6546 <0.0001 14.219
ComorbiditiesChronic Obstructive
Pulmonary Disease 0.3927 0.0010 1.481
Diabetes 0.5237 <0.0001 1.688
Renal Failure with Dialysis 1.8253 <0.0001 6.205
Renal Failure, Creatinine > 2.5 0.9783 <0.0001 2.660
Hepatic Failure 2.1878 <0.0001 8.916
Severity of Atherosclerotic ProcessAortoiliac Disease 0.9201 <0.0001 2.509
Stroke 0.6247 <0.0001 1.868
Ventricular FunctionPrev. MI < 24 Hrs. 0.9226 <0.0001 2.516
Previous MI, 1-7 days 0.4184 0.0014 1.520
Ejection Fraction Less Than 20% 1.2821 <0.0001 3.604
Ejection Fraction 20%-29% 0.6505 <0.0001 1.916
Ejection Fraction 30%-39% 0.4806 <0.0001 1.617
Previous Open Heart Operations 1.2858 <0.0001 3.617
Intercept = -0.7081
C Statistic = .813
7
(squared) term in addition to a linear term. Noodds ratios are given for these two terms becausethey should be considered in conjunction withone another.
The odds ratios for the categories for ejectionfraction are relative to the omitted range (40%and higher). Thus, patients with ejection fractions
of less than 20% have odds of dying in thehospital that are 3.604 times the odds of a personwith an ejection fraction of 40% or higher, allother risk factors being the same. Similarly, theodds ratios for the categories of previous MI arerelative to the omitted categories, which are “noMI or an MI more than seven days prior tosurgery.”

Table 2 and Figure 1 present the 1996 CABGsurgery results for the 32 hospitals performingthis operation in New York. The table contains,for each hospital, the number of isolated CABGoperations (CABG operations with no other majorheart surgery) resulting in 1996 discharges, thenumber of in-hospital deaths, the observedmortality rate, the expected mortality rate basedon the statistical model presented in Table 1, therisk-adjusted mortality rate and a 95% confidenceinterval for the risk-adjusted rate.
Definitions of key terms follow:
The observed mortality rate (OMR) is thenumber of observed deaths divided by the totalnumber of patients who underwent isolatedCABG surgery.
The expected mortality rate (EMR) is the sumof the predicted probabilities of death for allpatients divided by the total number of patients.
The risk-adjusted mortality rate (RAMR) is thebest estimate, based on the statistical model, ofwhat the provider’s mortality rate would havebeen if the provider had a mix of patientsidentical to the statewide mix.
Confidence intervals for the risk-adjustedmortality rate indicate which hospitals hadsignificantly more or fewer deaths than expectedgiven the risk factors of their patients. Hospitalswith significantly higher rates than expected afteradjusting for risk are those with confidenceintervals entirely above the statewide rate.Hospitals with significantly lower rates thanexpected given the severity of illness of theirpatients before surgery have confidence intervalsentirely below the statewide rate.
As indicated in Table 2, the overall mortality ratefor the 20,078 CABG operations performed at the32 hospitals was 2.44%. Observed mortality ratesranged from 0.86% to 6.38%. The range inexpected mortality rates, which measure patientseverity of illness, was from 1.38% to 3.45%.
The risk-adjusted mortality rates, which are usedto measure performance, ranged from 1.10% to5.93%. One hospital, St. Joseph’s, had a risk-adjusted mortality rate that was significantly lowerthan the statewide rate. Three hospitals, St.Vincent’s, St. Luke’s-Roosevelt and Lenox Hill,had significantly higher risk-adjusted rates thanthe statewide average.
8
1996 HOSPITAL OUTCOMES FOR CABG SURGERY

9
Table 2: Hospital Observed, Expected and Risk-Adjusted Mortality Rates (RAMR) for CABG Surgery in New York State,1996 Discharges (Listed Alphabetically by Hospital)
Hospital Cases Deaths OMR EMR RAMR 95% CIfor RAMR
Albany Medical Center 1136 14 1.23 1.88 1.60 (0.87, 2.69)
Arnot-Ogden 135 6 4.44 1.83 5.93 (2.16, 12.90)
Bellevue 94 6 6.38 3.45 4.52 (1.65, 9.83)
Beth Israel 428 7 1.64 2.35 1.70 (0.68, 3.50)
Buffalo General 1227 33 2.69 2.38 2.76 (1.90, 3.88)
Ellis Hospital 548 9 1.64 1.78 2.25 (1.03, 4.27)
Erie County 259 3 1.16 1.84 1.53 (0.31, 4.48)
Lenox Hill 860 32 3.72 2.49 3.64* (2.49, 5.14)
LIJ Medical Center 407 9 2.21 2.27 2.38 (1.08, 4.51)
Maimonides 821 28 3.41 2.91 2.86 (1.90, 4.14)
Millard Fillmore 873 25 2.86 2.19 3.20 (2.07, 4.72)
Montefiore-Moses 378 14 3.70 2.27 3.97 (2.17, 6.67)
Montefiore-Weiler 321 8 2.49 2.61 2.33 (1.00, 4.59)
Mount Sinai 494 14 2.83 2.83 2.45 (1.34, 4.10)
New York Hospital-Cornell 798 15 1.88 2.91 1.58 (0.88, 2.60)
New York Hospital-Queens 94 1 1.06 1.38 1.88 (0.02, 10.46)
NYU Hospitals Center 585 15 2.56 3.20 1.96 (1.09, 3.23)
North Shore 831 15 1.81 2.62 1.68 (0.94, 2.77)
Presbyterian 689 12 1.74 2.45 1.73 (0.89, 3.03)
Rochester General 1007 35 3.48 3.10 2.74 (1.91, 3.81)
St. Francis 1814 31 1.71 2.30 1.81 (1.23, 2.57)
St. Joseph’s 812 7 0.86 1.91 1.10** (0.44, 2.27)
St. Luke’s-Roosevelt 430 17 3.95 2.27 4.25* (2.48, 6.81)
St. Peter’s 741 13 1.75 1.93 2.22 (1.18, 3.80)
St. Vincent’s 522 23 4.41 2.49 4.32* (2.74, 6.48)
Strong Memorial 448 18 4.02 2.69 3.64 (2.16, 5.75)
United Health Serv. 409 11 2.69 2.88 2.28 (1.14, 4.08)
Univ.Hosp. of Brooklyn 217 8 3.69 3.00 3.00 (1.29, 5.91)
Univ.Hosp.-Stony Brook 498 11 2.21 2.59 2.08 (1.04, 3.72)
Univ.Hosp.-Upstate 494 12 2.43 2.38 2.50 (1.29, 4.36)
Westchester County 924 22 2.38 2.55 2.28 (1.43, 3.44)
Winthrop Univ. Hosp. 784 16 2.04 2.38 2.09 (1.20, 3.40)
Total 20078 490 2.44
* Risk-adjusted mortality rate significantly higher than statewide rate based on 95 percent confidence interval.** Risk-adjusted mortality rate significantly lower than statewide rate based on 95 percent confidence interval.

Winthrop Univ. Hosp.
Westchester County
Upstate Medical Center
Univ. Hospital-Stony Brook
Univ. Hospital of Brooklyn
United Health Serv.
Strong Memorial
St. Vincent’s*
St. Peter’s
St. Luke’s-Roosevelt*
St. Joseph’s**
St. Francis
Rochester General
Presbyterian
North Shore
NYU Medical Center
New York Hospital-Cornell
New York Hospital-Queens
Mount Sinai
Montefiore-Weiler
Montefiore-Moses
Millard Fillmore
Maimonides
LIJ Medical Center*
Lenox Hill
Erie County
Ellis Hospital
Buffalo General
Beth Israel
Bellevue
Arnot-Ogden
Albany Medical Center
0 2 4 6 8 10 12 14
JJJJJ
JJJ
JJ
JJJ
JJJJJJJ
JJJJJ
JJJ
JJ
JJ
Winthrop Univ. Hosp.
Westchester County
Upstate Medical Center
Univ. Hospital-Stony Brook
Univ. Hospital of Brooklyn
United Health Serv.
Strong Memorial
St. Vincent’s*
St. Peter’s
St. Luke’s-Roosevelt*
St. Joseph’s**
St. Francis
Rochester General
Presbyterian
North Shore
NYU Medical Center
New York Hospital-Queens
New YorkHospital-Cornell
Mount Sinai
Montefiore-Weiler
Montefiore-Moses
Millard Fillmore
Maimonides
LIJ Medical Center
Lenox Hill*
Erie County
Ellis Hospital
Buffalo General
Beth Israel
Bellevue
Arnot-Ogden
Albany Medical Center
Figure 1: Risk-Adjusted Mortality Rates for CABG in New York State, 1996 Discharges (Listed Alphabetically by Hospital)
10
2.44New York State Average Key
Risk-adjusted mortality rate
Potential margin of statistical error
* Risk-adjusted mortality rate significantly higher thanstatewide rate based on 95 percent confidence interval.
** Risk-adjusted mortality rate significantly lower thanstatewide rate based on 95 percent confidence interval.

operations were performed. Surgeons whoperformed operations in more than one hospitalare noted in the table and are listed in allhospitals in which they performed 200 or moreoperations and/or performed at least oneoperation in each of the years 1994-1996.
Also, surgeons who met criterion (a) and/orcriterion (b) above and have performed CABGsurgery in two or more New York State hospitalsare listed separately in Table 4. For thesesurgeons, the table presents the number ofisolated CABG operations, the number of deaths,observed mortality rate, expected mortality rateand risk-adjusted mortality rate with its 95percent confidence interval for each hospital inwhich the surgeon performed surgery, as well asthe aggregate numbers (across all hospitals inwhich the surgeon performed operations). Inaddition, surgeons and hospitals with risk-adjusted mortality rates that are significantlylower or higher than the statewide mortality rate(as judged by a 95% confidence interval) arenoted in Tables 3 and 4.
Table 3 provides the number of isolated CABGoperations, number of CABG patients who diedin the hospital, observed mortality rate, expectedmortality rate, risk-adjusted mortality rate and the95% confidence interval for the risk-adjustedmortality rate for 1994-96 for each of the 32hospitals performing CABG surgery during thetime period.
This hospital information is presented for eachsurgeon (a) who performed 200 or more isolatedCABG operations during 1994-1996, and/or (b)who performed at least one isolated CABGoperation in each of the years 1994-1996. Pleasenote that in previous years information was notsupplied for the second group. The CardiacAdvisory Committee has recommended that thisgroup be included in this year’s report in order toprovide more complete information to hospitals,surgeons and the public.
The results for surgeons not meeting the abovecriteria are grouped together and reported as“other cases” in the hospital in which the
11
1994-1996 HOSPITAL AND SURGEON DATA FOR CABG SURGERY
Table 3: Observed, Expected and Risk-Adjusted Hospital and Surgeon In-Hospital Mortality Rates for CABG Surgery, 1994-1996
No. of 95% CICases Deaths OMR EMR RAMR for RAMR
Albany Medical Center Hospital##Banker M 232 5 2.16 1.44 3.70 (1.19, 8.64)
#Bennett E 56 0 0.00 2.71 0.00 (0.00, 5.99)
#Britton L 473 5 1.06 1.70 1.54 (0.50, 3.60)
#Canavan T 600 5 0.83 1.75 1.18 (0.38, 2.76)
##Dal Col R 3 0 0.00 0.84 0.00 (0.00,100.0)
Ferraris V 229 9 3.93 2.76 3.54 (1.61, 6.72)
Foster E 276 4 1.45 2.37 1.51 (0.41, 3.88)
Kelley J 438 7 1.60 2.04 1.95 (0.78, 4.01)
Luber J 528 14 2.65 2.42 2.71 (1.48, 4.55)
##Miller S 458 3 0.66 2.25 0.72** (0.15, 2.11)
##Saifi J 2 0 0.00 3.24 0.00 (0.00,100.0)
All Others 171 1 0.58 1.30 1.12 (0.01, 6.22)
TOTAL 3466 53 1.53 2.04 1.86 ** (1.40, 2.44)
Arnot-Ogden Medical CenterBorja A 157 3 1.91 2.55 1.86 (0.37, 5.43)
Quintos E 260 8 3.08 2.36 3.23 (1.39, 6.37)
Vaughan J 153 2 1.31 2.65 1.22 (0.14, 4.41)
TOTAL 570 13 2.28 2.49 2.27 (1.21, 3.88)

Bellevue Hospital Center#Colvin S 46 8 17.39 2.86 15.08 * (6.50,29.72)
#Crawford B 1 0 0.00 5.21 0.00 (0.00,100.0)
#Galloway A 48 2 4.17 2.54 4.07 (0.46,14.70)
#Glassman L 114 4 3.51 2.04 4.27 (1.15,10.93)
#Grossi E 3 1 33.33 5.11 16.17 (0.21,89.95)
#Ribakove G 78 2 2.56 2.24 2.84 (0.32,10.26)
TOTAL 290 17 5.86 2.35 6.19 * (3.61, 9.92)
Beth Israel Medical CenterHoffman D 147 1 0.68 1.72 0.98 (0.01, 5.45)
#Stelzer P 101 1 0.99 2.80 0.88 (0.01, 4.87)
Tranbaugh R 772 17 2.20 2.66 2.05 (1.20, 3.29)
All Others 33 0 0.00 2.00 0.00 (0.00,13.78)
TOTAL 1053 19 1.80 2.52 1.78 (1.07, 2.77)
Buffalo General HospitalBergsland J 498 13 2.61 2.71 2.39 (1.27, 4.09)
Bhayana J 318 7 2.20 2.38 2.29 (0.92, 4.73)
Grosner G 723 10 1.38 2.31 1.49 (0.71, 2.73)
Lajos T 494 19 3.85 2.22 4.29 * (2.58, 6.71)
Levinsky L 247 0 0.00 2.19 0.00 ** (0.00, 1.68)
Lewin A 643 14 2.18 1.94 2.79 (1.52, 4.68)
Raza S 493 21 4.26 2.27 4.66 * (2.88, 7.12)
Salerno T 214 9 4.21 2.94 3.54 (1.62, 6.73)
All Others 1 0 0.00 3.30 0.00 (0.00,100.0)
TOTAL 3631 93 2.56 2.32 2.74 (2.21, 3.36)
Ellis Hospital##Banker M 1 0 0.00 0.92 0.00 (0.00,100.0)
#Britton L 2 0 0.00 0.95 0.00 (0.00,100.0)
#Canavan T 2 0 0.00 1.36 0.00 (0.00,100.0)
##Dal Col R 3 0 0.00 1.66 0.00 (0.00,100.0)
Depan H 444 7 1.58 2.11 1.85 (0.74, 3.82)
#McIlduff J 411 4 0.97 1.90 1.27 (0.34, 3.26)
##Miller S 1 0 0.00 0.88 0.00 (0.00,100.0)
#Older T 31 1 3.23 2.33 3.44 (0.04,19.13)
##Saifi J 526 10 1.90 1.64 2.87 (1.37, 5.28)
All Others 36 0 0.00 1.24 0.00 (0.00,20.42)
TOTAL 1457 22 1.51 1.86 2.01 (1.26, 3.05)
Erie County Medical Center#Bell-Thomson J 636 8 1.26 1.74 1.79 (0.77, 3.53)
#Jennings L 2 0 0.00 5.26 0.00 (0.00,86.40)
TOTAL 638 8 1.25 1.75 1.78 (0.76, 3.50)
No. 95% CICases of Deaths OMR EMR RAMR for RAMR
Table 3 continued
12

Lenox Hill Hospital##Geller C 88 6 6.82 1.54 10.96 * (4.00,23.86)
#Jacobowitz I 255 5 1.96 2.97 1.64 (0.53, 3.82)
McCabe J 189 4 2.12 2.11 2.49 (0.67, 6.38)
#Sabado M 31 1 3.23 2.60 3.08 (0.04,17.13)
#Stelzer P 353 11 3.12 2.38 3.24 (1.62, 5.80)
Subramanian V 1285 52 4.05 2.68 3.75 * (2.80, 4.92)
All Others 7 2 28.57 1.35 52.44 * (5.89,100.0)
TOTAL 2208 81 3.67 2.56 3.55 * (2.82, 4.41)
Long Island Jewish Medical CenterGraver L 562 12 2.14 2.07 2.56 (1.32, 4.47)
#Kerr P 15 2 13.33 4.93 6.71 (0.75,24.23)
Palazzo R 454 8 1.76 2.18 2.01 (0.86, 3.95)
All Others 179 2 1.12 1.91 1.45 (0.16, 5.23)
TOTAL 1210 24 1.98 2.12 2.32 (1.48, 3.45)
Maimonides Medical Center#Acinapura A 272 10 3.68 2.44 3.74 (1.79, 6.88)
#Burack J 3 0 0.00 3.16 0.00 (0.00,96.09)
Cane J 19 1 5.26 3.40 3.84 (0.05,21.38)
#Cunningham J N 370 16 4.32 2.42 4.43 * (2.53, 7.19)
#Jacobowitz I 1133 33 2.91 3.18 2.27 (1.56, 3.19)
#Ketosugbo A 110 5 4.55 2.67 4.23 (1.36, 9.87)
#Sabado M 355 18 5.07 3.50 3.59 (2.13, 5.67)
#Zisbrod Z 91 2 2.20 2.75 1.99 (0.22, 7.17)
All Others 151 1 0.66 3.36 0.49 (0.01, 2.72)
TOTAL 2504 86 3.43 3.01 2.83 (2.26, 3.50)
Millard Fillmore HospitalAldridge J 542 15 2.77 2.21 3.10 (1.73, 5.12)
#Bell-Thomson J 49 1 2.04 2.64 1.92 (0.03,10.67)
Guarino R 506 19 3.75 1.80 5.18 * (3.12, 8.09)
#Jennings L 591 19 3.21 2.18 3.65 (2.20, 5.70)
#Kerr P 272 18 6.62 2.38 6.90 * (4.08,10.90)
Major W 202 2 0.99 2.18 1.13 (0.13, 4.08)
All Others 78 1 1.28 2.00 1.59 (0.02, 8.85)
TOTAL 2240 75 3.35 2.13 3.90 * (3.07, 4.89)
No. 95% CICases of Deaths OMR EMR RAMR for RAMR
13
Table 3 continued

Montefiore Medical Center - Moses DivisionAttai L 394 12 3.05 1.87 4.05 (2.09, 7.07)
Brodman R 308 6 1.95 1.42 3.41 (1.25, 7.43)
#Camacho M 148 10 6.76 1.81 9.26 * (4.43,17.03)
#Frymus M 2 0 0.00 0.84 0.00 (0.00,100.0)
##Geller C 21 0 0.00 0.85 0.00 (0.00,51.02)
##Gold J 23 0 0.00 1.77 0.00 (0.00,22.38)
Merav A 274 7 2.55 2.04 3.10 (1.24, 6.40)
All Others 11 1 9.09 1.88 11.99 (0.16,66.70)
TOTAL 1181 36 3.05 1.76 4.29 * (3.01, 5.95)
Montefiore Medical Center - Weiler Division#Camacho M 2 0 0.00 0.77 0.00 (0.00,100.0)
Frater R 91 2 2.20 1.47 3.71 (0.42,13.40)
#Frymus M 410 7 1.71 2.16 1.96 (0.78, 4.03)
##Geller C 43 1 2.33 2.27 2.54 (0.03,14.12)
##Gold J 4 0 0.00 1.01 0.00 (0.00,100.0)
Sisto D 373 15 4.02 3.02 3.31 (1.85, 5.46)
TOTAL 923 25 2.71 2.44 2.76 (1.78, 4.07)
Mount Sinai HospitalErgin M 528 8 1.52 2.89 1.30 (0.56, 2.57)
Galla J 333 16 4.80 4.06 2.94 (1.68, 4.77)
Griepp R 87 3 3.45 2.03 4.21 (0.85,12.31)
Lansman S 441 21 4.76 3.59 3.29 (2.03, 5.03)
All Others 129 3 2.33 3.55 1.62 (0.33, 4.74)
TOTAL 1518 51 3.36 3.36 2.48 (1.85, 3.27)
New York Hospital - Cornell#Altorki N 149 6 4.03 2.33 4.28 (1.56, 9.32)
##Gold J 178 3 1.69 2.48 1.69 (0.34, 4.92)
Isom O 276 6 2.17 1.99 2.71 (0.99, 5.90)
Krieger K 774 15 1.94 2.54 1.89 (1.06, 3.12)
#Lang S 706 19 2.69 2.94 2.27 (1.37, 3.55)
#Rosengart T 550 12 2.18 3.35 1.61 (0.83, 2.82)
All Others 37 2 5.41 5.32 2.52 (0.28, 9.10)
TOTAL 2670 63 2.36 2.78 2.11 (1.62, 2.69)
New York Hospital - Queens#Altorki N 1 0 0.00 1.60 0.00 (0.00,100.0)
#Lang S 70 0 0.00 1.48 0.00 (0.00, 8.75)
#Rosengart T 3 0 0.00 1.32 0.00 (0.00,100.0)
All Others 20 1 5.00 1.46 8.51 (0.11,47.35)
TOTAL 94 1 1.06 1.47 1.79 (0.02, 9.95)
No. 95% CICases of Deaths OMR EMR RAMR for RAMR
14
Table 3 continued

NYU Hospitals Center#Colvin S 253 12 4.74 3.84 3.06 (1.58, 5.35)
#Crawford B 95 2 2.11 2.83 1.84 (0.21, 6.65)
Culliford A 401 3 0.75 2.64 0.70 ** (0.14, 2.05)
Esposito R 294 6 2.04 3.52 1.44 (0.52, 3.13)
#Galloway A 231 6 2.60 2.80 2.30 (0.84, 5.01)
#Glassman L 63 2 3.17 3.78 2.09 (0.23, 7.53)
#Grossi E 180 8 4.44 3.49 3.16 (1.36, 6.22)
#Ribakove G 179 11 6.15 4.41 3.45 (1.72, 6.18)
Spencer F 163 11 6.75 3.59 4.66 (2.33, 8.35)
TOTAL 1859 61 3.28 3.35 2.43 (1.86, 3.12)
North Shore University HospitalHall M 796 9 1.13 2.53 1.11 ** (0.51, 2.11)
Nelson R 125 1 0.80 2.19 0.91 (0.01, 5.05)
Pogo G 547 12 2.19 2.11 2.57 (1.33, 4.50)
Tortolani A 579 12 2.07 2.29 2.24 (1.16, 3.91)
All Others 35 0 0.00 2.11 0.00 (0.00,12.35)
TOTAL 2082 34 1.63 2.33 1.74 ** (1.21, 2.43)
Presbyterian Hospital - City of New YorkBregman D 67 1 1.49 2.14 1.73 (0.02, 9.63)
Michler R 282 8 2.84 2.91 2.42 (1.04, 4.76)
Oz M 424 13 3.07 2.88 2.64 (1.40, 4.51)
Rose E 406 5 1.23 1.67 1.83 (0.59, 4.26)
Smith C 654 10 1.53 2.57 1.48 (0.71, 2.71)
Spotnitz H 19 3 15.79 1.72 22.83 * (4.59,66.71)
All Others 21 1 4.76 1.50 7.88 (0.10,43.82)
TOTAL 1873 41 2.19 2.46 2.21 (1.58, 2.99)
Rochester General HospitalCheeran D 847 26 3.07 2.22 3.42 (2.24, 5.02)
Kirshner R 863 29 3.36 3.55 2.35 (1.57, 3.37)
Knight P 969 25 2.58 2.80 2.28 (1.48, 3.37)
Kwan S 306 14 4.58 3.48 3.26 (1.78, 5.47)
All Others 81 3 3.70 3.15 2.92 (0.59, 8.53)
TOTAL 3066 97 3.16 2.93 2.68 (2.17, 3.27)
15
No. 95% CICases of Deaths OMR EMR RAMR for RAMR
Table 3 continued

St. Francis HospitalBercow N 824 15 1.82 2.21 2.04 (1.14, 3.36)
Damus P 644 6 0.93 1.91 1.21 (0.44, 2.64)
Durban L 409 7 1.71 3.53 1.20 ** (0.48, 2.48)
Lamendola C 591 8 1.35 2.63 1.27 (0.55, 2.51)
Robinson N 919 16 1.74 2.15 2.01 (1.15, 3.26)
Taylor J 1079 17 1.58 2.51 1.56 (0.91, 2.49)
Weisz D 696 20 2.87 2.68 2.66 (1.63, 4.11)
All Others 31 0 0.00 2.01 0.00 (0.00,14.61)
TOTAL 5193 89 1.71 2.44 1.74 ** (1.40, 2.15)
St. Joseph’s Hospital Health CenterMarvasti M 490 1 0.20 1.79 0.28 ** (0.00, 1.57)
Nast E 621 10 1.61 2.30 1.73 (0.83, 3.19)
Nazem A 639 7 1.10 2.75 0.99 ** (0.40, 2.04)
Rosenberg J 584 3 0.51 1.85 0.69 ** (0.14, 2.02)
TOTAL 2334 21 0.90 2.20 1.01 ** (0.63, 1.55)
St. Luke’s Roosevelt Hospital - St. Lukes Div.Anagnostopoulos C 234 13 5.56 2.37 5.81 * (3.09, 9.93)
Aronis M 545 11 2.02 1.75 2.86 (1.43, 5.12)
Connery C 71 3 4.23 2.12 4.94 (0.99,14.43)
Mindich B 127 4 3.15 1.80 4.33 (1.17,11.09)
Swistel D 422 13 3.08 3.09 2.47 (1.31, 4.22)
TOTAL 1399 44 3.15 2.28 3.42 * (2.48, 4.59)
St. Peter’s Hospital##Banker M 279 3 1.08 2.50 1.07 (0.21, 3.12)
#Bennett E 570 10 1.75 2.05 2.12 (1.01, 3.90)
##Dal Col R 610 6 0.98 1.94 1.26 (0.46, 2.74)
#McIlduff J 14 1 7.14 2.06 8.58 (0.11,47.75)
##Miller S 44 1 2.27 2.79 2.02 (0.03,11.25)
#Older T 234 9 3.85 2.51 3.79 (1.73, 7.20)
##Saifi J 1 0 0.00 16.35 0.00 (0.00,55.64)
All Others 229 4 1.75 2.13 2.03 (0.55, 5.20)
TOTAL 1981 34 1.72 2.17 1.97 (1.36, 2.75)
St. Vincent’s Hospital and Medical Center#Acinapura A 59 3 5.08 1.28 9.88 (1.99,28.86)
Galdieri R 498 26 5.22 2.59 5.00 * (3.26, 7.32)
McGinn J 558 9 1.61 3.66 1.09 ** (0.50, 2.08)
Tyras D 541 18 3.33 2.14 3.85 (2.28, 6.08)
TOTAL 1656 56 3.38 2.76 3.04 (2.30, 3.95)
16
No. 95% CICases of Deaths OMR EMR RAMR for RAMR
Table 3 continued

Strong Memorial HospitalHicks G 631 17 2.69 2.79 2.39 (1.39, 3.83)
Risher W 641 21 3.28 2.19 3.72 (2.30, 5.68)
All Others 6 1 16.67 4.30 9.61 (0.13,53.48)
TOTAL 1278 39 3.05 2.49 3.03 (2.16, 4.15)
United Health Services - Wilson DivisionCunningham J R 393 7 1.78 2.50 1.77 (0.71, 3.64)
Wong K 383 10 2.61 2.51 2.59 (1.24, 4.75)
Yousuf M 397 11 2.77 3.07 2.24 (1.12, 4.01)
TOTAL 1173 28 2.39 2.69 2.20 (1.46, 3.18)
University Hospital of BrooklynAnderson J 153 5 3.27 2.64 3.07 (0.99, 7.15)
#Burack J 153 6 3.92 2.88 3.37 (1.23, 7.34)
#Cunningham J N 11 0 0.00 2.90 0.00 (0.00,28.53)
#Ketosugbo A 3 0 0.00 6.15 0.00 (0.00,49.28)
Piccone V 37 1 2.70 2.70 2.48 (0.03,13.81)
#Zisbrod Z 340 10 2.94 2.67 2.73 (1.31, 5.02)
All Others 12 1 8.33 3.64 5.68 (0.07,31.59)
TOTAL 709 23 3.24 2.75 2.93 (1.86, 4.39)
University Hospital (Stony Brook)Bilfinger T 370 11 2.97 3.55 2.08 (1.04, 3.72)
#Hartman A 431 4 0.93 2.21 1.04 (0.28, 2.66)
Levy M 373 8 2.14 2.56 2.08 (0.90, 4.10)
Seifert F 283 9 3.18 2.31 3.42 (1.56, 6.49)
TOTAL 1457 32 2.20 2.66 2.05 (1.40, 2.89)
University Hospital Upstate Medical CenterBrandt B 187 8 4.28 1.91 5.57 (2.40,10.97)
Parker F 308 5 1.62 1.67 2.41 (0.78, 5.63)
Picone A 311 8 2.57 1.86 3.43 (1.48, 6.76)
Ryan P 342 8 2.34 1.73 3.36 (1.45, 6.62)
All Others 156 4 2.56 2.05 3.11 (0.84, 7.95)
TOTAL 1304 33 2.53 1.81 3.47 (2.39, 4.87)
Westchester County Medical CenterAxelrod H 345 13 3.77 3.24 2.88 (1.53, 4.93)
Fleisher A 493 10 2.03 2.09 2.40 (1.15, 4.42)
Lafaro R 412 18 4.37 2.11 5.14 * (3.05, 8.13)
Moggio R 413 5 1.21 2.53 1.19 (0.38, 2.77)
Pooley R 353 19 5.38 2.50 5.33 * (3.21, 8.32)
Sarabu M 427 4 0.94 2.83 0.82 ** (0.22, 2.10)
All Others 13 1 7.69 2.11 9.06 (0.12,50.38)
TOTAL 2456 70 2.85 2.52 2.81 (2.19, 3.55)
17
No. 95% CICases of Deaths OMR EMR RAMR for RAMR
Table 3 continued

Winthrop - University Hospital#Hartman A 153 2 1.31 2.99 1.08 (0.12, 3.91)
Kofsky E 421 8 1.90 2.18 2.17 (0.93, 4.27)
Mohtashemi M 250 7 2.80 2.75 2.53 (1.01, 5.21)
Schubach S 505 13 2.57 2.77 2.30 (1.22, 3.94)
Scott W 297 5 1.68 2.56 1.63 (0.53, 3.80)
Sutaria M 107 8 7.48 6.22 2.98 (1.28, 5.88)
Williams L 118 7 5.93 3.40 4.33 (1.73, 8.91)
All Others 88 5 5.68 3.43 4.11 (1.32, 9.58)
TOTAL 1939 55 2.84 2.88 2.44 (1.84, 3.18)
Statewide Total 57412 1424 2.48
* Risk-adjusted mortality rate is significantly higher than statewide rate.
** Risk-adjusted mortality rate is significantly lower than statewide rate.
# Performed operations in another New York State hospital
## Performed operations in two or more other New York State hospitals
OMR - the observed mortality rate is the number of observed deaths divided by the number of patients.
EMR - the expected mortality rate is the sum of the predicted probabilities of death for each patient divided by the total number of patients.
RAMR - the risk-adjusted mortality rate is the best estimate, based on the statistical model, of what the provider’s mortality rate would have been if theprovider had a mix of patients identical to the statewide mix. It is computed as the quotient of the OMR and the EMR (OMR/EMR) multiplied by the statewidemortality rate for the time period.
18
No. 95% CICases of Deaths OMR EMR RAMR for RAMR
Table 3 continued

Table 4: Summary Information for Surgeons Practicing at More than One Hospital, 1994-1996
No. of 95% CICases Deaths OMR EMR RAMR for RAMR
Acinapura AMaimonides 272 10 3.68 2.44 3.74 (1.79, 6.88)
St. Vincent’s 59 3 5.08 1.28 9.88 (1.99, 28.86)
Total 331 13 3.93 2.23 4.37 (2.32, 7.47)
Altorki NNew York Hospital-Cornell 149 6 4.03 2.33 4.28 (1.56, 9.32)
New York Hospital-Queens 1 0 0.00 1.60 0.00 (0.00, 100.00)
Total 150 6 4.00 2.33 4.26 (1.56, 9.28)
Banker MAlbany Med Ctr 232 5 2.16 1.44 3.70 (1.19, 8.64)
Ellis Hospital 1 0 0.00 0.92 0.00 (0.00, 100.00)
St. Peter’s 279 3 1.08 2.50 1.07 (0.21, 3.12)
Total 512 8 1.56 2.02 1.92 (0.83, 3.79)
Bell-Thomson JErie County 636 8 1.26 1.74 1.79 (0.77, 3.53)
Millard Fillmore 49 1 2.04 2.64 1.92 (0.03, 10.67)
Total 685 9 1.31 1.80 1.81 (0.82, 3.43)
Bennett EAlbany Med Ctr 56 0 0.00 2.71 0.00 (0.00, 5.99)
St. Peter’s 570 10 1.75 2.05 2.12 (1.01, 3.90)
Total 626 10 1.60 2.11 1.88 (0.90, 3.45)
Britton LAlbany Med Ctr 473 5 1.06 1.70 1.54 (0.50, 3.60)
Ellis Hospital 2 0 0.00 0.95 0.00 (0.00, 100.00)
Total 475 5 1.05 1.70 1.54 (0.50, 3.59)
Burack JMaimonides 3 0 0.00 3.16 0.00 (0.00, 96.09)
Univ Hosp - Brooklyn 153 6 3.92 2.88 3.37 (1.23, 7.34)
Total 156 6 3.85 2.89 3.30 (1.21, 7.19)
Camacho MMontefiore-Moses 148 10 6.76 1.81 9.26* (4.43, 17.03)
Montefiore-Weiler 2 0 0.00 0.77 0.00 (0.00, 100.00)
Total 150 10 6.67 1.80 9.21* (4.41, 16.94)
Canavan TAlbany Med Ctr 600 5 0.83 1.75 1.18 (0.38, 2.76)
Ellis Hospital 2 0 0.00 1.36 0.00 (0.00, 100.00)
Total 602 5 0.83 1.74 1.18 (0.38, 2.76)
19

Colvin SBellevue 46 8 17.39 2.86 15.08* (6.50, 29.72)
NYU Hosp Ctr 253 12 4.74 3.84 3.06 (1.58, 5.35)
Total 299 20 6.69 3.69 4.49* (2.74, 6.94)
Crawford BBellevue 1 0 0.00 5.21 0.00 (0.00, 100.00)
NYU Hosp Ctr 95 2 2.11 2.83 1.84 (0.21, 6.65)
Total 96 2 2.08 2.86 1.81 (0.20, 6.53)
Cunningham J NMaimonides 370 16 4.32 2.42 4.43* (2.53, 7.19)
Univ Hosp - Brooklyn 11 0 0.00 2.90 0.00 (0.00, 28.53)
Total 381 16 4.20 2.44 4.27 (2.44, 6.94)
Dal Col RAlbany Med Ctr 3 0 0.00 0.84 0.00 (0.00, 100.00)
Ellis Hospital 3 0 0.00 1.66 0.00 (0.00, 100.00)
St. Peter’s 610 6 0.98 1.94 1.26 (0.46, 2.74)
Total 616 6 0.97 1.93 1.25 (0.46, 2.73)
Frymus MMontefiore-Moses 2 0 0.00 0.84 0.00 (0.00, 100.00)
Montefiore-Weiler 410 7 1.71 2.16 1.96 (0.78, 4.03)
Total 412 7 1.70 2.16 1.95 (0.78, 4.02)
Galloway ABellevue 48 2 4.17 2.54 4.07 (0.46, 14.70)
NYU Hosp Ctr 231 6 2.60 2.80 2.30 (0.84, 5.01)
Total 279 8 2.87 2.76 2.58 (1.11, 5.09)
Geller CLenox Hill 88 6 6.82 1.54 10.96* (4.00, 23.86)
Montefiore-Moses 21 0 0.00 0.85 0.00 (0.00, 51.02)
Montefiore-Weiler 43 1 2.33 2.27 2.54 (0.03, 14.12)
Total 152 7 4.61 1.65 6.91* (2.77, 14.23)
Glassman LBellevue 114 4 3.51 2.04 4.27 (1.15, 10.93)
NYU Hosp Ctr 63 2 3.17 3.78 2.09 (0.23, 7.53)
Total 177 6 3.39 2.66 3.16 (1.16, 6.89)
Gold JMontefiore-Moses 23 0 0.00 1.77 0.00 (0.00, 22.38)
Montefiore-Weiler 4 0 0.00 1.01 0.00 (0.00, 100.00)
New York Hospital-Cornell 178 3 1.69 2.48 1.69 (0.34, 4.92)
Total 205 3 1.46 2.37 1.53 (0.31, 4.47)
No. of 95% CICases Deaths OMR EMR RAMR for RAMR
20
Table 4 continued

Grossi EBellevue 3 1 33.33 5.11 16.17 (0.21, 89.95)
NYU Hosp Ctr 180 8 4.44 3.49 3.16 (1.36, 6.22)
Total 183 9 4.92 3.52 3.47 (1.58, 6.58)
Hartman AUniv Hosp - Stony Brook 431 4 0.93 2.21 1.04 (0.28, 2.66)
Winthrop Univ Hosp 153 2 1.31 2.99 1.08 (0.12, 3.91)
Total 584 6 1.03 2.42 1.05 ** (0.39, 2.30)
Jacobowitz ILenox Hill 255 5 1.96 2.97 1.64 (0.53, 3.82)
Maimonides 1133 33 2.91 3.18 2.27 (1.56, 3.19)
Total 1388 38 2.74 3.14 2.16 (1.53, 2.96)
Jennings LErie County 2 0 0.00 5.26 0.00 (0.00, 86.40)
Millard Fillmore 591 19 3.21 2.18 3.65 (2.20, 5.70)
Total 593 19 3.20 2.19 3.62 (2.18, 5.66)
Kerr PLIJ Medical Center 15 2 13.33 4.93 6.71 (0.75, 24.23)
Millard Fillmore 272 18 6.62 2.38 6.90 * (4.08, 10.90)
Total 287 20 6.97 2.51 6.88 * (4.20, 10.62)
Ketosugbo AMaimonides 110 5 4.55 2.67 4.23 (1.36, 9.87)
Univ Hosp - Brooklyn 3 0 0.00 6.15 0.00 (0.00, 49.28)
Total 113 5 4.42 2.76 3.98 (1.28, 9.28)
Lang SNew York Hospital-Cornell 706 19 2.69 2.94 2.27 (1.37, 3.55)
New York Hospital-Queens 70 0 0.00 1.48 0.00 (0.00, 8.75)
Total 776 19 2.45 2.81 2.16 (1.30, 3.38)
McIlduff JEllis Hospital 411 4 0.97 1.90 1.27 (0.34, 3.26)
St.Peter’s 14 1 7.14 2.06 8.58 (0.11, 47.75)
Total 425 5 1.18 1.90 1.53 (0.49, 3.58)
Miller SAlbany Med Ctr 458 3 0.66 2.25 0.72 ** (0.15, 2.11)
Ellis Hospital 1 0 0.00 0.88 0.00 (0.00, 100.00)
St. Peter’s 44 1 2.27 2.79 2.02 (0.03, 11.25)
Total 503 4 0.80 2.30 0.86 ** (0.23, 2.20)
No. of 95% CICases Deaths OMR EMR RAMR for RAMR
Table 4 continued
21

Older TEllis Hospital 31 1 3.23 2.33 3.44 (0.04, 19.13)
St. Peter’s 234 9 3.85 2.51 3.79 (1.73, 7.20)
Total 265 10 3.77 2.49 3.76 (1.80, 6.91)
Ribakove GBellevue 78 2 2.56 2.24 2.84 (0.32, 10.26)
NYU Hosp Ctr 179 11 6.15 4.41 3.45 (1.72, 6.18)
Total 257 13 5.06 3.75 3.34 (1.78, 5.72)
Rosengart TNew York Hospital-Cornell 550 12 2.18 3.35 1.61 (0.83, 2.82)
New York Hospital-Queens 3 0 0.00 1.32 0.00 (0.00, 100.00)
Total 553 12 2.17 3.34 1.61 (0.83, 2.81)
Sabado MLenox Hill 31 1 3.23 2.60 3.08 (0.04, 17.13)
Maimonides 355 18 5.07 3.50 3.59 (2.13, 5.67)
Total 386 19 4.92 3.43 3.56 (2.14, 5.56)
Saifi JAlbany Med Ctr 2 0 0.00 3.24 0.00 (0.00, 100.00)
Ellis Hospital 526 10 1.90 1.64 2.87 (1.37, 5.28)
St. Peter’s 1 0 0.00 16.35 0.00 (0.00, 55.64)
Total 529 10 1.89 1.68 2.80 (1.34, 5.14)
Stelzer PBeth Israel 101 1 0.99 2.80 0.88 (0.01, 4.87)
Lenox Hill 353 11 3.12 2.38 3.24 (1.62, 5.80)
Total 454 12 2.64 2.48 2.65 (1.37, 4.62)
Zisbrod ZMaimonides 91 2 2.20 2.75 1.99 (0.22, 7.17)
Univ Hosp-Brooklyn 340 10 2.94 2.67 2.73 (1.31, 5.02)
Total 431 12 2.78 2.69 2.57 (1.33, 4.49)
No. of 95% CICases Deaths OMR EMR RAMR for RAMR
Table 4 continued
* Risk-adjusted rate is significantly higher than statewide rate.
** Risk-adjusted rate is significantly lower than statewide rate.
OMR - the observed mortality rate is the number of observed deaths divided by the number of patients.
EMR - the expected mortality rate is the sum of the predicted probability of death for each patient divided by the total number of patients.
RAMR - the risk-adjusted mortality rate is the best estimate, based on the statistical model, of what the provider’s mortality rate would have been if theprovider had a mix of patients identical to the statewide mix.
22

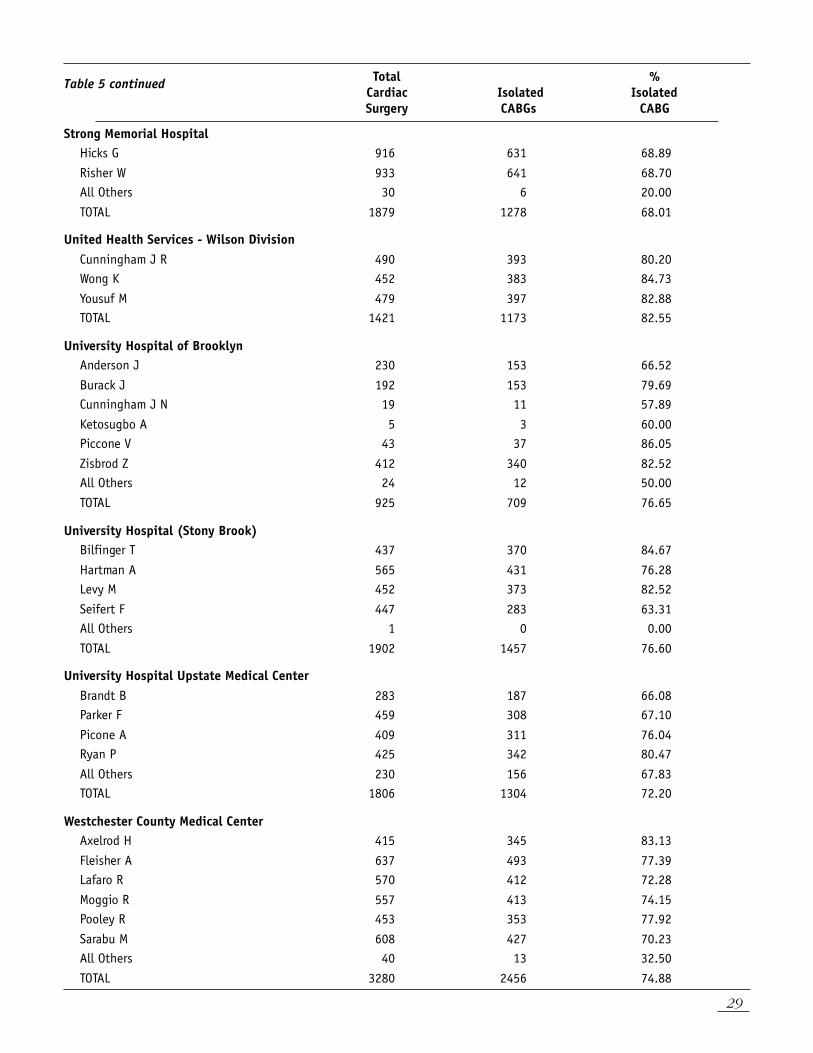
SURGEON AND HOSPITAL VOLUMES FOR ADULT CARDIAC SURGERY AND FOR ISOLATEDCABG SURGERY (1994-1996)Table 5 presents, for each hospital and for eachsurgeon performing at least 200 isolated CABGoperations at that hospital in 1994-1996 and/orperforming one or more isolated CABGoperations in each of the years 1994- 1996,the total number of adult cardiac surgeriesperformed, the total number of isolated CABGoperations performed and the percentage of alladult cardiac surgeries that were isolated CABGoperations. As in Table 3, results for surgeonsnot meeting the above criteria are groupedtogether in an “All Others” category.
Isolated CABG volumes include patients whoundergo bypass of one or more of the coronary
arteries with no other major heart surgery duringthe same admission. Total adult cardiac surgerycases include isolated CABG, CABG combinedwith another cardiac procedure such as valverepair or replacement, single or multiple valvereplacements and any other surgery on the heartor great vessels.
As indicated, the statewide percentage of adultcardiac surgeries that were isolated CABGoperations in 1994-1996 was 73.92 percent(57,412 CABG operations out of a total of 77,668total adult cardiac surgeries).
Table 5: Total Cardiac Surgery and Isolated CABG Surgery Volumes by Hospital and Surgeon, 1994-1996
Total %Cardiac Isolated IsolatedSurgery CABGs CABG
Albany Medical Center HospitalBanker M 249 232 93.17
Bennett E 67 56 83.58
Britton L 653 473 72.43
Canavan T 681 600 88.11
Dal Col R 3 3 100.00
Ferraris V 321 229 71.34
Foster E 430 276 64.19
Kelley J 545 438 80.37
Luber J 763 528 69.20
Miller S 539 458 84.97
Saifi J 2 2 100.00
All Others 200 171 85.50
TOTAL 4453 3466 77.84
Arnot-Ogden Medical CenterBorja A 194 157 80.93
Quintos E 302 260 86.09
Vaughan J 173 153 88.44
TOTAL 669 570 85.20
23

Bellevue Hospital CenterColvin S 131 46 35.11
Crawford B 1 1 100.00
Galloway A 89 48 53.93
Glassman L 151 114 75.50
Grossi E 3 3 100.00
Ribakove G 144 78 54.17
TOTAL 519 290 55.88
Beth Israel Medical CenterHoffman D 169 147 86.98
Stelzer P 178 101 56.74
Tranbaugh R 1099 772 70.25
All Others 35 33 94.29
TOTAL 1481 1053 71.10
Buffalo General HospitalBergsland J 665 498 74.89
Bhayana J 631 318 50.40
Grosner G 802 723 90.15
Lajos T 578 494 85.47
Levinsky L 262 247 94.27
Lewin A 688 643 93.46
Raza S 657 493 75.04
Salerno T 244 214 87.70
All Others 14 1 7.14
TOTAL 4541 3631 79.96
Ellis HospitalBanker M 1 1 100.00
Britton L 3 2 66.67
Canavan T 2 2 100.00
Dal Col R 4 3 75.00
Depan H 614 444 72.31
McIlduff J 501 411 82.04
Miller S 1 1 100.00
Older T 46 31 67.39
Saifi J 616 526 85.39
All Others 44 36 81.82
TOTAL 1832 1457 79.53
Erie County Medical CenterBell-Thomson J 768 636 82.81
Jennings L 2 2 100.00
TOTAL 770 638 82.86
Total %Cardiac Isolated IsolatedSurgery CABGs CABG
24
Table 5 continued

Lenox Hill HospitalGeller C 103 88 85.44
Jacobowitz I 306 255 83.33
McCabe J 247 189 76.52
Sabado M 42 31 73.81
Stelzer P 607 353 58.15
Subramanian V 1541 1285 83.39
All Others 11 7 63.64
TOTAL 2857 2208 77.28
Long Island Jewish Medical CenterGraver L 801 562 70.16
Kerr P 18 15 83.33
Palazzo R 544 454 83.46
All Others 210 179 85.24
TOTAL 1573 1210 76.92
Maimonides Medical CenterAcinapura A 342 272 79.53
Burack J 4 3 75.00
Cane J 23 19 82.61
Cunningham J N 511 370 72.41
Jacobowitz I 1401 1133 80.87
Ketosugbo A 130 110 84.62
Sabado M 427 355 83.14
Zisbrod Z 107 91 85.05
All Others 178 151 84.83
TOTAL 3123 2504 80.18
Millard Fillmore HospitalAldridge J 627 542 86.44
Bell-Thomson J 69 49 71.01
Guarino R 559 506 90.52
Jennings L 670 591 88.21
Kerr P 313 272 86.90
Major W 222 202 90.99
All Others 89 78 87.64
TOTAL 2549 2240 87.88
Total %Cardiac Isolated IsolatedSurgery CABGs CABG
25
Table 5 continued

Montefiore Medical Center - Moses DivisionAttai L 539 394 73.10
Brodman R 452 308 68.14
Camacho M 200 148 74.00
Frymus M 3 2 66.67
Geller C 24 21 87.50
Gold J 31 23 74.19
Merav A 378 274 72.49
All Others 25 11 44.00
TOTAL 1652 1181 71.49
Montefiore Medical Center - Weiler DivisionCamacho M 2 2 100.00
Frater R 213 91 42.72
Frymus M 496 410 82.66
Geller C 45 43 95.56
Gold J 9 4 44.44
Sisto D 512 373 72.85
TOTAL 1277 923 72.28
Mount Sinai HospitalErgin M 836 528 63.16
Galla J 543 333 61.33
Griepp R 406 87 21.43
Lansman S 708 441 62.29
All Others 225 129 57.33
TOTAL 2718 1518 55.85
New York Hospital - CornellAltorki N 202 149 73.76
Gold J 314 178 56.69
Isom O 607 276 45.47
Krieger K 1091 774 70.94
Lang S 1027 706 68.74
Rosengart T 778 550 70.69
All Others 65 37 56.92
TOTAL 4084 2670 65.38
New York Hospital - QueensAltorki N 1 1 100.00
Lang S 81 70 86.42
Rosengart T 3 3 100.00
All Others 23 20 86.96
TOTAL 108 94 87.04
Total %Cardiac Isolated IsolatedSurgery CABGs CABG
26
Table 5 continued

NYU Hospitals CenterColvin S 621 253 40.74
Crawford B 116 95 81.90
Culliford A 720 401 55.69
Esposito R 451 294 65.19
Galloway A 447 231 51.68
Glassman L 77 63 81.82
Grossi E 294 180 61.22
Ribakove G 252 179 71.03
Spencer F 341 163 47.80
All Others 1 0 0.00
TOTAL 3320 1859 55.99
North Shore University HospitalHall M 1042 796 76.39
Nelson R 161 125 77.64
Pogo G 692 547 79.05
Tortolani A 683 579 84.77
All Others 66 35 53.03
TOTAL 2644 2082 78.74
Presbyterian Hospital - City of New YorkBregman D 96 67 69.79
Michler R 536 282 52.61
Oz M 773 424 54.85
Rose E 666 406 60.96
Smith C 1025 654 63.80
Spotnitz H 33 19 57.58
All Others 206 21 10.19
TOTAL 3335 1873 56.16
Rochester General HospitalCheeran D 1075 847 78.79
Kirshner R 1086 863 79.47
Knight P 1257 969 77.09
Kwan S 350 306 87.43
All Others 88 81 92.05
TOTAL 3856 3066 79.51
Total %Cardiac Isolated IsolatedSurgery CABGs CABG
27
Table 5 continued

Total %Cardiac Isolated IsolatedSurgery CABGs CABG
28
St. Francis HospitalBercow N 1042 824 79.08
Damus P 1203 644 53.53
Durban L 540 409 75.74
Lamendola C 750 591 78.80
Robinson N 1271 919 72.31
Taylor J 1410 1079 76.52
Weisz D 914 696 76.15
All Others 41 31 75.61
TOTAL 7171 5193 72.42
St. Joseph’s Hospital Health CenterMarvasti M 696 490 70.40
Nast E 709 621 87.59
Nazem A 733 639 87.18
Rosenberg J 856 584 68.22
TOTAL 2994 2334 77.96
St. Luke’s Roosevelt Hospital - St. Lukes Div.Anagnostopoulos C 391 234 59.85
Aronis M 649 545 83.98
Connery C 113 71 62.83
Mindich B 255 127 49.80
Swistel D 514 422 82.10
TOTAL 1922 1399 72.79
St. Peter’s HospitalBanker M 303 279 92.08
Bennett E 790 570 72.15
Dal Col R 717 610 85.08
McIlduff J 22 14 63.64
Miller S 54 44 81.48
Older T 312 234 75.00
Saifi J 1 1 100.00
All Others 262 229 87.40
TOTAL 2461 1981 80.50
St. Vincent’s Hospital and Medical CenterAcinapura A 69 59 85.51
Galdieri R 626 498 79.55
McGinn J 700 558 79.71
Tyras D 659 541 82.09
TOTAL 2054 1656 80.62
Table 5 continued
Strong Memorial HospitalHicks G 916 631 68.89
Risher W 933 641 68.70All Others 30 6 20.00
TOTAL 1879 1278 68.01
United Health Services - Wilson DivisionCunningham J R 490 393 80.20Wong K 452 383 84.73
Yousuf M 479 397 82.88TOTAL 1421 1173 82.55
University Hospital of BrooklynAnderson J 230 153 66.52
Burack J 192 153 79.69Cunningham J N 19 11 57.89
Ketosugbo A 5 3 60.00Piccone V 43 37 86.05
Zisbrod Z 412 340 82.52All Others 24 12 50.00
TOTAL 925 709 76.65
University Hospital (Stony Brook)Bilfinger T 437 370 84.67
Hartman A 565 431 76.28Levy M 452 373 82.52
Seifert F 447 283 63.31All Others 1 0 0.00
TOTAL 1902 1457 76.60
University Hospital Upstate Medical CenterBrandt B 283 187 66.08Parker F 459 308 67.10
Picone A 409 311 76.04Ryan P 425 342 80.47
All Others 230 156 67.83TOTAL 1806 1304 72.20
Westchester County Medical CenterAxelrod H 415 345 83.13
Fleisher A 637 493 77.39Lafaro R 570 412 72.28
Moggio R 557 413 74.15Pooley R 453 353 77.92
Sarabu M 608 427 70.23All Others 40 13 32.50
TOTAL 3280 2456 74.88
Table 5 continued
29
Total %Cardiac Isolated IsolatedSurgery CABGs CABG

Winthrop - University HospitalHartman A 228 153 67.11
Kofsky E 493 421 85.40
Mohtashemi M 287 250 87.11
Schubach S 701 505 72.04
Scott W 387 297 76.74
Sutaria M 142 107 75.35
Williams L 152 118 77.63
All Others 102 88 86.27
TOTAL 2492 1939 77.81
Statewide Total 77668 57412 73.92
Total %Cardiac Isolated IsolatedSurgery CABGs CABG
Table 5 continued
30

31
MEDICAL TERMINOLOGYangina pectoris - the pain or discomfort feltwhen blood and oxygen flow to the heart areimpeded by blockage in the coronary arteries.Can also be caused by an arterial spasm.
angioplasty, also known as percutaneoustransluminal coronary angioplasty (PTCA). In thisprocedure, a balloon catheter is threaded up tothe site of blockage in an artery in the heart, andis then inflated to push arterial plaque against thewall of the artery to create a wider channel in theartery.
arteriosclerosis - the group of diseasescharacterized by thickening and loss of elasticityof the arterial walls, popularly called “hardeningof the arteries.” Also called atheroscleroticcoronary artery disease or coronary arterydisease.
atherosclerosis - one form of arteriosclerosis inwhich plaques or fatty deposits form in the innerlayer of the arteries.
coronary artery bypass graft surery (CABG) isa procedure in which a vein or artery fromanother part of the body is used to create analternate path for blood to flow to the heart,bypassing the arterial blockage. Typically, asection of one of the large saphenous veins in theleg, the radial artery in the arm or the mammaryartery in the chest is used to construct the bypass.One or more bypasses may be performed duringa single operation. When no other major heartsurgery (such as valve replacement) is included,the operation is referred to as an isolated CABG.
double, triple, quadruple bypass - the averagenumber of bypass grafts created during coronaryartery bypass graft surgery is three or four.Generally, all significantly blocked arteries arebypassed unless they enter areas of the heart thatare permanently damaged by previous heartattacks. Five or more bypasses are occasionallycreated. Multiple bypasses are often performed toprovide several alternate routes for the bloodflow and to improve the long-term success of theprocedure, not necessarily because the patient’scondition is more severe.
cardiac catheterization - also known ascoronary angiography - a procedure fordiagnosing the condition of the heart and thearteries connecting to it. A thin tube threadedthrough an artery to the heart releases a dye,which allows doctors to observe blockages withan X-ray camera. This procedure is requiredbefore coronary bypass surgery.
cardiovascular disease - disease of the heartand blood vessels, the most common form iscoronary artery disease.
coronary arteries - the arteries that supply theheart muscle with blood. When they arenarrowed or blocked, blood and oxygen cannotflow freely to the heart muscle or myocardium.
ischemic heart disease (ischemia) - heartdisease that occurs as a result of inadequateblood supply to the heart muscle or myocardium.
myocardial infarction - partial destruction ofthe heart muscle due to interrupted blood supply,also called a heart attack or coronary thrombosis.
plaque - also called atheroma, this is the fattydeposit in the coronary artery that can blockblood flow.
risk factors for heart disease - certain riskfactors have been found to increase thelikelihood of developing heart disease. Some arecontrollable or avoidable, and some cannot becontrolled. The biggest heart disease risk factorsare heredity, gender and age; none of thesewhich can be controlled. Men are much morelikely to develop heart disease than womenbefore the age of 55, although it is the numberone killer of both men and women. The riskincreases with age, so that half of all cases are inthose who are more than 75 years old.
Some controllable risk factors that contribute to ahigher likelihood of developing coronary arterydisease are high cholesterol levels, cigarettesmoking, high blood pressure (hypertension),obesity, a sedentary lifestyle or lack of exercise,diabetes and stress or Type A personalitycharacteristics.
stenosis - the narrowing of an artery due toblockage. Restenosis is when the narrowingrecurs after surgery.

32
Albany Medical Center HospitalNew Scotland AvenueAlbany, New York 12208
Arnot Ogden Medical Center600 Roe AvenueElmira, New York 14905
Bellevue Hospital CenterFirst Avenue and 27th StreetNew York, New York 10016
Beth Israel Medical Center10 Nathan D. Perlman PlaceNew York, New York 10003
Buffalo General Hospital100 High StreetBuffalo, New York 14203
Ellis Hospital1101 Nott StreetSchenectady, New York
Erie County Medical Center462 Grider StreetBuffalo, New York 14215
Lenox Hill Hospital100 East 77th StreetNew York, New York 10021
Long Island Jewish Medical Center270-05 76th AvenueNew Hyde Park, New York 11040
Maimonides Medical Center4802 Tenth AvenueBrooklyn, New York 11219
Millard Fillmore Hospital3 Gates CircleBuffalo, New York 14209
Montefiore Medical CenterHenry & Lucy Moses Division111 East 210th StreetBronx, New York 11219
Montefiore Medical Center-Weiler Division1825 Eastchester RoadBronx, New York 10461
Mount Sinai Medical CenterOne Gustave L. Levy PlaceNew York, New York 10019
New York Hospital-Cornell Medical Center525 East 68th StreetNew York, New York 10021
NYU Hospitals Center550 First AvenueNew York, New York 10016
NEW YORK STATE CARDIAC SURGERY CENTERSNew York Hospital Medical Center-Queens56-45 Main StreetFlushing, New York 11355(beginning 1996)
Presbyterian Hospital - Atchley Pavillion161 Fort Washington AvenueNew York, New York 10032
North Shore University Hospital300 Community DriveManhasset, New York 11030
St. Francis HospitalPort Washington BoulevardRoslyn New York 11576
Rochester General Hospital1425 Portland AvenueRochester, New York 14621-3079
St. Luke’s Roosevelt Hospital Center11-11 Amsterdam Avenue at 114th StreetNew York, New York 10025
St. Joseph’s Hospital Health Center301 Prospect AvenueSyracuse, New York 13203
St. Vincent’s Hospital & Medical Center of NY153 West 11th StreetNew York, New York 10011
St. Peter’s Hospital315 South Manning BoulevardAlbany, New York 12208
United Health ServicesWilson Hospital Division33-57 Harrison StreetJohnson City, New York 13790
Strong Memorial Hospital601 Elmwood AvenueRochester, New York 14642
University Hospital - Stony BrookSUNY Health Science Center at Stony BrookStony Brook, New York 11794-8410
University Hospital of Brooklyn450 Lenox RoadBrooklyn, New York 11203
Westchester County Medical CenterGrasslands ReservationValhalla, New York 10595
University Hospital Upstate Medical Center750 East Adams StreetSyracuse, New York 13210
Winthrop University Hospital259 First StreetMineola, New York 11501

Additional copies of this report may be obtained through theDepartment of Health web site at http://www.health.state.ny.usor by writing to:
CardiacBox 2000New York State Department of HealthAlbany, New York 12220
33

State of New YorkGeorge E. Pataki, Governor
Department of HealthBarbara A. DeBuono, M.D., M.P.H., Commissioner
10/98