corn starts to stir traders talk about slow planting, but tighter … · · 2018-04-25tota nl ext...
TRANSCRIPT

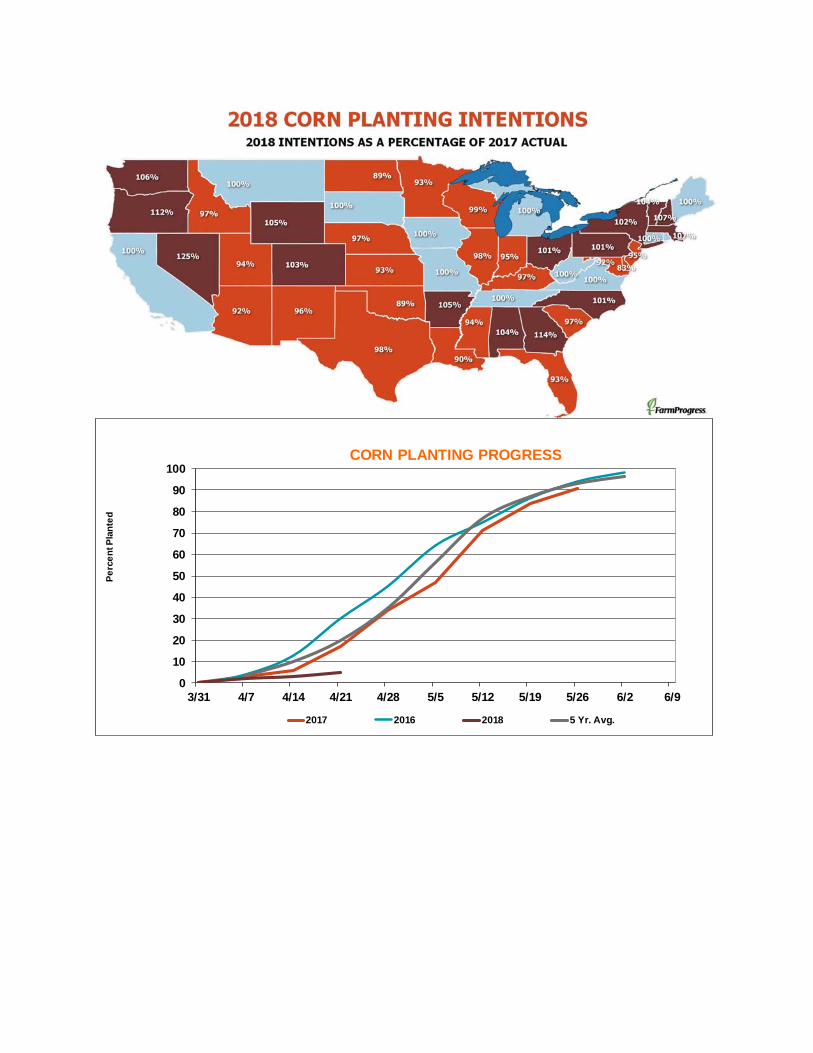
Corn starts to stir Traders talk about slow planting, but tighter carryout is key By Bryce Knorr, senior grain market analyst Growing a corn crop is a marathon, not a sprint. But so far the corn market is hitting all the paces to what could be a profitable year. A cold, wet start to the growing season has farmers talking about planting delays. The trade is talking about it too, but only a little. Tractors are starting to roll, for one thing, and forecasts look warmer for a week or so, and somewhat drier. But those who follow the markets also know about a weather model developed by USDA to predict corn yields. It’s not the be-all and end-all. But one of the factors it uses, in addition to June crop stress, and July rainfall and temperatures, is planting progress by mid-May. On average, around 85% of the crop is planted by the end of the third week of the month. That leaves a window of three weeks to get most of the crop in the ground. Moreover, some years slow progress makes a difference, some years it doesn’t. So while being idle in April frustrates farmers, it’s only a mild titillation for traders. Nonetheless, there are other good reasons to be optimistic about corn. Unless farmers plant significantly more acres than USDA forecast in its March report, production should be less than demand under normal yield and usage conditions. The balance sheet won’t be anywhere near squeaky tight. But it could support not only higher average cash prices, but rallies as well on any threat to yields. Forecasts for a warm June are already shaping up according to some models, adding further potential. But one of the most encouraging bits of hope comes from seasonal trend charts. December corn has a bullish pattern of higher highs and higher lows. Until that trend breaks down, the tendency is for higher prices into the approach of the window for pollination. This week’s pricing model puts the selling range for new crop futures from $4.37 to $4.77, levels that would be profitable for the average grower with average yields and basis. Don’t look for that price anytime soon, especially with geopolitical risk in outside markets lurking on a daily basis. In the meantime, growers should focus on winding down pricing of old crop inventory. Basis is firming, and pushes traditionally are possible when farmers are too busy in the field to sell. A record book of unshipped corn sales should support bids in the export pipeline, both along the river system and at rail terminals shipping out to the PNW and Mexico. Demand could grow if Brazil’s corn crop is hurt by dry conditions that appear to be developing, though it’s still too early to draw conclusions on yields. Ethanol may be more of a question mark, as production slowed to its lowest level since harvest. That’s not completely unusual seasonally, but it means corn usage to make the biofuel may not be any bigger than USDA currently estimates. Officially, I’ve recommended being 90% protected on 2017 production, hedging with futures or HTAs to wait for basis to keep firming. And being 100% set isn’t a bad idea, either for those with a profit who are ready to move on. Growers who are nervous about new crop can sell the carry to July 2019 to get closer to a profitable price. Otherwise, consider buying calls if the market breaks. Use rallies to consider bear-spreading December 2018 against July 2019 at 13 cents or better as a hedge for potential weak basis at harvest.

Corn Supply & Demand
USDA
Area 2016 2017 2018 2017 2018Planted 94,004 90,167 90,000 90,703 88,026 Harvested 86,748 82,703 82,700 82,703 80,885
Yield 174.6 176.6 174.0 176.6 172.6
Beginning stocks 1,737 2,294 2,352 2,294 2,181 Production 15,148 14,605 14,390 14,605 13,957 Imports 57 50 50 37 37 Supply, total 16,942 16,947 16,792 16,936 16,175 Feed and residual 5,472 5,500 5,475 5,427 5,226 Food, seed and ind. 6,884 7,040 7,145 7,048 7,119 Domestic, total 12,356 12,540 12,620 12,476 12,345 Exports 2,293 2,225 1,900 2,279 2,034 Use, total 14,649 14,766 14,520 14,755 14,379 Ending stocks 2,294 2,182 2,272 2,181 1,796 Ave. cash price $3.36 $3.35 $3.40 $3.41 $3.92
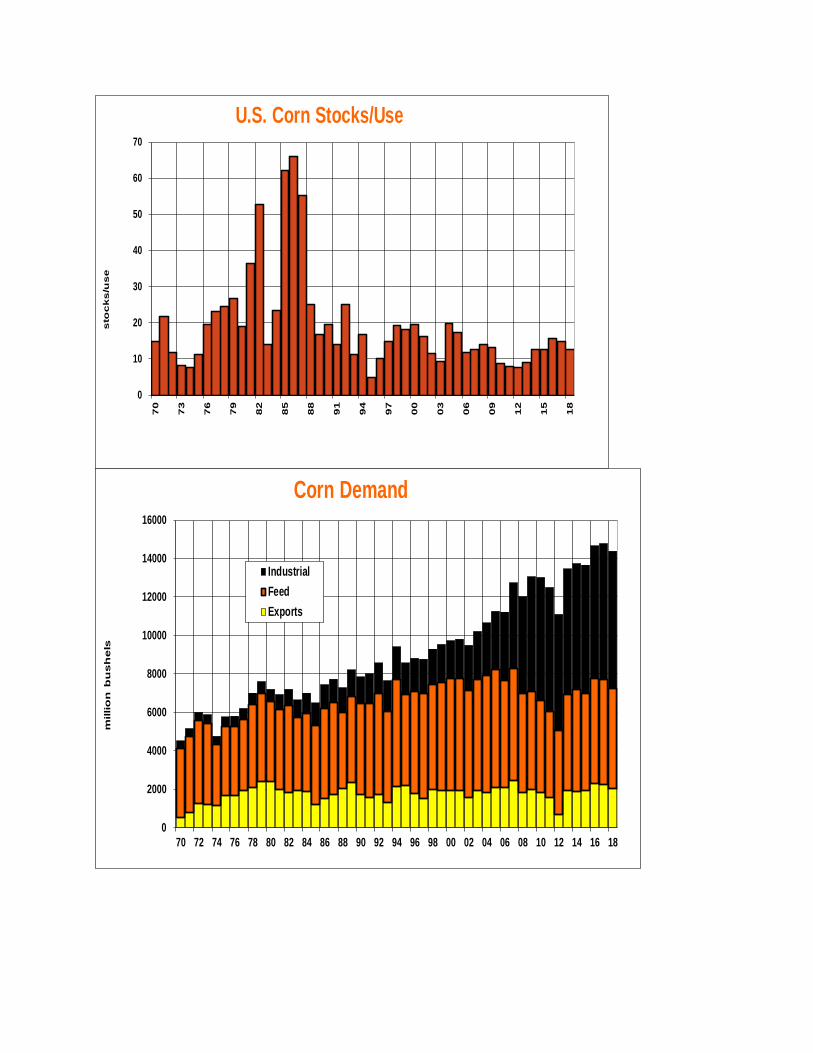
Stocks to use 15.7% 14.8% 15.6% 14.8% 12.5%Ave. nearby futures $3.69 $3.60 $3.76 $4.19
Top Third $3.76 $4.39 of Price Range to $4.09 to $4.77
Bryce's Forecast
0
10
20
30
40
50
60
70
80
90
100
3/31 4/7 4/14 4/21 4/28 5/5 5/12 5/19 5/26 6/2 6/9
Pe
rce
nt P
lan
ted
CORN PLANTING PROGRESS
2017 2016 2018 5 Yr. Avg.


0
10
20
30
40
50
60
707
0
73
76
79
82
85
88
91
94
97
00
03
06
09
12
15
18
sto
ck
s/u
se
U.S. Corn Stocks/Use
0
2000
4000
6000
8000
10000
12000
14000
16000
70 72 74 76 78 80 82 84 86 88 90 92 94 96 98 00 02 04 06 08 10 12 14 16 18
millio
n b
us
he
ls
Corn Demand
Industrial
Feed
Exports


‐$1.00
‐$0.50
$0.00
$0.50
$1.00
$1.50
$2.00
$2.50
Average Corn Belt Ethanol Plant Margins
2.65
2.70
2.75
2.80
2.85
2.90
2.95
Sep‐14 Jan‐15 May‐15 Sep‐15 Jan‐16 May‐16 Sep‐16 Jan‐17 May‐17 Sep‐17 Jan‐18
ETHANOL PRODUCTIONGALLONS FROM EACH BUSHEL USED

-
5,000
10,000
15,000
20,000
25,000
30,000
35,000
2012 2013 2014 2015 2016 2017 2018
tho
usa
nd
ba
rre
ls
Source: USEIA, Farm Futures
Monthly U.S. ethanol production and stocks
Production Stocks
800
850
900
950
1000
1050
1100
1150
17000
18000
19000
20000
21000
22000
23000
24000
25000
9/1/16 11/1/16 1/1/17 3/1/17 5/1/17 7/1/17 9/1/17 11/1/17 1/1/18 3/1/18
thousand barrels/day
Production
thousand barrels
Stocks WEEKLY ETHANOL PRODUCTION AND STOCKS
Ending stocks Daily Production

0
20
40
60
80
100
120
2013 2014 2015 2016 2017
CHINESE CORN IMPORTS, SEPT-MARCH
(million bushels)Ukraine U.S. Total

Weekly Export Inspections
in million bushels For week of 04/19/18
This Week
Last Week
Average Trade Guess
This Week
Last Year
Rate Needed to Meet USDA
Forecast
Year-to-Date
Total This Year
Year-to-Date
Total Last Year
WHEAT 22.8 18.6 12-20 23.2 22.5 790 875
CORN 67.7 62.1 47-66 57.8 52.6 1,172 1,471
SOYBEANS 17.3 16.4 11-22 23.8 24.6 1,574 1,799
Source: USDA, Reuters
Weekly Export Sales (million bushels)AS OF WEEK ENDING 4/12/18
Wheat Corn SoybeansOld Crop Sales (2.5) 43.0 38.2 New Crop Sales 8.8 4.4 40.1Total Sales 6.4 47.4 78.3 Prior Week 6.9 35.3 90.6 Trade Estimates 11.9 41.3 66.2 Rate to reach USDA Forecast 12.1 14.2 4.0 Export Shipments 16.7 62.8 14.8Rate to reach USDA Forecast 32.4 56.7 25.4Commitments % of USDA est. 96% 86% 94%5-year average for this week 96% 84% 96%Shipments % of USDA est. 77% 59% 82%5-year average for this week 81% 56% 88%Source: USDA, Reuters

0%
20%
40%
60%
80%
100%
120%
0
500
1000
1500
2000
2500
Total Corn Sales & Shipments(Year to Date)
Total Commitments % of USDA Forecast
0.0%
10.0%
20.0%
30.0%
40.0%
50.0%
60.0%
70.0%
80.0%
0200400600800
10001200140016001800
Corn Shipments(Year to Date)
Total Shipments % of USDA Forecast

0
500
1000
1500
2000
2500
3000
0
20
40
60
80
100
120
140
160
Final exports
New crop sales
Total Next Year's Corn Sales (Year to Date)
New Crop Sales Final Exports
0
100
200
300
400
500
600
700
800
900
Mil
lio
n B
ush
els
Unshipped Corn Sales

0
10,000
20,000
30,000
40,000
50,000
60,000
70,000
80,000
90,000
S O N D J F M A M J J A
Th
ou
sa
nd
Bu
sh
els
Weekly Corn Export Inspections
5-Yr. Avg. 2016-17 2017-18
$3.00
$3.50
$4.00
$4.50
$5.00
-300000
-200000
-100000
0
100000
200000
300000
400000
1/15 3/15 5/15 7/15 9/15 11/15 1/16 3/16 5/16 7/16 9/16 11/16 1/17 3/17 5/17 7/17 9/17 11/17 1/18 3/18
ne
arb
y f
utu
res
ne
t p
osit
ion
in
co
ntr
acts
Source: CFTC
Commitment of Traders - Corn
Index funds Hedge funds Futures

250
260
270
280
290
300
310
320
300
320
340
360
380
400
420
440
11/1 1/1 3/1 5/1 7/1 9/1 11/1
DECEMBER CORN BULL VS BEAR YEARS
Bull Market 17-Dec Dec-18 Normal Year
255
260
265
270
275
280
285
290
295
300
300
350
400
450
500
550
Aug Sep Oct Nov Dec Jan Feb Mar Apr May Jun Jul
July Corn Bull vs Bear Years
Bull Market Years July 2018 Normal Year

July Corn Futures Seasonal Trend
Start Date +1 Week +2 Weeks +3 Weeks +4 Weeks +5 Weeks +6 Weeks4/24 5/1 5/8 5/15 5/22 5/29 6/5Ave. Gain/Loss (3.6) (2.9) (4.5) (5.4) (3.3) (5.9)
% Up 20/43 16/43 19/43 15/43 20/43 20/43% Down 23/43 27/43 24/43 28/43 23/43 22/43Ave. Gain - Up year 5.5 12.1 9.8 15.1 13.3 11.1 Ave Loss - Down Year (11.6) (11.7) (15.8) (16.3) (17.7) (21.6) Biggest Gain 20.0 32.3 19.0 40.3 62.5 46.8 Biggest Loss (102.8) (103.3) (101.8) (90.8) (95.5) (94.5)
This table shows the typical seasonal pattern at weekly intervals from the start date, based onaverage daily futures prices from 1974-2016. Gains and losses are based on the difference between the closing price on the start date and the closing price on the weekly date shown.

