corevalve system - food and drug administration · 2017-07-18 · corevalve™ system transcatheter...
TRANSCRIPT
CoreValve™ System
Transcatheter Aortic Valve
Delivery Catheter System
Compression Loading System
Caution: Implantation of the Medtronic CoreValve™ system should be performed only by
physicians who have received Medtronic CoreValve™ training.
These devices are supplied sterile for single use only. After use, dispose of the delivery
catheter system and the compression loading system in accordance with local regulations and
hospital procedures. Do not resterilize.
Instructions for Use
Caution: Federal (USA) law restricts this device to sale by or on the order of a physician.

Trademarks may be registered and are the property of their respective owners.
1
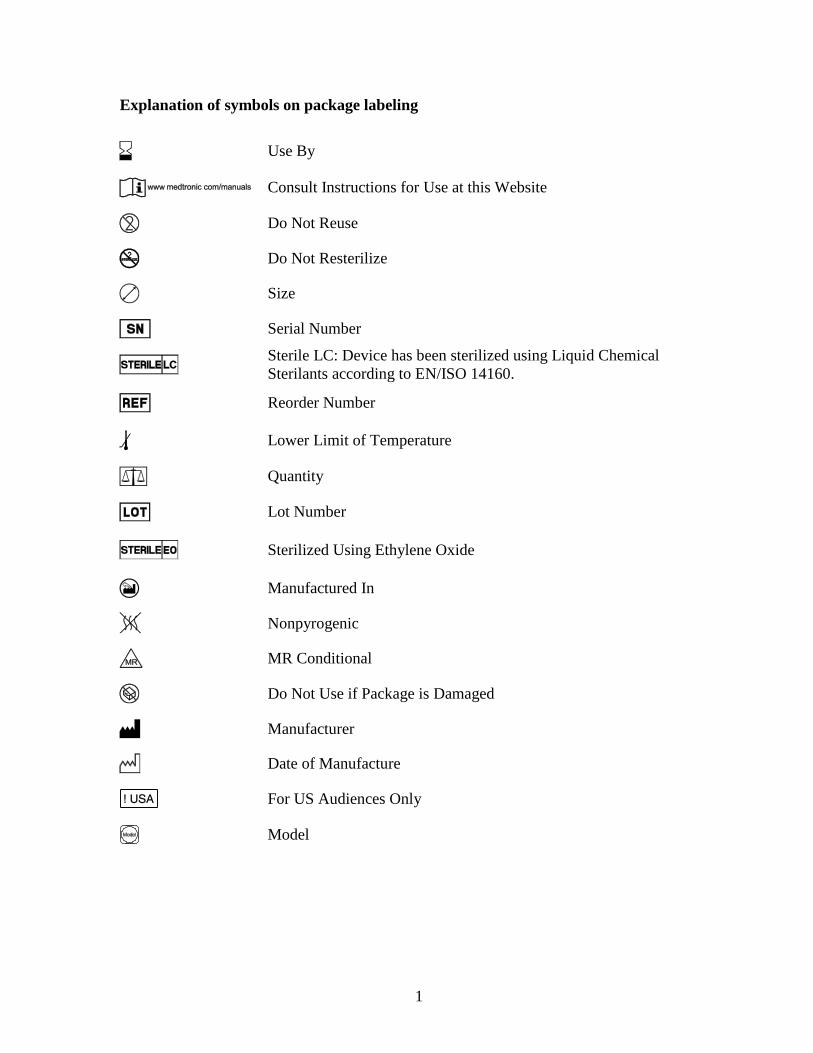
Explanation of symbols on package labeling
Use By
Consult Instructions for Use at this Website
Do Not Reuse
Do Not Resterilize
Size
Serial Number
Sterile LC: Device has been sterilized using Liquid Chemical
Sterilants according to EN/ISO 14160.
Reorder Number
Lower Limit of Temperature
Quantity
Lot Number
Sterilized Using Ethylene Oxide
Manufactured In
Nonpyrogenic
MR Conditional
Do Not Use if Package is Damaged
Manufacturer
Date of Manufacture
For US Audiences Only
Model
2
1.0 Device description
The Medtronic CoreValve™ system consists of 3 components: the transcatheter aortic valve
(bioprosthesis)a, the delivery catheter system (catheter), and the compression loading system
(CLS).
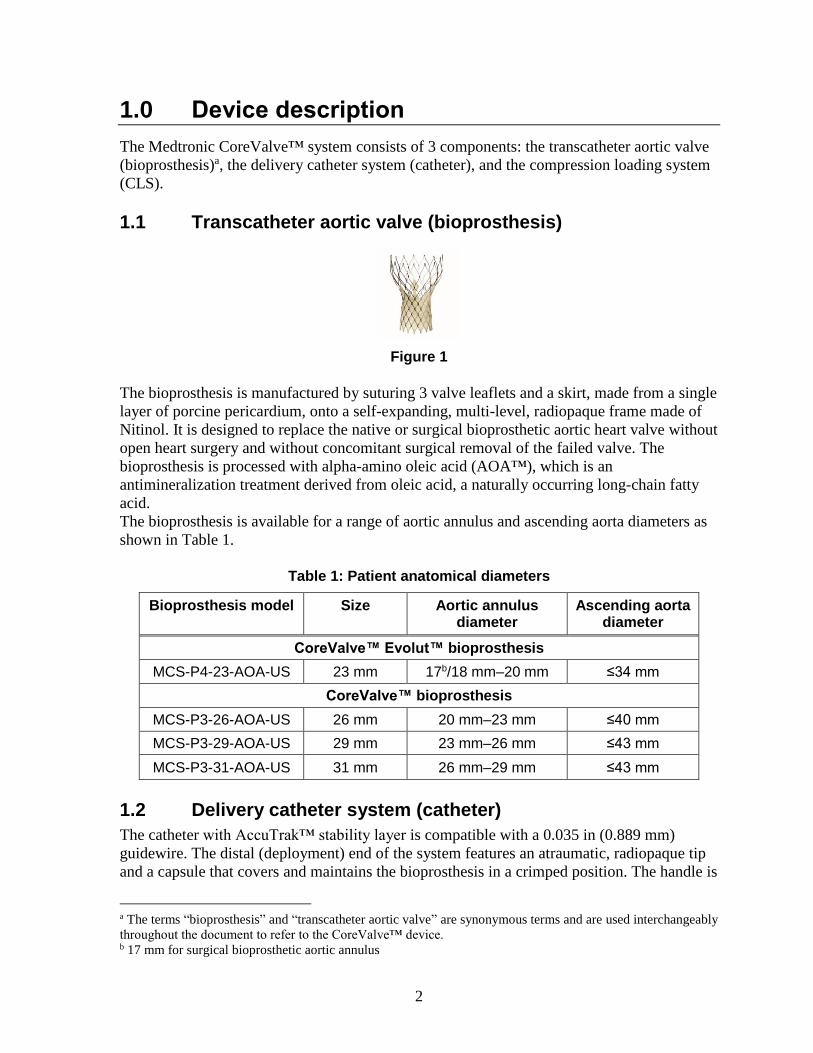
1.1 Transcatheter aortic valve (bioprosthesis)
Figure 1
The bioprosthesis is manufactured by suturing 3 valve leaflets and a skirt, made from a single
layer of porcine pericardium, onto a self-expanding, multi-level, radiopaque frame made of
Nitinol. It is designed to replace the native or surgical bioprosthetic aortic heart valve without
open heart surgery and without concomitant surgical removal of the failed valve. The
bioprosthesis is processed with alpha-amino oleic acid (AOA™), which is an
antimineralization treatment derived from oleic acid, a naturally occurring long-chain fatty
acid.
The bioprosthesis is available for a range of aortic annulus and ascending aorta diameters as
shown in Table 1.
Table 1: Patient anatomical diameters
Bioprosthesis model Size Aortic annulus diameter
Ascending aorta diameter
CoreValve™ Evolut™ bioprosthesis
MCS-P4-23-AOA-US 23 mm 17b/18 mm–20 mm ≤34 mm
CoreValve™ bioprosthesis
MCS-P3-26-AOA-US 26 mm 20 mm–23 mm ≤40 mm
MCS-P3-29-AOA-US 29 mm 23 mm–26 mm ≤43 mm
MCS-P3-31-AOA-US 31 mm 26 mm–29 mm ≤43 mm
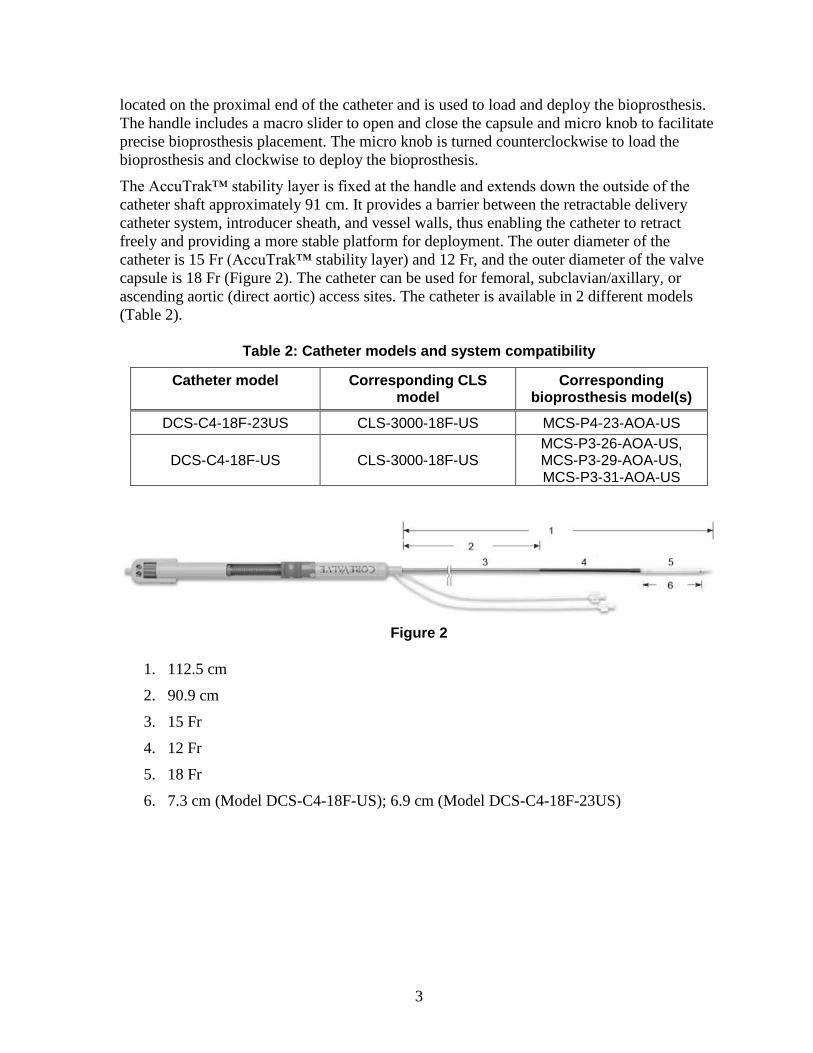
1.2 Delivery catheter system (catheter)
The catheter with AccuTrak™ stability layer is compatible with a 0.035 in (0.889 mm)
guidewire. The distal (deployment) end of the system features an atraumatic, radiopaque tip
and a capsule that covers and maintains the bioprosthesis in a crimped position. The handle is
a The terms “bioprosthesis” and “transcatheter aortic valve” are synonymous terms and are used interchangeably
throughout the document to refer to the CoreValve™ device. b 17 mm for surgical bioprosthetic aortic annulus
3
located on the proximal end of the catheter and is used to load and deploy the bioprosthesis.
The handle includes a macro slider to open and close the capsule and micro knob to facilitate
precise bioprosthesis placement. The micro knob is turned counterclockwise to load the
bioprosthesis and clockwise to deploy the bioprosthesis.
The AccuTrak™ stability layer is fixed at the handle and extends down the outside of the
catheter shaft approximately 91 cm. It provides a barrier between the retractable delivery
catheter system, introducer sheath, and vessel walls, thus enabling the catheter to retract
freely and providing a more stable platform for deployment. The outer diameter of the
catheter is 15 Fr (AccuTrak™ stability layer) and 12 Fr, and the outer diameter of the valve
capsule is 18 Fr (Figure 2). The catheter can be used for femoral, subclavian/axillary, or
ascending aortic (direct aortic) access sites. The catheter is available in 2 different models
(Table 2).
Table 2: Catheter models and system compatibility
Catheter model Corresponding CLS model
Corresponding bioprosthesis model(s)
DCS-C4-18F-23US CLS-3000-18F-US MCS-P4-23-AOA-US
DCS-C4-18F-US CLS-3000-18F-US MCS-P3-26-AOA-US, MCS-P3-29-AOA-US, MCS-P3-31-AOA-US
Figure 2
1. 112.5 cm
2. 90.9 cm
3. 15 Fr
4. 12 Fr
5. 18 Fr
6. 7.3 cm (Model DCS-C4-18F-US); 6.9 cm (Model DCS-C4-18F-23US)
4
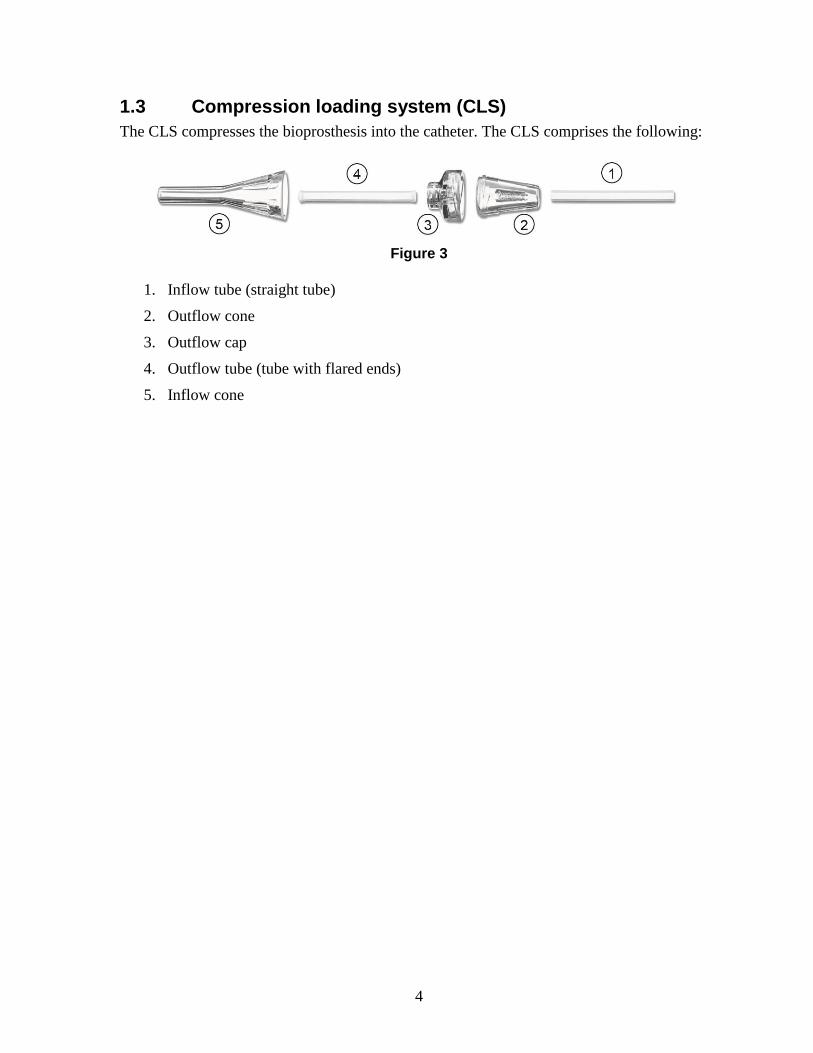
1.3 Compression loading system (CLS)
The CLS compresses the bioprosthesis into the catheter. The CLS comprises the following:
Figure 3
1. Inflow tube (straight tube)
2. Outflow cone
3. Outflow cap
4. Outflow tube (tube with flared ends)
5. Inflow cone
5
2.0 Indications
The Medtronic CoreValve™ system is indicated for relief of aortic stenosis in patients with
symptomatic heart disease due to severe native calcific aortic stenosis who are judged by a
heart team, including a cardiac surgeon, to be at intermediate or greater risk for open surgical
therapy (i.e., predicted risk of surgical mortality ≥ 3% at 30 days, based on the Society of
Thoracic Surgeons (STS) risk score and other clinical comorbidities unmeasured by the STS
risk calculator).
The Medtronic CoreValve™ system is indicated for use in patients with symptomatic heart
disease due to failure (stenosed, insufficient, or combined) of a surgical bioprosthetic aortic
valve who are judged by a heart team, including a cardiac surgeon, to be at high or greater
risk for open surgical therapy (i.e., STS predicted risk of operative mortality score ≥8% or at
a ≥15% risk of mortality at 30 days).
6
3.0 Contraindications
The CoreValve™ system is contraindicated for patients presenting with any of the following
conditions:
Known hypersensitivity or contraindication to aspirin, heparin (HIT/HITTS) and
bivalirudin, ticlopidine, clopidogrel, Nitinol (Titanium or Nickel), or sensitivity to
contrast media, which cannot be adequately premedicated
Ongoing sepsis, including active endocarditis
Preexisting mechanical heart valve in aortic position
7
4.0 Warnings and precautions
4.1 Warnings
4.1.1 General
Implantation of the Medtronic CoreValve™ system should be performed only by
physicians who have received Medtronic CoreValve™ training.
The transcatheter aortic valve is to be used only in conjunction with the delivery catheter
system and the compression loading system.
This procedure should only be performed where emergency aortic valve surgery can be
performed promptly.
Do not use any of the Medtronic CoreValve™ system components if any of the
following has occurred:
It has been dropped, damaged, or mishandled in any way
The Use By date has elapsed
Mechanical failure of the delivery catheter system and/or accessories may result in
patient complications.
4.1.2 Transcatheter aortic valve (bioprosthesis)
Do not use the bioprosthesis if any of the following conditions is observed:
There is any damage to the container (e.g., cracked jar or lid, leakage, broken or
missing seals)
The serial number tag does not match the container label
The freeze indicator in the secondary package has activated
The storage solution does not completely cover the bioprosthesis
Accelerated deterioration of the bioprosthesis may occur in patients presenting with an
altered calcium metabolism.
4.2 Precautions
4.2.1 General
Do not contact any of the Medtronic CoreValve™ system components with cotton or
cotton swabs.
Do not expose any of the Medtronic CoreValve™ system components to organic
solvents, such as alcohol.
Do not introduce air into the catheter.
8
The safety and effectiveness of the Medtronic CoreValve™ system have not been
evaluated in the pediatric population.
The safety and effectiveness of the bioprosthesis for aortic valve replacement have not
been evaluated in the following patient populations:
Patients who do not meet the criteria for symptomatic severe native aortic stenosis
as defined below:
Symptomatic severe high-gradient aortic stenosis: aortic valve area
≤1.0 cm2 or aortic valve area index ≤0.6 cm2/m2, a mean aortic valve
gradient ≥40 mmHg, or a peak aortic-jet velocity ≥4.0 m/s
Symptomatic severe low-flow/low-gradient aortic stenosis: aortic valve
area ≤1.0 cm2 or aortic valve area index ≤0.6 cm2/m2; a mean aortic valve
gradient <40 mmHg; and a peak aortic-jet velocity <4.0 m/s
Who are at low surgical risk (predicted perioperative mortality risk of <3%)
With untreated, clinically significant coronary artery disease requiring
revascularization
With a preexisting prosthetic heart valve with a rigid support structure in either
the mitral or pulmonic position if either the preexisting prosthetic heart valve
could affect the implantation or function of the bioprosthesis or the implantation
of the bioprosthesis could affect the function of the preexisting prosthetic heart
valve
With cardiogenic shock manifested by low cardiac output, vasopressor
dependence, or mechanical hemodynamic support
The safety and effectiveness of a CoreValve™ bioprosthesis implanted within a failed
preexisting transcatheter bioprosthesis have not been demonstrated.
Implanting a CoreValve™ bioprosthesis in a degenerated surgical bioprosthesis
(transcatheter aortic valve in surgical aortic valve [TAV in SAV]) should be avoided in
the following conditions. The degenerated surgical bioprosthesis presents with a:
Significant concomitant perivalvular leak (between the prosthesis and the native
annulus), is not securely fixed in the native annulus, or is not structurally intact
(e.g., wireform frame fracture)
Partially detached leaflet that in the aortic position may obstruct a coronary
ostium
Stent frame with a manufacturer’s labeled inner diameter <17 mm
The safety and effectiveness of the bioprosthesis for aortic valve replacement have not
been evaluated in patient populations presenting with the following:
Blood dyscrasias as defined: leukopenia (WBC <1000 cells/mm3),
thrombocytopenia (platelet count <50,000 cells/mm3), history of bleeding
diathesis or coagulopathy, or hypercoagulable states
9
Congenital bicuspid or unicuspid valve verified by echocardiography
Mixed native aortic valve disease (aortic stenosis and aortic regurgitation with
predominant aortic regurgitation [3-4+])
Moderate to severe (3-4+) or severe (4+) mitral or severe (4+) tricuspid
regurgitation
Hypertrophic obstructive cardiomyopathy
New or untreated echocardiographic evidence of intracardiac mass, thrombus, or
vegetation
Native aortic annulus size <18 mm or >29 mm per the baseline diagnostic
imaging or surgical bioprosthetic aortic annulus size <17 mm or >29 mm
Transarterial access not able to accommodate an 18 Fr sheath
Sinus of valsalva anatomy that would prevent adequate coronary perfusion
Moderate to severe mitral stenosis
Severe ventricular dysfunction with left ventricular ejection fraction (LVEF)
<20% as measured by resting echocardiogram
Symptomatic carotid or vertebral artery disease
Severe basal septal hypertrophy with an outflow gradient
Do not expose the bioprosthesis to solutions other than the storage and rinse solutions.
Do not add antibiotics or any other substance to either the storage or rinse solutions. Do
not apply antibiotics or any other substance to the bioprosthesis.
Do not allow the bioprosthesis to dry. Maintain tissue moisture with irrigation or
immersion.
Do not attempt to repair a damaged bioprosthesis.
Do not handle or use forceps to manipulate the bioprosthesis leaflet tissue.
Do not deform the bioprosthesis in excess of what is experienced during crimping,
loading, and implantation.
4.2.2 Prior to use
Exposure to glutaraldehyde may cause irritation of the skin, eyes, nose, and throat. Avoid
prolonged or repeated exposure to the vapors. Use only with adequate ventilation. If skin
contact occurs, immediately flush the affected area with water (minimum of 15 minutes).
In the event of eye contact, flush with water for a minimum of 15 minutes and seek
medical attention immediately.
The bioprosthesis and the glutaraldehyde storage solution are sterile. The outside of the
bioprosthesis container is nonsterile and must not be placed in the sterile field.
Damage may result from forceful handling of the catheter. Prevent kinking of the catheter
when removing it from the packaging.
10
This device was designed for single patient use only. Do not reuse, reprocess, or
resterilize this product. Reuse, reprocessing, or resterilization may compromise the
structural integrity of the device and/or create a risk of contamination of the device,
which could result in patient injury, illness, or death.
The bioprosthesis size must be appropriate to fit the patient’s anatomy. Proper sizing of
the device is the responsibility of the physician. Refer to Table 1 for available sizes.
Failure to implant a device within the sizing matrix could lead to adverse effects such as
those listed in Section 5.0.
Patients must present with access vessel diameters of ≥6 mm or an ascending aortic
(direct aortic) access site ≥60 mm from the basal plane.
Implantation of the bioprosthesis should be avoided in patients with aortic root angulation
(angle between plane of aortic valve annulus and horizontal plane/vertebrae) of >30° for
right subclavian/axillary access or >70° for femoral and left subclavian/axillary access.
Use caution when using the subclavian/axillary approach in patients with a patent Left
Internal Mammary Artery (LIMA) graft (for left subclavian/axillary approach only) or
patent Right Internal Mammary Artery (RIMA) graft (for right subclavian/axillary
approach only).
For direct aortic access, ensure the access site and trajectory are free of patent RIMA or a
preexisting patent RIMA graft.
4.2.3 During use
Adequate rinsing of the bioprosthesis with sterile saline, as described in the Instructions
for Use, is mandatory before implantation. No other solutions, drugs, chemicals, or
antibiotics should ever be added to the glutaraldehyde or rinse solutions as irreparable
damage to the leaflet tissue, which may not be apparent under visual inspection, may
result.
During rinsing, do not touch the leaflets or squeeze the bioprosthesis.
With the exception of attaching the bioprosthesis frame loops to the catheter tabs, do not
touch the capsule or the transition between the capsule and the catheter shaft. To protect
the capsule, handle the catheter using the catheter shaft or, during loading, the loading
tools.
If a capsule becomes damaged during loading or the capsule fails to close, replace the
entire system (bioprosthesis, catheter, and CLS). Do not use a catheter with a damaged
capsule.
Prevent contamination of the bioprosthesis, its storage solution, the catheter, and the CLS
with glove powder.
After a bioprosthesis has been inserted into a patient, do not attempt to reload that
bioprosthesis on the same or any other catheter.
During implantation, if resistance to deployment is encountered (e.g., the micro knob
starts clicking or is tight or stuck), apply upward pressure to the macro slider while
11
turning the micro knob. If the bioprosthesis still does not deploy, remove it from the
patient and use another system.
While the catheter is in the patient, ensure the guidewire is extending from the tip. Do not
remove the guidewire from the catheter while the catheter is inserted in the patient.
Once deployment is initiated, retrieval of the bioprosthesis from the patient (e.g., use of
the catheter) is not recommended. Retrieval of a partially deployed valve using the
catheter may cause mechanical failure of the delivery catheter system, aortic root
damage, coronary artery damage, myocardial damage, vascular complications, prosthetic
valve dysfunction (including device malposition), embolization, stroke, and/or emergent
surgery.
During deployment, the bioprosthesis can be advanced or withdrawn as long as annular
contact has not been made. Once annular contact is made, the bioprosthesis cannot be
advanced in the retrograde direction; if necessary, and the frame has only been deployed
≤2/3 of its length, the bioprosthesis can be withdrawn (repositioned) in the antegrade
direction. However, use caution when moving the bioprosthesis in the antegrade
direction.
Use the handle of the delivery system to reposition the bioprosthesis. Do not use the outer
catheter sheath.
Once deployment is complete, repositioning of the bioprosthesis (e.g., use of a snare
and/or forceps) is not recommended. Repositioning of a deployed valve may cause aortic
root damage, coronary artery damage, myocardial damage, vascular complications,
prosthetic valve dysfunction (including device malposition), embolization, stroke, and/or
emergent surgery.
Do not attempt to retrieve a bioprosthesis if any one of the outflow struts is protruding
from the capsule. If any one of the outflow struts has deployed from the capsule, the
bioprosthesis must be released from the catheter before the catheter can be withdrawn.
Ensure the capsule is closed before catheter removal. If increased resistance is
encountered when removing the catheter through the introducer sheath, do not force
passage. Increased resistance may indicate a problem and forced passage may result in
damage to the device and/or harm to the patient. If the cause of resistance cannot be
determined or corrected, remove the catheter and introducer sheath as a single unit over
the guidewire, and inspect the catheter and confirm that it is complete.
Clinical long-term durability has not been established for the bioprosthesis. Evaluate
bioprosthesis performance as needed during patient follow-up.
Postprocedure, administer appropriate antibiotic prophylaxis as needed for patients at risk
for prosthetic valve infection and endocarditis.
Postprocedure, administer anticoagulation and/or antiplatelet therapy per hospital
protocol.
Excessive contrast media may cause renal failure. Preprocedure, measure the patient’s
creatinine level. During the procedure, monitor contrast media usage.
12
Conduct the procedure under fluoroscopy. Fluoroscopic procedures are associated with
the risk of radiation damage to the skin, which may be painful, disfiguring, and long-
term.
The safety and efficacy of a CoreValve™ bioprosthesis implanted within a transcatheter
bioprosthesis have not been demonstrated. However, in the event that a CoreValve™
bioprosthesis must be implanted within a transcatheter bioprosthesis to improve valve
function, valve size and patient anatomy must be considered before implantation of the
CoreValve™ bioprosthesis to ensure patient safety (e.g., to avoid coronary obstruction).
In the event that valve function or sealing is impaired due to excessive calcification or
incomplete expansion, a postimplant balloon dilatation of the bioprosthesis may improve
valve function and sealing. To ensure patient safety, valve size and patient anatomy must
be considered when selecting the size of the balloon used for dilatation. The balloon size
chosen for dilatation should not exceed the diameter of the native aortic annulus or, for
surgical bioprosthetic valves, the manufacturer’s labeled inner diameter. Refer to the
specific balloon catheter manufacturer’s compliance chart to ensure that the applied
inflation pressure does not result in a balloon diameter that exceeds the indicated annulus
range for the bioprosthesis. Refer to the specific balloon catheter manufacturer’s labeling
for proper instruction on the use of balloon catheter devices. Note: Bench testing has only
been conducted to confirm compatibility with NuMED Z-MED II™ Balloon Aortic
Valvuloplasty catheters where CoreValve™ bioprosthesis device performance was
maintained after dilatation. Data on file.
4.3 Magnetic resonance imaging (MRI)
MRI may be used on the bioprosthesis only under specific conditions. See Section 6.2 MRI
safety information for more information.
13
5.0 Potential adverse events
Potential risks associated with the implantation of the Medtronic CoreValve™ transcatheter
aortic valve may include, but are not limited to, the following:
Death
Cardiac arrest
Coronary occlusion, obstruction, or vessel spasm (including acute coronary closure)
Emergent surgery (e.g., coronary artery bypass, heart valve replacement, valve explant)
Multi-organ failure
Heart failure
Myocardial infarction
Cardiogenic shock
Respiratory insufficiency or respiratory failure
Cardiovascular injury (including rupture, perforation, or dissection of vessels, ventricle,
myocardium, or valvular structures that may require intervention)
Ascending aorta trauma
Cardiac tamponade
Cardiac failure or low cardiac output
Prosthetic valve dysfunction including, but not limited to, fracture; bending (out-of-round
configuration) of the valve frame; under-expansion of the valve frame; calcification;
pannus; leaflet wear, tear, prolapse, or retraction; poor valve coaptation; suture breaks or
disruption; leaks; mal-sizing (prosthesis-patient mismatch); malposition (either too high
or too low)/malplacement; regurgitation; stenosis
Thrombosis/embolus (including valve thrombosis)
Valve migration/valve embolization
Ancillary device embolization
Emergent percutaneous coronary intervention (PCI)
Emergent balloon valvuloplasty
Major or minor bleeding that may or may not require transfusion or intervention
(including life-threatening or disabling bleeding)
Allergic reaction to antiplatelet agents, contrast medium, or anesthesia
Infection (including septicemia and endocarditis)
Stroke, transient ischemic attack (TIA), or other neurological deficits
Permanent disability

14
Renal insufficiency or renal failure (including acute kidney injury)
Mitral valve regurgitation or injury
Tissue erosion
Vascular access related complications (e.g., dissection, perforation, pain, bleeding,
hematoma, pseudoaneurysm, irreversible nerve injury, compartment syndrome,
arteriovenous fistula, stenosis)
Conduction system disturbances (e.g., atrioventricular node block, left-bundle branch
block, asystole), which may require a permanent pacemaker
Cardiac arrhythmias
Encephalopathy
Pulmonary edema
Pericardial effusion
Pleural effusion
Myocardial ischemia
Peripheral ischemia
Bowel ischemia
Heart murmur
Hemolysis
Cerebral infarction-asymptomatic
Non-emergent reoperation
Inflammation
Fever
Hypotension or hypertension
Syncope
Dyspnea
Anemia
Angina
Abnormal lab values (including electrolyte imbalance)
15
6.0 Patient information
6.1 Registration information
A patient registration form is included in each bioprosthesis package. After implantation,
please complete all requested information. The serial number is located on both the package
and the identification tag attached to the bioprosthesis. Return the original form to the
Medtronic address indicated on the form and provide the temporary identification card to the
patient prior to discharge.
Medtronic will provide an Implanted Device Identification Card to the patient. The card
contains the name and telephone number of the patient’s physician as well as information
that medical personnel would require in the event of an emergency. Patients should be
encouraged to carry this card with them at all times.
6.2 MRI safety information
Nonclinical testing and modeling have demonstrated that the Medtronic CoreValve™
bioprosthesis is MR Conditional. A patient with this device can be safely scanned in an MR
system meeting the following conditions:
Static magnetic field of 1.5 T and 3.0 T
Maximum spatial gradient magnetic field of 2500 gauss/cm (25 T/m)
Maximum MR system reported, whole body averaged specific absorption rate (SAR) of
≤2.0 W/kg (Normal Operating Mode)
Based on nonclinical testing and modeling, under the scan conditions defined above, the
Medtronic CoreValve™ bioprosthesis is expected to produce a maximum in vivo
temperature rise of less than 3.6˚C after 15 minutes of continuous scanning. Based on
nonclinical data, the image artifact caused by the device will extend no greater than 7 mm
from the Medtronic CoreValve™ bioprosthesis when imaged with a gradient echo pulse
sequence and a 3.0 T MRI system.
Scanning under the conditions defined above may be performed immediately after
implantation.
The presence of other implants or medical circumstances of the patient may require lower
limits on some or all of the above parameters. For deployment of a Medtronic CoreValve™
bioprosthesis inside of a failed surgical bioprosthetic valve, consult the MRI labeling
pertaining to the failed valve for additional artifact information.
16
7.0 How supplied
7.1 Packaging
The bioprosthesis is supplied sterile and nonpyrogenic in a sealed container made of glass
and a screw cap with a liner. The outside of the container is nonsterile and must not be
placed in the sterile field. A freeze indicator is placed inside the labeled carton. If the freeze
indicator has been activated, do not use the bioprosthesis.
The catheter is packaged in a double-pouch configuration and sterilized with ethylene oxide
gas. The catheter is sterile if the pouches are undamaged and unopened. The outer surfaces of
the outer pouch are nonsterile and must not be placed in the sterile field.
The CLS is packaged in a double-pouch configuration. The CLS is sterile if the pouches are
undamaged and unopened. The outer surfaces of the outer pouch are nonsterile and must not
be placed in the sterile field. The CLS is sterilized with ethylene oxide gas.
7.2 Storage
Store the bioprosthesis at room temperature. Avoid exposing to extreme fluctuations of
temperature. Avoid freezing. Appropriate inventory control should be maintained so that
bioprostheses with earlier Use By dates are implanted preferentially. Store the catheter and
CLS in a cool, dry environment.
17
8.0 Additional equipment
Note: While extensive, this equipment list is not meant to cover all possible scenarios.
Transesophogeal echocardiogram (TEE) or transthoracic echocardiography (TTE) on
standby
Temporary pacer insertion
Temporary pacemaker catheter (4 Fr or 5 Fr), per hospital protocol
Sterile sleeve for pacemaker catheter
Hemostatic vessel introducer sheath
Temporary pacemaker generator
Sterile temporary pacemaker-to-generator cable
If indicated, pulmonary artery catheter insertion
Standard pulmonary artery catheter
Hemostatic vessel introducer sheath
Saline flush line connected to pressure transducer
Baseline aortography via radial, brachial, or femoral approach
5 Fr or 6 Fr pigtail angiographic catheter
6 Fr hemostatic vessel introducer sheath
2-port manifold with saline flush line and pressure tubing or transducer
Power injector syringe
Contrast media
High-pressure power injector tubing
Predilatation of implant site
2-port manifold with saline flush and transducer
9 Fr and 18 Fr hemostatic vessel introducer sheaths
Standard length 0.035 in (0.889 mm) straight guidewire
Appropriate suture-mediated closure system, if applicable
Angiographic catheter
0.035 in (0.889 mm) × 260 cm standard high-support guidewire to be shaped with a
pigtail loop
Balloon valvuloplasty catheters, ≤4 cm length × 18 mm, 20 mm, 22 mm or 23 mm, and
25 mm diameters
Inflation device or syringe and diluted 1:5 contrast media
18
Bioprosthesis implantation
18 Fr hemostatic vessel introducer sheath
Standby supplies (must be available in the room)
Pericardiocentesis tray
35 mm × 120 cm single loop snare
Standard percutaneous coronary intervention (PCI) equipment
14 Fr and 16 Fr hemostatic vessel introducer sheaths
Standard cardiac catheterization lab equipment
Intra-aortic balloon pump (IABP)

19
9.0 Instructions for use
Figure 4
1. Catheter tip
2. Capsule
3. Catheter shaft
4. Tube flush port
5. AccuTrak™ stability layer
6. Macro slider
7. Micro knob
8. Luer-lock connection flush port
9.1 Inspection and bioprosthesis loading procedure
Caution: Once the bioprosthesis is removed from its container and the catheter and CLS are
removed from their packaging, ensure all subsequent procedures are performed in a sterile
field.
9.1.1 Inspection prior to use
1. Before removing the bioprosthesis, catheter, or CLS from its primary packaging,
carefully inspect the packaging for any evidence of damage that could compromise
the sterility or integrity of the device (e.g., cracked jar or lid, leakage, broken or
missing seals, torn or punctured pouch).
Caution: Do not use the product if there is evidence of damage.
2. Inspect the temperature indicator located within the packaging for the bioprosthesis to
ensure it has not been activated.
Caution: Do not use the bioprosthesis if the temperature indicator has been activated.
9.1.2 Preparation of the catheter
3. Wipe the length of the catheter with a moist (saline) gauze.
4. Use the micro knob and macro slider on the handle to open and close the catheter
(Figure 4).
20
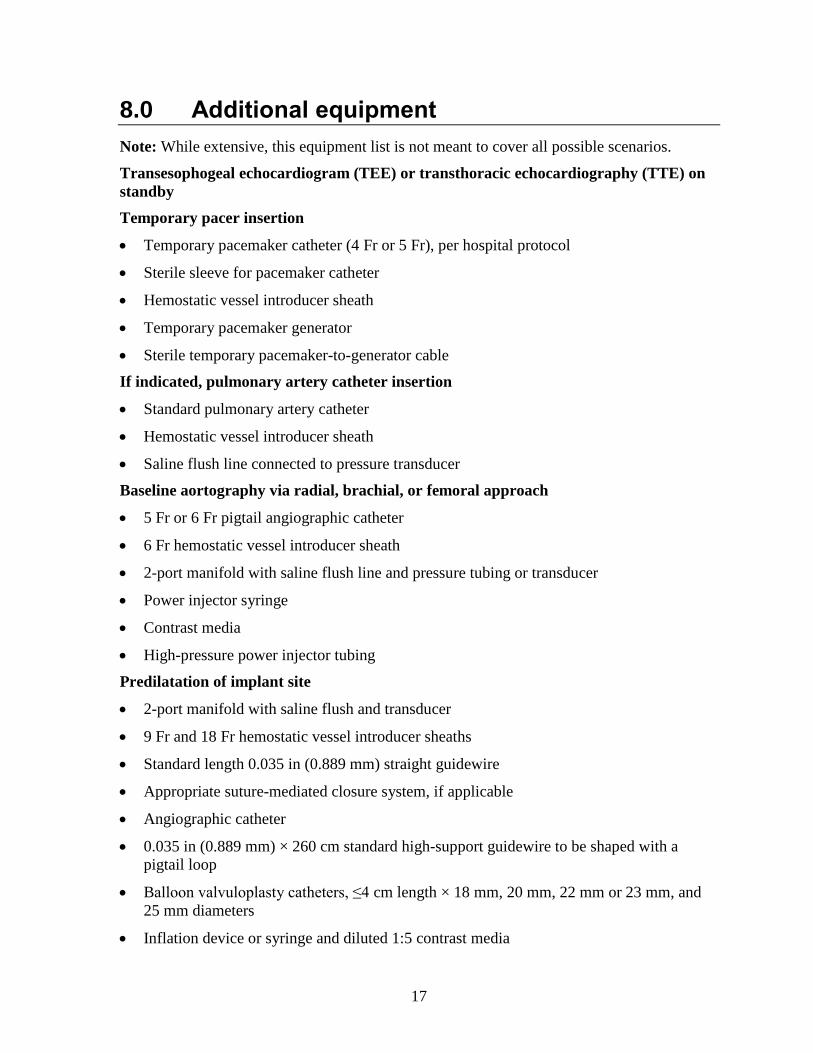
5. Attach a stopcock to the first flush port. Attach a 10 mL syringe filled with saline to
the stopcock on the first flush port and flush. Repeat step for the second flush port on
the catheter (Figure 5).
Figure 5
6. Verify no catheter leakage is observed during any of the flushing steps. If leakage is
observed, use a new system.
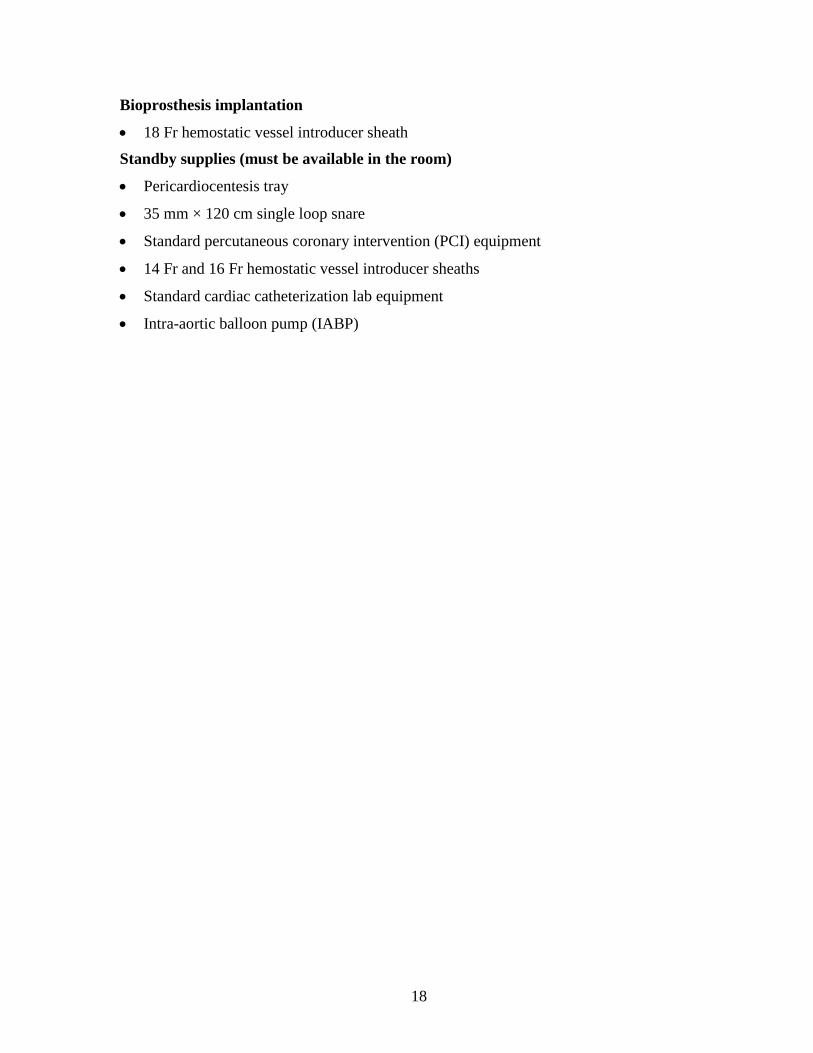
7. Attach a 10 mL syringe filled with saline to the third flush port on the handle on the
catheter (Figure 6) and flush.
Figure 6
8. Fill a loading bath with cold, sterile saline (0°C to 8°C [32°F to 46°F]), and place the
CLS components in the bath.
9.1.3 Bioprosthesis rinsing procedure
9. Fill each of 3 rinsing bowls with approximately 500 mL of fresh, sterile saline at
ambient temperature (15°C to 25°C [59°F to 77°F]).
10. Confirm the integrity of the primary bioprosthesis container. Open the container and
remove the bioprosthesis by carefully grasping one of the frame loops. Let any
remaining solution drain from the bioprosthesis completely.
Caution: The bioprosthesis should not be handled or manipulated with sharp or
pointed objects. Use atraumatic blunt-tipped forceps only. Do not use the forceps to
grasp the tissue portion of the bioprosthesis.
Note: Retain the container with the original solution. It may be needed to store and
return a rejected bioprosthesis.
11. Compare the serial number on the container with the serial number on the tag
attached to the bioprosthesis.
Caution: If the serial numbers do not match, Do not use the bioprosthesis.
21
12. Carefully remove the serial number tag from the bioprosthesis and retain the tag.
Ensure that the suture that was used to secure the serial number tag to the
bioprosthesis is completely removed from the bioprosthesis.
13. Immerse the entire bioprosthesis in a sterile rinsing bowl.
14. Gently agitate the bioprosthesis by hand for 2 minutes to remove the glutaraldehyde
from the bioprosthesis.
15. Repeat steps 13 and 14 in each of the 2 remaining rinsing bowls to ensure complete
removal of glutaraldehyde from the bioprosthesis.
16. Leave the bioprosthesis submerged in sterile saline until it is ready to be loaded.
9.1.4 Bioprosthesis loading procedure
Caution: Rapid capsule advancement can contribute to difficulties with loading the valve.
Slowly advancing the capsule helps facilitate successful loading.
Caution: With the exception of attaching the bioprosthesis frame loops to the catheter tabs,
do not touch the capsule or the transition between the capsule and the catheter shaft. To
protect the capsule, handle the catheter using the catheter shaft or, during loading, the loading
tools.
Note: If a capsule becomes damaged during loading or the capsule fails to close, replace the
entire system (bioprosthesis, catheter, and CLS). Do not use a catheter with a damaged
capsule.
Perform the bioprosthesis loading procedure while the bioprosthesis, CLS, capsule, and
catheter tip are immersed in cold, sterile saline (0°C to 8°C [32°F to 46°F]).
17. To open the capsule, activate the macro slider and slide back.
18. Submerge and cool the bioprosthesis in a bath filled with cold, sterile saline.
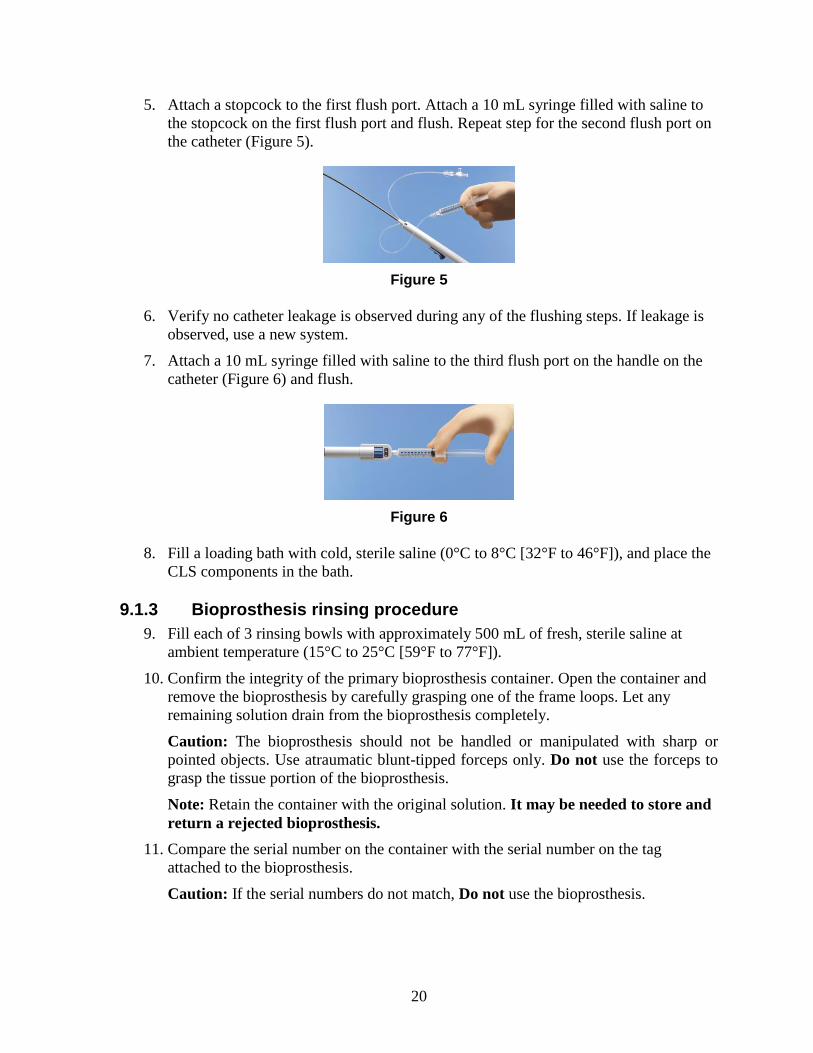
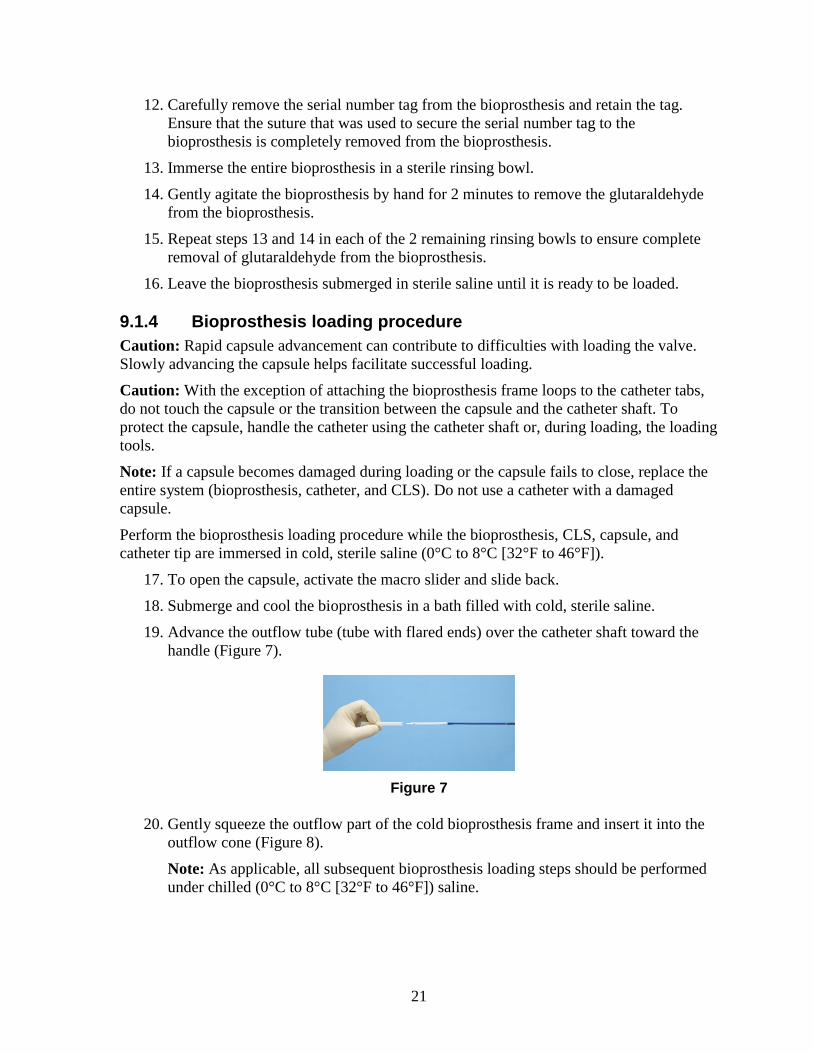
19. Advance the outflow tube (tube with flared ends) over the catheter shaft toward the
handle (Figure 7).
Figure 7
20. Gently squeeze the outflow part of the cold bioprosthesis frame and insert it into the
outflow cone (Figure 8).
Note: As applicable, all subsequent bioprosthesis loading steps should be performed
under chilled (0°C to 8°C [32°F to 46°F]) saline.
22
Figure 8
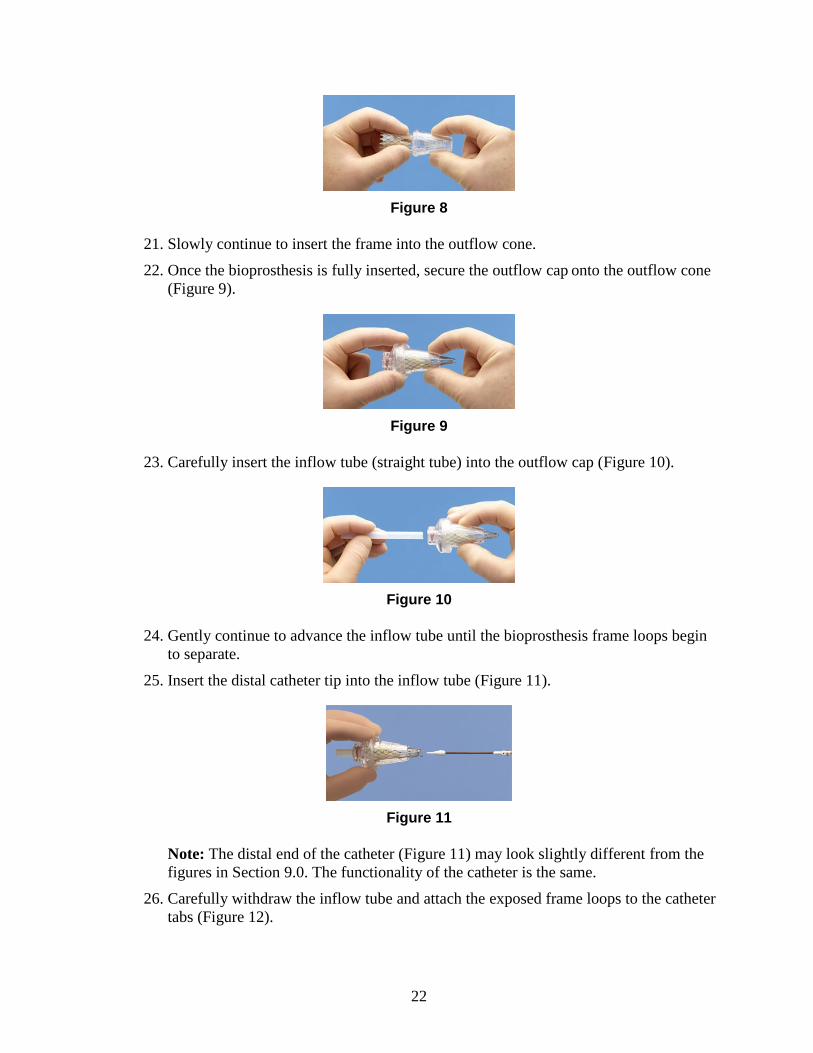
21. Slowly continue to insert the frame into the outflow cone.
22. Once the bioprosthesis is fully inserted, secure the outflow cap onto the outflow cone
(Figure 9).
Figure 9
23. Carefully insert the inflow tube (straight tube) into the outflow cap (Figure 10).
Figure 10
24. Gently continue to advance the inflow tube until the bioprosthesis frame loops begin
to separate.
25. Insert the distal catheter tip into the inflow tube (Figure 11).
Figure 11
Note: The distal end of the catheter (Figure 11) may look slightly different from the
figures in Section 9.0. The functionality of the catheter is the same.
26. Carefully withdraw the inflow tube and attach the exposed frame loops to the catheter
tabs (Figure 12).
23
Figure 12
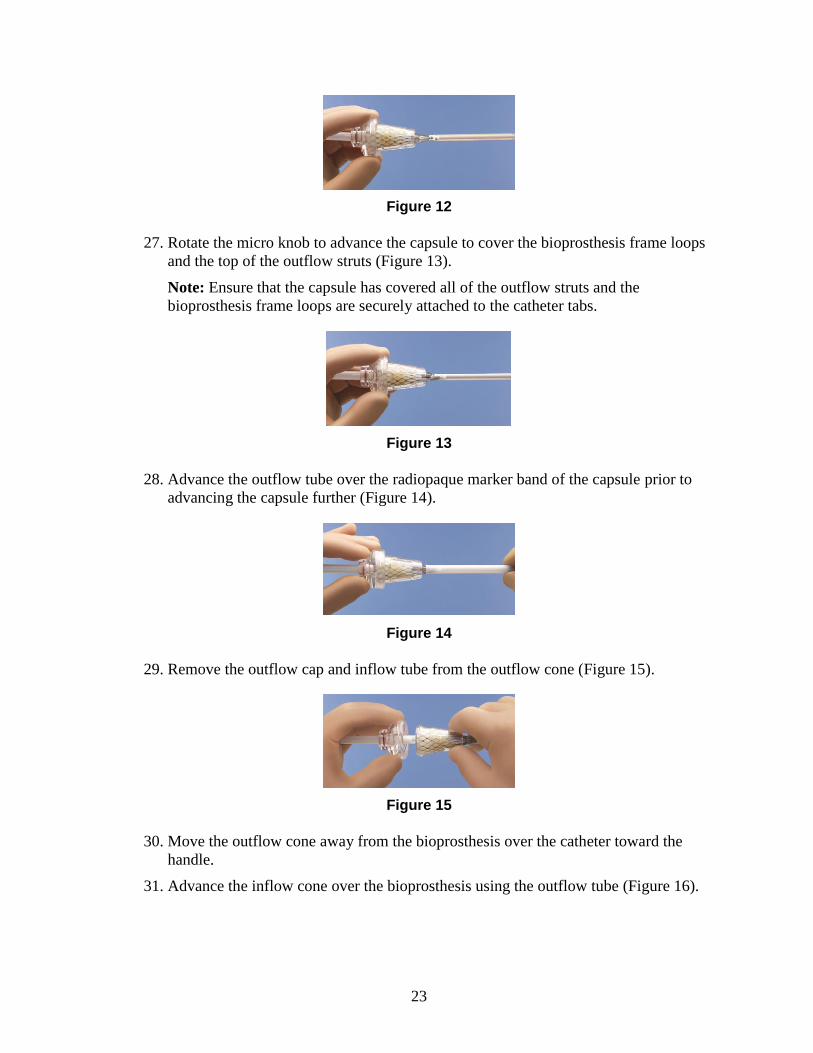
27. Rotate the micro knob to advance the capsule to cover the bioprosthesis frame loops
and the top of the outflow struts (Figure 13).
Note: Ensure that the capsule has covered all of the outflow struts and the
bioprosthesis frame loops are securely attached to the catheter tabs.
Figure 13
28. Advance the outflow tube over the radiopaque marker band of the capsule prior to
advancing the capsule further (Figure 14).
Figure 14
29. Remove the outflow cap and inflow tube from the outflow cone (Figure 15).
Figure 15
30. Move the outflow cone away from the bioprosthesis over the catheter toward the
handle.
31. Advance the inflow cone over the bioprosthesis using the outflow tube (Figure 16).
24
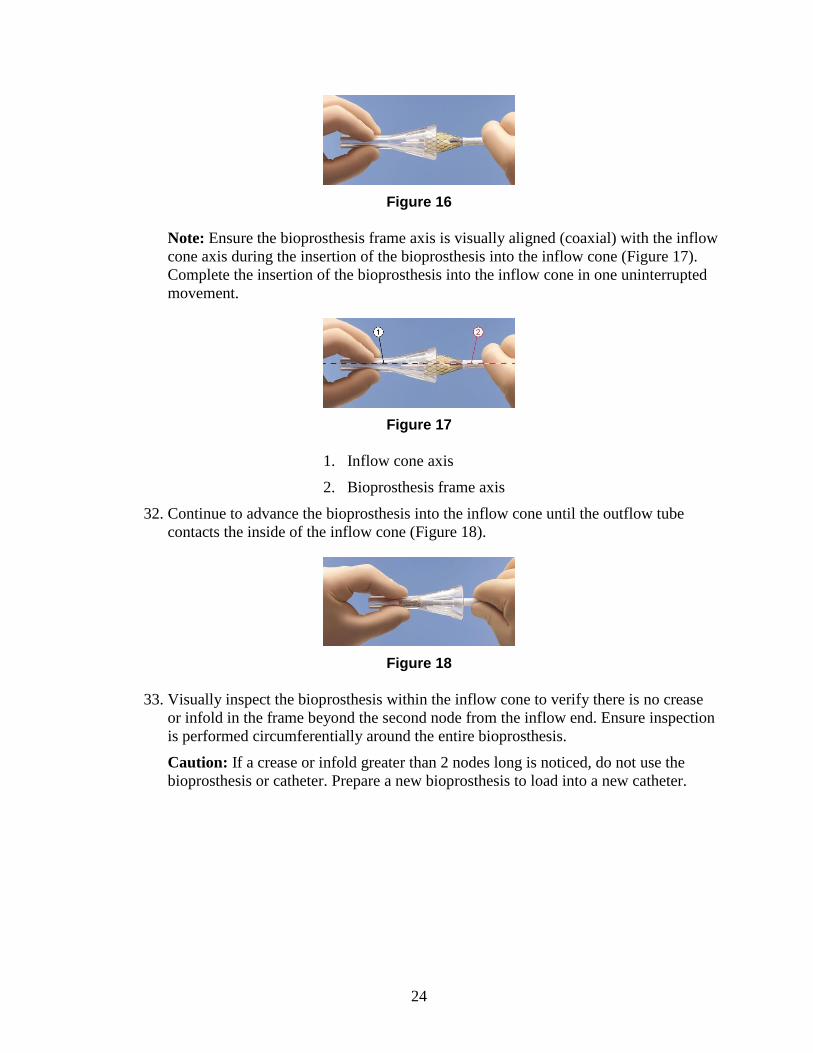
Figure 16
Note: Ensure the bioprosthesis frame axis is visually aligned (coaxial) with the inflow
cone axis during the insertion of the bioprosthesis into the inflow cone (Figure 17).
Complete the insertion of the bioprosthesis into the inflow cone in one uninterrupted
movement.
Figure 17
1. Inflow cone axis
2. Bioprosthesis frame axis
32. Continue to advance the bioprosthesis into the inflow cone until the outflow tube
contacts the inside of the inflow cone (Figure 18).
Figure 18
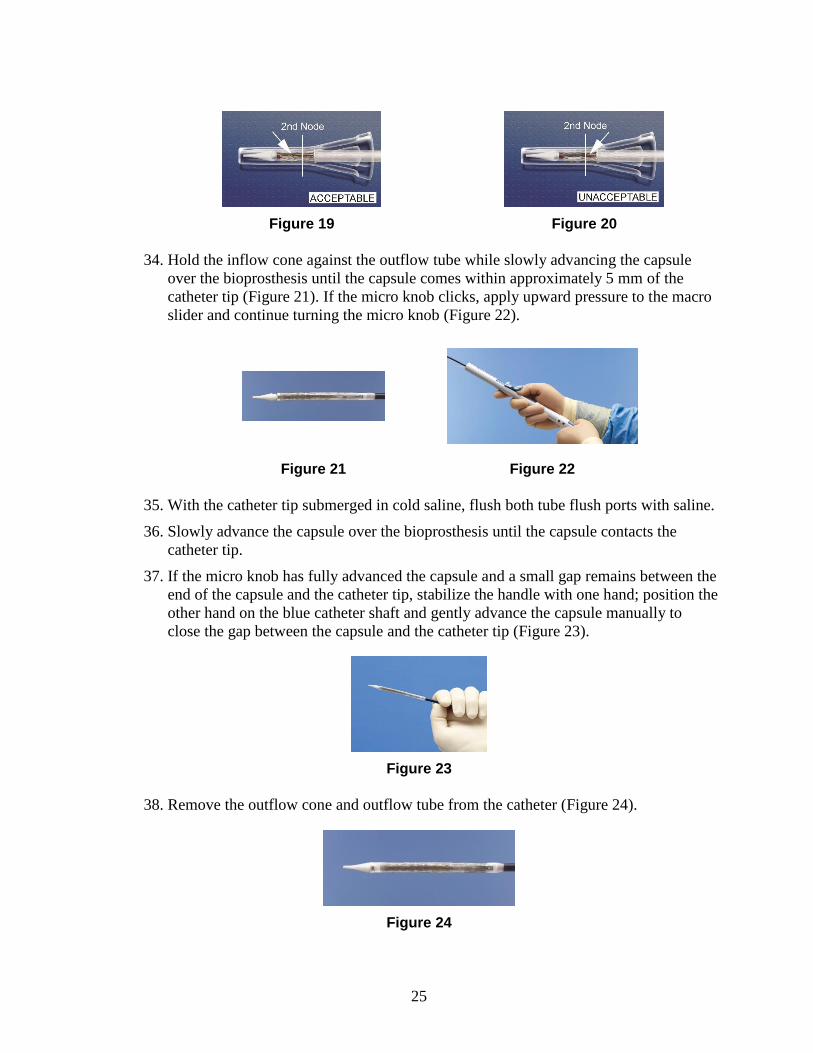
33. Visually inspect the bioprosthesis within the inflow cone to verify there is no crease
or infold in the frame beyond the second node from the inflow end. Ensure inspection
is performed circumferentially around the entire bioprosthesis.
Caution: If a crease or infold greater than 2 nodes long is noticed, do not use the
bioprosthesis or catheter. Prepare a new bioprosthesis to load into a new catheter.
25
Figure 19
Figure 20
34. Hold the inflow cone against the outflow tube while slowly advancing the capsule
over the bioprosthesis until the capsule comes within approximately 5 mm of the
catheter tip (Figure 21). If the micro knob clicks, apply upward pressure to the macro
slider and continue turning the micro knob (Figure 22).
Figure 21 Figure 22
35. With the catheter tip submerged in cold saline, flush both tube flush ports with saline.
36. Slowly advance the capsule over the bioprosthesis until the capsule contacts the
catheter tip.
37. If the micro knob has fully advanced the capsule and a small gap remains between the
end of the capsule and the catheter tip, stabilize the handle with one hand; position the
other hand on the blue catheter shaft and gently advance the capsule manually to
close the gap between the capsule and the catheter tip (Figure 23).
Figure 23
38. Remove the outflow cone and outflow tube from the catheter (Figure 24).
Figure 24
26
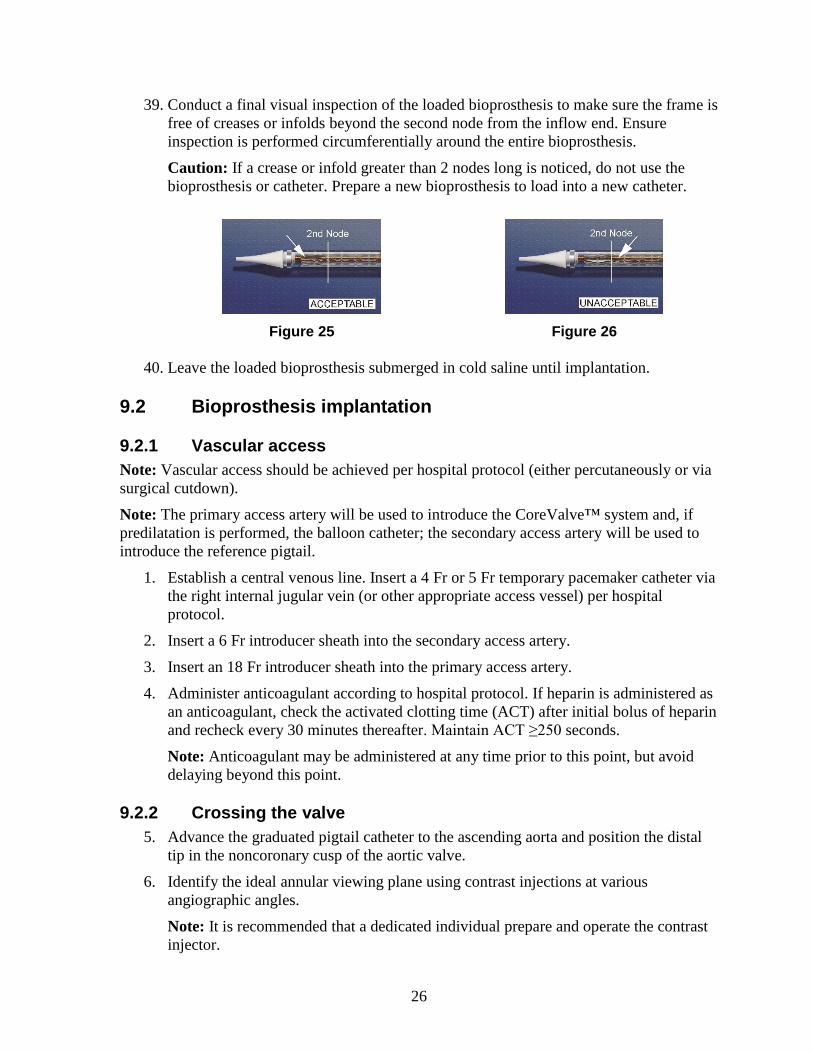
39. Conduct a final visual inspection of the loaded bioprosthesis to make sure the frame is
free of creases or infolds beyond the second node from the inflow end. Ensure
inspection is performed circumferentially around the entire bioprosthesis.
Caution: If a crease or infold greater than 2 nodes long is noticed, do not use the
bioprosthesis or catheter. Prepare a new bioprosthesis to load into a new catheter.
Figure 25
Figure 26
40. Leave the loaded bioprosthesis submerged in cold saline until implantation.
9.2 Bioprosthesis implantation
9.2.1 Vascular access
Note: Vascular access should be achieved per hospital protocol (either percutaneously or via
surgical cutdown).
Note: The primary access artery will be used to introduce the CoreValve™ system and, if
predilatation is performed, the balloon catheter; the secondary access artery will be used to
introduce the reference pigtail.
1. Establish a central venous line. Insert a 4 Fr or 5 Fr temporary pacemaker catheter via
the right internal jugular vein (or other appropriate access vessel) per hospital
protocol.
2. Insert a 6 Fr introducer sheath into the secondary access artery.
3. Insert an 18 Fr introducer sheath into the primary access artery.
4. Administer anticoagulant according to hospital protocol. If heparin is administered as
an anticoagulant, check the activated clotting time (ACT) after initial bolus of heparin
and recheck every 30 minutes thereafter. Maintain ACT ≥250 seconds.
Note: Anticoagulant may be administered at any time prior to this point, but avoid
delaying beyond this point.
9.2.2 Crossing the valve
5. Advance the graduated pigtail catheter to the ascending aorta and position the distal
tip in the noncoronary cusp of the aortic valve.
6. Identify the ideal annular viewing plane using contrast injections at various
angiographic angles.
Note: It is recommended that a dedicated individual prepare and operate the contrast
injector.
27
7. Insert an angiographic catheter over a standard J-tip guidewire into the primary access
sheath and advance to the ascending aorta.
8. Exchange the J-tip guidewire for a 0.035 in (0.889 mm) straight-tip guidewire.
Advance the straight-tip guidewire across the aortic valve into the left ventricle (LV).
9. After crossing the aortic valve with the guidewire, advance the angiographic catheter
into the LV.
10. Exchange the straight-tip guidewire for an exchange-length J-tip guidewire.
11. Exchange the angiographic catheter for a 6 Fr pigtail catheter.
12. Remove the guidewire and connect the catheter to the transducer. Using both
catheters, record the aortic pressure gradient.
13. Using a right anterior oblique (RAO) projection, advance the previously pigtail-
shaped, 0.035 in (0.889 mm) high-support guidewire through the pigtail catheter and
position in the apex of the LV.
14. Remove the pigtail catheter while maintaining guidewire position in the LV.
9.2.3 Predilatation of the implant site
Note: The need for predilatation of the native valve is determined by the heart team.
Information for failed surgical bioprostheses: Balloon predilatation of a stenotic surgical
aortic bioprosthesis has not been evaluated. In cases where there is severe stenosis,
predilatation of the surgical aortic bioprosthesis may be done at the discretion of the heart
team and the steps used are identical to native valve predilatation.
15. Insert the valvuloplasty balloon through the 18 Fr introducer sheath and advance it to
the ascending aorta.
16. Reposition the angiographic equipment to the ideal viewing plane. Position the
valvuloplasty balloon across the valve, while maintaining strict fluoroscopic
surveillance of the distal tip of the guidewire in the LV.
17. Perform balloon valvuloplasty per hospital protocol and remove the valvuloplasty
balloon while maintaining guidewire position across the aortic valve.
9.2.4 Deployment
18. Insert the device over the 0.035 in (0.889 mm) guidewire and into the introducer
sheath with the macro slider facing upward. Advance the device while maintaining
strict fluoroscopic surveillance of the guidewire in the LV.
19. When crossing the aortic arch, it is critical that the guidewire is controlled to prevent
it from moving forward. Without proper management of the distal tip of the
guidewire, the guidewire could move forward and cause trauma to the LV.
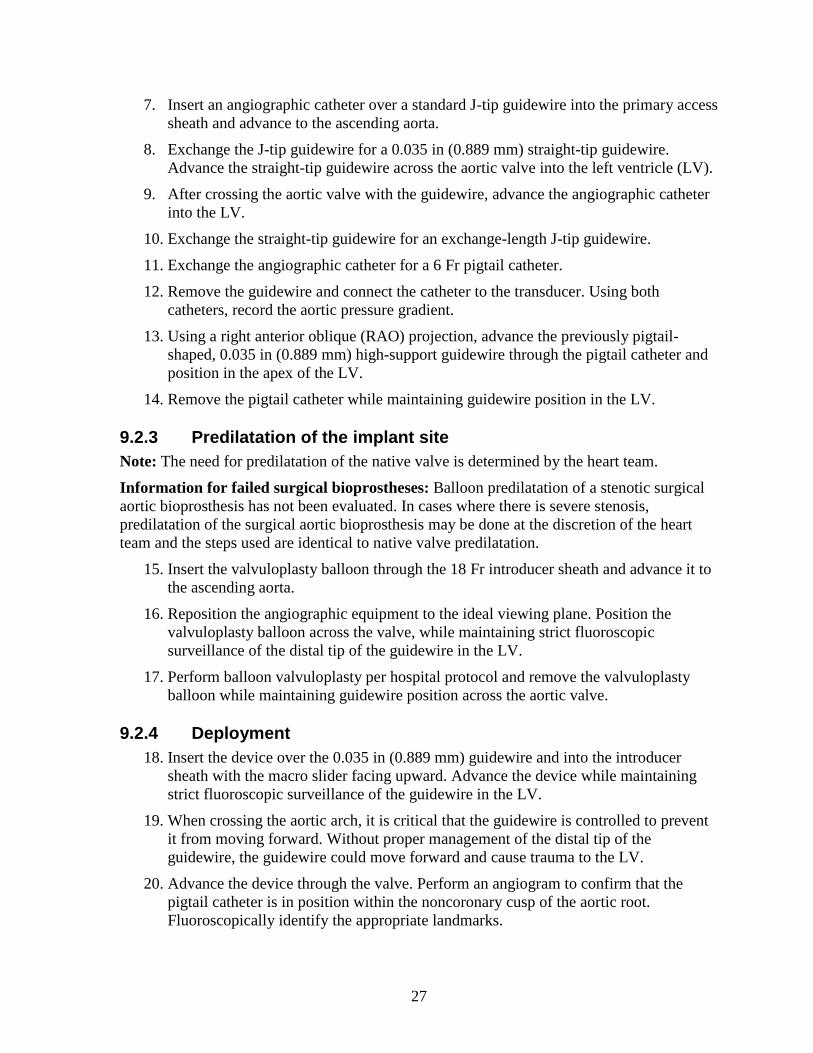
20. Advance the device through the valve. Perform an angiogram to confirm that the
pigtail catheter is in position within the noncoronary cusp of the aortic root.
Fluoroscopically identify the appropriate landmarks.
28
Figure 27
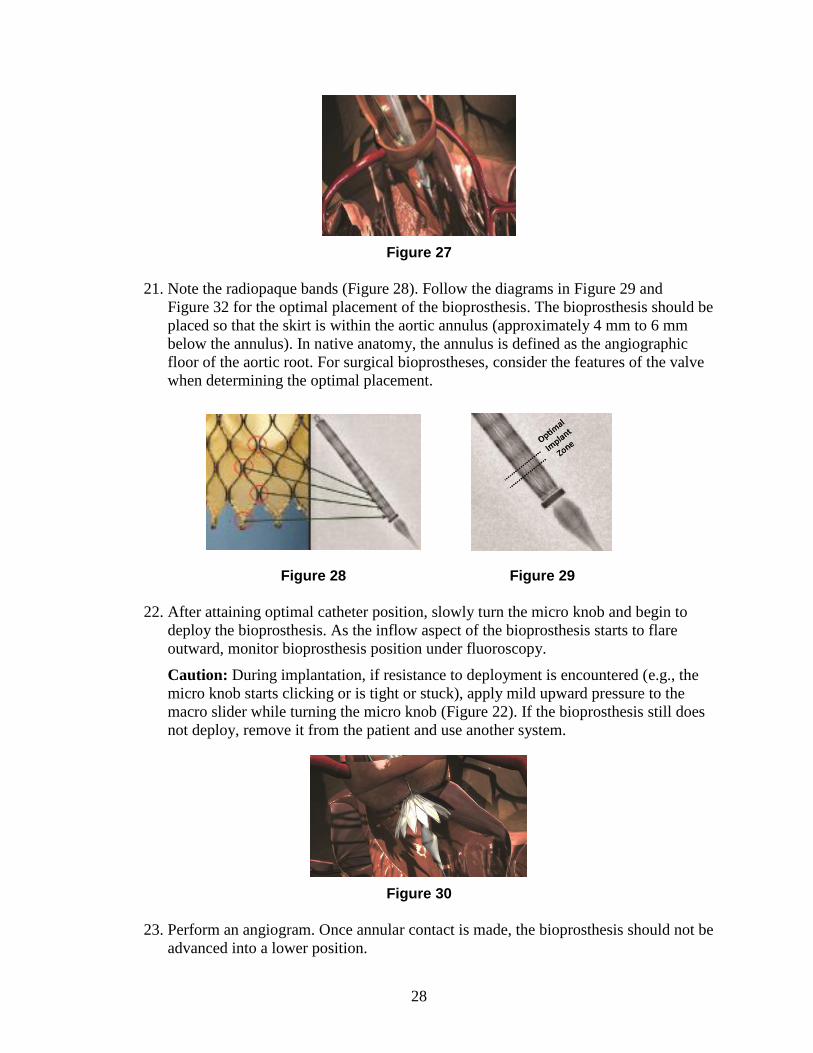
21. Note the radiopaque bands (Figure 28). Follow the diagrams in Figure 29 and
Figure 32 for the optimal placement of the bioprosthesis. The bioprosthesis should be
placed so that the skirt is within the aortic annulus (approximately 4 mm to 6 mm
below the annulus). In native anatomy, the annulus is defined as the angiographic
floor of the aortic root. For surgical bioprostheses, consider the features of the valve
when determining the optimal placement.
Figure 28 Figure 29
22. After attaining optimal catheter position, slowly turn the micro knob and begin to
deploy the bioprosthesis. As the inflow aspect of the bioprosthesis starts to flare
outward, monitor bioprosthesis position under fluoroscopy.
Caution: During implantation, if resistance to deployment is encountered (e.g., the
micro knob starts clicking or is tight or stuck), apply mild upward pressure to the
macro slider while turning the micro knob (Figure 22). If the bioprosthesis still does
not deploy, remove it from the patient and use another system.
Figure 30
23. Perform an angiogram. Once annular contact is made, the bioprosthesis should not be
advanced into a lower position.
29
Note: The force required to move the bioprosthesis into a higher position becomes
noticeably greater once annular contact is made.
24. Continue deploying rapidly to the 2/3 deployment point; stop turning the micro knob.
Note: Shortly after annular contact, the blood pressure will be reduced until the
2/3 deployment point, when the bioprosthesis leaflets are exposed and are
functioning.
Figure 31
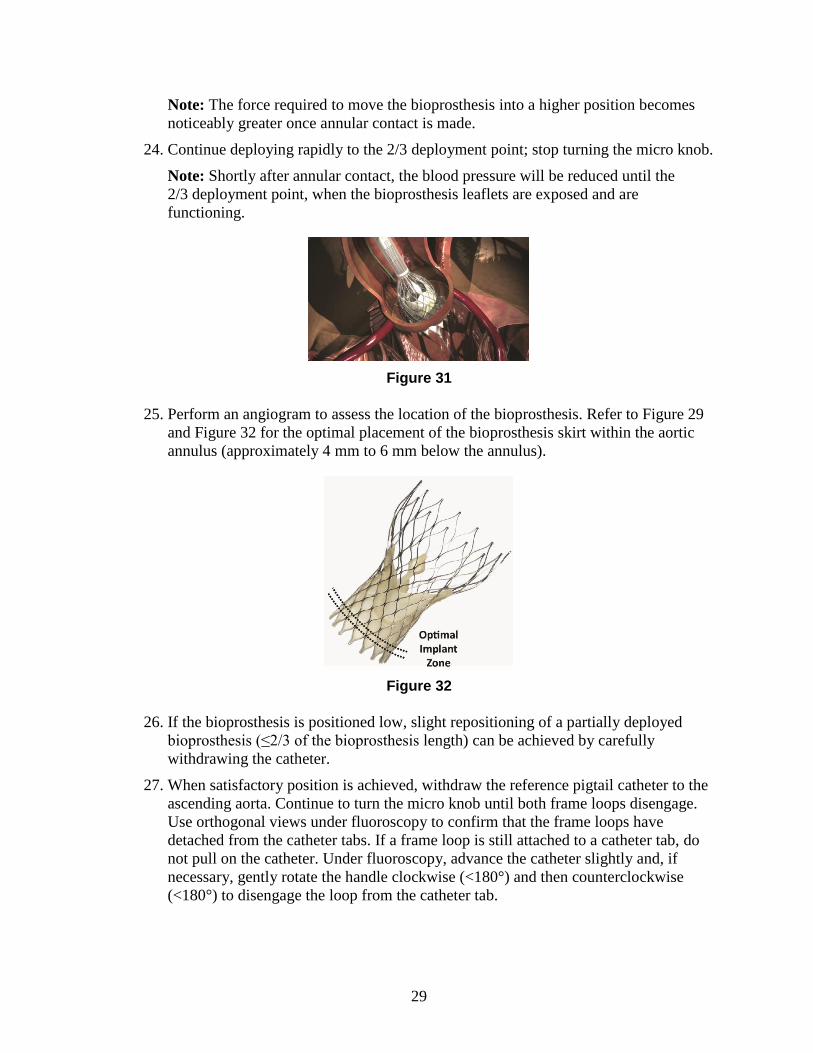
25. Perform an angiogram to assess the location of the bioprosthesis. Refer to Figure 29
and Figure 32 for the optimal placement of the bioprosthesis skirt within the aortic
annulus (approximately 4 mm to 6 mm below the annulus).
Figure 32
26. If the bioprosthesis is positioned low, slight repositioning of a partially deployed
bioprosthesis (≤2/3 of the bioprosthesis length) can be achieved by carefully
withdrawing the catheter.
27. When satisfactory position is achieved, withdraw the reference pigtail catheter to the
ascending aorta. Continue to turn the micro knob until both frame loops disengage.
Use orthogonal views under fluoroscopy to confirm that the frame loops have
detached from the catheter tabs. If a frame loop is still attached to a catheter tab, do
not pull on the catheter. Under fluoroscopy, advance the catheter slightly and, if
necessary, gently rotate the handle clockwise (<180°) and then counterclockwise
(<180°) to disengage the loop from the catheter tab.
30
9.2.5 Postdeployment
28. Under fluoroscopic guidance, confirm that the catheter tip is coaxial with the inflow
portion of the bioprosthesis.
29. Withdraw the catheter to the aorta, while maintaining guidewire position.
Note: For transfemoral access, withdraw the catheter until the catheter tip is
positioned in the descending aorta. For direct aortic access and subclavian access,
withdraw the catheter until the catheter tip is close to the distal tip of the introducer
sheath.
30. Close the capsule and remove the catheter through the 18 Fr introducer sheath.
Note: If the capsule does not close properly, gently rotate the catheter clockwise
(<180°) and then counterclockwise (<180°) until the capsule closes.
Caution: Ensure the capsule is closed before catheter removal. If increased resistance
is encountered when removing the catheter through the introducer sheath, do not
force passage. Increased resistance may indicate a problem and forced passage may
result in damage to the device and/or harm to the patient. If the cause of resistance
cannot be determined or corrected, remove the catheter and introducer sheath as a
single unit over the guidewire, and inspect the catheter and confirm that it is
complete.
31. Dispose of the device in accordance with local regulations and hospital procedures.
32. Advance a 6 Fr pigtail catheter over the guidewire into the LV.
33. Remove the guidewire and connect the pigtail catheter to the transducer.
34. Using both pigtail catheters, record aortic pressure gradient.
35. Remove the 6 Fr pigtail over a standard, J-tip guidewire.
36. Perform a postimplant aortogram with the reference pigtail to ensure coronary
patency and assess aortic regurgitations.
Note: In the event that valve function or sealing is impaired due to excessive
calcification or incomplete expansion, a postimplant balloon dilatation of the
bioprosthesis may improve valve function and sealing. To ensure patient safety, valve
size and patient anatomy must be considered when selecting the size of the balloon
used for dilatation. The balloon size chosen for dilatation should not exceed the
diameter of the native aortic annulus or, for surgical bioprosthetic valves, the
manufacturer’s labeled inner diameter. Refer to the specific balloon catheter
manufacturer’s compliance chart to ensure that the applied inflation pressure does not
result in a balloon diameter that exceeds the indicated annulus range for the
bioprosthesis. Refer to the specific balloon catheter manufacturer’s labeling for
proper instruction on the use of balloon catheter devices. Note: Bench testing has only
been conducted to confirm compatibility with NuMED Z-MED II™ Balloon Aortic
Valvuloplasty catheters where CoreValve™ bioprosthesis device performance was
maintained after dilatation. Data on file.

31
37. Remove the 18 Fr introducer sheath and complete the puncture site closure per
hospital protocol.
38. Perform contrast angiography to verify the absence of any vascular complications.
39. Remove the reference pigtail catheter over a standard guidewire. Remove the 6 Fr
introducer and close the access site per hospital protocol.
40. Administer anticoagulation and/or antiplatelet therapy as required according to
hospital protocol.

32
10.0 Return of explanted bioprostheses
Medtronic is interested in obtaining recovered bioprostheses. Specific pathological studies of
the explanted bioprosthesis will be conducted under the direction of a consulting pathologist.
A written summary of the findings will be returned to the physician. To obtain a product
return kit, contact a Medtronic distribution center or a Medtronic Representative. If a kit is
not available, place the explanted bioprosthesis in a container of glutaraldehyde or 10%
buffered formalin immediately after excision. For further instructions on the return of an
explanted device, contact a Medtronic Representative.
33
11.0 Summary of clinical study
The Medtronic CoreValve™ U.S. Pivotal Trial was designed and executed to evaluate the
safety and effectiveness of the CoreValve™ system to treat symptomatic severe aortic
stenosis in subjects necessitating aortic valve replacement. The trial was divided into
2 cohorts—patients who were determined by a heart team to be at high risk for surgery
(predicted operative mortality of ≥15% [and predicted operative mortality or serious,
irreversible morbidity risk of <50%]) or those who were determined to be at extreme risk for
surgery (irreversible morbidity risk of ≥50% at 30 days). Section 11.2 presents the results of
the High Risk cohort, and Section 11.3 presents the results of the Extreme Risk cohort.
The Medtronic CoreValve™ SURTAVI Trial was designed and executed to evaluate the
safety and efficacy of transcatheter aortic valve implantation (TAVR) in subjects with severe,
symptomatic aortic stenosis (AS) at intermediate surgical risk (heart team agreement of
predicted risk of operative mortality is ≥3% and <15% at 30 days) by randomizing subjects
to either surgical aortic valve replacement (SAVR) or TAVR. Section 11.1 presents the
results of the SURTAVI Trial.
11.1 Intermediate Risk trial (SURTAVI)
The Surgical Replacement and Transcatheter Aortic Valve Implantation (SURTAVI) trial is
a prospective, randomized, unblinded, multi-center investigational study. The purpose of this
trial is to investigate the safety and efficacy of transcatheter aortic valve implantation
(TAVR) in subjects with severe, symptomatic aortic stenosis (AS) at intermediate surgical
risk by randomizing subjects to either surgical aortic valve replacement (SAVR) or TAVR.
A total of 1746 subjects were randomized in this study (879 subjects were randomized to
TAVR and 867 subjects were randomized to surgical aortic valve replacement [SAVR]) at
87 activated centers. Severe aortic stenosis was defined as an aortic valve area of ≤0.8 cm2 or
aortic valve area index ≤0.5 cm2, a mean aortic valve gradient of >40 mmHg or jet velocity
>4 m/sec. The primary objective of the study was to demonstrate that the safety and
effectiveness of the Medtronic CoreValve™ system (TAVR), as measured by all-cause
mortality or disabling stroke at 24 months, is non-inferior to surgical aortic valve
replacement (SAVR) in the treatment of symptomatic severe aortic stenosis in subjects who
have a predicted intermediate risk for aortic valve surgery.
Of the 879 subjects randomized to TAVR, 864 received an attempted implant and comprise
the primary analysis cohort (the modified intention-to-treat [mITT] cohort) TAVR set, while
796 of the 867 randomized to SAVR received an attempted implant and comprise the mITT
SAVR cohort. The implanted population (863 TAVR and 794 SAVR) consists of all subjects
who were implanted with a valve. Of the 863 subjects in the Implanted TAVR group, 724
were attempted with the CoreValve™ system, 139 with the CoreValve™ Evolut™ R system.
The following data summarize the results from the SURTAVI trial.
11.1.1 Patient population
The demographics of the study population are shown in Table 3. The treatment arms were
generally well balanced (i.e., no statistically significant differences were identified between
the treatment arms) with respect to age, gender, baseline NYHA classification, and aggregate
34
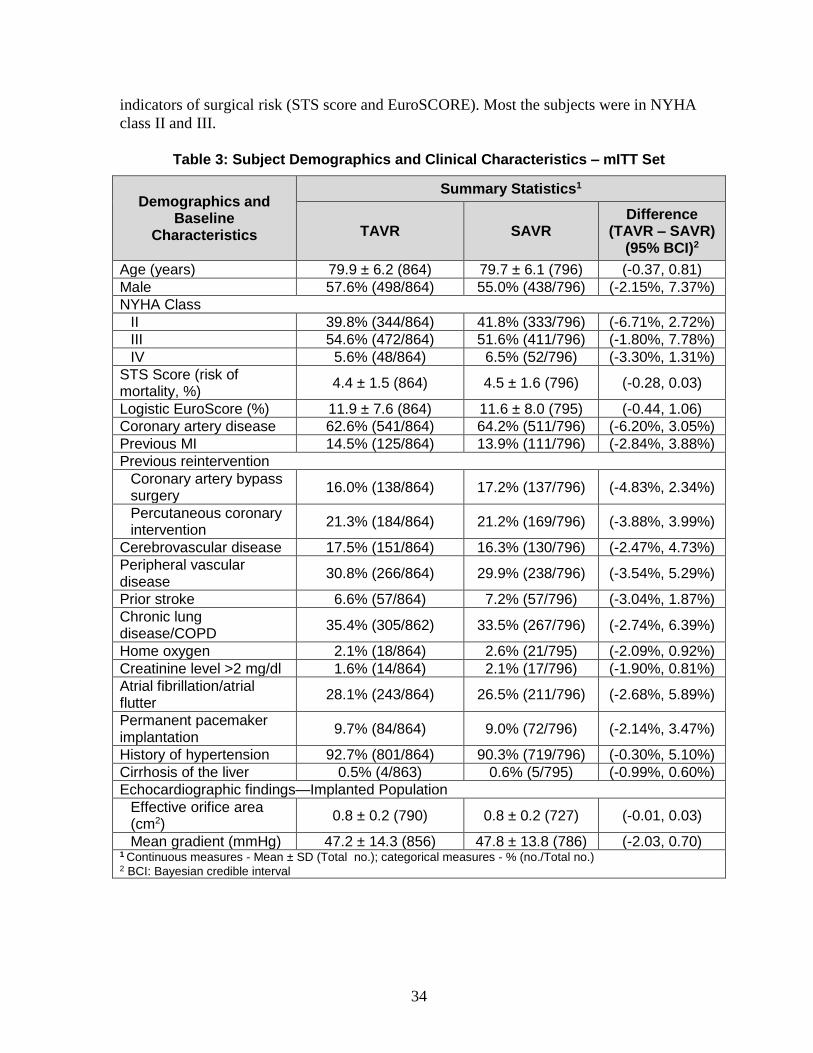
indicators of surgical risk (STS score and EuroSCORE). Most the subjects were in NYHA
class II and III.
Table 3: Subject Demographics and Clinical Characteristics – mITT Set
Demographics and Baseline
Characteristics
Summary Statistics1
TAVR SAVR Difference
(TAVR – SAVR) (95% BCI)2
Age (years) 79.9 ± 6.2 (864) 79.7 ± 6.1 (796) (-0.37, 0.81) Male 57.6% (498/864) 55.0% (438/796) (-2.15%, 7.37%) NYHA Class
II 39.8% (344/864) 41.8% (333/796) (-6.71%, 2.72%) III 54.6% (472/864) 51.6% (411/796) (-1.80%, 7.78%) IV 5.6% (48/864) 6.5% (52/796) (-3.30%, 1.31%)
STS Score (risk of mortality, %)
4.4 ± 1.5 (864) 4.5 ± 1.6 (796) (-0.28, 0.03)
Logistic EuroScore (%) 11.9 ± 7.6 (864) 11.6 ± 8.0 (795) (-0.44, 1.06) Coronary artery disease 62.6% (541/864) 64.2% (511/796) (-6.20%, 3.05%) Previous MI 14.5% (125/864) 13.9% (111/796) (-2.84%, 3.88%) Previous reintervention
Coronary artery bypass surgery
16.0% (138/864) 17.2% (137/796) (-4.83%, 2.34%)
Percutaneous coronary intervention
21.3% (184/864) 21.2% (169/796) (-3.88%, 3.99%)
Cerebrovascular disease 17.5% (151/864) 16.3% (130/796) (-2.47%, 4.73%) Peripheral vascular disease
30.8% (266/864) 29.9% (238/796) (-3.54%, 5.29%)
Prior stroke 6.6% (57/864) 7.2% (57/796) (-3.04%, 1.87%) Chronic lung disease/COPD
35.4% (305/862) 33.5% (267/796) (-2.74%, 6.39%)
Home oxygen 2.1% (18/864) 2.6% (21/795) (-2.09%, 0.92%) Creatinine level >2 mg/dl 1.6% (14/864) 2.1% (17/796) (-1.90%, 0.81%) Atrial fibrillation/atrial flutter
28.1% (243/864) 26.5% (211/796) (-2.68%, 5.89%)
Permanent pacemaker implantation
9.7% (84/864) 9.0% (72/796) (-2.14%, 3.47%)
History of hypertension 92.7% (801/864) 90.3% (719/796) (-0.30%, 5.10%) Cirrhosis of the liver 0.5% (4/863) 0.6% (5/795) (-0.99%, 0.60%) Echocardiographic findings—Implanted Population
Effective orifice area (cm2)
0.8 ± 0.2 (790) 0.8 ± 0.2 (727) (-0.01, 0.03)
Mean gradient (mmHg) 47.2 ± 14.3 (856) 47.8 ± 13.8 (786) (-2.03, 0.70) 1 Continuous measures - Mean ± SD (Total no.); categorical measures - % (no./Total no.) 2 BCI: Bayesian credible interval

35
11.1.2 Procedure data
As shown in Table 4, total time the delivery catheter was in the body was approximately
15 minutes. A majority of TAVR subjects were administered general anesthesia while the
remaining subjects underwent the procedure with conscious sedation. A substantial majority
of the subjects (greater than 90%) has the valve delivered via iliofemoral access and
percutaneous access was more common than surgical cut-down. Balloon predilatation was
performed in approximately half of the subjects and postdilatation was performed in
approximately 30%.
Table 4: Procedural Data Summary for TAVR Subjects – mITT Set
Assessment Summary Statistics1
N=864
Number of Index Procedures 863
Total delivery catheter in the body time (min) 15.0 ± 15.9
Type of Anesthesia
General 75.7% (653/863)
Conscious Sedation 24.3% (210/863)
Respiratory Support Required 69.8% (602/863)
Access Site
Femoral 93.2% (804/863)
Percutaneous 81.3% (654/804)
Surgical cut-down 18.7% (150/804)
Iliac 0.5% (4/863)
Percutaneous 75.0% (3/4)
Surgical cut-down 25.0% (1/4)
Subclavian axillary 2.3% (20/863)
Direct Aortic 4.1% (35/863)
Other 0.0% (0/863)
Total Time in Cath Lab or OR (min) 190.8 ± 61.3
Total Procedure Time (min) 52.3 ± 32.7
Pre-TAVR balloon valvuloplasty performed 47.2% (407/863)
Post-TAVR balloon valvuloplasty performed 29.0% (250/863) 1 Continuous measures - Mean ± SD; categorical measures - % (no./Total no.). Data include subjects with the index procedure defined as the first procedure that the delivery catheter is introduced.
11.1.3 Safety and effectiveness results
11.1.3.1 Primary safety and effectiveness endpoint
The primary objective was to demonstrate that the safety and effectiveness of TAVR using
the Medtronic CoreValve™ and CoreValve™ Evolut™ R systems, as measured by the all-
cause mortality or disabling stroke rate during a fixed follow-up of 24 months, is non-inferior
to SAVR in the treatment of symptomatic severe aortic stenosis in subjects who were
determined by the heart team to be at intermediate surgical risk.
The “early win” assessment of the primary endpoint included all subjects in the mITT
population (N = 1660). The median of the posterior distribution for the primary endpoint
36
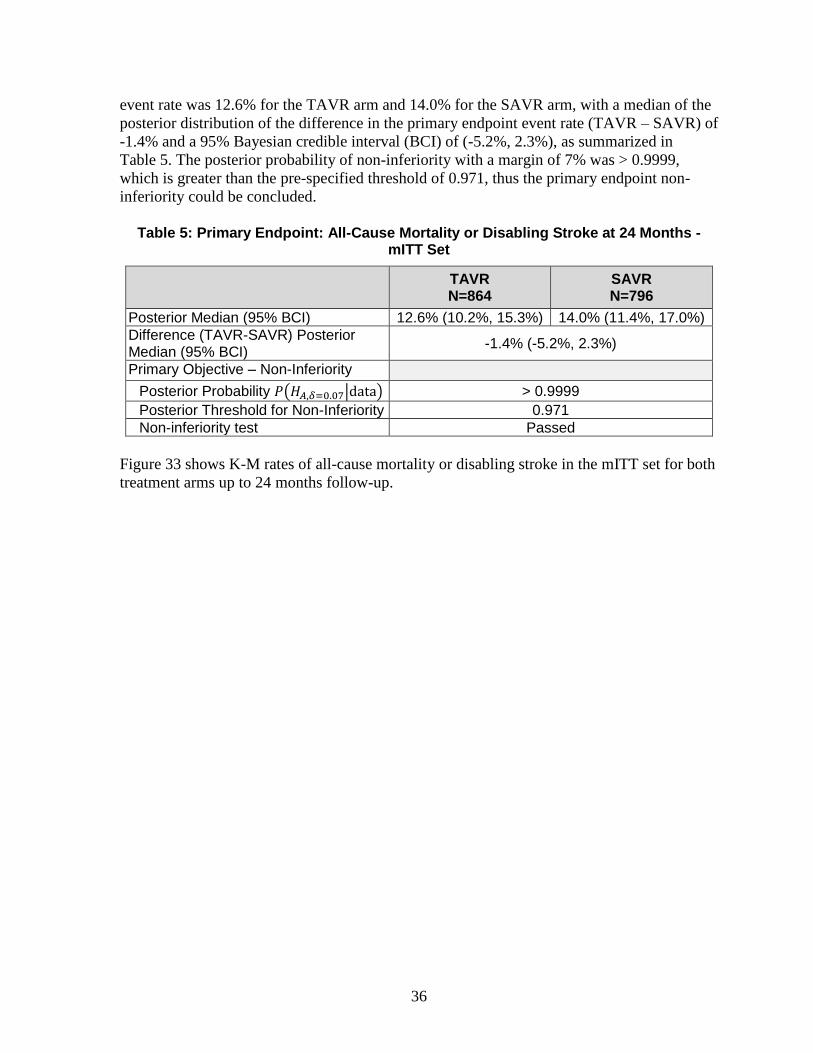
event rate was 12.6% for the TAVR arm and 14.0% for the SAVR arm, with a median of the
posterior distribution of the difference in the primary endpoint event rate (TAVR – SAVR) of
-1.4% and a 95% Bayesian credible interval (BCI) of (-5.2%, 2.3%), as summarized in
Table 5. The posterior probability of non-inferiority with a margin of 7% was > 0.9999,
which is greater than the pre-specified threshold of 0.971, thus the primary endpoint non-
inferiority could be concluded.
Table 5: Primary Endpoint: All-Cause Mortality or Disabling Stroke at 24 Months - mITT Set
TAVR N=864
SAVR N=796
Posterior Median (95% BCI) 12.6% (10.2%, 15.3%) 14.0% (11.4%, 17.0%)
Difference (TAVR-SAVR) Posterior Median (95% BCI)
-1.4% (-5.2%, 2.3%)
Primary Objective – Non-Inferiority
Posterior Probability 𝑃(𝐻𝐴,𝛿=0.07|data) > 0.9999
Posterior Threshold for Non-Inferiority 0.971
Non-inferiority test Passed
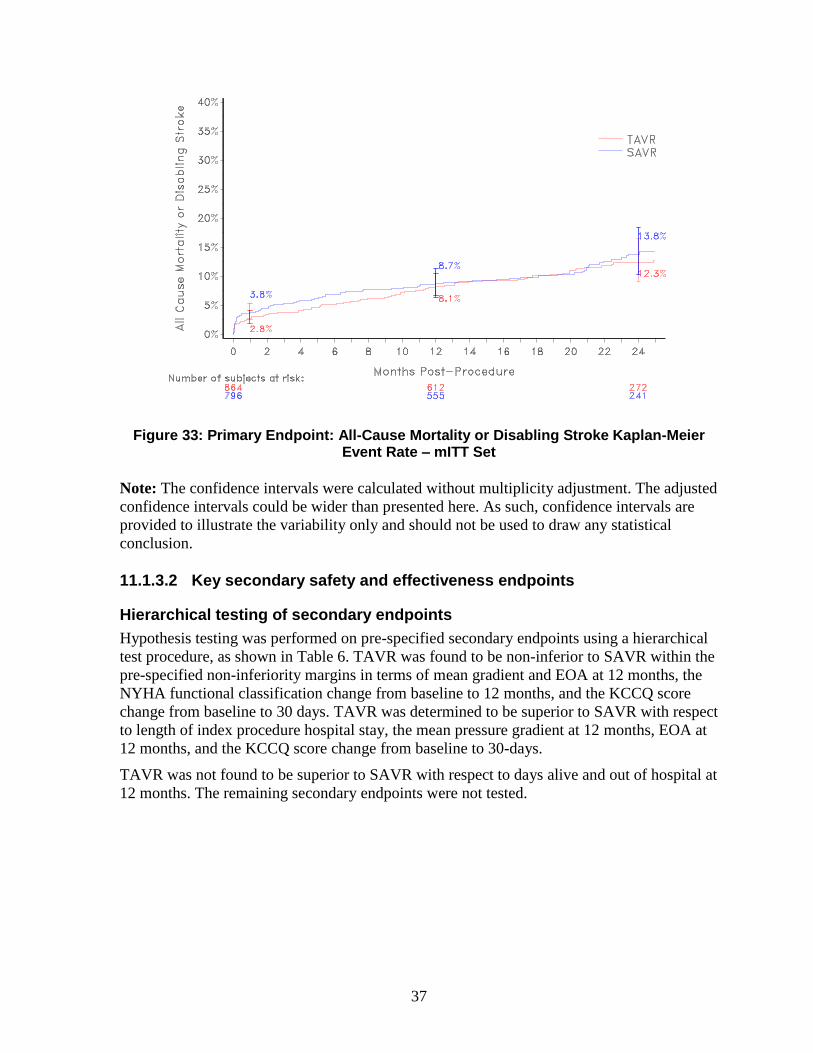
Figure 33 shows K-M rates of all-cause mortality or disabling stroke in the mITT set for both
treatment arms up to 24 months follow-up.
37
Figure 33: Primary Endpoint: All-Cause Mortality or Disabling Stroke Kaplan-Meier Event Rate – mITT Set
Note: The confidence intervals were calculated without multiplicity adjustment. The adjusted
confidence intervals could be wider than presented here. As such, confidence intervals are
provided to illustrate the variability only and should not be used to draw any statistical
conclusion.
11.1.3.2 Key secondary safety and effectiveness endpoints
Hierarchical testing of secondary endpoints
Hypothesis testing was performed on pre-specified secondary endpoints using a hierarchical
test procedure, as shown in Table 6. TAVR was found to be non-inferior to SAVR within the
pre-specified non-inferiority margins in terms of mean gradient and EOA at 12 months, the
NYHA functional classification change from baseline to 12 months, and the KCCQ score
change from baseline to 30 days. TAVR was determined to be superior to SAVR with respect
to length of index procedure hospital stay, the mean pressure gradient at 12 months, EOA at
12 months, and the KCCQ score change from baseline to 30-days.
TAVR was not found to be superior to SAVR with respect to days alive and out of hospital at
12 months. The remaining secondary endpoints were not tested.

38
Table 6: Secondary Endpoints: Hierarchical Testing
Secondary Endpoint
TAVR Mean ± SD (N)
SAVR Mean ± SD
(N)
Difference (TAVR-SAVR)
(95% BCI)
Posterior Probability Pr(HA | data)
Threshold Test
Result
Non-inferiority testing
#1 Mean gradient at 12 months
8.3 ± 4.0 (590)
11.7 ± 5.6 (500)
(-4.0, -2.8) 1.00 0.95 Passed
#2 EOA at 12 months
2.2 ± 0.6 (545)
1.8 ± 0.6 (455)
(0.3, 0.5) 1.00 0.95 Passed
#3 NYHA change (baseline – 12 months)
1.3 ± 0.8 (604)
1.3 ± 0.8 (508)
(-0.1, 0.1) 1.00 0.95 Passed
#4 KCCQ summary score change (30 day – baseline)
18.4 ± 22.8 (819)
5.9 ± 27.0 (700)
(10.0, 15.1) 1.00 0.95 Passed
Superiority testing
#5 Length of index procedure hospital stay
5.8 ± 4.9 (863)
9.8 ± 8.0 (795)
(-4.7, -3.4) 1.00 0.975 Passed
#6 Mean gradient at 12 months
8.3 ± 4.0 (590)
11.7 ± 5.6 (500)
(-4.0, -2.8) 1.00 0.975 Passed
#7 EOA at 12 months
2.2 ± 0.6 (545)
1.8 ± 0.6 (455)
(0.3, 0.5) 1.00 0.975 Passed
#8 KCCQ summary score change (30 day – baseline)
18.4 ± 22.8 (819)
5.9 ± 27.0 (700)
(10.0, 15.1) 1.00 0.975 Passed
Note: The Implanted population was used for the mean gradient and EOA, and the mITT population for the rest.
11.1.3.3 Additional effectiveness data
Valve performance
Effective orifice area (EOA) and mean gradient for TAVR and SAVR subjects are shown in
Figure 34 and Figure 35.
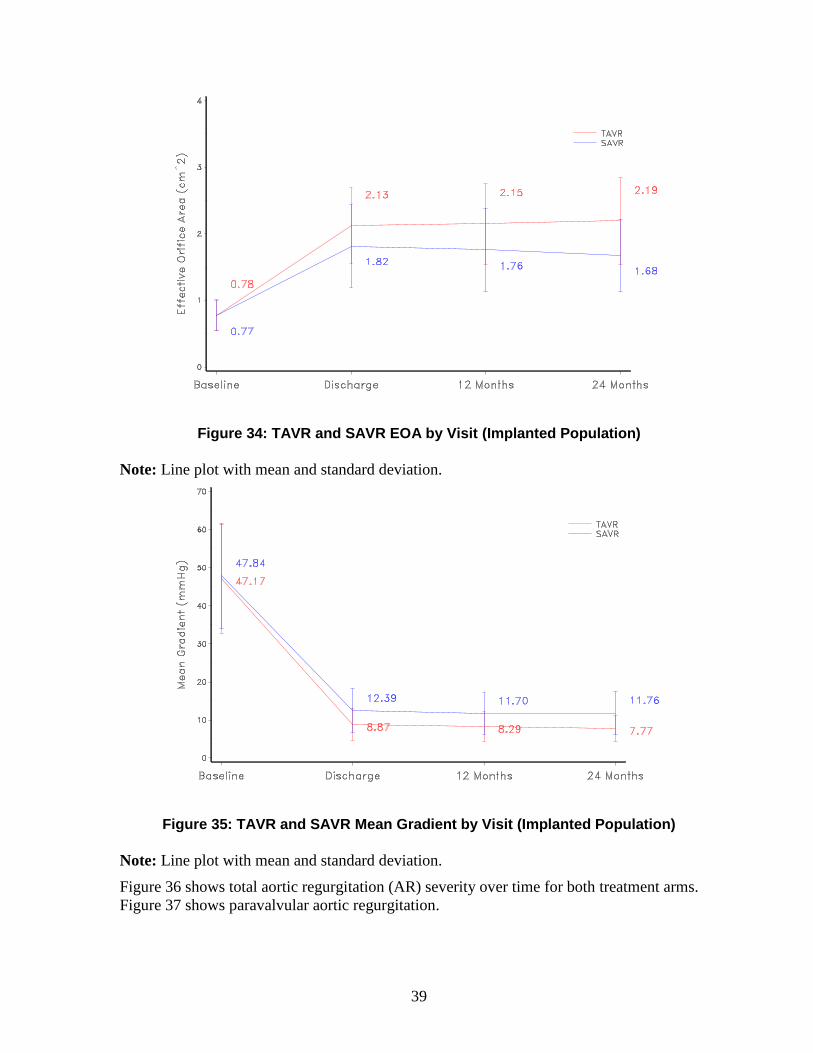
39
Figure 34: TAVR and SAVR EOA by Visit (Implanted Population)
Note: Line plot with mean and standard deviation.
Figure 35: TAVR and SAVR Mean Gradient by Visit (Implanted Population)
Note: Line plot with mean and standard deviation.
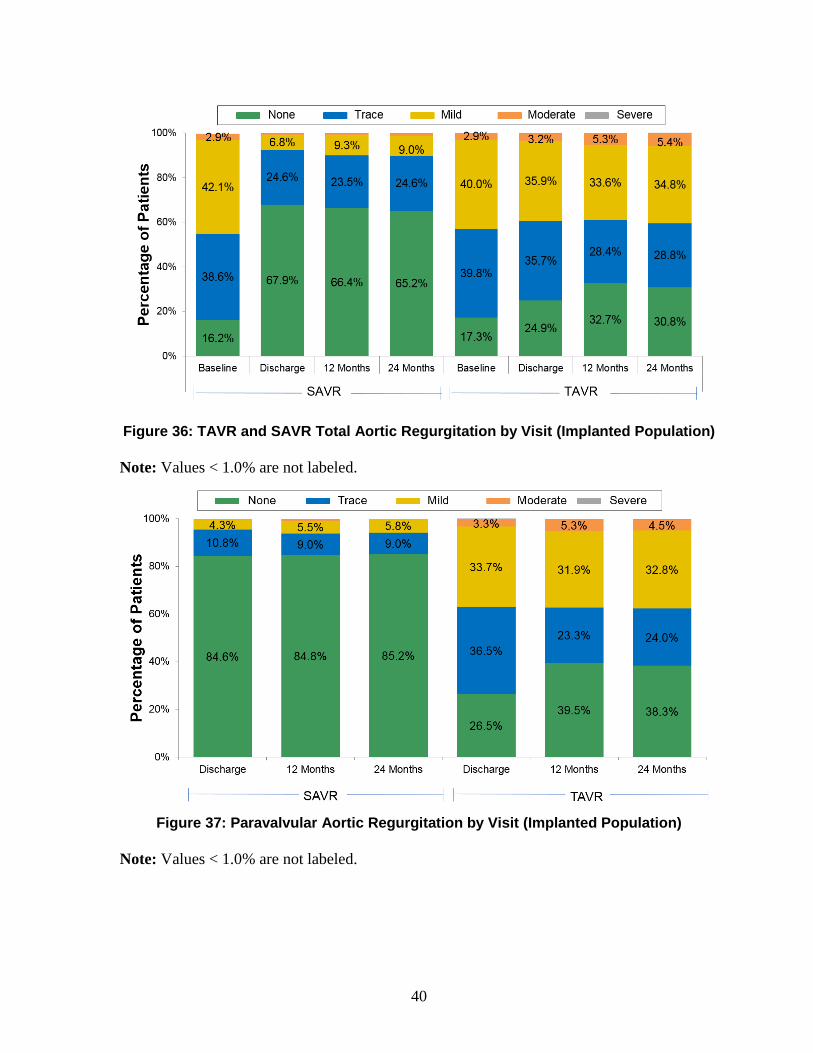
Figure 36 shows total aortic regurgitation (AR) severity over time for both treatment arms.
Figure 37 shows paravalvular aortic regurgitation.
40
Figure 36: TAVR and SAVR Total Aortic Regurgitation by Visit (Implanted Population)
Note: Values < 1.0% are not labeled.
Figure 37: Paravalvular Aortic Regurgitation by Visit (Implanted Population)
Note: Values < 1.0% are not labeled.
41
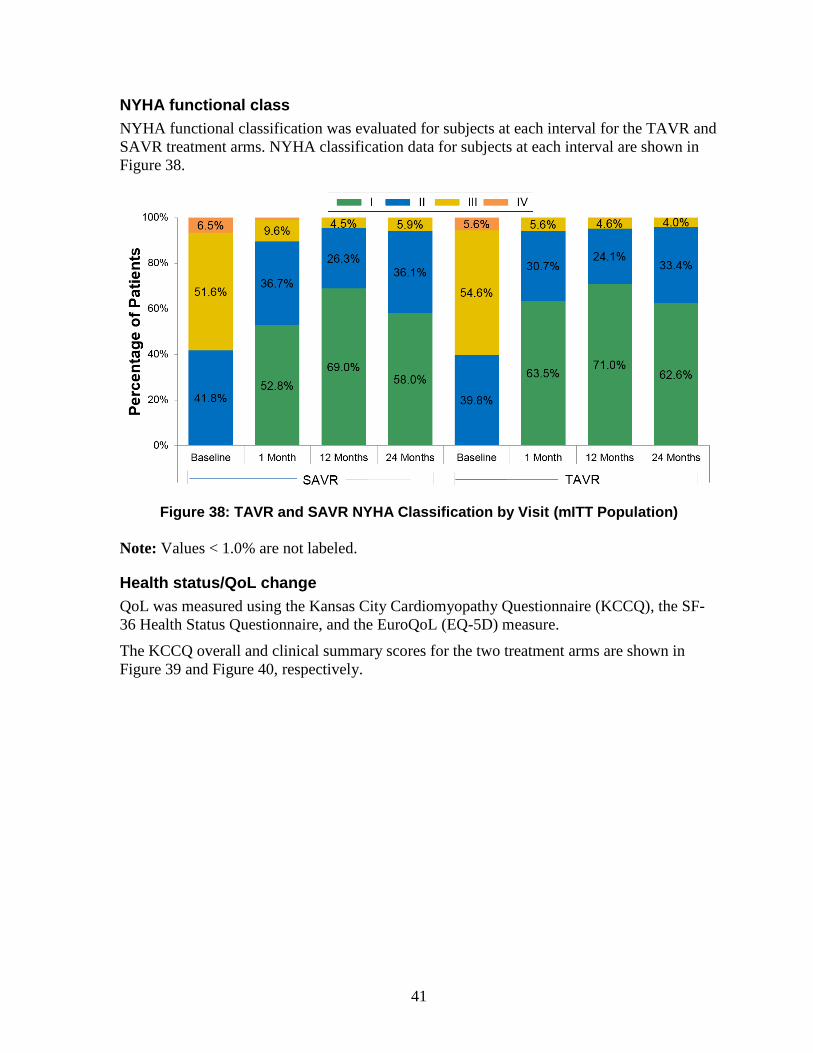
NYHA functional class
NYHA functional classification was evaluated for subjects at each interval for the TAVR and
SAVR treatment arms. NYHA classification data for subjects at each interval are shown in
Figure 38.
Figure 38: TAVR and SAVR NYHA Classification by Visit (mITT Population)
Note: Values < 1.0% are not labeled.
Health status/QoL change
QoL was measured using the Kansas City Cardiomyopathy Questionnaire (KCCQ), the SF-
36 Health Status Questionnaire, and the EuroQoL (EQ-5D) measure.
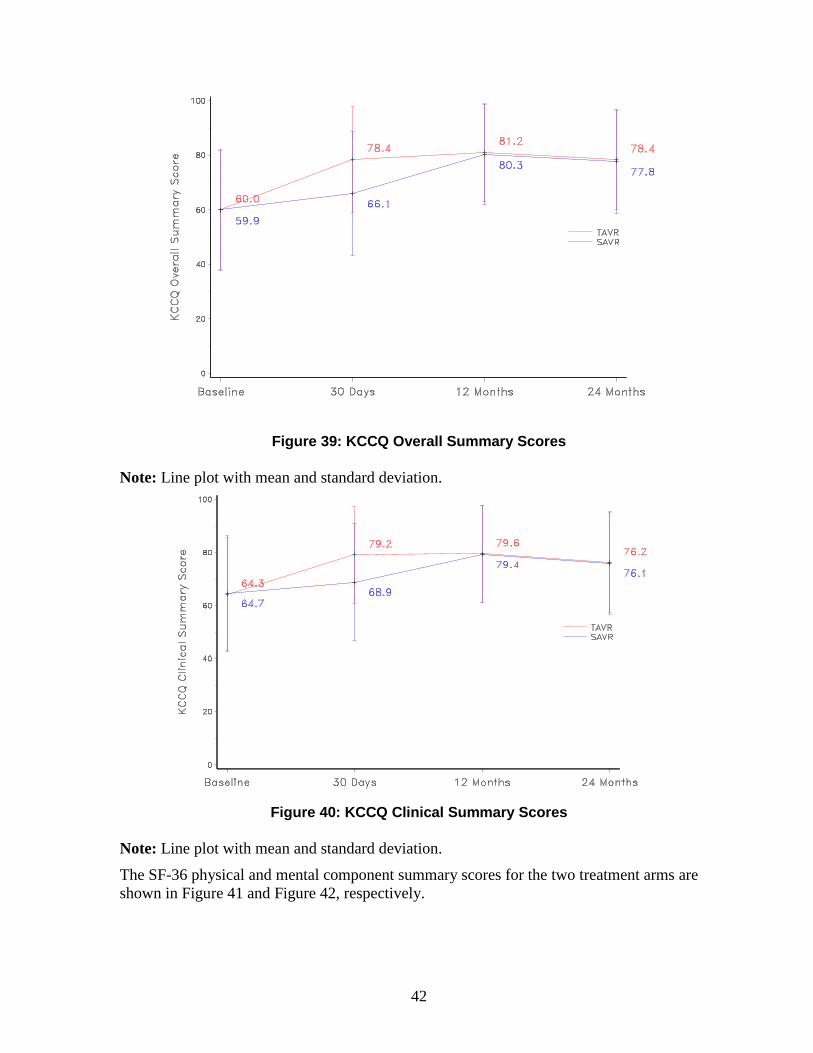
The KCCQ overall and clinical summary scores for the two treatment arms are shown in
Figure 39 and Figure 40, respectively.
42
Figure 39: KCCQ Overall Summary Scores
Note: Line plot with mean and standard deviation.
Figure 40: KCCQ Clinical Summary Scores
Note: Line plot with mean and standard deviation.
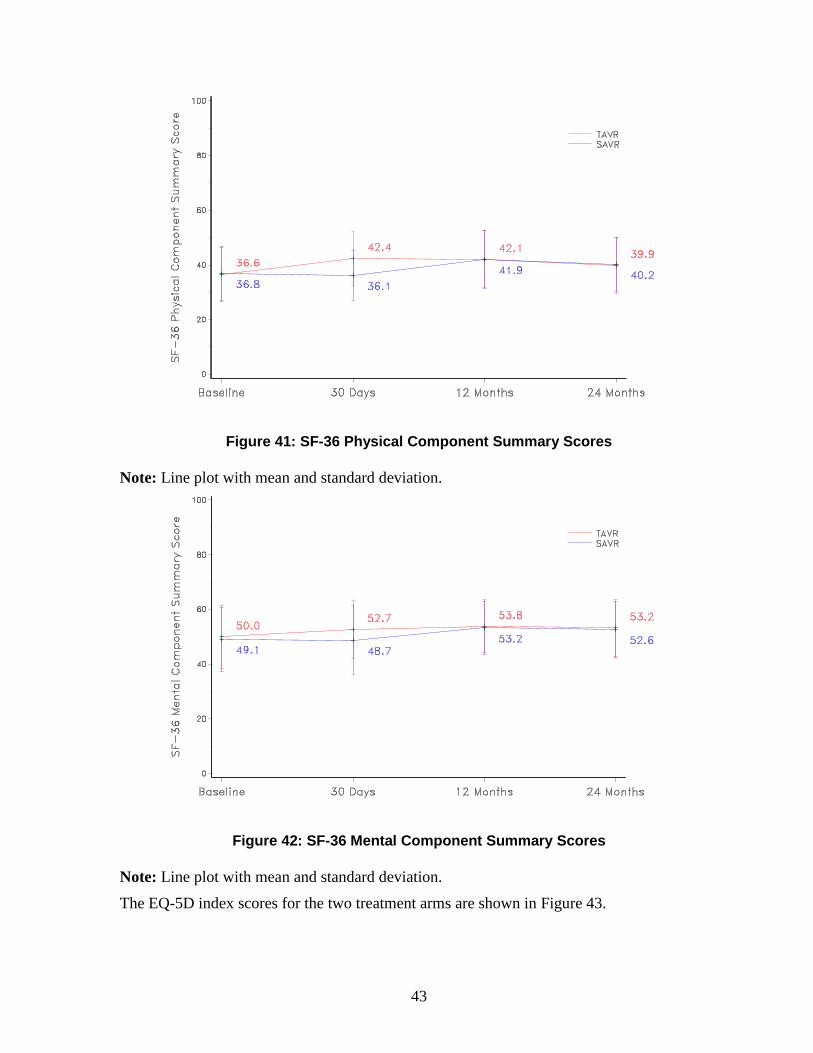
The SF-36 physical and mental component summary scores for the two treatment arms are
shown in Figure 41 and Figure 42, respectively.
43
Figure 41: SF-36 Physical Component Summary Scores
Note: Line plot with mean and standard deviation.
Figure 42: SF-36 Mental Component Summary Scores
Note: Line plot with mean and standard deviation.
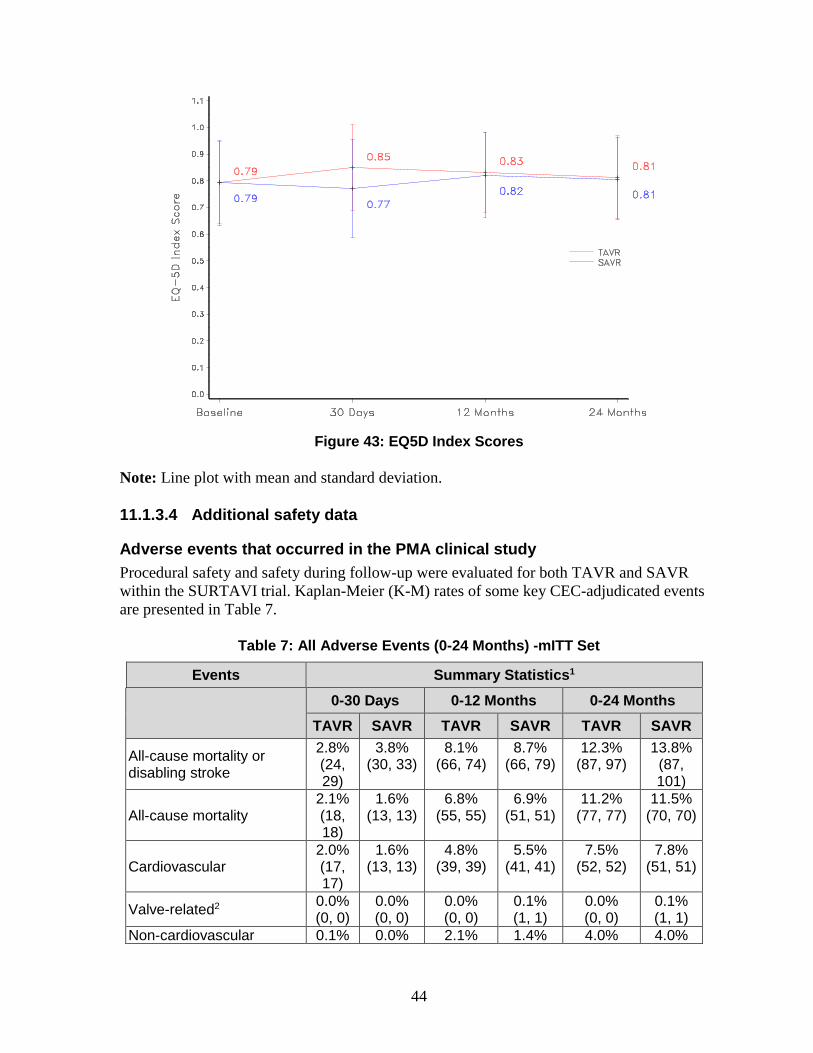
The EQ-5D index scores for the two treatment arms are shown in Figure 43.
44
Figure 43: EQ5D Index Scores
Note: Line plot with mean and standard deviation.
11.1.3.4 Additional safety data
Adverse events that occurred in the PMA clinical study
Procedural safety and safety during follow-up were evaluated for both TAVR and SAVR
within the SURTAVI trial. Kaplan-Meier (K-M) rates of some key CEC-adjudicated events
are presented in Table 7.
Table 7: All Adverse Events (0-24 Months) -mITT Set
Events Summary Statistics1
0-30 Days 0-12 Months 0-24 Months
TAVR SAVR TAVR SAVR TAVR SAVR
All-cause mortality or disabling stroke
2.8% (24, 29)
3.8% (30, 33)
8.1% (66, 74)
8.7% (66, 79)
12.3% (87, 97)
13.8% (87, 101)
All-cause mortality 2.1% (18, 18)
1.6% (13, 13)
6.8% (55, 55)
6.9% (51, 51)
11.2% (77, 77)
11.5% (70, 70)
Cardiovascular 2.0% (17, 17)
1.6% (13, 13)
4.8% (39, 39)
5.5% (41, 41)
7.5% (52, 52)
7.8% (51, 51)
Valve-related2 0.0% (0, 0)
0.0% (0, 0)
0.0% (0, 0)
0.1% (1, 1)
0.0% (0, 0)
0.1% (1, 1)
Non-cardiovascular 0.1% 0.0% 2.1% 1.4% 4.0% 4.0%

45
Events Summary Statistics1
0-30 Days 0-12 Months 0-24 Months
TAVR SAVR TAVR SAVR TAVR SAVR
(1, 1) (0, 0) (16, 16) (10, 10) (25, 25) (19, 19)
Reintervention 0.8% (7, 7)
0.1% (1, 1)
2.1% (17, 19)
0.4% (3, 3)
2.6% (20, 22)
0.4% (3, 3)
All stroke 3.3% (28, 29)
5.4% (43, 45)
5.3% (44, 45)
6.7% (52, 55)
6.3% (48, 50)
8.0% (58, 61)
Disabling stroke 1.2% (10, 11)
2.4% (19, 20)
2.2% (18, 19)
3.4% (26, 28)
2.4% (19, 20)
4.1% (29, 31)
Non-disabling stroke 2.1% (18, 18)
3.0% (24, 25)
3.1% (26, 26)
3.3% (26, 27)
4.1% (30, 30)
4.0% (29, 30)
Life threatening/disabling bleeding
5.7% (49, 51)
5.9% (47, 47)
7.1% (60, 66)
7.8% (60, 61)
8.0% (64, 72)
8.4% (63, 65)
Major vascular complication
5.9% (51, 55)
1.0% (8, 8)
6.3% (54, 59)
1.0% (8, 8)
6.3% (54, 59)
1.0% (8, 8)
Acute kidney injury - Stage 3
0.7% (6, 6)
1.3% (10, 10)
0.7% (6, 6)
1.3% (10, 10)
0.7% (6, 6)
1.3% (10, 10)
MI 0.8% (7, 7)
0.9% (7, 7)
1.9% (15, 15)
1.4% (11, 11)
2.6% (18, 18)
1.9% (13, 13)
Aortic valve hospitalization 2.8% (24, 26)
4.1% (32, 34)
8.4% (68, 104)
7.4% (55, 68)
13.2% (90, 134)
9.0% (62, 85)
Permanent pacemaker implantation3
28.1% (217, 217)
6.8% (48, 48)
31.3% (239, 241)
9.0% (62, 64)
34.6% (253, 257)
10.3% (67, 70)
Permanent pacemaker implantation4
25.6% (220, 220)
6.5% (51, 51)
28.5% (242, 244)
8.6% (66, 68)
31.5% (256, 260)
9.8% (71, 74)
1 Kaplan-Meier rate (# patients, # events). 2 Valve-related death is any death caused by structural or non-structural valve dysfunction or aortic valve re-intervention. 3 Subjects with pacemaker or ICD at baseline are not included. Not adjudicated by CEC. 4 Subjects with pacemaker or ICD at baseline are included. Not adjudicated by CEC.
11.1.4 Additional study observations
11.1.4.1 Pre-specified analyses
The primary endpoint was examined for treatment arm differences in outcome between the
stratified randomization designation (revascularization or no revascularization) and gender.
46
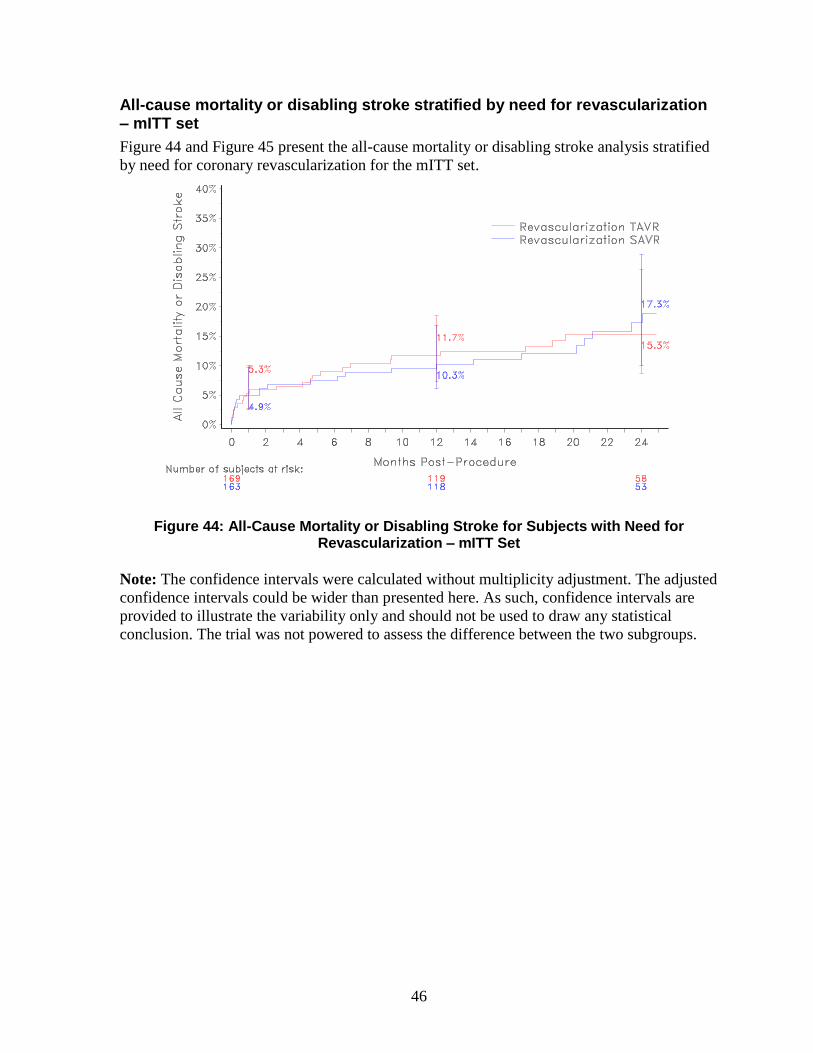
All-cause mortality or disabling stroke stratified by need for revascularization – mITT set
Figure 44 and Figure 45 present the all-cause mortality or disabling stroke analysis stratified
by need for coronary revascularization for the mITT set.
Figure 44: All-Cause Mortality or Disabling Stroke for Subjects with Need for Revascularization – mITT Set
Note: The confidence intervals were calculated without multiplicity adjustment. The adjusted
confidence intervals could be wider than presented here. As such, confidence intervals are
provided to illustrate the variability only and should not be used to draw any statistical
conclusion. The trial was not powered to assess the difference between the two subgroups.
47
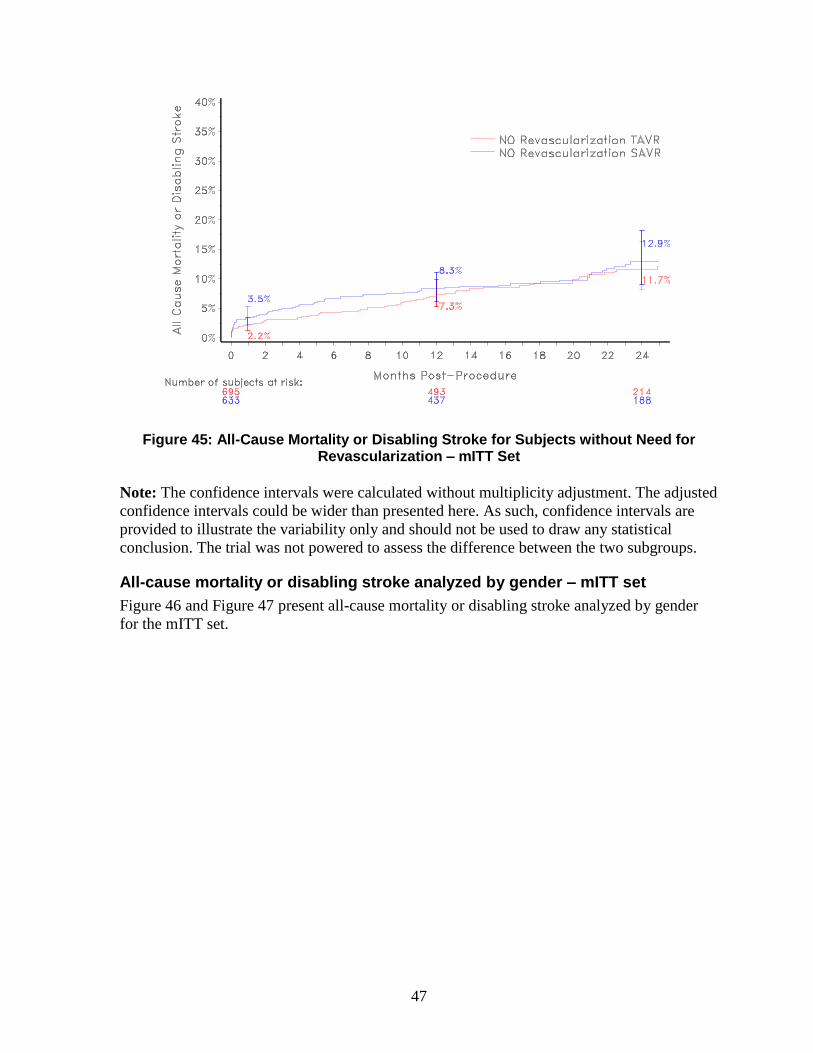
Figure 45: All-Cause Mortality or Disabling Stroke for Subjects without Need for Revascularization – mITT Set
Note: The confidence intervals were calculated without multiplicity adjustment. The adjusted
confidence intervals could be wider than presented here. As such, confidence intervals are
provided to illustrate the variability only and should not be used to draw any statistical
conclusion. The trial was not powered to assess the difference between the two subgroups.
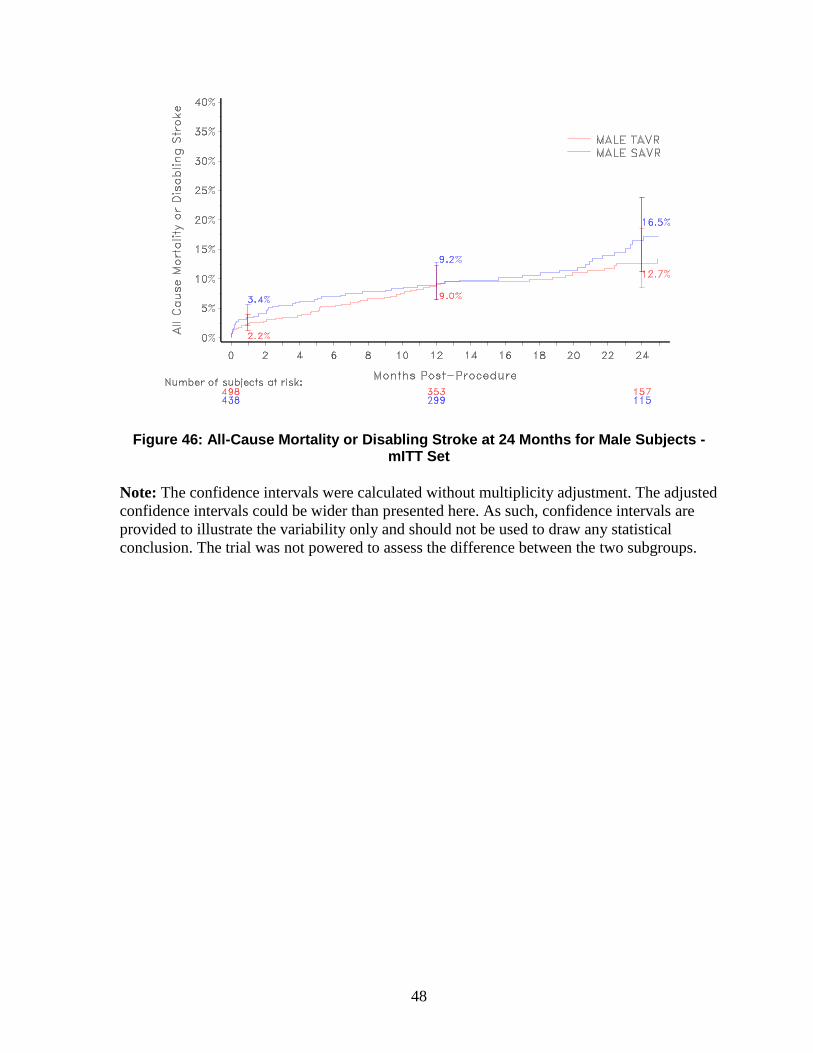
All-cause mortality or disabling stroke analyzed by gender – mITT set
Figure 46 and Figure 47 present all-cause mortality or disabling stroke analyzed by gender
for the mITT set.
48
Figure 46: All-Cause Mortality or Disabling Stroke at 24 Months for Male Subjects - mITT Set
Note: The confidence intervals were calculated without multiplicity adjustment. The adjusted
confidence intervals could be wider than presented here. As such, confidence intervals are
provided to illustrate the variability only and should not be used to draw any statistical
conclusion. The trial was not powered to assess the difference between the two subgroups.
49
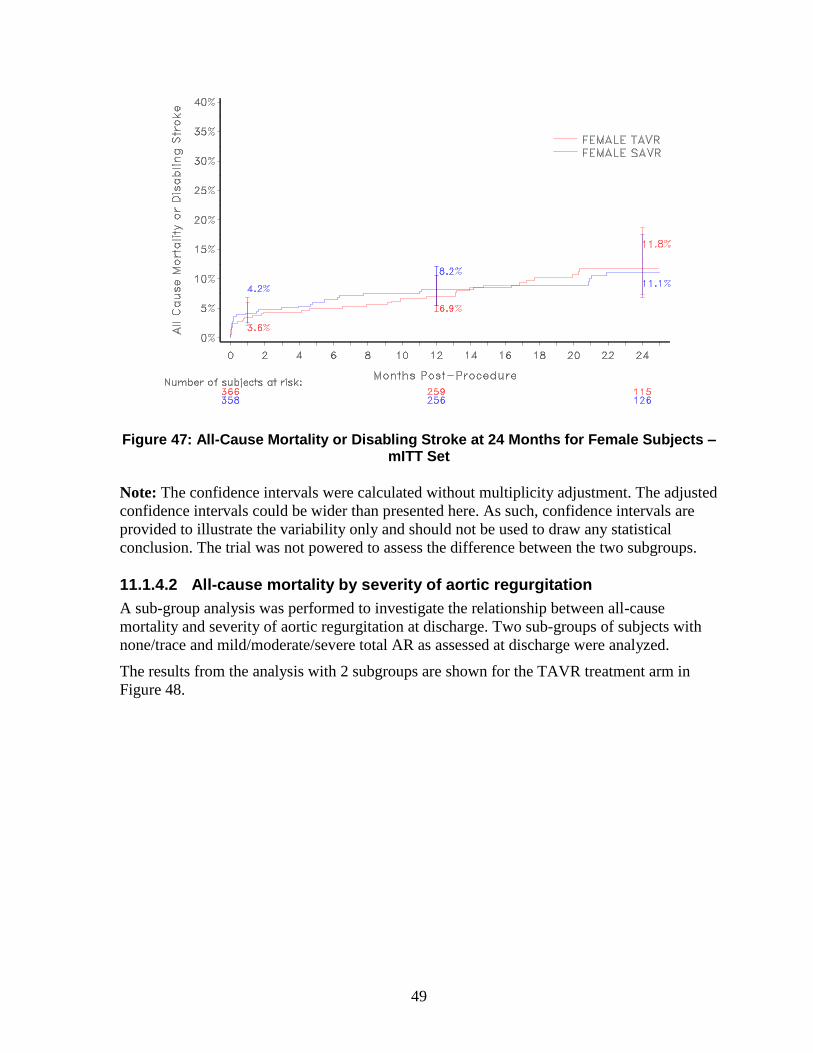
Figure 47: All-Cause Mortality or Disabling Stroke at 24 Months for Female Subjects – mITT Set
Note: The confidence intervals were calculated without multiplicity adjustment. The adjusted
confidence intervals could be wider than presented here. As such, confidence intervals are
provided to illustrate the variability only and should not be used to draw any statistical
conclusion. The trial was not powered to assess the difference between the two subgroups.
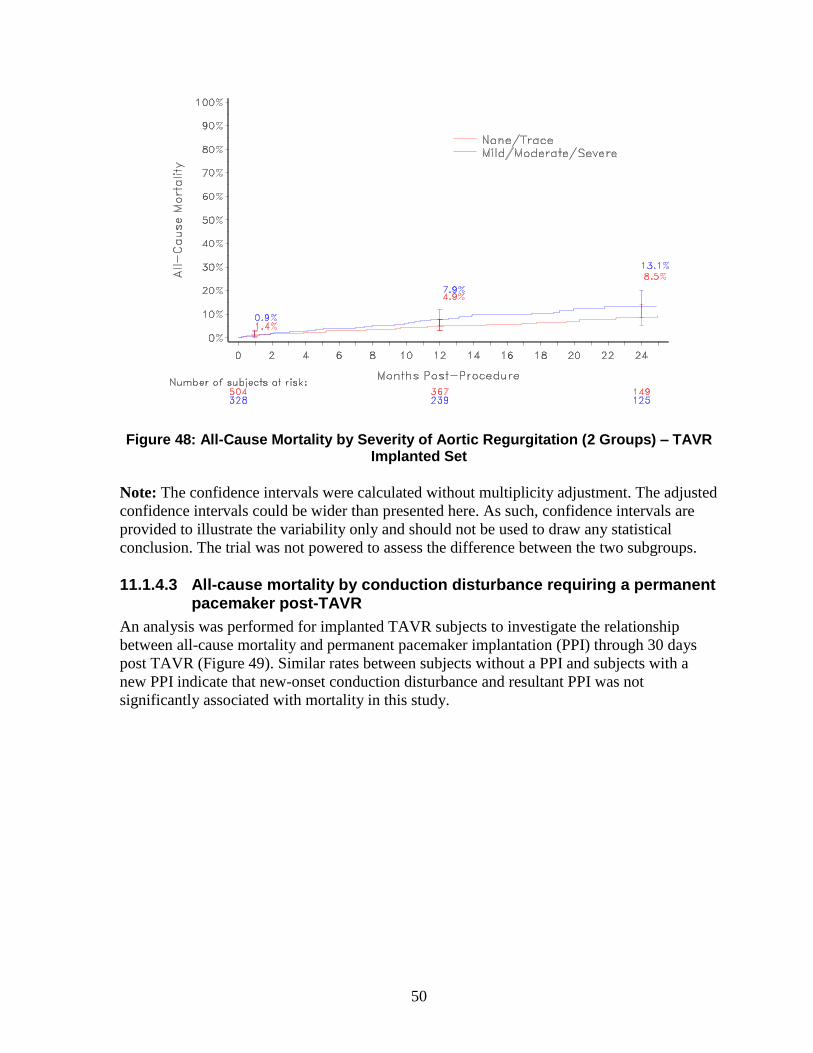
11.1.4.2 All-cause mortality by severity of aortic regurgitation
A sub-group analysis was performed to investigate the relationship between all-cause
mortality and severity of aortic regurgitation at discharge. Two sub-groups of subjects with
none/trace and mild/moderate/severe total AR as assessed at discharge were analyzed.
The results from the analysis with 2 subgroups are shown for the TAVR treatment arm in
Figure 48.
50
Figure 48: All-Cause Mortality by Severity of Aortic Regurgitation (2 Groups) – TAVR Implanted Set
Note: The confidence intervals were calculated without multiplicity adjustment. The adjusted
confidence intervals could be wider than presented here. As such, confidence intervals are
provided to illustrate the variability only and should not be used to draw any statistical
conclusion. The trial was not powered to assess the difference between the two subgroups.
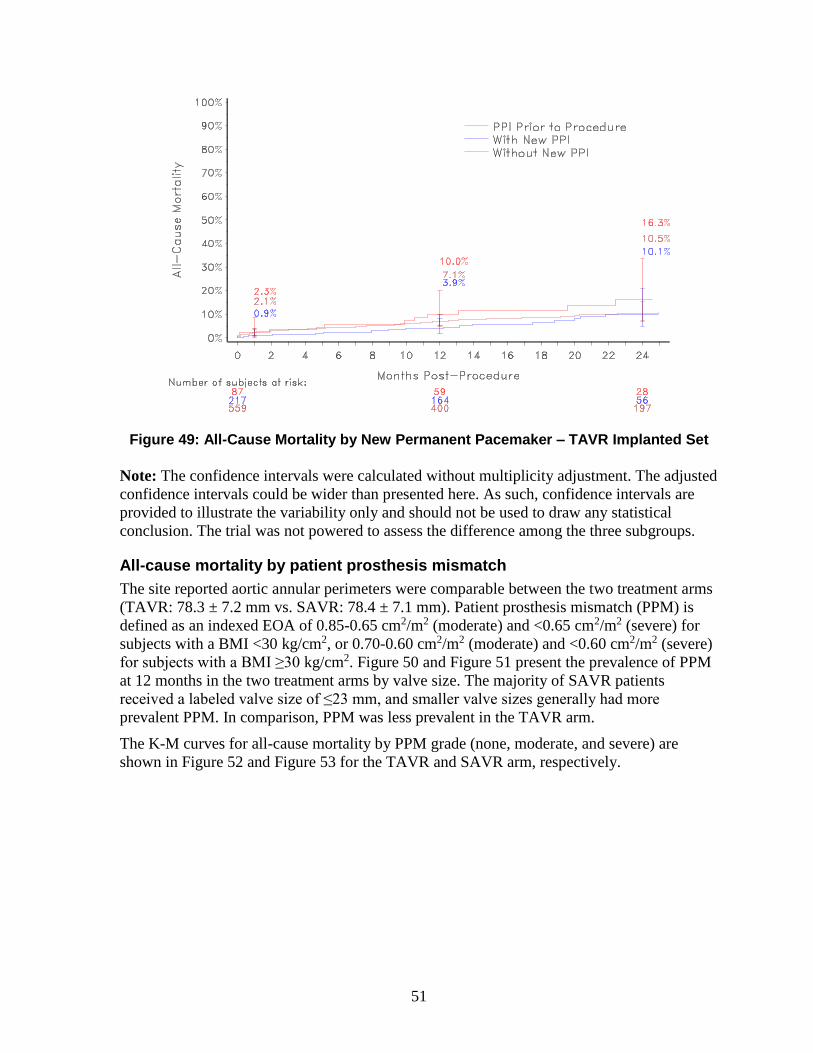
11.1.4.3 All-cause mortality by conduction disturbance requiring a permanent pacemaker post-TAVR
An analysis was performed for implanted TAVR subjects to investigate the relationship
between all-cause mortality and permanent pacemaker implantation (PPI) through 30 days
post TAVR (Figure 49). Similar rates between subjects without a PPI and subjects with a
new PPI indicate that new-onset conduction disturbance and resultant PPI was not
significantly associated with mortality in this study.
51
Figure 49: All-Cause Mortality by New Permanent Pacemaker – TAVR Implanted Set
Note: The confidence intervals were calculated without multiplicity adjustment. The adjusted
confidence intervals could be wider than presented here. As such, confidence intervals are
provided to illustrate the variability only and should not be used to draw any statistical
conclusion. The trial was not powered to assess the difference among the three subgroups.
All-cause mortality by patient prosthesis mismatch
The site reported aortic annular perimeters were comparable between the two treatment arms
(TAVR: 78.3 ± 7.2 mm vs. SAVR: 78.4 ± 7.1 mm). Patient prosthesis mismatch (PPM) is
defined as an indexed EOA of 0.85-0.65 cm2/m2 (moderate) and <0.65 cm2/m2 (severe) for
subjects with a BMI <30 kg/cm2, or 0.70-0.60 cm2/m2 (moderate) and <0.60 cm2/m2 (severe)
for subjects with a BMI ≥30 kg/cm2. Figure 50 and Figure 51 present the prevalence of PPM
at 12 months in the two treatment arms by valve size. The majority of SAVR patients
received a labeled valve size of ≤23 mm, and smaller valve sizes generally had more
prevalent PPM. In comparison, PPM was less prevalent in the TAVR arm.
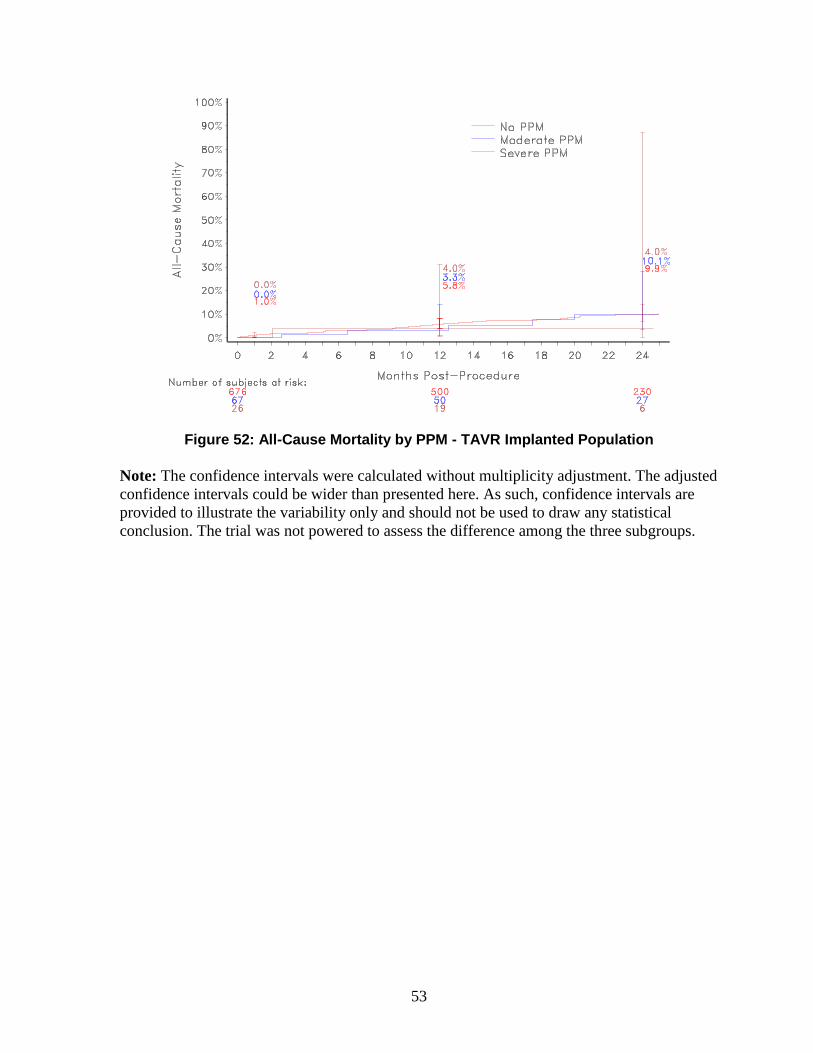
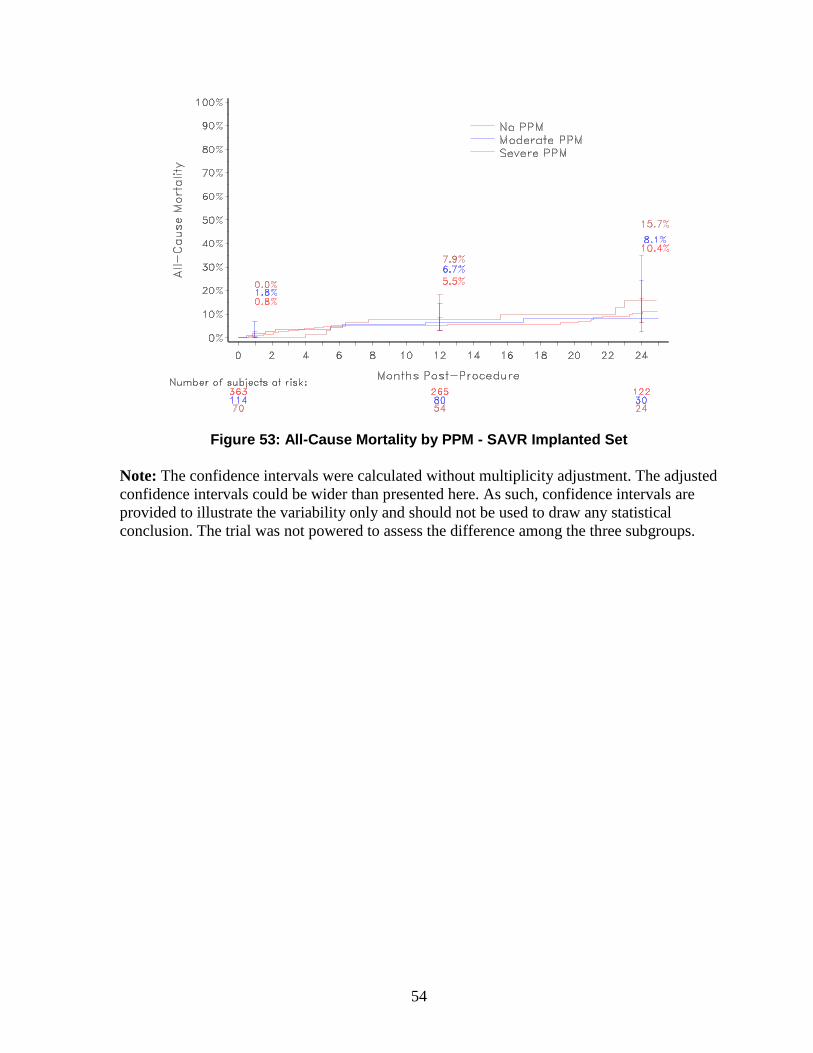
The K-M curves for all-cause mortality by PPM grade (none, moderate, and severe) are
shown in Figure 52 and Figure 53 for the TAVR and SAVR arm, respectively.

52
Figure 50: Prevalence of PPM at 12 Months in the TAVR Arm by Valve Size
Figure 51: Prevalence of PPM at 12 Months in the SAVR Arm by Valve Size
53
Figure 52: All-Cause Mortality by PPM - TAVR Implanted Population
Note: The confidence intervals were calculated without multiplicity adjustment. The adjusted
confidence intervals could be wider than presented here. As such, confidence intervals are
provided to illustrate the variability only and should not be used to draw any statistical
conclusion. The trial was not powered to assess the difference among the three subgroups.
54
Figure 53: All-Cause Mortality by PPM - SAVR Implanted Set
Note: The confidence intervals were calculated without multiplicity adjustment. The adjusted
confidence intervals could be wider than presented here. As such, confidence intervals are
provided to illustrate the variability only and should not be used to draw any statistical
conclusion. The trial was not powered to assess the difference among the three subgroups.
55
11.2 High Risk cohort
The CoreValve™ U.S. Pivotal Trial High Risk cohort was a prospective, randomized,
unblinded, multi-center investigational study. Patients were stratified by intended access site
(iliofemoral or non-iliofemoral) prior to randomization to ensure patients were allocated to
each comparison group proportionately. Prior to randomization, patients were first evaluated
for iliofemoral access. If patients were not eligible for iliofemoral access due to their
inadequate vasculature or peripheral vascular disease, they were then considered for non-
iliofemoral access. Patients were then individually evaluated for subclavian or direct aortic
access.
The purpose of the study was to evaluate the safety and effectiveness of the Medtronic
CoreValve™ system in the treatment of symptomatic severe aortic stenosis in subjects
necessitating aortic valve replacement, with predicted operative mortality of ≥ 15% (and
predicted operative mortality or serious, irreversible morbidity risk of < 50%) at 30 days
(High Risk).
The High Risk cohort enrolled a total of 795 subjects with symptomatic severe aortic stenosis
(394 subjects were randomized to transcatheter aortic valve replacement [TAVR] and
401 subjects were randomized to surgical aortic valve replacement [SAVR]) at 45 activated
centers in the United States. Severe aortic stenosis was defined as an aortic valve area of
≤0.8 cm2 or aortic valve area index ≤0.5 cm2, a mean aortic valve gradient of >40 mmHg or
jet velocity >4 m/sec. The primary endpoint of the study was to demonstrate that the safety
and effectiveness of the Medtronic CoreValve™ system (TAVR), as measured by all-cause
death at 12 months, is non-inferior to surgical aortic valve replacement (SAVR) in the
treatment of symptomatic severe aortic stenosis in subjects who have a predicted high risk for
aortic valve surgery.
Of the 394 subjects randomized to TAVR, 390 received an attempted implant and comprise
the as treated (AT) TAVR population while 357 of the 401 subjects randomized to SAVR
received an attempted implant and comprise the AT SAVR population.
The following data summarize the results from the High Risk cohort (TAVR iliofemoral and
TAVR non-iliofemoral vs. SAVR iliofemoral eligible and SAVR non-iliofemoral eligible).
11.2.1 Patient population
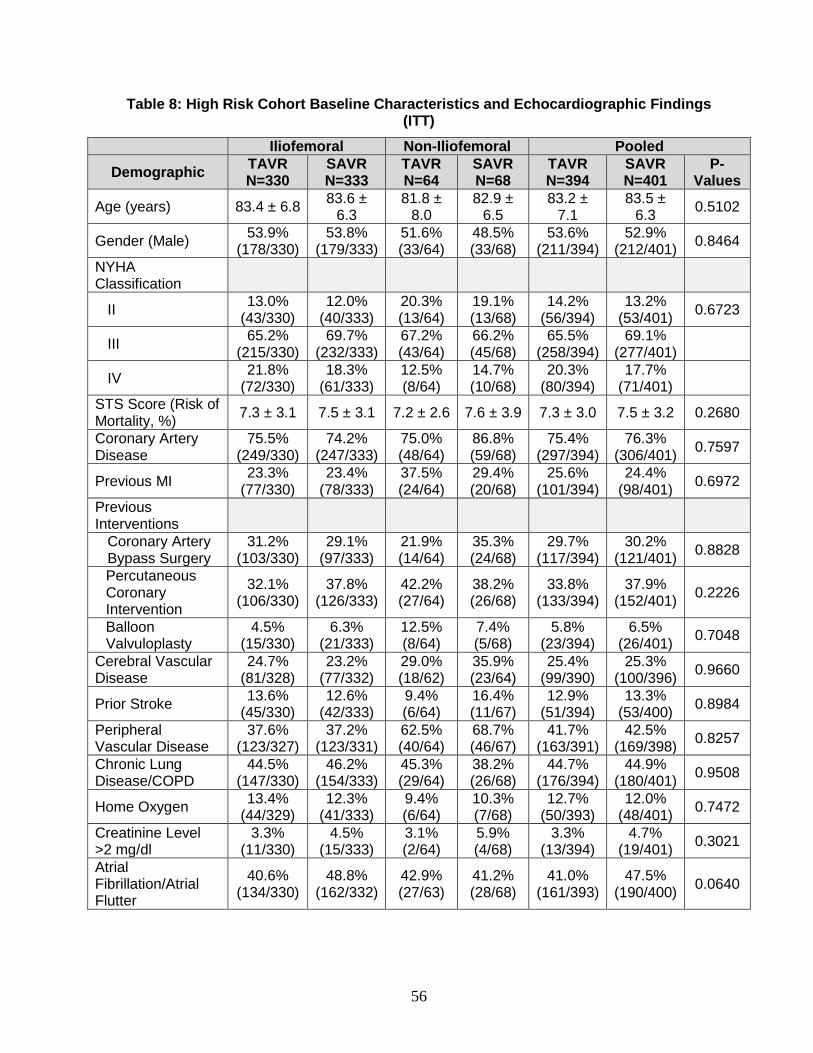
The demographics of the study population were typical for an aortic stenosis valve
replacement study performed in the U.S., as shown in Table 8. A high proportion of the
patients had significant co-morbidities, frailties, or disabilities, and these risk factors were
generally well balanced between the study arms. The mean age for patients participating in
the trial was approximately 83 years old, and slightly greater than 50% of patients were male.
The mean STS score was approximately 7. In addition, approximately 85% of all patients
were in NYHA classes III or IV.
56
Table 8: High Risk Cohort Baseline Characteristics and Echocardiographic Findings (ITT)
Iliofemoral Non-Iliofemoral Pooled
Demographic TAVR N=330
SAVR N=333
TAVR N=64
SAVR N=68
TAVR N=394
SAVR N=401
P-Values
Age (years) 83.4 ± 6.8 83.6 ±
6.3 81.8 ±
8.0 82.9 ±
6.5 83.2 ±
7.1 83.5 ±
6.3 0.5102
Gender (Male) 53.9%
(178/330) 53.8%
(179/333) 51.6% (33/64)
48.5% (33/68)
53.6% (211/394)
52.9% (212/401)
0.8464
NYHA Classification
II 13.0%
(43/330) 12.0%
(40/333) 20.3% (13/64)
19.1% (13/68)
14.2% (56/394)
13.2% (53/401)
0.6723
III 65.2%
(215/330) 69.7%
(232/333) 67.2% (43/64)
66.2% (45/68)
65.5% (258/394)
69.1% (277/401)
IV 21.8%
(72/330) 18.3%
(61/333) 12.5% (8/64)
14.7% (10/68)
20.3% (80/394)
17.7% (71/401)
STS Score (Risk of Mortality, %)
7.3 ± 3.1 7.5 ± 3.1 7.2 ± 2.6 7.6 ± 3.9 7.3 ± 3.0 7.5 ± 3.2 0.2680
Coronary Artery Disease
75.5% (249/330)
74.2% (247/333)
75.0% (48/64)
86.8% (59/68)
75.4% (297/394)
76.3% (306/401)
0.7597
Previous MI 23.3%
(77/330) 23.4%
(78/333) 37.5% (24/64)
29.4% (20/68)
25.6% (101/394)
24.4% (98/401)
0.6972
Previous Interventions
Coronary Artery Bypass Surgery
31.2% (103/330)
29.1% (97/333)
21.9% (14/64)
35.3% (24/68)
29.7% (117/394)
30.2% (121/401)
0.8828
Percutaneous Coronary Intervention
32.1% (106/330)
37.8% (126/333)
42.2% (27/64)
38.2% (26/68)
33.8% (133/394)
37.9% (152/401)
0.2226
Balloon Valvuloplasty
4.5% (15/330)
6.3% (21/333)
12.5% (8/64)
7.4% (5/68)
5.8% (23/394)
6.5% (26/401)
0.7048
Cerebral Vascular Disease
24.7% (81/328)
23.2% (77/332)
29.0% (18/62)
35.9% (23/64)
25.4% (99/390)
25.3% (100/396)
0.9660
Prior Stroke 13.6%
(45/330) 12.6%
(42/333) 9.4% (6/64)
16.4% (11/67)
12.9% (51/394)
13.3% (53/400)
0.8984
Peripheral Vascular Disease
37.6% (123/327)
37.2% (123/331)
62.5% (40/64)
68.7% (46/67)
41.7% (163/391)
42.5% (169/398)
0.8257
Chronic Lung Disease/COPD
44.5% (147/330)
46.2% (154/333)
45.3% (29/64)
38.2% (26/68)
44.7% (176/394)
44.9% (180/401)
0.9508
Home Oxygen 13.4%
(44/329) 12.3%
(41/333) 9.4% (6/64)
10.3% (7/68)
12.7% (50/393)
12.0% (48/401)
0.7472
Creatinine Level >2 mg/dl
3.3% (11/330)
4.5% (15/333)
3.1% (2/64)
5.9% (4/68)
3.3% (13/394)
4.7% (19/401)
0.3021
Atrial Fibrillation/Atrial Flutter
40.6% (134/330)
48.8% (162/332)
42.9% (27/63)
41.2% (28/68)
41.0% (161/393)
47.5% (190/400)
0.0640
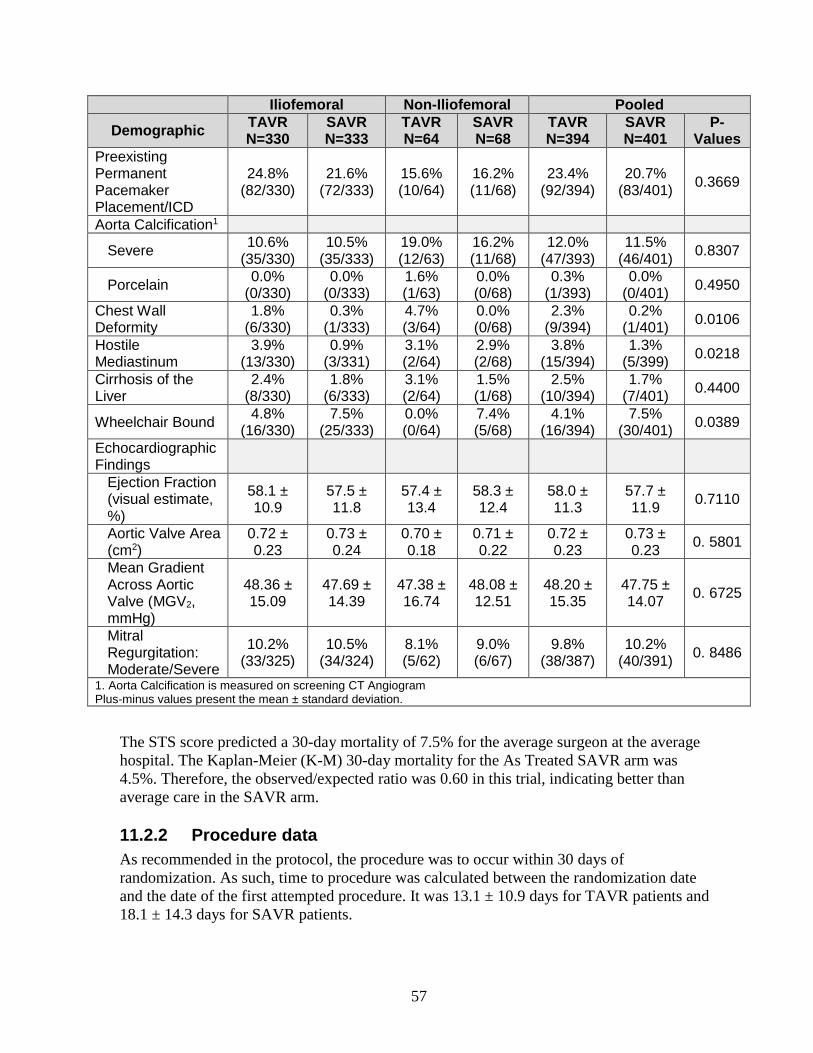
57
Iliofemoral Non-Iliofemoral Pooled
Demographic TAVR N=330
SAVR N=333
TAVR N=64
SAVR N=68
TAVR N=394
SAVR N=401
P-Values
Preexisting Permanent Pacemaker Placement/ICD
24.8% (82/330)
21.6% (72/333)
15.6% (10/64)
16.2% (11/68)
23.4% (92/394)
20.7% (83/401)
0.3669
Aorta Calcification1
Severe 10.6%
(35/330) 10.5%
(35/333) 19.0% (12/63)
16.2% (11/68)
12.0% (47/393)
11.5% (46/401)
0.8307
Porcelain 0.0%
(0/330) 0.0%
(0/333) 1.6% (1/63)
0.0% (0/68)
0.3% (1/393)
0.0% (0/401)
0.4950
Chest Wall Deformity
1.8% (6/330)
0.3% (1/333)
4.7% (3/64)
0.0% (0/68)
2.3% (9/394)
0.2% (1/401)
0.0106
Hostile Mediastinum
3.9% (13/330)
0.9% (3/331)
3.1% (2/64)
2.9% (2/68)
3.8% (15/394)
1.3% (5/399)
0.0218
Cirrhosis of the Liver
2.4% (8/330)
1.8% (6/333)
3.1% (2/64)
1.5% (1/68)
2.5% (10/394)
1.7% (7/401)
0.4400
Wheelchair Bound 4.8%
(16/330) 7.5%
(25/333) 0.0% (0/64)
7.4% (5/68)
4.1% (16/394)
7.5% (30/401)
0.0389
Echocardiographic Findings
Ejection Fraction (visual estimate, %)
58.1 ± 10.9
57.5 ± 11.8
57.4 ± 13.4
58.3 ± 12.4
58.0 ± 11.3
57.7 ± 11.9
0.7110
Aortic Valve Area (cm2)
0.72 ± 0.23
0.73 ± 0.24
0.70 ± 0.18
0.71 ± 0.22
0.72 ± 0.23
0.73 ± 0.23
0. 5801
Mean Gradient Across Aortic Valve (MGV2, mmHg)
48.36 ± 15.09
47.69 ± 14.39
47.38 ± 16.74
48.08 ± 12.51
48.20 ± 15.35
47.75 ± 14.07
0. 6725
Mitral Regurgitation: Moderate/Severe
10.2% (33/325)
10.5% (34/324)
8.1% (5/62)
9.0% (6/67)
9.8% (38/387)
10.2% (40/391)
0. 8486
1. Aorta Calcification is measured on screening CT Angiogram Plus-minus values present the mean ± standard deviation.
The STS score predicted a 30-day mortality of 7.5% for the average surgeon at the average
hospital. The Kaplan-Meier (K-M) 30-day mortality for the As Treated SAVR arm was
4.5%. Therefore, the observed/expected ratio was 0.60 in this trial, indicating better than
average care in the SAVR arm.
11.2.2 Procedure data
As recommended in the protocol, the procedure was to occur within 30 days of
randomization. As such, time to procedure was calculated between the randomization date
and the date of the first attempted procedure. It was 13.1 ± 10.9 days for TAVR patients and
18.1 ± 14.3 days for SAVR patients.
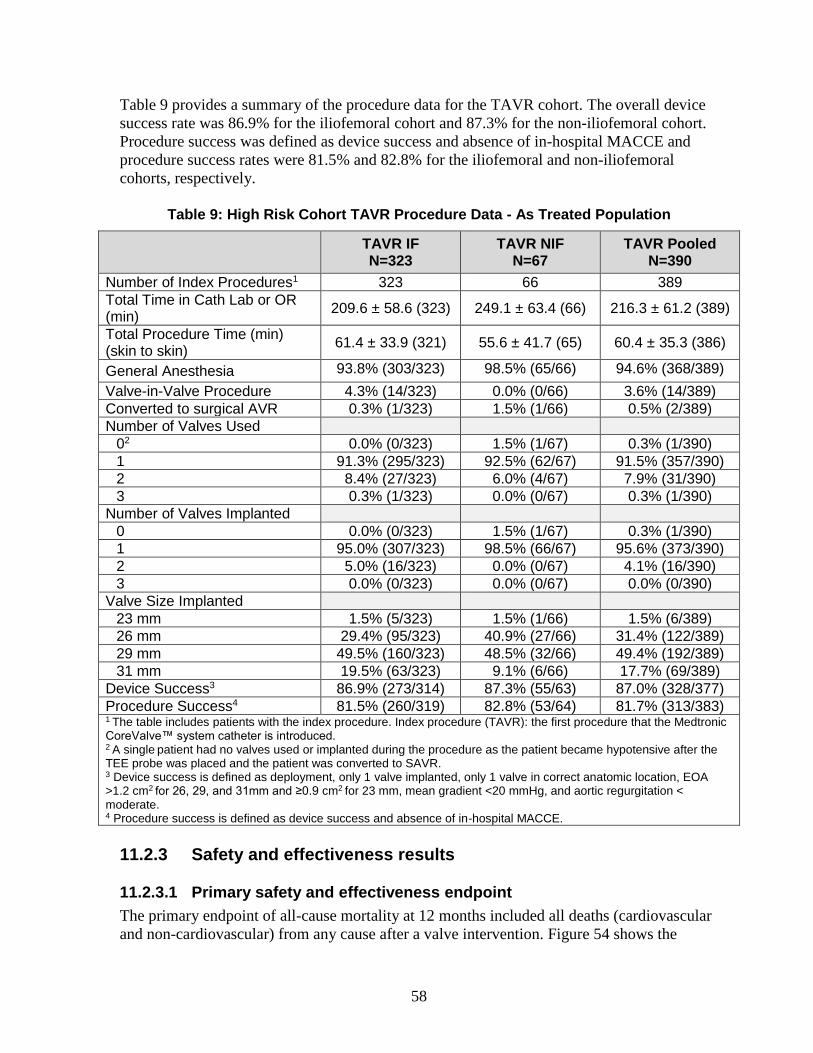
58
Table 9 provides a summary of the procedure data for the TAVR cohort. The overall device
success rate was 86.9% for the iliofemoral cohort and 87.3% for the non-iliofemoral cohort.
Procedure success was defined as device success and absence of in-hospital MACCE and
procedure success rates were 81.5% and 82.8% for the iliofemoral and non-iliofemoral
cohorts, respectively.
Table 9: High Risk Cohort TAVR Procedure Data - As Treated Population
TAVR IF N=323
TAVR NIF N=67
TAVR Pooled N=390
Number of Index Procedures1 323 66 389
Total Time in Cath Lab or OR (min)
209.6 ± 58.6 (323) 249.1 ± 63.4 (66) 216.3 ± 61.2 (389)
Total Procedure Time (min) (skin to skin)
61.4 ± 33.9 (321) 55.6 ± 41.7 (65) 60.4 ± 35.3 (386)
General Anesthesia 93.8% (303/323) 98.5% (65/66) 94.6% (368/389)
Valve-in-Valve Procedure 4.3% (14/323) 0.0% (0/66) 3.6% (14/389)
Converted to surgical AVR 0.3% (1/323) 1.5% (1/66) 0.5% (2/389)
Number of Valves Used
02 0.0% (0/323) 1.5% (1/67) 0.3% (1/390)
1 91.3% (295/323) 92.5% (62/67) 91.5% (357/390)
2 8.4% (27/323) 6.0% (4/67) 7.9% (31/390)
3 0.3% (1/323) 0.0% (0/67) 0.3% (1/390)
Number of Valves Implanted
0 0.0% (0/323) 1.5% (1/67) 0.3% (1/390)
1 95.0% (307/323) 98.5% (66/67) 95.6% (373/390)
2 5.0% (16/323) 0.0% (0/67) 4.1% (16/390)
3 0.0% (0/323) 0.0% (0/67) 0.0% (0/390)
Valve Size Implanted
23 mm 1.5% (5/323) 1.5% (1/66) 1.5% (6/389)
26 mm 29.4% (95/323) 40.9% (27/66) 31.4% (122/389)
29 mm 49.5% (160/323) 48.5% (32/66) 49.4% (192/389)
31 mm 19.5% (63/323) 9.1% (6/66) 17.7% (69/389)
Device Success3 86.9% (273/314) 87.3% (55/63) 87.0% (328/377)
Procedure Success4 81.5% (260/319) 82.8% (53/64) 81.7% (313/383) 1 The table includes patients with the index procedure. Index procedure (TAVR): the first procedure that the Medtronic CoreValve™ system catheter is introduced. 2 A single patient had no valves used or implanted during the procedure as the patient became hypotensive after the TEE probe was placed and the patient was converted to SAVR. 3 Device success is defined as deployment, only 1 valve implanted, only 1 valve in correct anatomic location, EOA >1.2 cm2 for 26, 29, and 31mm and ≥0.9 cm2 for 23 mm, mean gradient <20 mmHg, and aortic regurgitation < moderate. 4 Procedure success is defined as device success and absence of in-hospital MACCE.
11.2.3 Safety and effectiveness results
11.2.3.1 Primary safety and effectiveness endpoint
The primary endpoint of all-cause mortality at 12 months included all deaths (cardiovascular
and non-cardiovascular) from any cause after a valve intervention. Figure 54 shows the
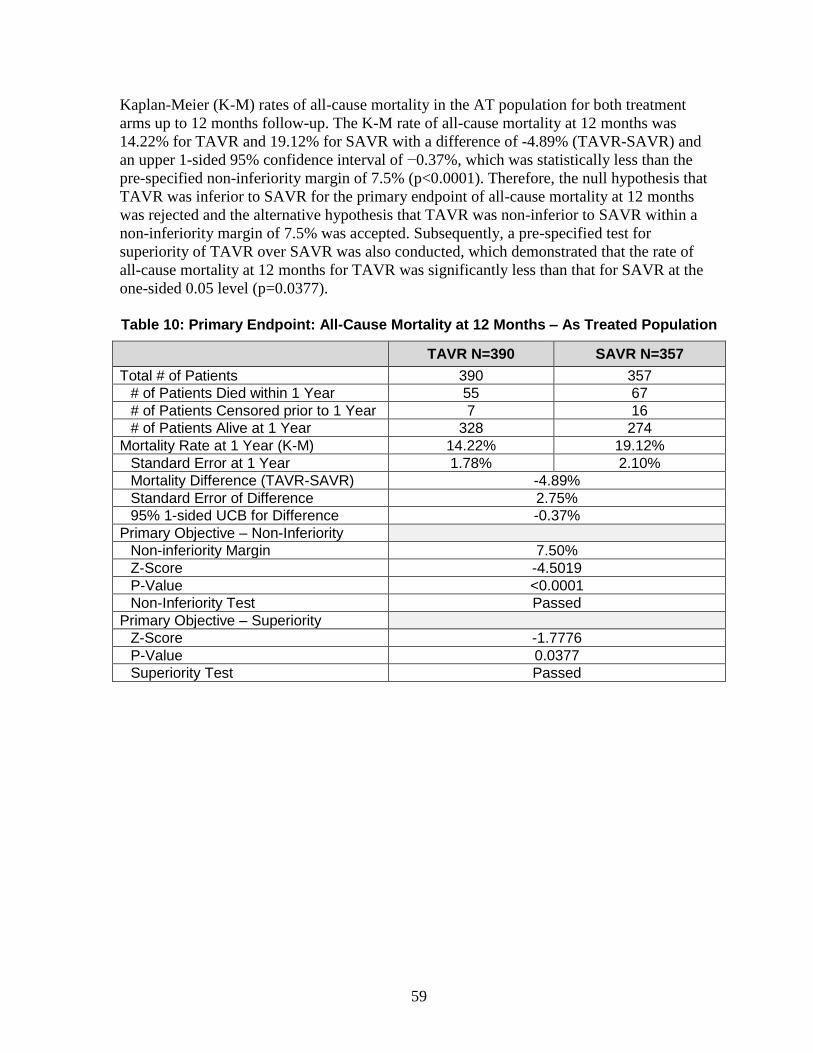
59
Kaplan-Meier (K-M) rates of all-cause mortality in the AT population for both treatment
arms up to 12 months follow-up. The K-M rate of all-cause mortality at 12 months was
14.22% for TAVR and 19.12% for SAVR with a difference of -4.89% (TAVR-SAVR) and
an upper 1-sided 95% confidence interval of −0.37%, which was statistically less than the
pre-specified non-inferiority margin of 7.5% (p<0.0001). Therefore, the null hypothesis that
TAVR was inferior to SAVR for the primary endpoint of all-cause mortality at 12 months
was rejected and the alternative hypothesis that TAVR was non-inferior to SAVR within a
non-inferiority margin of 7.5% was accepted. Subsequently, a pre-specified test for
superiority of TAVR over SAVR was also conducted, which demonstrated that the rate of
all-cause mortality at 12 months for TAVR was significantly less than that for SAVR at the
one-sided 0.05 level (p=0.0377).
Table 10: Primary Endpoint: All-Cause Mortality at 12 Months – As Treated Population
TAVR N=390 SAVR N=357
Total # of Patients 390 357
# of Patients Died within 1 Year 55 67
# of Patients Censored prior to 1 Year 7 16
# of Patients Alive at 1 Year 328 274
Mortality Rate at 1 Year (K-M) 14.22% 19.12%
Standard Error at 1 Year 1.78% 2.10%
Mortality Difference (TAVR-SAVR) -4.89%
Standard Error of Difference 2.75%
95% 1-sided UCB for Difference -0.37%
Primary Objective – Non-Inferiority
Non-inferiority Margin 7.50%
Z-Score -4.5019
P-Value <0.0001
Non-Inferiority Test Passed
Primary Objective – Superiority
Z-Score -1.7776
P-Value 0.0377
Superiority Test Passed
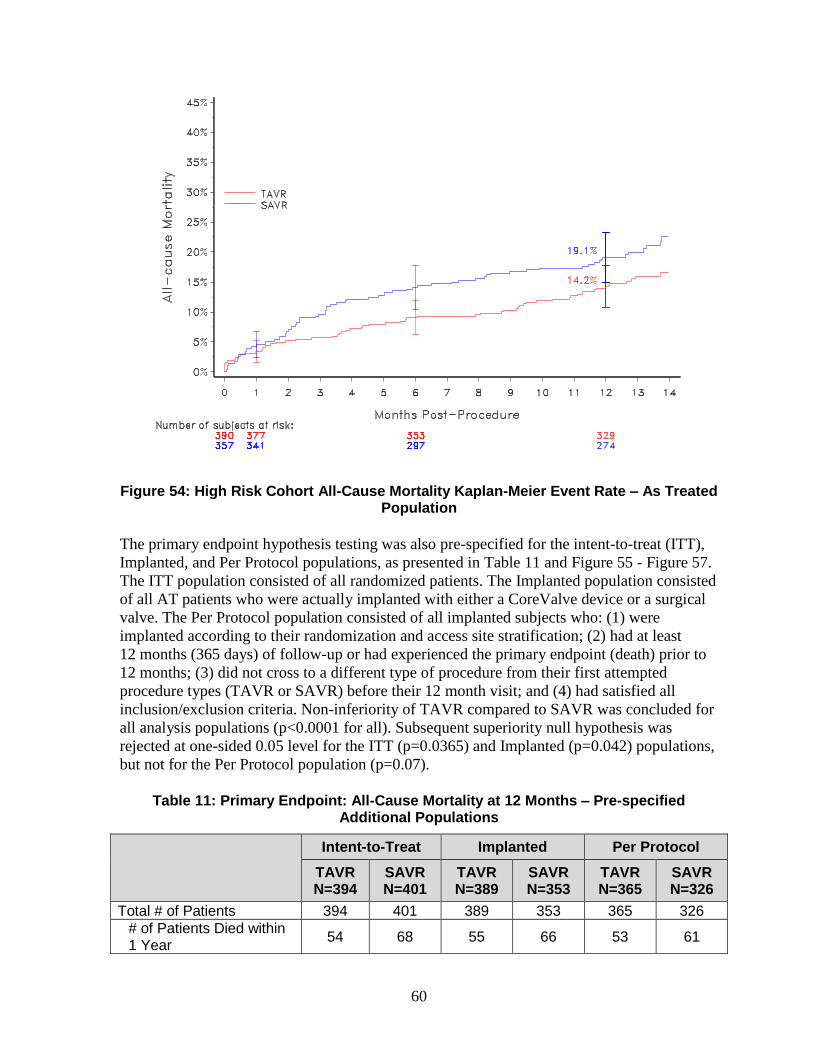
60
Figure 54: High Risk Cohort All-Cause Mortality Kaplan-Meier Event Rate – As Treated Population
The primary endpoint hypothesis testing was also pre-specified for the intent-to-treat (ITT),
Implanted, and Per Protocol populations, as presented in Table 11 and Figure 55 - Figure 57.
The ITT population consisted of all randomized patients. The Implanted population consisted
of all AT patients who were actually implanted with either a CoreValve device or a surgical
valve. The Per Protocol population consisted of all implanted subjects who: (1) were
implanted according to their randomization and access site stratification; (2) had at least
12 months (365 days) of follow-up or had experienced the primary endpoint (death) prior to
12 months; (3) did not cross to a different type of procedure from their first attempted
procedure types (TAVR or SAVR) before their 12 month visit; and (4) had satisfied all
inclusion/exclusion criteria. Non-inferiority of TAVR compared to SAVR was concluded for
all analysis populations (p<0.0001 for all). Subsequent superiority null hypothesis was
rejected at one-sided 0.05 level for the ITT (p=0.0365) and Implanted (p=0.042) populations,
but not for the Per Protocol population (p=0.07).
Table 11: Primary Endpoint: All-Cause Mortality at 12 Months – Pre-specified Additional Populations
Intent-to-Treat Implanted Per Protocol
TAVR N=394
SAVR N=401
TAVR N=389
SAVR N=353
TAVR N=365
SAVR N=326
Total # of Patients 394 401 389 353 365 326
# of Patients Died within 1 Year
54 68 55 66 53 61
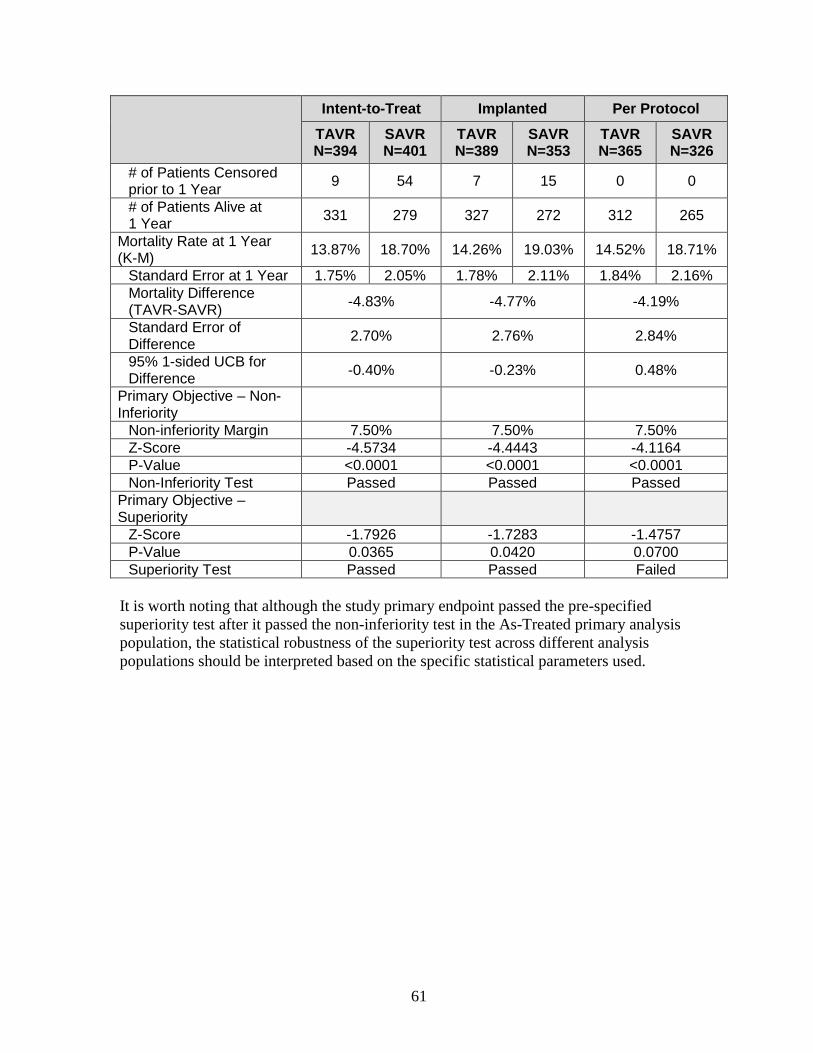
61
Intent-to-Treat Implanted Per Protocol
TAVR N=394
SAVR N=401
TAVR N=389
SAVR N=353
TAVR N=365
SAVR N=326
# of Patients Censored prior to 1 Year
9 54 7 15 0 0
# of Patients Alive at 1 Year
331 279 327 272 312 265
Mortality Rate at 1 Year (K-M)
13.87% 18.70% 14.26% 19.03% 14.52% 18.71%
Standard Error at 1 Year 1.75% 2.05% 1.78% 2.11% 1.84% 2.16%
Mortality Difference (TAVR-SAVR)
-4.83% -4.77% -4.19%
Standard Error of Difference
2.70% 2.76% 2.84%
95% 1-sided UCB for Difference
-0.40% -0.23% 0.48%
Primary Objective – Non-Inferiority
Non-inferiority Margin 7.50% 7.50% 7.50%
Z-Score -4.5734 -4.4443 -4.1164
P-Value <0.0001 <0.0001 <0.0001
Non-Inferiority Test Passed Passed Passed
Primary Objective – Superiority
Z-Score -1.7926 -1.7283 -1.4757
P-Value 0.0365 0.0420 0.0700
Superiority Test Passed Passed Failed
It is worth noting that although the study primary endpoint passed the pre-specified
superiority test after it passed the non-inferiority test in the As-Treated primary analysis
population, the statistical robustness of the superiority test across different analysis
populations should be interpreted based on the specific statistical parameters used.
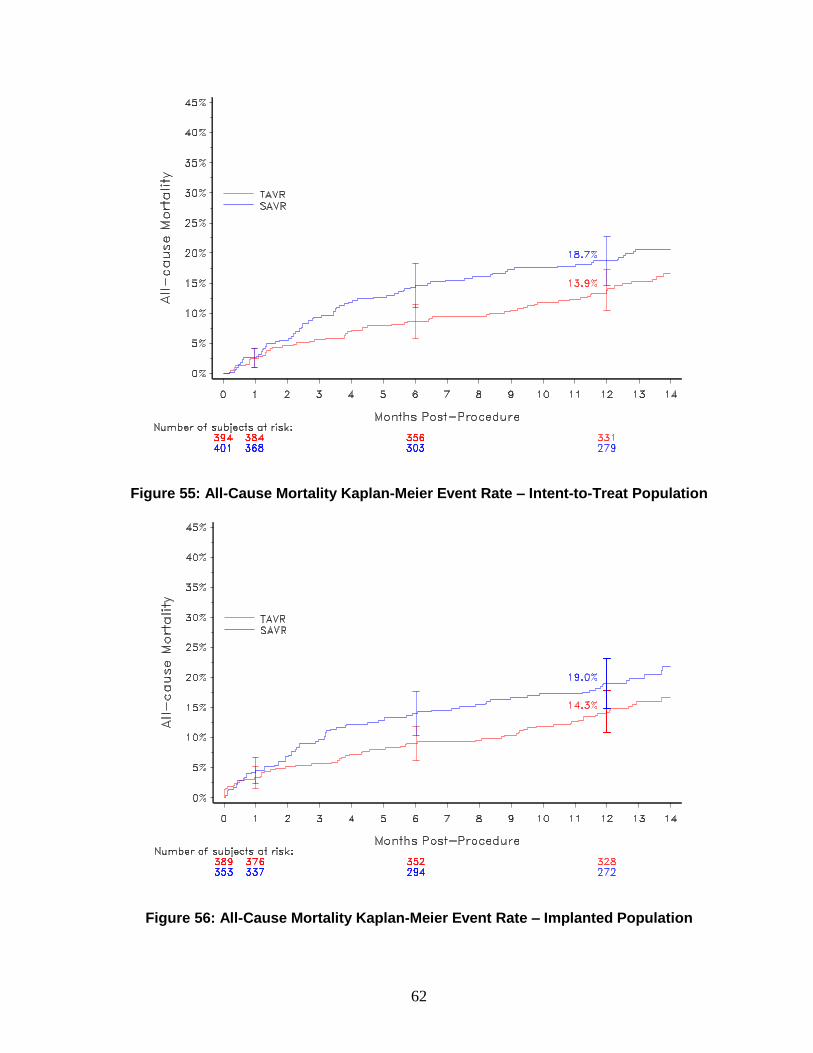
62
Figure 55: All-Cause Mortality Kaplan-Meier Event Rate – Intent-to-Treat Population
Figure 56: All-Cause Mortality Kaplan-Meier Event Rate – Implanted Population
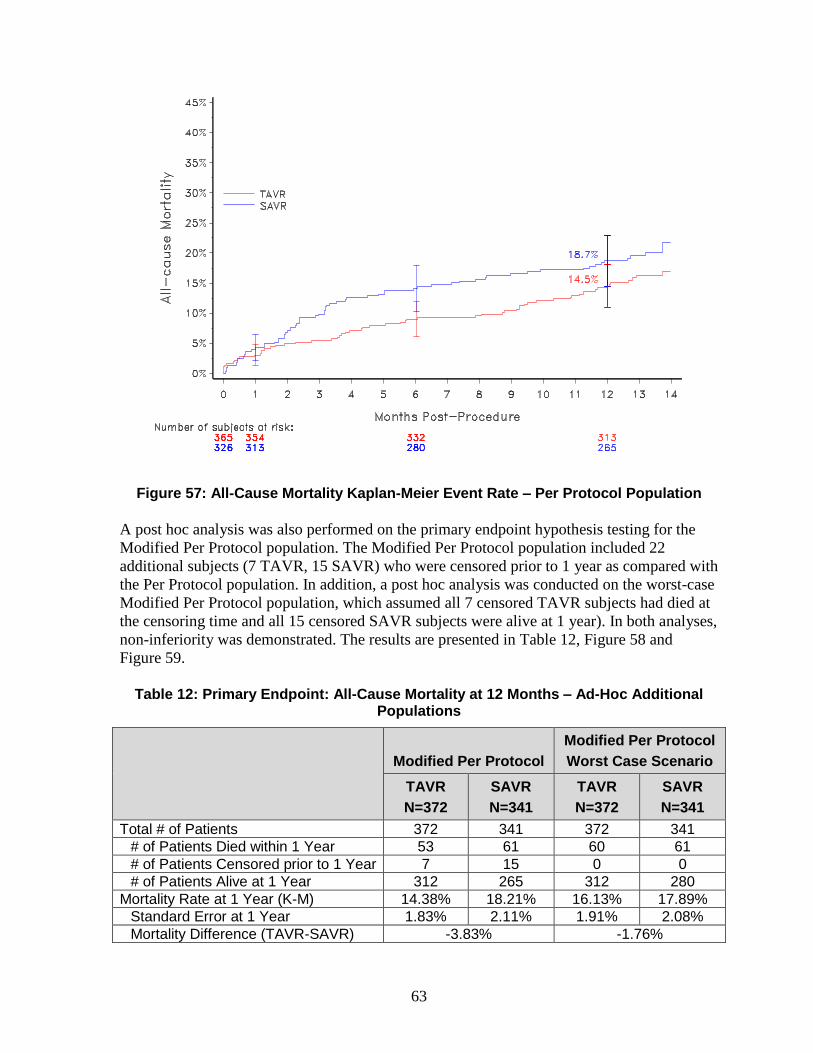
63
Figure 57: All-Cause Mortality Kaplan-Meier Event Rate – Per Protocol Population
A post hoc analysis was also performed on the primary endpoint hypothesis testing for the
Modified Per Protocol population. The Modified Per Protocol population included 22
additional subjects (7 TAVR, 15 SAVR) who were censored prior to 1 year as compared with
the Per Protocol population. In addition, a post hoc analysis was conducted on the worst-case
Modified Per Protocol population, which assumed all 7 censored TAVR subjects had died at
the censoring time and all 15 censored SAVR subjects were alive at 1 year). In both analyses,
non-inferiority was demonstrated. The results are presented in Table 12, Figure 58 and
Figure 59.
Table 12: Primary Endpoint: All-Cause Mortality at 12 Months – Ad-Hoc Additional Populations
Modified Per Protocol
Modified Per Protocol
Worst Case Scenario
TAVR
N=372
SAVR
N=341
TAVR
N=372
SAVR
N=341
Total # of Patients 372 341 372 341
# of Patients Died within 1 Year 53 61 60 61
# of Patients Censored prior to 1 Year 7 15 0 0
# of Patients Alive at 1 Year 312 265 312 280
Mortality Rate at 1 Year (K-M) 14.38% 18.21% 16.13% 17.89%
Standard Error at 1 Year 1.83% 2.11% 1.91% 2.08%
Mortality Difference (TAVR-SAVR) -3.83% -1.76%
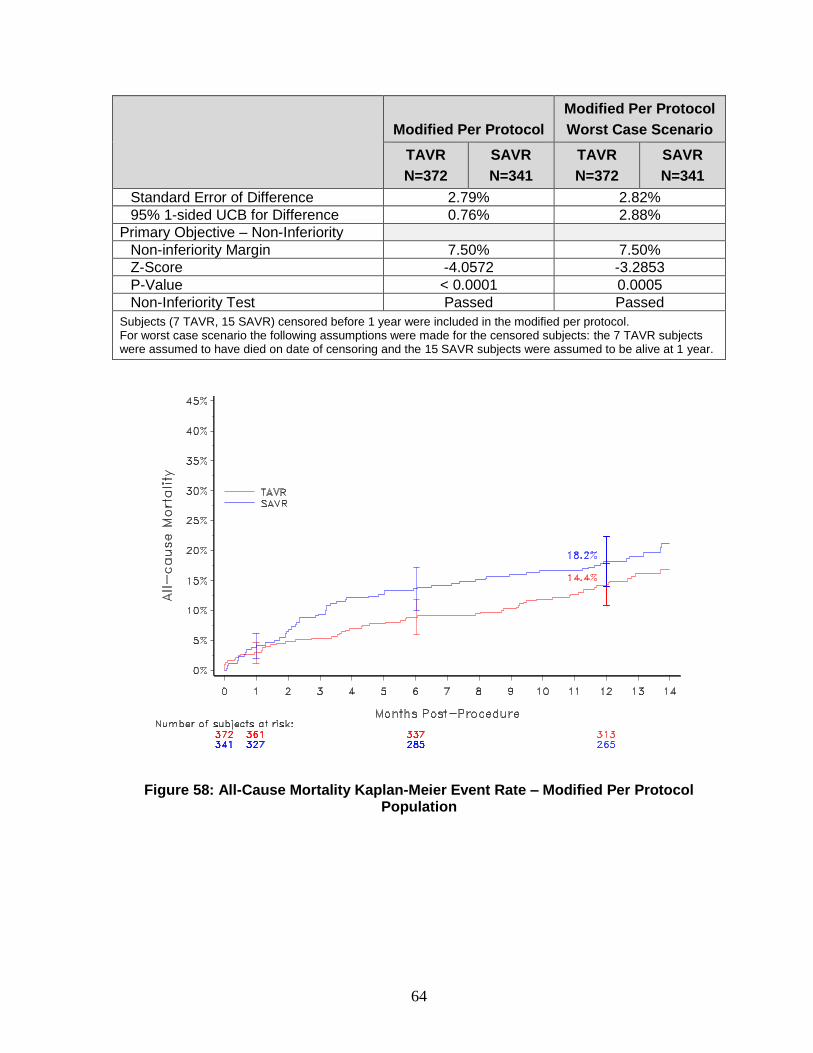
64
Modified Per Protocol
Modified Per Protocol
Worst Case Scenario
TAVR
N=372
SAVR
N=341
TAVR
N=372
SAVR
N=341
Standard Error of Difference 2.79% 2.82%
95% 1-sided UCB for Difference 0.76% 2.88%
Primary Objective – Non-Inferiority
Non-inferiority Margin 7.50% 7.50%
Z-Score -4.0572 -3.2853
P-Value < 0.0001 0.0005
Non-Inferiority Test Passed Passed
Subjects (7 TAVR, 15 SAVR) censored before 1 year were included in the modified per protocol. For worst case scenario the following assumptions were made for the censored subjects: the 7 TAVR subjects were assumed to have died on date of censoring and the 15 SAVR subjects were assumed to be alive at 1 year.
Figure 58: All-Cause Mortality Kaplan-Meier Event Rate – Modified Per Protocol Population
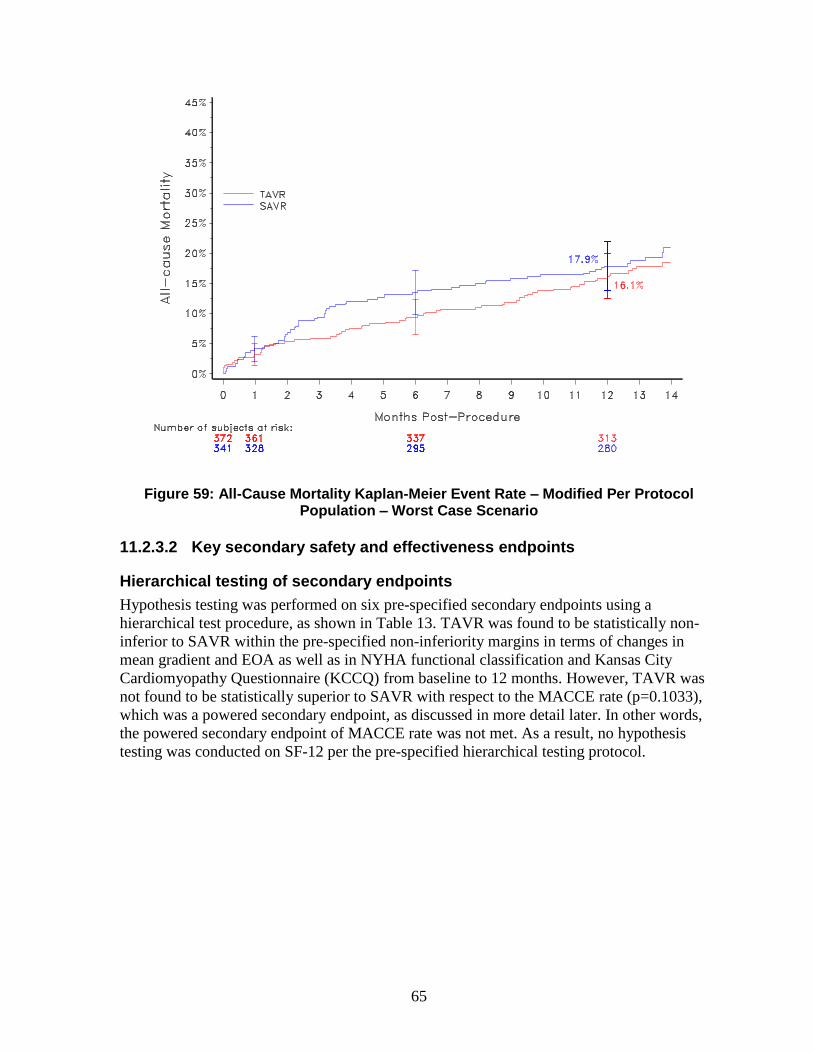
65
Figure 59: All-Cause Mortality Kaplan-Meier Event Rate – Modified Per Protocol Population – Worst Case Scenario
11.2.3.2 Key secondary safety and effectiveness endpoints
Hierarchical testing of secondary endpoints
Hypothesis testing was performed on six pre-specified secondary endpoints using a
hierarchical test procedure, as shown in Table 13. TAVR was found to be statistically non-
inferior to SAVR within the pre-specified non-inferiority margins in terms of changes in
mean gradient and EOA as well as in NYHA functional classification and Kansas City
Cardiomyopathy Questionnaire (KCCQ) from baseline to 12 months. However, TAVR was
not found to be statistically superior to SAVR with respect to the MACCE rate (p=0.1033),
which was a powered secondary endpoint, as discussed in more detail later. In other words,
the powered secondary endpoint of MACCE rate was not met. As a result, no hypothesis
testing was conducted on SF-12 per the pre-specified hierarchical testing protocol.
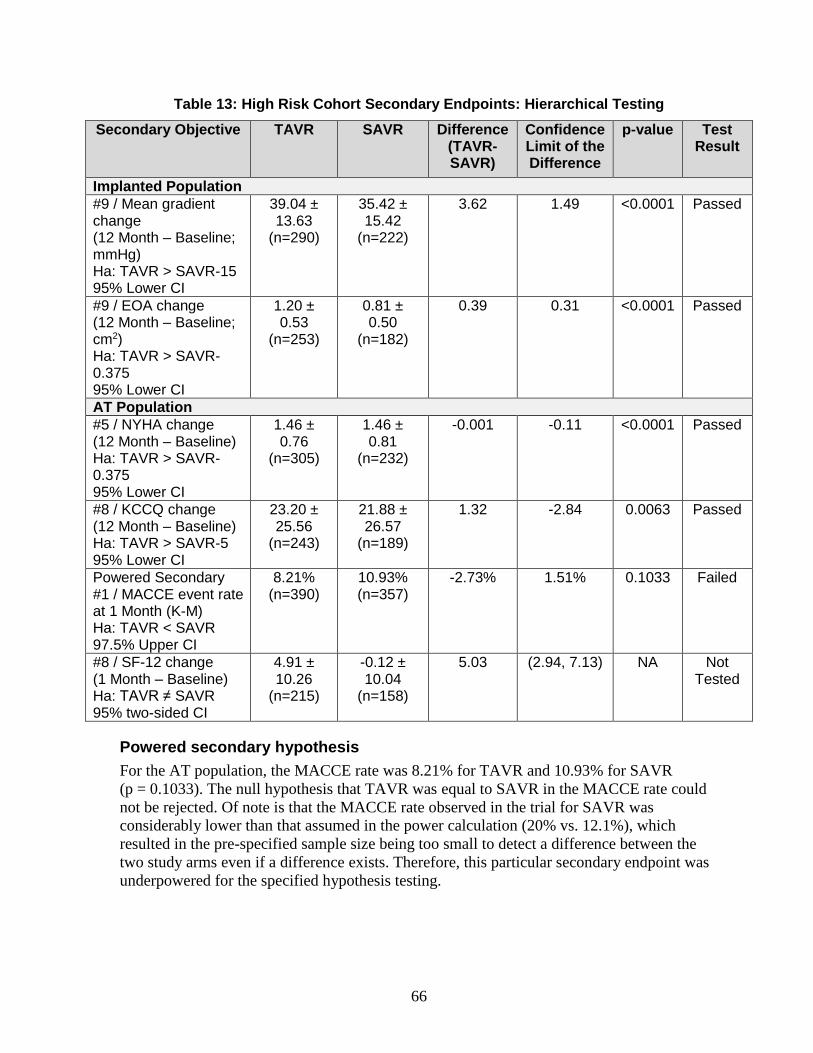
66
Table 13: High Risk Cohort Secondary Endpoints: Hierarchical Testing
Secondary Objective TAVR SAVR Difference (TAVR-SAVR)
Confidence Limit of the Difference
p-value
Test Result
Implanted Population
#9 / Mean gradient change (12 Month – Baseline; mmHg) Ha: TAVR > SAVR-15 95% Lower CI
39.04 ± 13.63
(n=290)
35.42 ± 15.42
(n=222)
3.62 1.49 <0.0001 Passed
#9 / EOA change (12 Month – Baseline; cm2) Ha: TAVR > SAVR-0.375 95% Lower CI
1.20 ± 0.53
(n=253)
0.81 ± 0.50
(n=182)
0.39 0.31 <0.0001 Passed
AT Population
#5 / NYHA change (12 Month – Baseline) Ha: TAVR > SAVR-0.375 95% Lower CI
1.46 ± 0.76
(n=305)
1.46 ± 0.81
(n=232)
-0.001 -0.11 <0.0001 Passed
#8 / KCCQ change (12 Month – Baseline) Ha: TAVR > SAVR-5 95% Lower CI
23.20 ± 25.56
(n=243)
21.88 ± 26.57
(n=189)
1.32 -2.84 0.0063 Passed
Powered Secondary #1 / MACCE event rate at 1 Month (K-M) Ha: TAVR < SAVR 97.5% Upper CI
8.21% (n=390)
10.93% (n=357)
-2.73% 1.51% 0.1033 Failed
#8 / SF-12 change (1 Month – Baseline) Ha: TAVR ≠ SAVR 95% two-sided CI
4.91 ± 10.26
(n=215)
-0.12 ± 10.04
(n=158)
5.03 (2.94, 7.13) NA Not Tested
Powered secondary hypothesis
For the AT population, the MACCE rate was 8.21% for TAVR and 10.93% for SAVR
(p = 0.1033). The null hypothesis that TAVR was equal to SAVR in the MACCE rate could
not be rejected. Of note is that the MACCE rate observed in the trial for SAVR was
considerably lower than that assumed in the power calculation (20% vs. 12.1%), which
resulted in the pre-specified sample size being too small to detect a difference between the
two study arms even if a difference exists. Therefore, this particular secondary endpoint was
underpowered for the specified hypothesis testing.
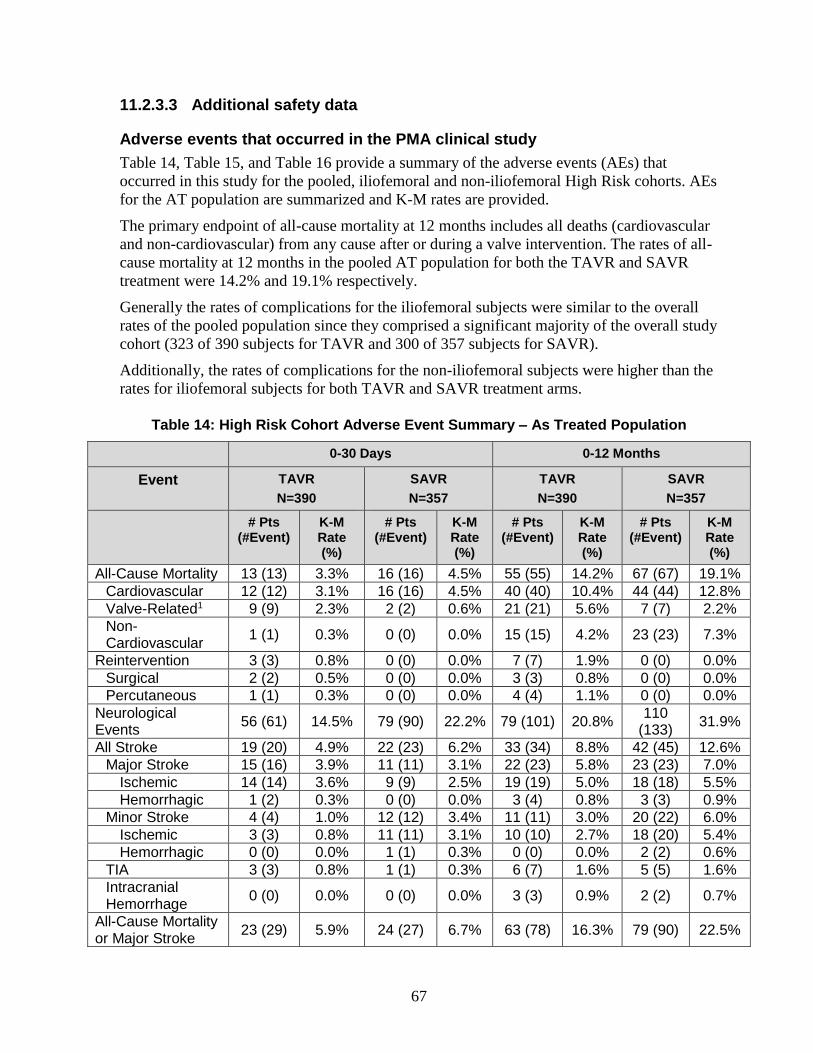
67
11.2.3.3 Additional safety data
Adverse events that occurred in the PMA clinical study
Table 14, Table 15, and Table 16 provide a summary of the adverse events (AEs) that
occurred in this study for the pooled, iliofemoral and non-iliofemoral High Risk cohorts. AEs
for the AT population are summarized and K-M rates are provided.
The primary endpoint of all-cause mortality at 12 months includes all deaths (cardiovascular
and non-cardiovascular) from any cause after or during a valve intervention. The rates of all-
cause mortality at 12 months in the pooled AT population for both the TAVR and SAVR
treatment were 14.2% and 19.1% respectively.
Generally the rates of complications for the iliofemoral subjects were similar to the overall
rates of the pooled population since they comprised a significant majority of the overall study
cohort (323 of 390 subjects for TAVR and 300 of 357 subjects for SAVR).
Additionally, the rates of complications for the non-iliofemoral subjects were higher than the
rates for iliofemoral subjects for both TAVR and SAVR treatment arms.
Table 14: High Risk Cohort Adverse Event Summary – As Treated Population
0-30 Days 0-12 Months
Event TAVR
N=390
SAVR
N=357
TAVR
N=390
SAVR
N=357
# Pts (#Event)
K-M Rate (%)
# Pts (#Event)
K-M Rate (%)
# Pts (#Event)
K-M Rate (%)
# Pts (#Event)
K-M Rate (%)
All-Cause Mortality 13 (13) 3.3% 16 (16) 4.5% 55 (55) 14.2% 67 (67) 19.1%
Cardiovascular 12 (12) 3.1% 16 (16) 4.5% 40 (40) 10.4% 44 (44) 12.8%
Valve-Related1 9 (9) 2.3% 2 (2) 0.6% 21 (21) 5.6% 7 (7) 2.2%
Non-Cardiovascular
1 (1) 0.3% 0 (0) 0.0% 15 (15) 4.2% 23 (23) 7.3%
Reintervention 3 (3) 0.8% 0 (0) 0.0% 7 (7) 1.9% 0 (0) 0.0%
Surgical 2 (2) 0.5% 0 (0) 0.0% 3 (3) 0.8% 0 (0) 0.0%
Percutaneous 1 (1) 0.3% 0 (0) 0.0% 4 (4) 1.1% 0 (0) 0.0%
Neurological Events
56 (61) 14.5% 79 (90) 22.2% 79 (101) 20.8% 110
(133) 31.9%
All Stroke 19 (20) 4.9% 22 (23) 6.2% 33 (34) 8.8% 42 (45) 12.6%
Major Stroke 15 (16) 3.9% 11 (11) 3.1% 22 (23) 5.8% 23 (23) 7.0%
Ischemic 14 (14) 3.6% 9 (9) 2.5% 19 (19) 5.0% 18 (18) 5.5%
Hemorrhagic 1 (2) 0.3% 0 (0) 0.0% 3 (4) 0.8% 3 (3) 0.9%
Minor Stroke 4 (4) 1.0% 12 (12) 3.4% 11 (11) 3.0% 20 (22) 6.0%
Ischemic 3 (3) 0.8% 11 (11) 3.1% 10 (10) 2.7% 18 (20) 5.4%
Hemorrhagic 0 (0) 0.0% 1 (1) 0.3% 0 (0) 0.0% 2 (2) 0.6%
TIA 3 (3) 0.8% 1 (1) 0.3% 6 (7) 1.6% 5 (5) 1.6%
Intracranial Hemorrhage
0 (0) 0.0% 0 (0) 0.0% 3 (3) 0.9% 2 (2) 0.7%
All-Cause Mortality or Major Stroke
23 (29) 5.9% 24 (27) 6.7% 63 (78) 16.3% 79 (90) 22.5%
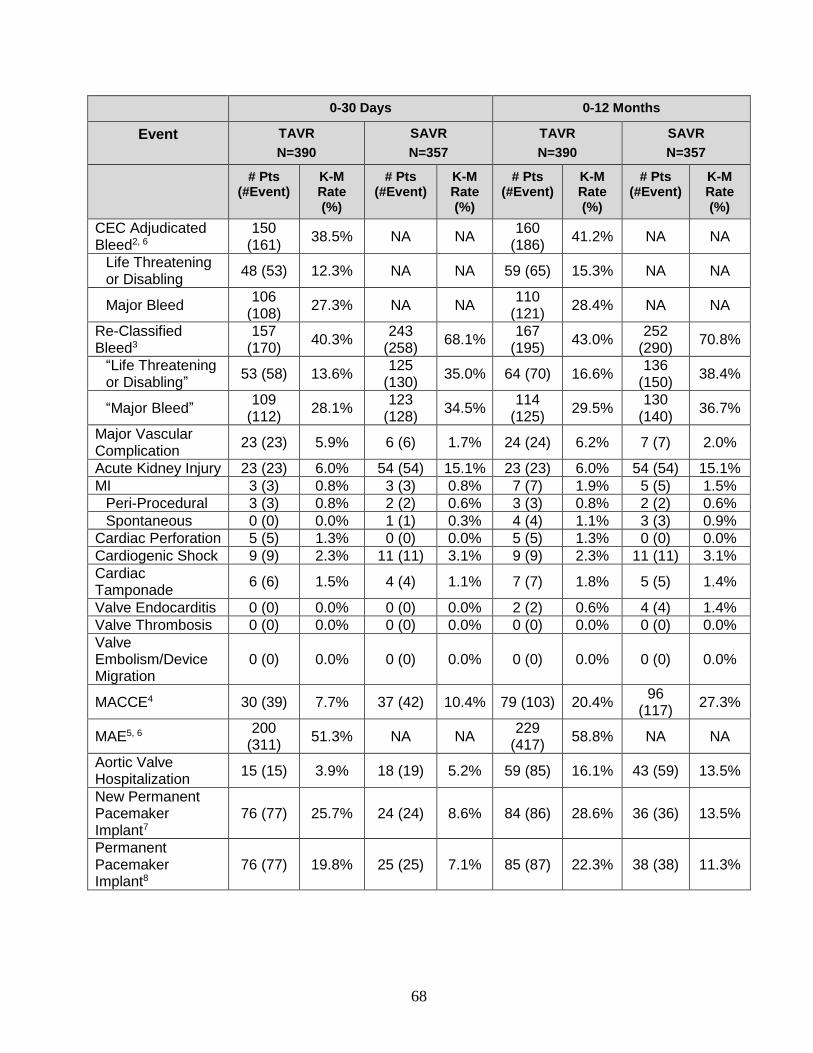
68
0-30 Days 0-12 Months
Event TAVR
N=390
SAVR
N=357
TAVR
N=390
SAVR
N=357
# Pts (#Event)
K-M Rate (%)
# Pts (#Event)
K-M Rate (%)
# Pts (#Event)
K-M Rate (%)
# Pts (#Event)
K-M Rate (%)
CEC Adjudicated Bleed2, 6
150 (161)
38.5% NA NA 160
(186) 41.2% NA NA
Life Threatening or Disabling
48 (53) 12.3% NA NA 59 (65) 15.3% NA NA
Major Bleed 106
(108) 27.3% NA NA
110 (121)
28.4% NA NA
Re-Classified Bleed3
157 (170)
40.3% 243
(258) 68.1%
167 (195)
43.0% 252
(290) 70.8%
“Life Threatening or Disabling”
53 (58) 13.6% 125
(130) 35.0% 64 (70) 16.6%
136 (150)
38.4%
“Major Bleed” 109
(112) 28.1%
123 (128)
34.5% 114
(125) 29.5%
130 (140)
36.7%
Major Vascular Complication
23 (23) 5.9% 6 (6) 1.7% 24 (24) 6.2% 7 (7) 2.0%
Acute Kidney Injury 23 (23) 6.0% 54 (54) 15.1% 23 (23) 6.0% 54 (54) 15.1%
MI 3 (3) 0.8% 3 (3) 0.8% 7 (7) 1.9% 5 (5) 1.5%
Peri-Procedural 3 (3) 0.8% 2 (2) 0.6% 3 (3) 0.8% 2 (2) 0.6%
Spontaneous 0 (0) 0.0% 1 (1) 0.3% 4 (4) 1.1% 3 (3) 0.9%
Cardiac Perforation 5 (5) 1.3% 0 (0) 0.0% 5 (5) 1.3% 0 (0) 0.0%
Cardiogenic Shock 9 (9) 2.3% 11 (11) 3.1% 9 (9) 2.3% 11 (11) 3.1%
Cardiac Tamponade
6 (6) 1.5% 4 (4) 1.1% 7 (7) 1.8% 5 (5) 1.4%
Valve Endocarditis 0 (0) 0.0% 0 (0) 0.0% 2 (2) 0.6% 4 (4) 1.4%
Valve Thrombosis 0 (0) 0.0% 0 (0) 0.0% 0 (0) 0.0% 0 (0) 0.0%
Valve Embolism/Device Migration
0 (0) 0.0% 0 (0) 0.0% 0 (0) 0.0% 0 (0) 0.0%
MACCE4 30 (39) 7.7% 37 (42) 10.4% 79 (103) 20.4% 96
(117) 27.3%
MAE5, 6 200
(311) 51.3% NA NA
229 (417)
58.8% NA NA
Aortic Valve Hospitalization
15 (15) 3.9% 18 (19) 5.2% 59 (85) 16.1% 43 (59) 13.5%
New Permanent Pacemaker Implant7
76 (77) 25.7% 24 (24) 8.6% 84 (86) 28.6% 36 (36) 13.5%
Permanent Pacemaker Implant8
76 (77) 19.8% 25 (25) 7.1% 85 (87) 22.3% 38 (38) 11.3%
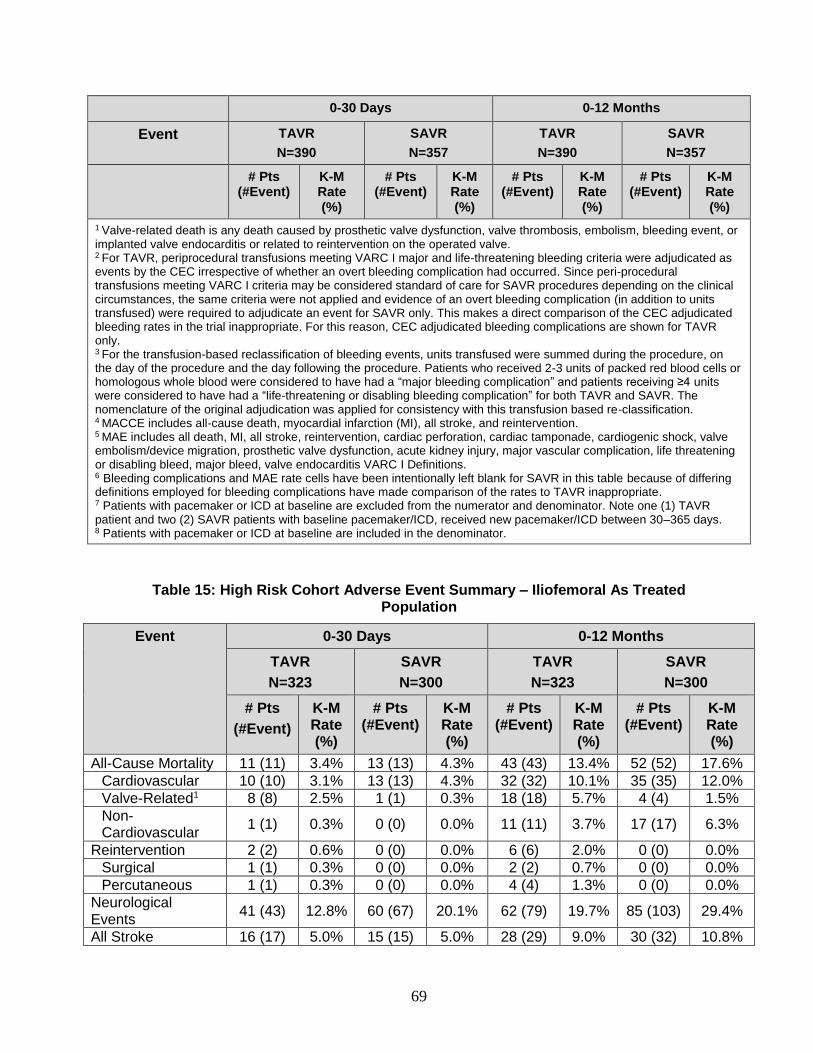
69
0-30 Days 0-12 Months
Event TAVR
N=390
SAVR
N=357
TAVR
N=390
SAVR
N=357
# Pts (#Event)
K-M Rate (%)
# Pts (#Event)
K-M Rate (%)
# Pts (#Event)
K-M Rate (%)
# Pts (#Event)
K-M Rate (%)
1 Valve-related death is any death caused by prosthetic valve dysfunction, valve thrombosis, embolism, bleeding event, or implanted valve endocarditis or related to reintervention on the operated valve. 2 For TAVR, periprocedural transfusions meeting VARC I major and life-threatening bleeding criteria were adjudicated as events by the CEC irrespective of whether an overt bleeding complication had occurred. Since peri-procedural transfusions meeting VARC I criteria may be considered standard of care for SAVR procedures depending on the clinical circumstances, the same criteria were not applied and evidence of an overt bleeding complication (in addition to units transfused) were required to adjudicate an event for SAVR only. This makes a direct comparison of the CEC adjudicated bleeding rates in the trial inappropriate. For this reason, CEC adjudicated bleeding complications are shown for TAVR only. 3 For the transfusion-based reclassification of bleeding events, units transfused were summed during the procedure, on the day of the procedure and the day following the procedure. Patients who received 2-3 units of packed red blood cells or homologous whole blood were considered to have had a “major bleeding complication” and patients receiving ≥4 units were considered to have had a “life-threatening or disabling bleeding complication” for both TAVR and SAVR. The nomenclature of the original adjudication was applied for consistency with this transfusion based re-classification. 4 MACCE includes all-cause death, myocardial infarction (MI), all stroke, and reintervention. 5 MAE includes all death, MI, all stroke, reintervention, cardiac perforation, cardiac tamponade, cardiogenic shock, valve embolism/device migration, prosthetic valve dysfunction, acute kidney injury, major vascular complication, life threatening or disabling bleed, major bleed, valve endocarditis VARC I Definitions. 6 Bleeding complications and MAE rate cells have been intentionally left blank for SAVR in this table because of differing definitions employed for bleeding complications have made comparison of the rates to TAVR inappropriate. 7 Patients with pacemaker or ICD at baseline are excluded from the numerator and denominator. Note one (1) TAVR patient and two (2) SAVR patients with baseline pacemaker/ICD, received new pacemaker/ICD between 30–365 days. 8 Patients with pacemaker or ICD at baseline are included in the denominator.
Table 15: High Risk Cohort Adverse Event Summary – Iliofemoral As Treated Population
Event 0-30 Days 0-12 Months
TAVR
N=323
SAVR
N=300
TAVR
N=323
SAVR
N=300
# Pts
(#Event)
K-M Rate (%)
# Pts (#Event)
K-M Rate (%)
# Pts (#Event)
K-M Rate (%)
# Pts (#Event)
K-M Rate (%)
All-Cause Mortality 11 (11) 3.4% 13 (13) 4.3% 43 (43) 13.4% 52 (52) 17.6%
Cardiovascular 10 (10) 3.1% 13 (13) 4.3% 32 (32) 10.1% 35 (35) 12.0%
Valve-Related1 8 (8) 2.5% 1 (1) 0.3% 18 (18) 5.7% 4 (4) 1.5%
Non-Cardiovascular
1 (1) 0.3% 0 (0) 0.0% 11 (11) 3.7% 17 (17) 6.3%
Reintervention 2 (2) 0.6% 0 (0) 0.0% 6 (6) 2.0% 0 (0) 0.0%
Surgical 1 (1) 0.3% 0 (0) 0.0% 2 (2) 0.7% 0 (0) 0.0%
Percutaneous 1 (1) 0.3% 0 (0) 0.0% 4 (4) 1.3% 0 (0) 0.0%
Neurological Events
41 (43) 12.8% 60 (67) 20.1% 62 (79) 19.7% 85 (103) 29.4%
All Stroke 16 (17) 5.0% 15 (15) 5.0% 28 (29) 9.0% 30 (32) 10.8%
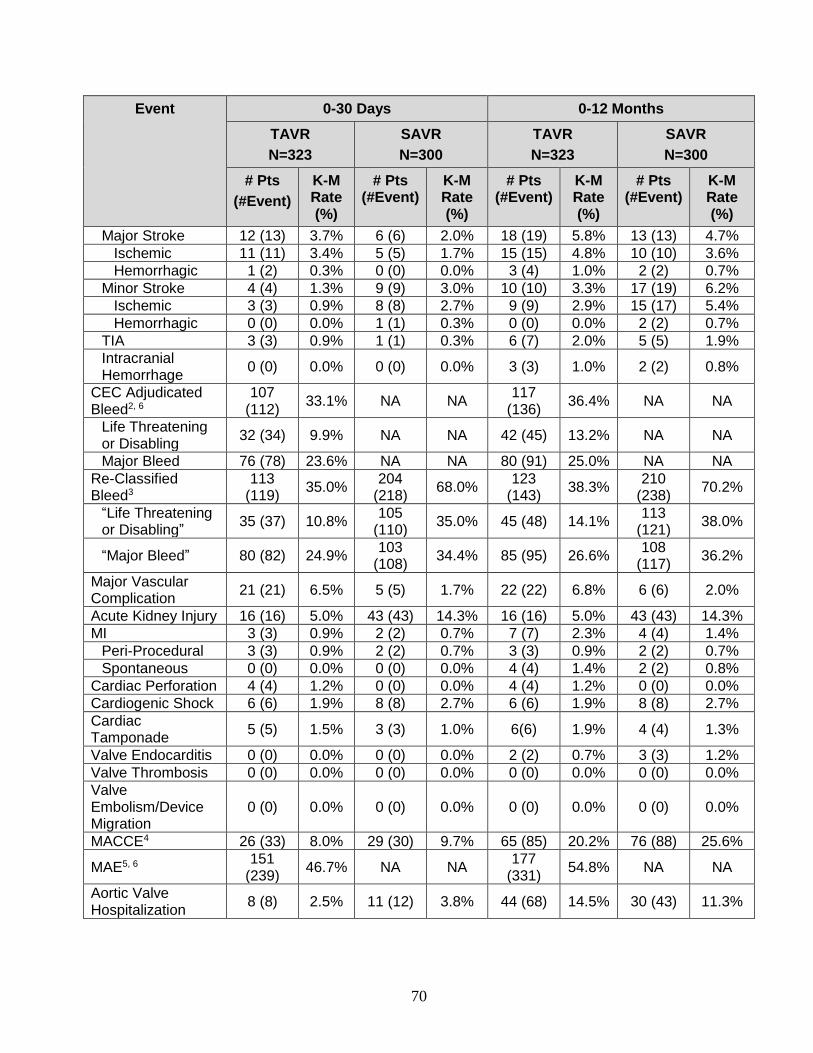
70
Event 0-30 Days 0-12 Months
TAVR
N=323
SAVR
N=300
TAVR
N=323
SAVR
N=300
# Pts
(#Event)
K-M Rate (%)
# Pts (#Event)
K-M Rate (%)
# Pts (#Event)
K-M Rate (%)
# Pts (#Event)
K-M Rate (%)
Major Stroke 12 (13) 3.7% 6 (6) 2.0% 18 (19) 5.8% 13 (13) 4.7%
Ischemic 11 (11) 3.4% 5 (5) 1.7% 15 (15) 4.8% 10 (10) 3.6%
Hemorrhagic 1 (2) 0.3% 0 (0) 0.0% 3 (4) 1.0% 2 (2) 0.7%
Minor Stroke 4 (4) 1.3% 9 (9) 3.0% 10 (10) 3.3% 17 (19) 6.2%
Ischemic 3 (3) 0.9% 8 (8) 2.7% 9 (9) 2.9% 15 (17) 5.4%
Hemorrhagic 0 (0) 0.0% 1 (1) 0.3% 0 (0) 0.0% 2 (2) 0.7%
TIA 3 (3) 0.9% 1 (1) 0.3% 6 (7) 2.0% 5 (5) 1.9%
Intracranial Hemorrhage
0 (0) 0.0% 0 (0) 0.0% 3 (3) 1.0% 2 (2) 0.8%
CEC Adjudicated Bleed2, 6
107 (112)
33.1% NA NA 117
(136) 36.4% NA NA
Life Threatening or Disabling
32 (34) 9.9% NA NA 42 (45) 13.2% NA NA
Major Bleed 76 (78) 23.6% NA NA 80 (91) 25.0% NA NA
Re-Classified Bleed3
113 (119)
35.0% 204
(218) 68.0%
123 (143)
38.3% 210
(238) 70.2%
“Life Threatening or Disabling”
35 (37) 10.8% 105
(110) 35.0% 45 (48) 14.1%
113 (121)
38.0%
“Major Bleed” 80 (82) 24.9% 103
(108) 34.4% 85 (95) 26.6%
108 (117)
36.2%
Major Vascular Complication
21 (21) 6.5% 5 (5) 1.7% 22 (22) 6.8% 6 (6) 2.0%
Acute Kidney Injury 16 (16) 5.0% 43 (43) 14.3% 16 (16) 5.0% 43 (43) 14.3%
MI 3 (3) 0.9% 2 (2) 0.7% 7 (7) 2.3% 4 (4) 1.4%
Peri-Procedural 3 (3) 0.9% 2 (2) 0.7% 3 (3) 0.9% 2 (2) 0.7%
Spontaneous 0 (0) 0.0% 0 (0) 0.0% 4 (4) 1.4% 2 (2) 0.8%
Cardiac Perforation 4 (4) 1.2% 0 (0) 0.0% 4 (4) 1.2% 0 (0) 0.0%
Cardiogenic Shock 6 (6) 1.9% 8 (8) 2.7% 6 (6) 1.9% 8 (8) 2.7%
Cardiac Tamponade
5 (5) 1.5% 3 (3) 1.0% 6(6) 1.9% 4 (4) 1.3%
Valve Endocarditis 0 (0) 0.0% 0 (0) 0.0% 2 (2) 0.7% 3 (3) 1.2%
Valve Thrombosis 0 (0) 0.0% 0 (0) 0.0% 0 (0) 0.0% 0 (0) 0.0%
Valve Embolism/Device Migration
0 (0) 0.0% 0 (0) 0.0% 0 (0) 0.0% 0 (0) 0.0%
MACCE4 26 (33) 8.0% 29 (30) 9.7% 65 (85) 20.2% 76 (88) 25.6%
MAE5, 6 151
(239) 46.7% NA NA
177 (331)
54.8% NA NA
Aortic Valve Hospitalization
8 (8) 2.5% 11 (12) 3.8% 44 (68) 14.5% 30 (43) 11.3%
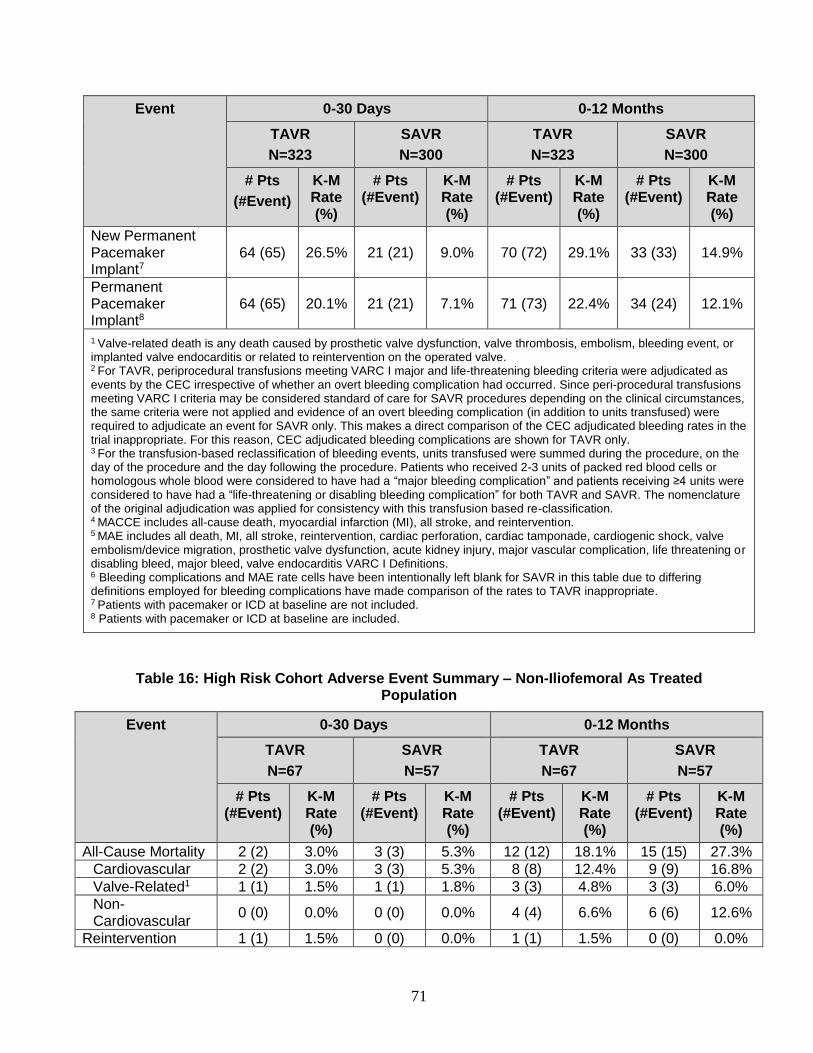
71
Event 0-30 Days 0-12 Months
TAVR
N=323
SAVR
N=300
TAVR
N=323
SAVR
N=300
# Pts
(#Event)
K-M Rate (%)
# Pts (#Event)
K-M Rate (%)
# Pts (#Event)
K-M Rate (%)
# Pts (#Event)
K-M Rate (%)
New Permanent Pacemaker Implant7
64 (65) 26.5% 21 (21) 9.0% 70 (72) 29.1% 33 (33) 14.9%
Permanent Pacemaker Implant8
64 (65) 20.1% 21 (21) 7.1% 71 (73) 22.4% 34 (24) 12.1%
1 Valve-related death is any death caused by prosthetic valve dysfunction, valve thrombosis, embolism, bleeding event, or implanted valve endocarditis or related to reintervention on the operated valve. 2 For TAVR, periprocedural transfusions meeting VARC I major and life-threatening bleeding criteria were adjudicated as events by the CEC irrespective of whether an overt bleeding complication had occurred. Since peri-procedural transfusions meeting VARC I criteria may be considered standard of care for SAVR procedures depending on the clinical circumstances, the same criteria were not applied and evidence of an overt bleeding complication (in addition to units transfused) were required to adjudicate an event for SAVR only. This makes a direct comparison of the CEC adjudicated bleeding rates in the trial inappropriate. For this reason, CEC adjudicated bleeding complications are shown for TAVR only. 3 For the transfusion-based reclassification of bleeding events, units transfused were summed during the procedure, on the day of the procedure and the day following the procedure. Patients who received 2-3 units of packed red blood cells or homologous whole blood were considered to have had a “major bleeding complication” and patients receiving ≥4 units were considered to have had a “life-threatening or disabling bleeding complication” for both TAVR and SAVR. The nomenclature of the original adjudication was applied for consistency with this transfusion based re-classification. 4 MACCE includes all-cause death, myocardial infarction (MI), all stroke, and reintervention. 5 MAE includes all death, MI, all stroke, reintervention, cardiac perforation, cardiac tamponade, cardiogenic shock, valve embolism/device migration, prosthetic valve dysfunction, acute kidney injury, major vascular complication, life threatening or disabling bleed, major bleed, valve endocarditis VARC I Definitions. 6 Bleeding complications and MAE rate cells have been intentionally left blank for SAVR in this table due to differing definitions employed for bleeding complications have made comparison of the rates to TAVR inappropriate. 7 Patients with pacemaker or ICD at baseline are not included. 8 Patients with pacemaker or ICD at baseline are included.
Table 16: High Risk Cohort Adverse Event Summary – Non-Iliofemoral As Treated Population
Event 0-30 Days 0-12 Months
TAVR
N=67
SAVR
N=57
TAVR
N=67
SAVR
N=57
# Pts (#Event)
K-M Rate (%)
# Pts (#Event)
K-M Rate (%)
# Pts (#Event)
K-M Rate (%)
# Pts (#Event)
K-M Rate (%)
All-Cause Mortality 2 (2) 3.0% 3 (3) 5.3% 12 (12) 18.1% 15 (15) 27.3%
Cardiovascular 2 (2) 3.0% 3 (3) 5.3% 8 (8) 12.4% 9 (9) 16.8%
Valve-Related1 1 (1) 1.5% 1 (1) 1.8% 3 (3) 4.8% 3 (3) 6.0%
Non-Cardiovascular
0 (0) 0.0% 0 (0) 0.0% 4 (4) 6.6% 6 (6) 12.6%
Reintervention 1 (1) 1.5% 0 (0) 0.0% 1 (1) 1.5% 0 (0) 0.0%

72
Event 0-30 Days 0-12 Months
TAVR
N=67
SAVR
N=57
TAVR
N=67
SAVR
N=57
# Pts (#Event)
K-M Rate (%)
# Pts (#Event)
K-M Rate (%)
# Pts (#Event)
K-M Rate (%)
# Pts (#Event)
K-M Rate (%)
Surgical 1 (1) 1.5% 0 (0) 0.0% 1 (1) 1.5% 0 (0) 0.0%
Percutaneous 0 (0) 0.0% 0 (0) 0.0% 0 (0) 0.0% 0 (0) 0.0%
Neurological Events
15 (18) 22.7% 19 (23) 33.4% 17 (22) 25.8% 25 (30) 44.6%
All Stroke 3 (3) 4.5% 7 (8) 12.3% 5 (5) 7.7% 12 (13) 22.3%
Major Stroke 3 (3) 4.5% 5 (5) 8.8% 4 (4) 6.1% 10 (10) 18.7%
Ischemic 3 (3) 4.5% 4 (4) 7.0% 4 (4) 6.1% 8 (8) 15.4%
Hemorrhagic 0 (0) 0.0% 0 (0) 0.0% 0 (0) 0.0% 1 (1) 1.9%
Minor Stroke 0 (0) 0.0% 3 (3) 5.3% 1 (1) 1.6% 3 (3) 5.3%
Ischemic 0 (0) 0.0% 3 (3) 5.3% 1 (1) 1.6% 3 (3) 5.3%
Hemorrhagic 0 (0) 0.0% 0 (0) 0.0% 0 (0) 0.0% 0 (0) 0.0%
TIA 0 (0) 0.0% 0 (0) 0.0% 0 (0) 0.0% 0 (0) 0.0%
Intracranial Hemorrhage
0 (0) 0.0% 0 (0) 0.0% 0 (0) 0.0% 0 (0) 0.0%
CEC Adjudicated Bleed2, 6
43 (49) 64.2% NA NA 43 (50) 64.2% NA NA
Life Threatening or Disabling
16 (19) 23.9% NA NA 17 (20) 25.5% NA NA
Major Bleed 30 (30) 45.1% NA NA 30 (30) 45.1% NA NA
Re-Classified Bleed3
44 (51) 65.7% 39 (40) 68.4% 44 (52) 65.7% 42 (52) 74.3%
“Life Threatening or Disabling”
18 (21) 26.9% 20 (20) 35.1% 19 (22) 28.5% 23 (29) 40.5%
“Major Bleed” 29 (30) 43.6% 20 (20) 35.1% 29 (30) 43.6% 22 (23) 39.8%
Major Vascular Complication
2 (2) 3.0% 1 (1) 1.8% 2 (2) 3.0% 1 (1) 1.8%
Acute Kidney Injury 7 (7) 10.6% 11 (11) 19.3% 7 (7) 10.6% 11 (11) 19.3%
MI 0 (0) 0.0% 1 (1) 1.8% 0 (0) 0.0% 1 (1) 1.8%
Peri-Procedural 0 (0) 0.0% 0 (0) 0.0% 0 (0) 0.0% 0 (0) 0.0%
Spontaneous 0 (0) 0.0% 1 (1) 1.8% 0 (0) 0.0% 1 (1) 1.8%
Cardiac Perforation 1 (1) 1.5% 0 (0) 0.0% 1 (1) 1.5% 0 (0) 0.0%
Cardiogenic Shock 3 (3) 4.5% 3 (3) 5.3% 3 (3) 4.5% 3 (3) 5.3%
Cardiac Tamponade
1 (1) 1.5% 1 (1) 1.9% 1 (1) 1.5% 1 (1) 1.9%
Valve Endocarditis 0 (0) 0.0% 0 (0) 0.0% 0 (0) 0.0% 1 (1) 2.3%
Valve Thrombosis 0 (0) 0.0% 0 (0) 0.0% 0 (0) 0.0% 0 (0) 0.0%
Valve Embolism/Device Migration
0 (0) 0.0% 0 (0) 0.0% 0 (0) 0.0% 0 (0) 0.0%
MACCE4 4 (6) 6.1% 8 (12) 14.0% 14 (18) 21.4% 20 (29) 36.1%
MAE5, 6 49 (72) 73.1% NA NA 52 (86) 77.6% NA NA
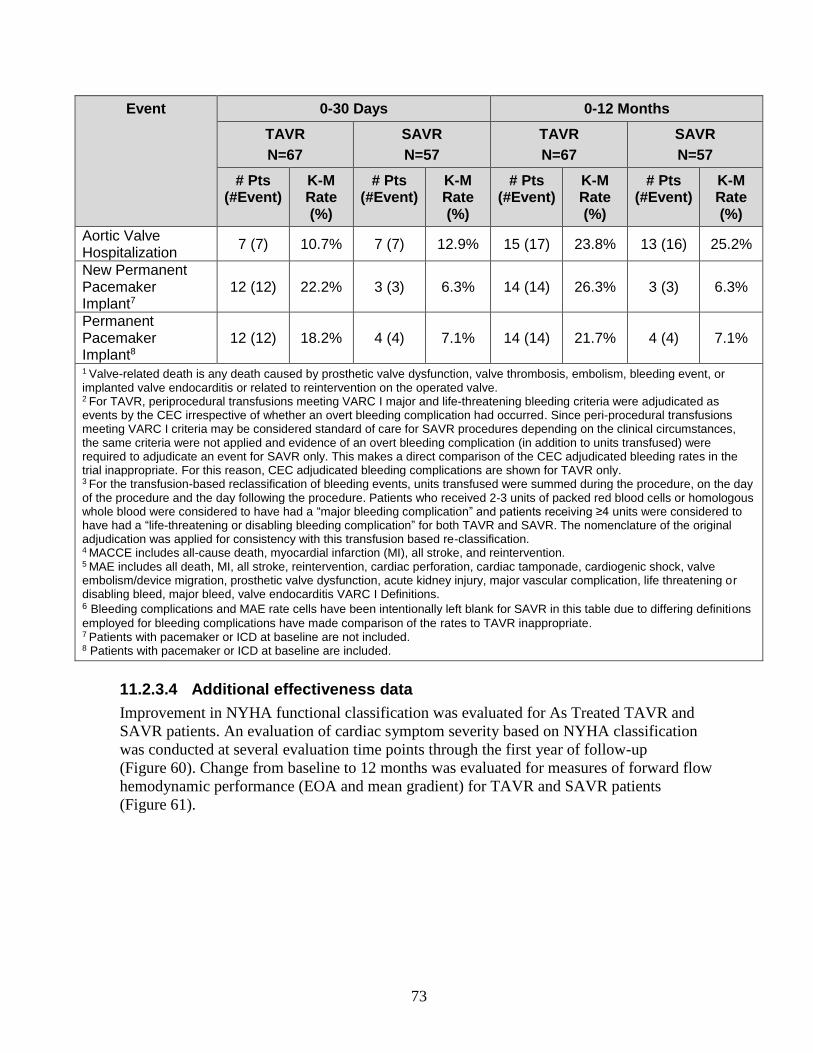
73
Event 0-30 Days 0-12 Months
TAVR
N=67
SAVR
N=57
TAVR
N=67
SAVR
N=57
# Pts (#Event)
K-M Rate (%)
# Pts (#Event)
K-M Rate (%)
# Pts (#Event)
K-M Rate (%)
# Pts (#Event)
K-M Rate (%)
Aortic Valve Hospitalization
7 (7) 10.7% 7 (7) 12.9% 15 (17) 23.8% 13 (16) 25.2%
New Permanent Pacemaker Implant7
12 (12) 22.2% 3 (3) 6.3% 14 (14) 26.3% 3 (3) 6.3%
Permanent Pacemaker Implant8
12 (12) 18.2% 4 (4) 7.1% 14 (14) 21.7% 4 (4) 7.1%
1 Valve-related death is any death caused by prosthetic valve dysfunction, valve thrombosis, embolism, bleeding event, or implanted valve endocarditis or related to reintervention on the operated valve. 2 For TAVR, periprocedural transfusions meeting VARC I major and life-threatening bleeding criteria were adjudicated as events by the CEC irrespective of whether an overt bleeding complication had occurred. Since peri-procedural transfusions meeting VARC I criteria may be considered standard of care for SAVR procedures depending on the clinical circumstances, the same criteria were not applied and evidence of an overt bleeding complication (in addition to units transfused) were required to adjudicate an event for SAVR only. This makes a direct comparison of the CEC adjudicated bleeding rates in the trial inappropriate. For this reason, CEC adjudicated bleeding complications are shown for TAVR only. 3 For the transfusion-based reclassification of bleeding events, units transfused were summed during the procedure, on the day of the procedure and the day following the procedure. Patients who received 2-3 units of packed red blood cells or homologous whole blood were considered to have had a “major bleeding complication” and patients receiving ≥4 units were considered to have had a “life-threatening or disabling bleeding complication” for both TAVR and SAVR. The nomenclature of the original adjudication was applied for consistency with this transfusion based re-classification. 4 MACCE includes all-cause death, myocardial infarction (MI), all stroke, and reintervention. 5 MAE includes all death, MI, all stroke, reintervention, cardiac perforation, cardiac tamponade, cardiogenic shock, valve embolism/device migration, prosthetic valve dysfunction, acute kidney injury, major vascular complication, life threatening or disabling bleed, major bleed, valve endocarditis VARC I Definitions. 6 Bleeding complications and MAE rate cells have been intentionally left blank for SAVR in this table due to differing definitions
employed for bleeding complications have made comparison of the rates to TAVR inappropriate. 7 Patients with pacemaker or ICD at baseline are not included. 8 Patients with pacemaker or ICD at baseline are included.
11.2.3.4 Additional effectiveness data
Improvement in NYHA functional classification was evaluated for As Treated TAVR and
SAVR patients. An evaluation of cardiac symptom severity based on NYHA classification
was conducted at several evaluation time points through the first year of follow-up
(Figure 60). Change from baseline to 12 months was evaluated for measures of forward flow
hemodynamic performance (EOA and mean gradient) for TAVR and SAVR patients
(Figure 61).
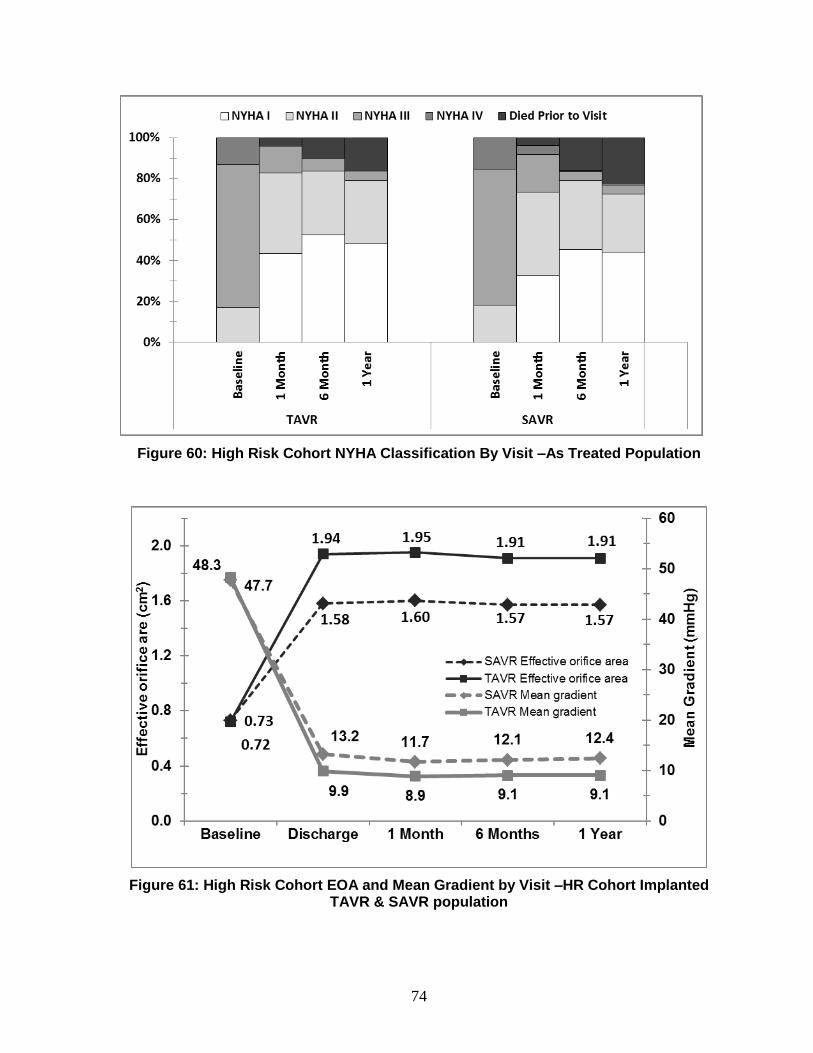
74
Figure 60: High Risk Cohort NYHA Classification By Visit –As Treated Population
Figure 61: High Risk Cohort EOA and Mean Gradient by Visit –HR Cohort Implanted TAVR & SAVR population
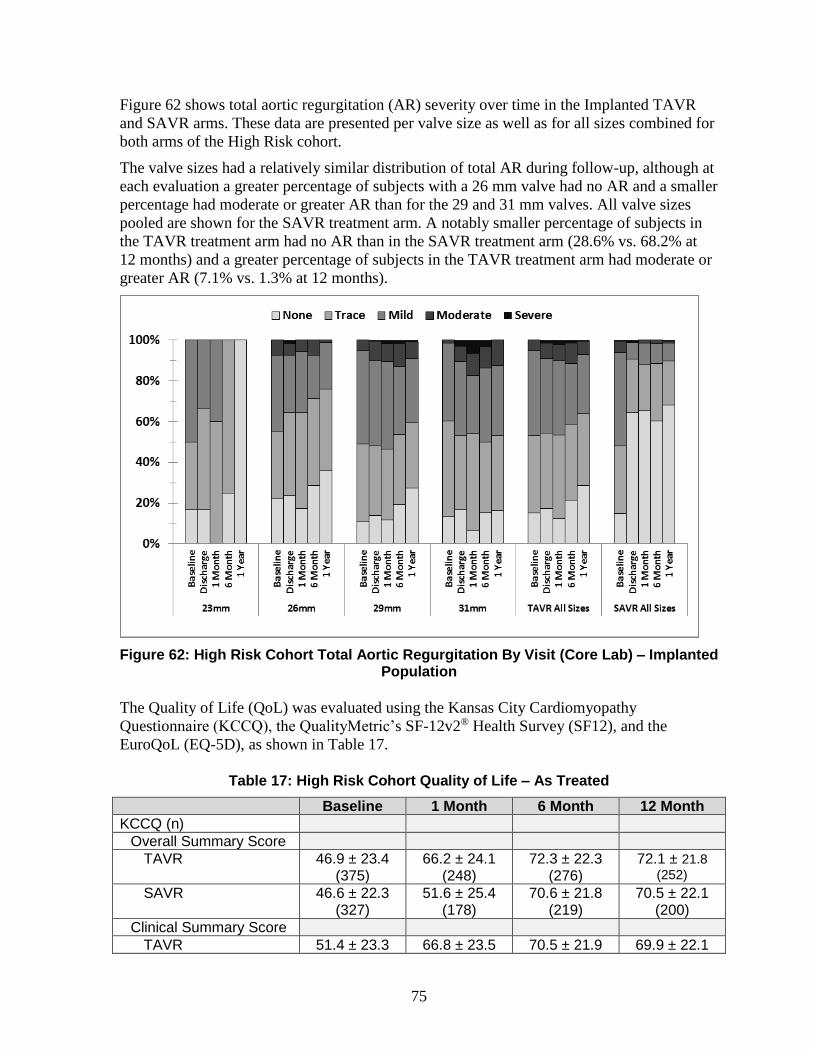
75
Figure 62 shows total aortic regurgitation (AR) severity over time in the Implanted TAVR
and SAVR arms. These data are presented per valve size as well as for all sizes combined for
both arms of the High Risk cohort.
The valve sizes had a relatively similar distribution of total AR during follow-up, although at
each evaluation a greater percentage of subjects with a 26 mm valve had no AR and a smaller
percentage had moderate or greater AR than for the 29 and 31 mm valves. All valve sizes
pooled are shown for the SAVR treatment arm. A notably smaller percentage of subjects in
the TAVR treatment arm had no AR than in the SAVR treatment arm (28.6% vs. 68.2% at
12 months) and a greater percentage of subjects in the TAVR treatment arm had moderate or
greater AR (7.1% vs. 1.3% at 12 months).
Figure 62: High Risk Cohort Total Aortic Regurgitation By Visit (Core Lab) – Implanted Population
The Quality of Life (QoL) was evaluated using the Kansas City Cardiomyopathy
Questionnaire (KCCQ), the QualityMetric’s SF-12v2® Health Survey (SF12), and the
EuroQoL (EQ-5D), as shown in Table 17.
Table 17: High Risk Cohort Quality of Life – As Treated
Baseline 1 Month 6 Month 12 Month
KCCQ (n)
Overall Summary Score
TAVR 46.9 ± 23.4 (375)
66.2 ± 24.1 (248)
72.3 ± 22.3 (276)
72.1 ± 21.8
(252)
SAVR 46.6 ± 22.3 (327)
51.6 ± 25.4 (178)
70.6 ± 21.8 (219)
70.5 ± 22.1 (200)
Clinical Summary Score
TAVR 51.4 ± 23.3 66.8 ± 23.5 70.5 ± 21.9 69.9 ± 22.1
76
Baseline 1 Month 6 Month 12 Month
(375) (248) (276) (252)
SAVR 50.8 ± 22.3 (327)
54.8 ± 24.5 (178)
70.3 ± 21.2 (219)
68.3 ± 22.2 (200)
SF12 (n)
Physical Component
TAVR 30.8 ± 9.2 (361)
35.9 ± 9.5 (228)
37.3 ± 10.3 (263)
37.0 ± 11.2 (237)
SAVR 31.0 ± 8.6 (309)
31.7 ± 8.5 (167)
37.6 ± 10.1 (209)
36.9 ± 9.7 (188)
Mental Component
TAVR 47.5 ± 12.1 (361)
51.1 ± 11.1 (228)
52.5 ± 10.9 (263)
52.8 ± 10.8 (237)
SAVR 48.4 ± 11.7 (309)
45.0 ± 13.1 (167)
51.1 ± 10.9 (209)
52.5 ± 10.5 (188)
EQ-5D (n)
TAVR 0.73 ± 0.20 (370)
0.78 ± 0.19 (244)
0.79 ± 0.19 (270)
0.78 ± 0.18 (248)
SAVR 0.73 ± 0.18 (326)
0.67 ± 0.25 (173)
0.80 ± 0.15 (215)
0.78 ± 0.18 (193)
Plus-minus values are mean ± standard deviation.
11.2.4 Additional study observations
Primary endpoint stratified by access route
The study was powered to demonstrate non-inferiority of TAVR compared to SAVR for the
primary endpoint for all patients (iliofemoral and non-iliofemoral) pooled. It was pre-
specified that the primary endpoint would be assessed for different access route subgroups
independently, but this assessment was not powered and would not be the basis for assessing
success or failure of the primary endpoint. The all-cause mortality rates are shown in
Figure 63 for the iliofemoral subgroup and Figure 64 for the non-iliofemoral subgroup.
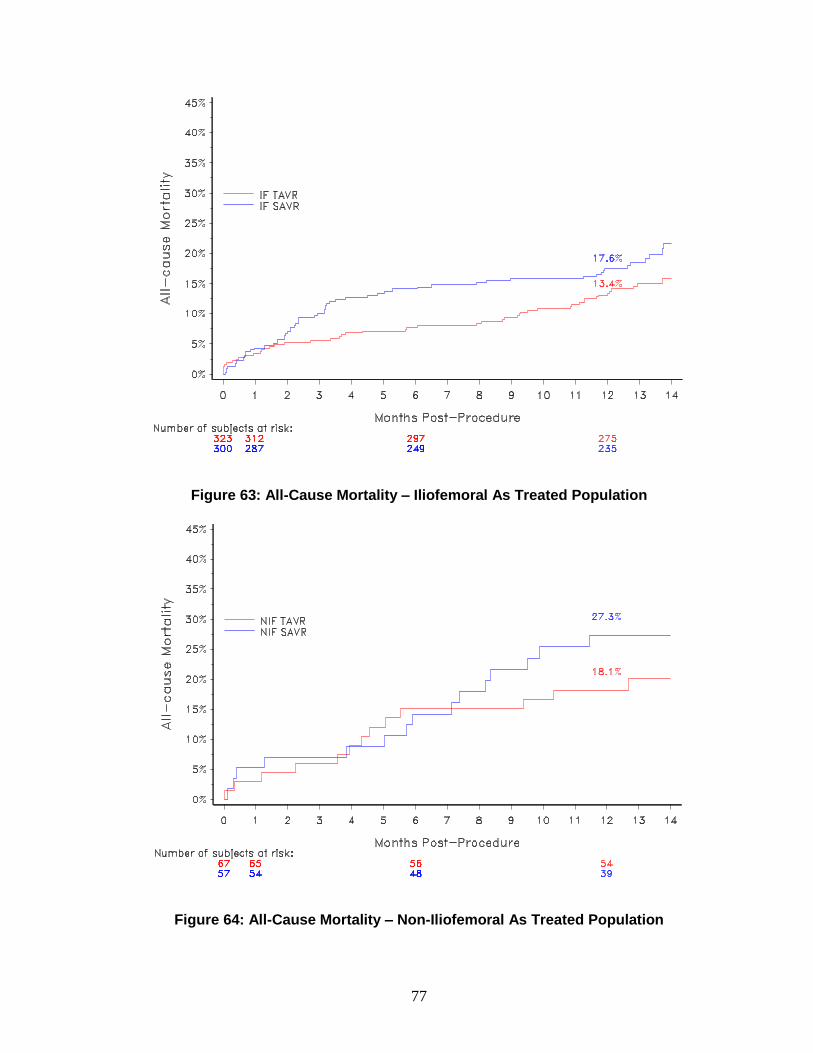
77
Figure 63: All-Cause Mortality – Iliofemoral As Treated Population
Figure 64: All-Cause Mortality – Non-Iliofemoral As Treated Population
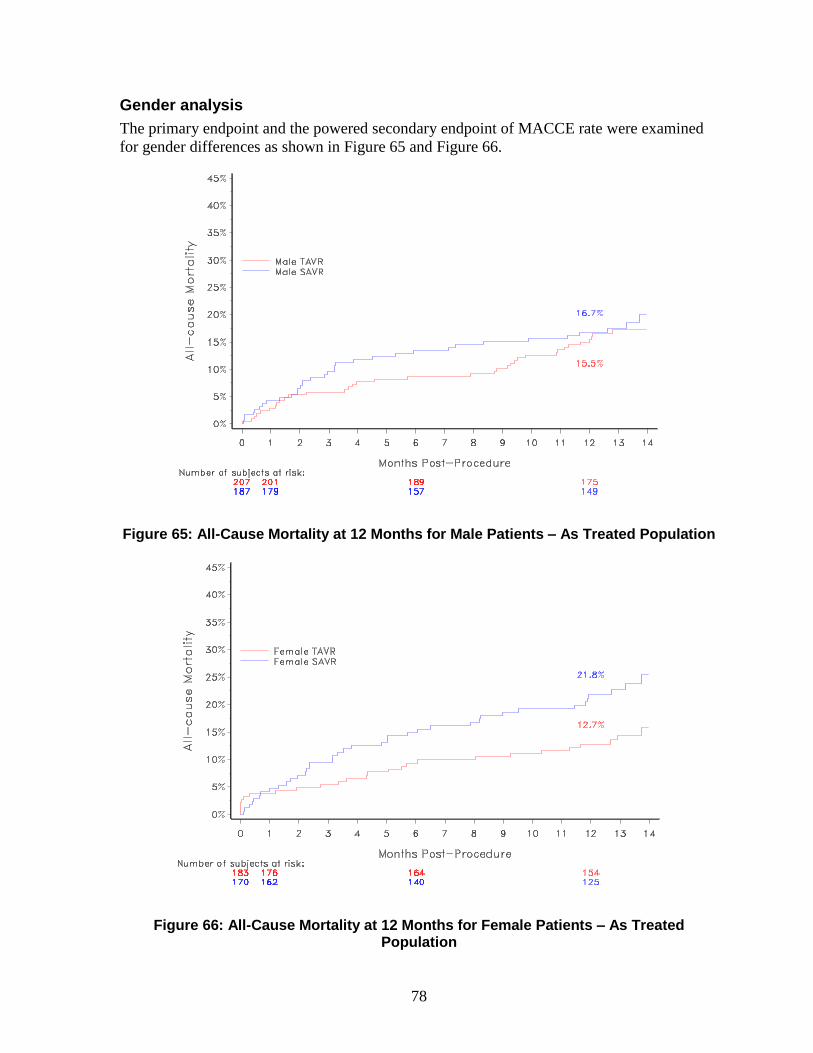
78
Gender analysis
The primary endpoint and the powered secondary endpoint of MACCE rate were examined
for gender differences as shown in Figure 65 and Figure 66.
Figure 65: All-Cause Mortality at 12 Months for Male Patients – As Treated Population
Figure 66: All-Cause Mortality at 12 Months for Female Patients – As Treated Population

79
Mortality stratified by STS score
An analysis was performed for TAVR patients to examine the relationship between all-cause
mortality and STS predicted risk of mortality at baseline (Figure 67). Patients were stratified
by STS score with the subgroups being STS <4, STS 4–7, STS >7–15, and STS >15.
Figure 67: High Risk Cohort All-Cause Mortality by STS – TAVR As Treated Population
Post-implant aortic regurgitation and all-cause mortality
A post hoc subgroup analysis was performed for all TAVR patients (iliofemoral and non-
iliofemoral) of the Implanted population to investigate the relationship between all-cause
mortality and severity of aortic regurgitation at discharge (7 days post procedure or
discharge, whichever is first). Two subgroups of iliofemoral patients with none/trace and
greater than or equal to mild total aortic regurgitation at discharge were analyzed. The results
from the analysis are shown in Figure 68 which show that residual aortic regurgitation at
discharge appeared to be associated with long-term mortality in the TAVR patients.
However, it was also noted that there were some differences in important baseline clinical
characteristics of the patients between the two subgroups, as summarized in Table 18. As a
result, it is not clear whether there was a causal relationship between residual aortic
regurgitation and mortality. Nevertheless, the incidence of residual aortic regurgitation and
its apparent association with late-term mortality will need to be carefully monitored in post-
approval follow-up.
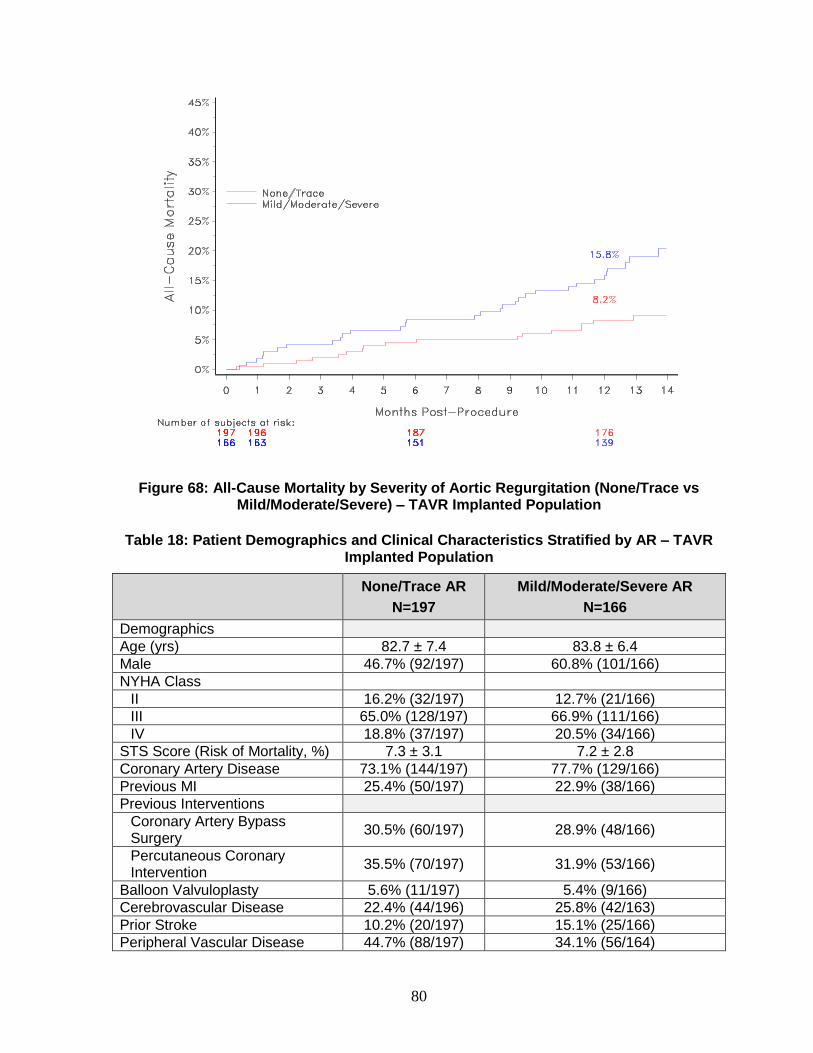
80
Figure 68: All-Cause Mortality by Severity of Aortic Regurgitation (None/Trace vs Mild/Moderate/Severe) – TAVR Implanted Population
Table 18: Patient Demographics and Clinical Characteristics Stratified by AR – TAVR Implanted Population
None/Trace AR
N=197
Mild/Moderate/Severe AR
N=166
Demographics
Age (yrs) 82.7 ± 7.4 83.8 ± 6.4
Male 46.7% (92/197) 60.8% (101/166)
NYHA Class
II 16.2% (32/197) 12.7% (21/166)
III 65.0% (128/197) 66.9% (111/166)
IV 18.8% (37/197) 20.5% (34/166)
STS Score (Risk of Mortality, %) 7.3 ± 3.1 7.2 ± 2.8
Coronary Artery Disease 73.1% (144/197) 77.7% (129/166)
Previous MI 25.4% (50/197) 22.9% (38/166)
Previous Interventions
Coronary Artery Bypass Surgery
30.5% (60/197) 28.9% (48/166)
Percutaneous Coronary Intervention
35.5% (70/197) 31.9% (53/166)
Balloon Valvuloplasty 5.6% (11/197) 5.4% (9/166)
Cerebrovascular Disease 22.4% (44/196) 25.8% (42/163)
Prior Stroke 10.2% (20/197) 15.1% (25/166)
Peripheral Vascular Disease 44.7% (88/197) 34.1% (56/164)
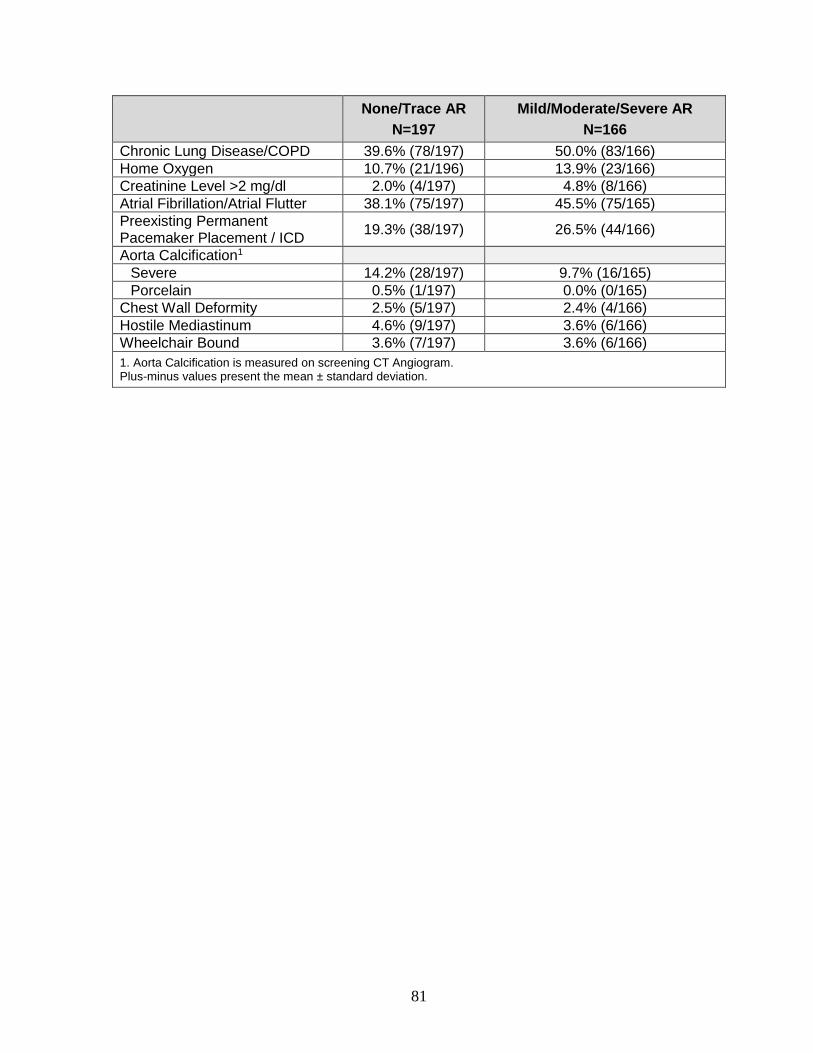
81
None/Trace AR
N=197
Mild/Moderate/Severe AR
N=166
Chronic Lung Disease/COPD 39.6% (78/197) 50.0% (83/166)
Home Oxygen 10.7% (21/196) 13.9% (23/166)
Creatinine Level >2 mg/dl 2.0% (4/197) 4.8% (8/166)
Atrial Fibrillation/Atrial Flutter 38.1% (75/197) 45.5% (75/165)
Preexisting Permanent Pacemaker Placement / ICD
19.3% (38/197) 26.5% (44/166)
Aorta Calcification1
Severe 14.2% (28/197) 9.7% (16/165)
Porcelain 0.5% (1/197) 0.0% (0/165)
Chest Wall Deformity 2.5% (5/197) 2.4% (4/166)
Hostile Mediastinum 4.6% (9/197) 3.6% (6/166)
Wheelchair Bound 3.6% (7/197) 3.6% (6/166)
1. Aorta Calcification is measured on screening CT Angiogram. Plus-minus values present the mean ± standard deviation.
82
11.3 Extreme risk cohort
The CoreValve™ U.S. Pivotal Trial Extreme Risk cohort was a prospective, non-
randomized, unblinded, multi-center investigational study. All enrolled patients were
assigned to transcatheter aortic valve replacement (TAVR) with the Medtronic CoreValve™
system. The purpose of this clinical study was to evaluate the safety and effectiveness of the
Medtronic CoreValve™ system in the treatment of symptomatic severe aortic stenosis in
patients requiring aortic valve replacement with predicted operative mortality or serious,
irreversible morbidity risk of ≥50% at 30 days (Extreme Risk).
This Extreme Risk cohort enrolled 656 patients with symptomatic severe aortic stenosis
(500 iliofemoral and 156 non-iliofemoral patients) at 41 of the 43 activated centers in the
United States with baseline characteristics described in Table 19. Severe aortic stenosis was
defined as an aortic valve area of ≤0.8 cm2 or aortic valve area index ≤0.5 cm2, a mean aortic
valve gradient of >40 mmHg or jet velocity >4 m/sec. The primary endpoint was all-cause
mortality or major stroke at 12 months. The primary analysis compared the primary endpoint
against a pre-specified performance goal.
Patients received the CoreValve™ bioprosthesis either through the iliofemoral access route
or through the non-illiofemoral (subclavian and direct aortic) access routes. An attempted
implant was performed on 489 patients via iliofemoral access and who embody the
Attempted Implantc iliofemoral cohort (n=489), which was the basis for assessment of the
primary endpoint. Of the 489 attempted implants via iliofemoral access, 486 patients were
implanted with the CoreValve™ bioprosthesis and embody the Implantedd iliofemoral cohort
(n=486), which was the basis for secondary endpoints related to hemodynamic data.
An attempted implant was performed on 150 patients via non-iliofemoral access and these
patients embody the Attempted Implant cohort. Of these 150 patients, 148 were implanted
with the CoreValve™ bioprosthesis and embody the Implanted non-iliofemoral cohort. Per
protocol, non-iliofemoral patients were not included in the primary analysis due to
anticipated heterogeneity in patient selection and outcome. Compared with patients enrolled
in the iliofemoral cohort, patients in the non-iliofemoral cohort were, generally, at a higher
risk with respect to specific critical co-morbidities.
The following data summarize the results from the Extreme Risk cohort (iliofemoral and
non-iliofemoral).
11.3.1 Patient population
The patient characteristics analyzed for the iliofemoral and non-iliofemoral enrolled cohorts
include demographics, clinical characteristics, medical history, and potentially prohibitive
anatomic factors for surgical aortic valve replacement (SAVR) and assessments for co-
morbidity, frailty, and disability (Table 19). The ability of a patient to obtain a functional
recovery after SAVR is largely based on the presence of significant co-morbidities, frailties,
and disabilities, with the combination of the factors having higher weight than the individual
c The Attempted Implant population consisted of all patients with an attempted procedure, defined as when the
patient was brought into the procedure room and any of the following had occurred: anesthesia administered,
vascular line placed, TEE placed, or any monitoring line placed. d The Implanted population consisted of all Attempted Implant patients who were actually implanted with the
CoreValve™ bioprosthesis.
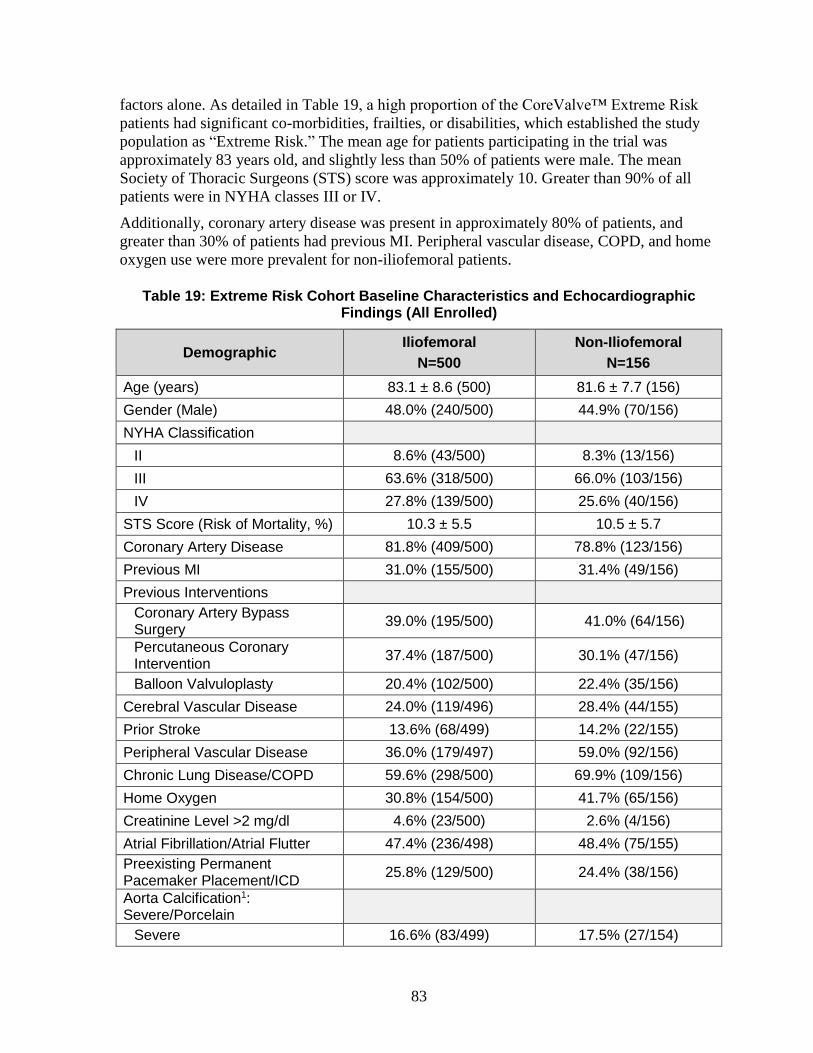
83
factors alone. As detailed in Table 19, a high proportion of the CoreValve™ Extreme Risk
patients had significant co-morbidities, frailties, or disabilities, which established the study
population as “Extreme Risk.” The mean age for patients participating in the trial was
approximately 83 years old, and slightly less than 50% of patients were male. The mean
Society of Thoracic Surgeons (STS) score was approximately 10. Greater than 90% of all
patients were in NYHA classes III or IV.
Additionally, coronary artery disease was present in approximately 80% of patients, and
greater than 30% of patients had previous MI. Peripheral vascular disease, COPD, and home
oxygen use were more prevalent for non-iliofemoral patients.
Table 19: Extreme Risk Cohort Baseline Characteristics and Echocardiographic Findings (All Enrolled)
Demographic Iliofemoral
N=500
Non-Iliofemoral
N=156
Age (years) 83.1 ± 8.6 (500) 81.6 ± 7.7 (156)
Gender (Male) 48.0% (240/500) 44.9% (70/156)
NYHA Classification
II 8.6% (43/500) 8.3% (13/156)
III 63.6% (318/500) 66.0% (103/156)
IV 27.8% (139/500) 25.6% (40/156)
STS Score (Risk of Mortality, %) 10.3 ± 5.5 10.5 ± 5.7
Coronary Artery Disease 81.8% (409/500) 78.8% (123/156)
Previous MI 31.0% (155/500) 31.4% (49/156)
Previous Interventions
Coronary Artery Bypass Surgery
39.0% (195/500) 41.0% (64/156)
Percutaneous Coronary Intervention
37.4% (187/500) 30.1% (47/156)
Balloon Valvuloplasty 20.4% (102/500) 22.4% (35/156)
Cerebral Vascular Disease 24.0% (119/496) 28.4% (44/155)
Prior Stroke 13.6% (68/499) 14.2% (22/155)
Peripheral Vascular Disease 36.0% (179/497) 59.0% (92/156)
Chronic Lung Disease/COPD 59.6% (298/500) 69.9% (109/156)
Home Oxygen 30.8% (154/500) 41.7% (65/156)
Creatinine Level >2 mg/dl 4.6% (23/500) 2.6% (4/156)
Atrial Fibrillation/Atrial Flutter 47.4% (236/498) 48.4% (75/155)
Preexisting Permanent Pacemaker Placement/ICD
25.8% (129/500) 24.4% (38/156)
Aorta Calcification1: Severe/Porcelain
Severe 16.6% (83/499) 17.5% (27/154)
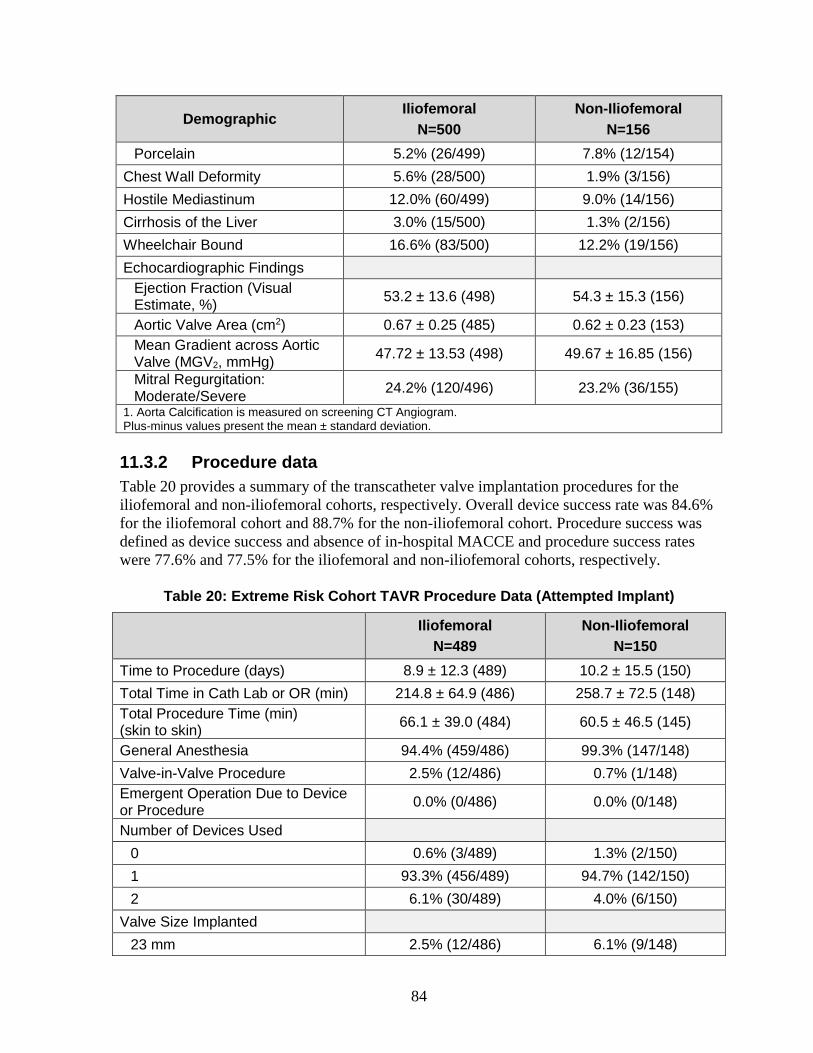
84
Demographic Iliofemoral
N=500
Non-Iliofemoral
N=156
Porcelain 5.2% (26/499) 7.8% (12/154)
Chest Wall Deformity 5.6% (28/500) 1.9% (3/156)
Hostile Mediastinum 12.0% (60/499) 9.0% (14/156)
Cirrhosis of the Liver 3.0% (15/500) 1.3% (2/156)
Wheelchair Bound 16.6% (83/500) 12.2% (19/156)
Echocardiographic Findings
Ejection Fraction (Visual Estimate, %)
53.2 ± 13.6 (498) 54.3 ± 15.3 (156)
Aortic Valve Area (cm2) 0.67 ± 0.25 (485) 0.62 ± 0.23 (153)
Mean Gradient across Aortic Valve (MGV2, mmHg)
47.72 ± 13.53 (498) 49.67 ± 16.85 (156)
Mitral Regurgitation: Moderate/Severe
24.2% (120/496) 23.2% (36/155)
1. Aorta Calcification is measured on screening CT Angiogram. Plus-minus values present the mean ± standard deviation.
11.3.2 Procedure data
Table 20 provides a summary of the transcatheter valve implantation procedures for the
iliofemoral and non-iliofemoral cohorts, respectively. Overall device success rate was 84.6%
for the iliofemoral cohort and 88.7% for the non-iliofemoral cohort. Procedure success was
defined as device success and absence of in-hospital MACCE and procedure success rates
were 77.6% and 77.5% for the iliofemoral and non-iliofemoral cohorts, respectively.
Table 20: Extreme Risk Cohort TAVR Procedure Data (Attempted Implant)
Iliofemoral
N=489
Non-Iliofemoral
N=150
Time to Procedure (days) 8.9 ± 12.3 (489) 10.2 ± 15.5 (150)
Total Time in Cath Lab or OR (min) 214.8 ± 64.9 (486) 258.7 ± 72.5 (148)
Total Procedure Time (min) (skin to skin)
66.1 ± 39.0 (484) 60.5 ± 46.5 (145)
General Anesthesia 94.4% (459/486) 99.3% (147/148)
Valve-in-Valve Procedure 2.5% (12/486) 0.7% (1/148)
Emergent Operation Due to Device or Procedure
0.0% (0/486) 0.0% (0/148)
Number of Devices Used
0 0.6% (3/489) 1.3% (2/150)
1 93.3% (456/489) 94.7% (142/150)
2 6.1% (30/489) 4.0% (6/150)
Valve Size Implanted
23 mm 2.5% (12/486) 6.1% (9/148)
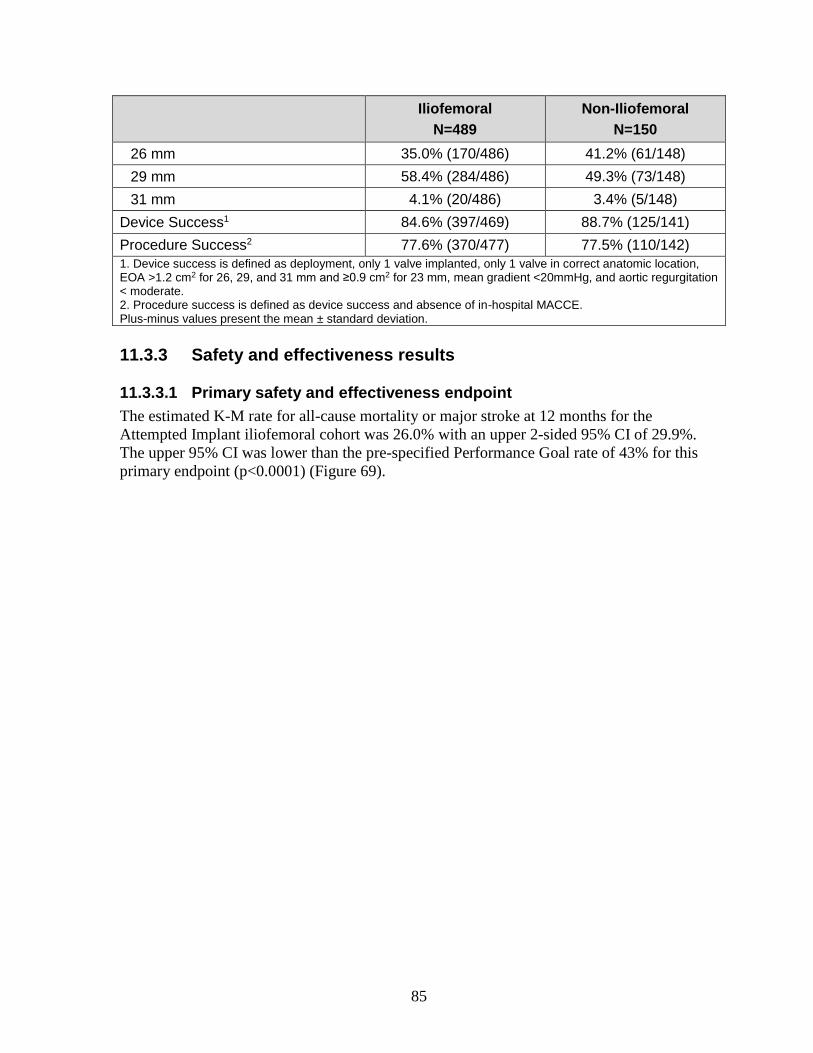
85
Iliofemoral
N=489
Non-Iliofemoral
N=150
26 mm 35.0% (170/486) 41.2% (61/148)
29 mm 58.4% (284/486) 49.3% (73/148)
31 mm 4.1% (20/486) 3.4% (5/148)
Device Success1 84.6% (397/469) 88.7% (125/141)
Procedure Success2 77.6% (370/477) 77.5% (110/142)
1. Device success is defined as deployment, only 1 valve implanted, only 1 valve in correct anatomic location, EOA >1.2 cm2 for 26, 29, and 31 mm and ≥0.9 cm2 for 23 mm, mean gradient <20mmHg, and aortic regurgitation < moderate. 2. Procedure success is defined as device success and absence of in-hospital MACCE. Plus-minus values present the mean ± standard deviation.
11.3.3 Safety and effectiveness results
11.3.3.1 Primary safety and effectiveness endpoint
The estimated K-M rate for all-cause mortality or major stroke at 12 months for the
Attempted Implant iliofemoral cohort was 26.0% with an upper 2-sided 95% CI of 29.9%.
The upper 95% CI was lower than the pre-specified Performance Goal rate of 43% for this
primary endpoint (p<0.0001) (Figure 69).
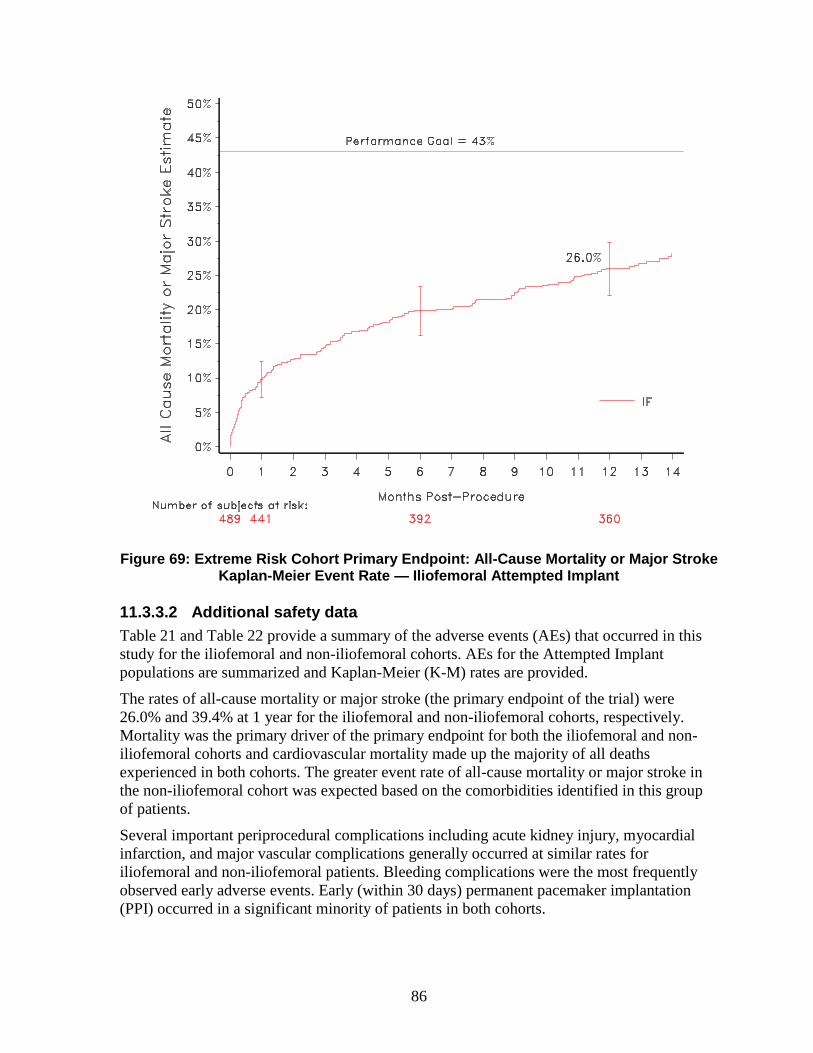
86
Figure 69: Extreme Risk Cohort Primary Endpoint: All-Cause Mortality or Major Stroke Kaplan-Meier Event Rate — Iliofemoral Attempted Implant
11.3.3.2 Additional safety data
Table 21 and Table 22 provide a summary of the adverse events (AEs) that occurred in this
study for the iliofemoral and non-iliofemoral cohorts. AEs for the Attempted Implant
populations are summarized and Kaplan-Meier (K-M) rates are provided.
The rates of all-cause mortality or major stroke (the primary endpoint of the trial) were
26.0% and 39.4% at 1 year for the iliofemoral and non-iliofemoral cohorts, respectively.
Mortality was the primary driver of the primary endpoint for both the iliofemoral and non-
iliofemoral cohorts and cardiovascular mortality made up the majority of all deaths
experienced in both cohorts. The greater event rate of all-cause mortality or major stroke in
the non-iliofemoral cohort was expected based on the comorbidities identified in this group
of patients.
Several important periprocedural complications including acute kidney injury, myocardial
infarction, and major vascular complications generally occurred at similar rates for
iliofemoral and non-iliofemoral patients. Bleeding complications were the most frequently
observed early adverse events. Early (within 30 days) permanent pacemaker implantation
(PPI) occurred in a significant minority of patients in both cohorts.
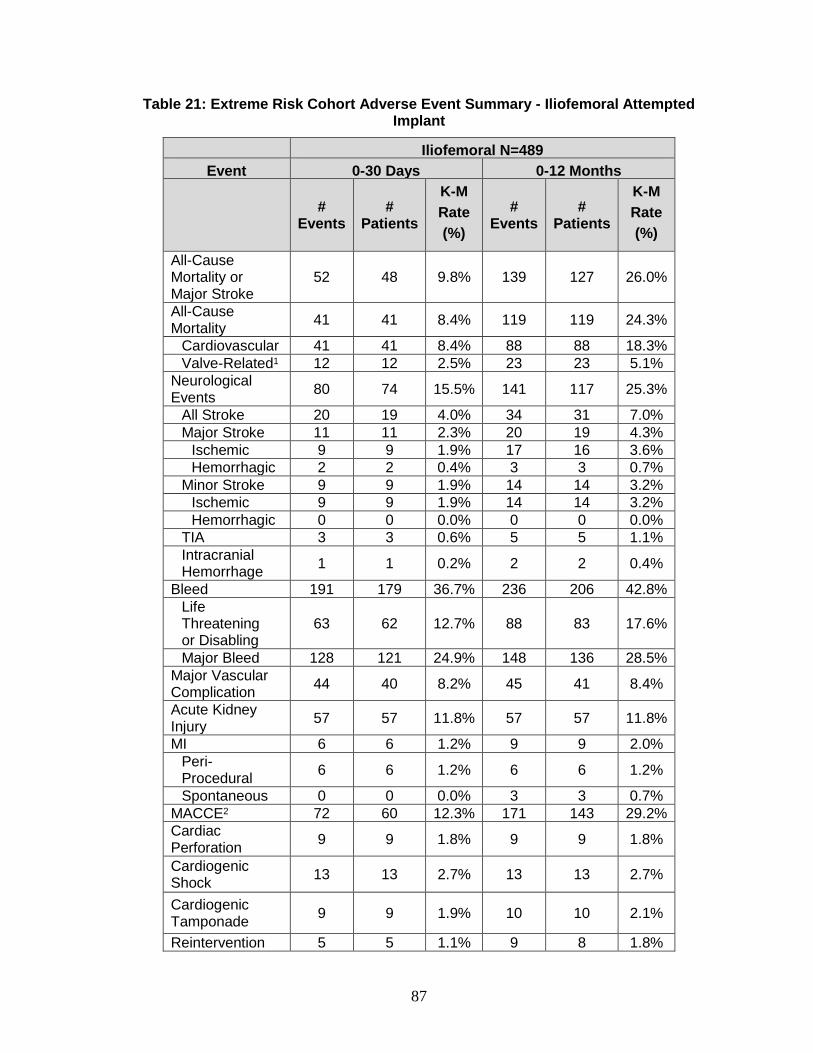
87
Table 21: Extreme Risk Cohort Adverse Event Summary - Iliofemoral Attempted Implant
Iliofemoral N=489
Event 0-30 Days 0-12 Months
#
Events #
Patients
K-M
Rate
(%)
# Events
# Patients
K-M
Rate
(%)
All-Cause Mortality or Major Stroke
52 48 9.8% 139 127 26.0%
All-Cause Mortality
41 41 8.4% 119 119 24.3%
Cardiovascular 41 41 8.4% 88 88 18.3%
Valve-Related1 12 12 2.5% 23 23 5.1%
Neurological Events
80 74 15.5% 141 117 25.3%
All Stroke 20 19 4.0% 34 31 7.0%
Major Stroke 11 11 2.3% 20 19 4.3%
Ischemic 9 9 1.9% 17 16 3.6%
Hemorrhagic 2 2 0.4% 3 3 0.7%
Minor Stroke 9 9 1.9% 14 14 3.2%
Ischemic 9 9 1.9% 14 14 3.2%
Hemorrhagic 0 0 0.0% 0 0 0.0%
TIA 3 3 0.6% 5 5 1.1%
Intracranial Hemorrhage
1 1 0.2% 2 2 0.4%
Bleed 191 179 36.7% 236 206 42.8%
Life Threatening or Disabling
63 62 12.7% 88 83 17.6%
Major Bleed 128 121 24.9% 148 136 28.5%
Major Vascular Complication
44 40 8.2% 45 41 8.4%
Acute Kidney Injury
57 57 11.8% 57 57 11.8%
MI 6 6 1.2% 9 9 2.0%
Peri-Procedural
6 6 1.2% 6 6 1.2%
Spontaneous 0 0 0.0% 3 3 0.7%
MACCE2 72 60 12.3% 171 143 29.2%
Cardiac Perforation
9 9 1.8% 9 9 1.8%
Cardiogenic Shock
13 13 2.7% 13 13 2.7%
Cardiogenic Tamponade
9 9 1.9% 10 10 2.1%
Reintervention 5 5 1.1% 9 8 1.8%
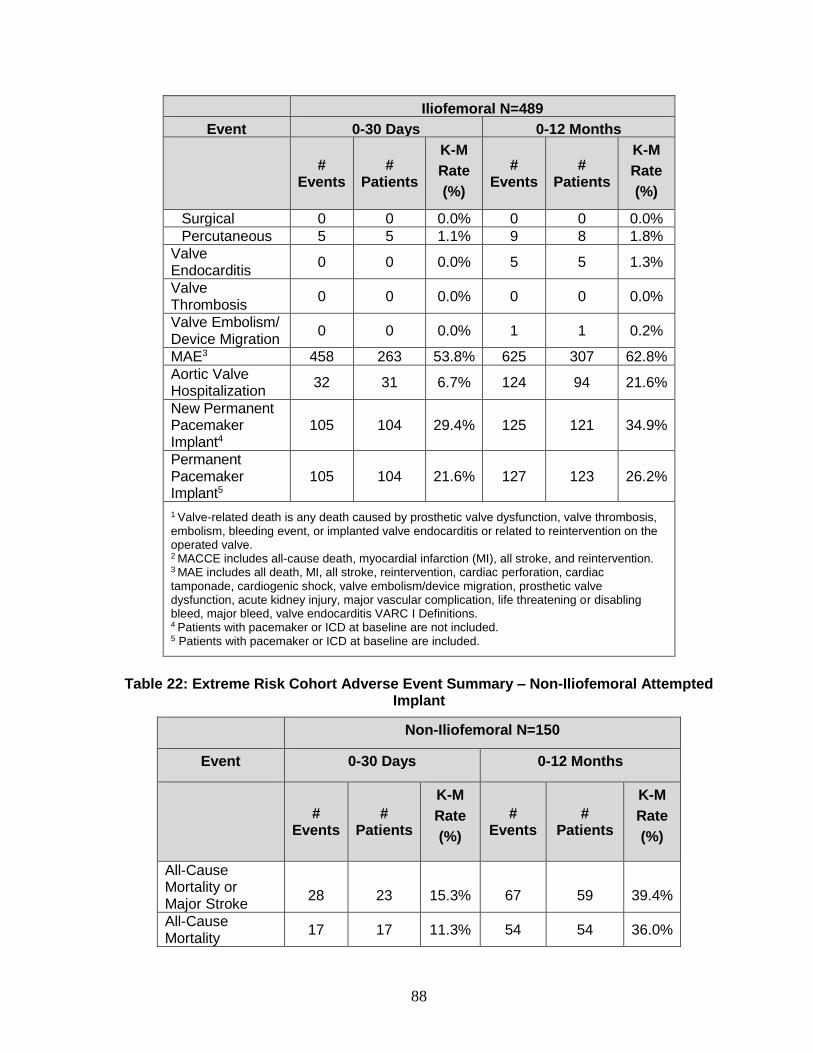
88
Iliofemoral N=489
Event 0-30 Days 0-12 Months
#
Events #
Patients
K-M
Rate
(%)
# Events
# Patients
K-M
Rate
(%)
Surgical 0 0 0.0% 0 0 0.0%
Percutaneous 5 5 1.1% 9 8 1.8%
Valve Endocarditis
0 0 0.0% 5 5 1.3%
Valve Thrombosis
0 0 0.0% 0 0 0.0%
Valve Embolism/ Device Migration
0 0 0.0% 1 1 0.2%
MAE3 458 263 53.8% 625 307 62.8%
Aortic Valve Hospitalization
32 31 6.7% 124 94 21.6%
New Permanent Pacemaker Implant4
105 104 29.4% 125 121 34.9%
Permanent Pacemaker Implant5
105 104 21.6% 127 123 26.2%
1 Valve-related death is any death caused by prosthetic valve dysfunction, valve thrombosis, embolism, bleeding event, or implanted valve endocarditis or related to reintervention on the operated valve. 2 MACCE includes all-cause death, myocardial infarction (MI), all stroke, and reintervention. 3 MAE includes all death, MI, all stroke, reintervention, cardiac perforation, cardiac tamponade, cardiogenic shock, valve embolism/device migration, prosthetic valve dysfunction, acute kidney injury, major vascular complication, life threatening or disabling bleed, major bleed, valve endocarditis VARC I Definitions. 4 Patients with pacemaker or ICD at baseline are not included. 5 Patients with pacemaker or ICD at baseline are included.
Table 22: Extreme Risk Cohort Adverse Event Summary – Non-Iliofemoral Attempted Implant
Non-Iliofemoral N=150
Event 0-30 Days 0-12 Months
# Events
# Patients
K-M
Rate
(%)
# Events
# Patients
K-M
Rate
(%)
All-Cause Mortality or Major Stroke
28
23
15.3%
67
59
39.4%
All-Cause Mortality
17 17 11.3% 54 54 36.0%
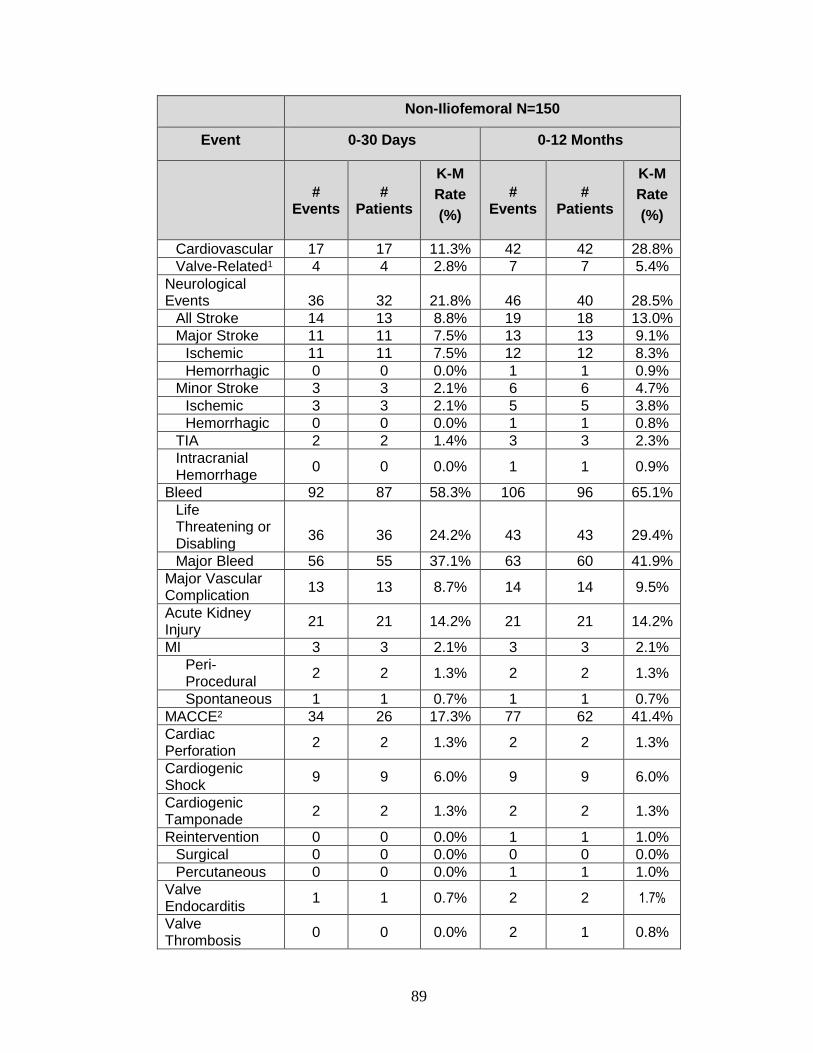
89
Non-Iliofemoral N=150
Event 0-30 Days 0-12 Months
# Events
# Patients
K-M
Rate
(%)
# Events
# Patients
K-M
Rate
(%)
Cardiovascular 17 17 11.3% 42 42 28.8%
Valve-Related1 4 4 2.8% 7 7 5.4%
Neurological Events
36
32
21.8%
46
40
28.5%
All Stroke 14 13 8.8% 19 18 13.0%
Major Stroke 11 11 7.5% 13 13 9.1%
Ischemic 11 11 7.5% 12 12 8.3%
Hemorrhagic 0 0 0.0% 1 1 0.9%
Minor Stroke 3 3 2.1% 6 6 4.7%
Ischemic 3 3 2.1% 5 5 3.8%
Hemorrhagic 0 0 0.0% 1 1 0.8%
TIA 2 2 1.4% 3 3 2.3%
Intracranial Hemorrhage
0 0 0.0% 1 1 0.9%
Bleed 92 87 58.3% 106 96 65.1%
Life Threatening or Disabling
36
36
24.2%
43
43
29.4%
Major Bleed 56 55 37.1% 63 60 41.9%
Major Vascular Complication
13 13 8.7% 14 14 9.5%
Acute Kidney Injury
21 21 14.2% 21 21 14.2%
MI 3 3 2.1% 3 3 2.1%
Peri-Procedural
2 2 1.3% 2 2 1.3%
Spontaneous 1 1 0.7% 1 1 0.7%
MACCE2 34 26 17.3% 77 62 41.4%
Cardiac Perforation
2 2 1.3% 2 2 1.3%
Cardiogenic Shock
9 9 6.0% 9 9 6.0%
Cardiogenic Tamponade
2 2 1.3% 2 2 1.3%
Reintervention 0 0 0.0% 1 1 1.0%
Surgical 0 0 0.0% 0 0 0.0%
Percutaneous 0 0 0.0% 1 1 1.0%
Valve Endocarditis
1 1 0.7% 2 2 1.7%
Valve Thrombosis
0 0 0.0% 2 1 0.8%
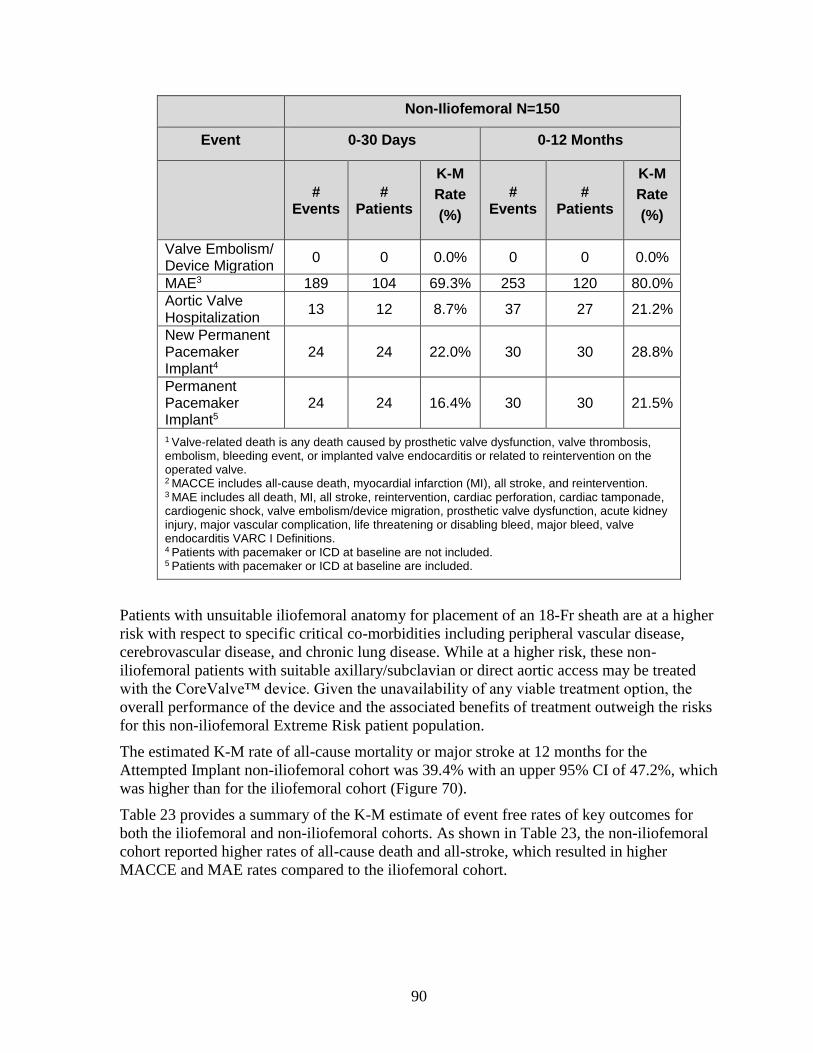
90
Non-Iliofemoral N=150
Event 0-30 Days 0-12 Months
# Events
# Patients
K-M
Rate
(%)
# Events
# Patients
K-M
Rate
(%)
Valve Embolism/ Device Migration
0 0 0.0% 0 0 0.0%
MAE3 189 104 69.3% 253 120 80.0%
Aortic Valve Hospitalization
13 12 8.7% 37 27 21.2%
New Permanent Pacemaker Implant4
24 24 22.0% 30 30 28.8%
Permanent Pacemaker Implant5
24 24 16.4% 30 30 21.5%
1 Valve-related death is any death caused by prosthetic valve dysfunction, valve thrombosis, embolism, bleeding event, or implanted valve endocarditis or related to reintervention on the operated valve. 2 MACCE includes all-cause death, myocardial infarction (MI), all stroke, and reintervention. 3 MAE includes all death, MI, all stroke, reintervention, cardiac perforation, cardiac tamponade, cardiogenic shock, valve embolism/device migration, prosthetic valve dysfunction, acute kidney injury, major vascular complication, life threatening or disabling bleed, major bleed, valve endocarditis VARC I Definitions. 4 Patients with pacemaker or ICD at baseline are not included. 5 Patients with pacemaker or ICD at baseline are included.
Patients with unsuitable iliofemoral anatomy for placement of an 18-Fr sheath are at a higher
risk with respect to specific critical co-morbidities including peripheral vascular disease,
cerebrovascular disease, and chronic lung disease. While at a higher risk, these non-
iliofemoral patients with suitable axillary/subclavian or direct aortic access may be treated
with the CoreValve™ device. Given the unavailability of any viable treatment option, the
overall performance of the device and the associated benefits of treatment outweigh the risks
for this non-iliofemoral Extreme Risk patient population.
The estimated K-M rate of all-cause mortality or major stroke at 12 months for the
Attempted Implant non-iliofemoral cohort was 39.4% with an upper 95% CI of 47.2%, which
was higher than for the iliofemoral cohort (Figure 70).
Table 23 provides a summary of the K-M estimate of event free rates of key outcomes for
both the iliofemoral and non-iliofemoral cohorts. As shown in Table 23, the non-iliofemoral
cohort reported higher rates of all-cause death and all-stroke, which resulted in higher
MACCE and MAE rates compared to the iliofemoral cohort.
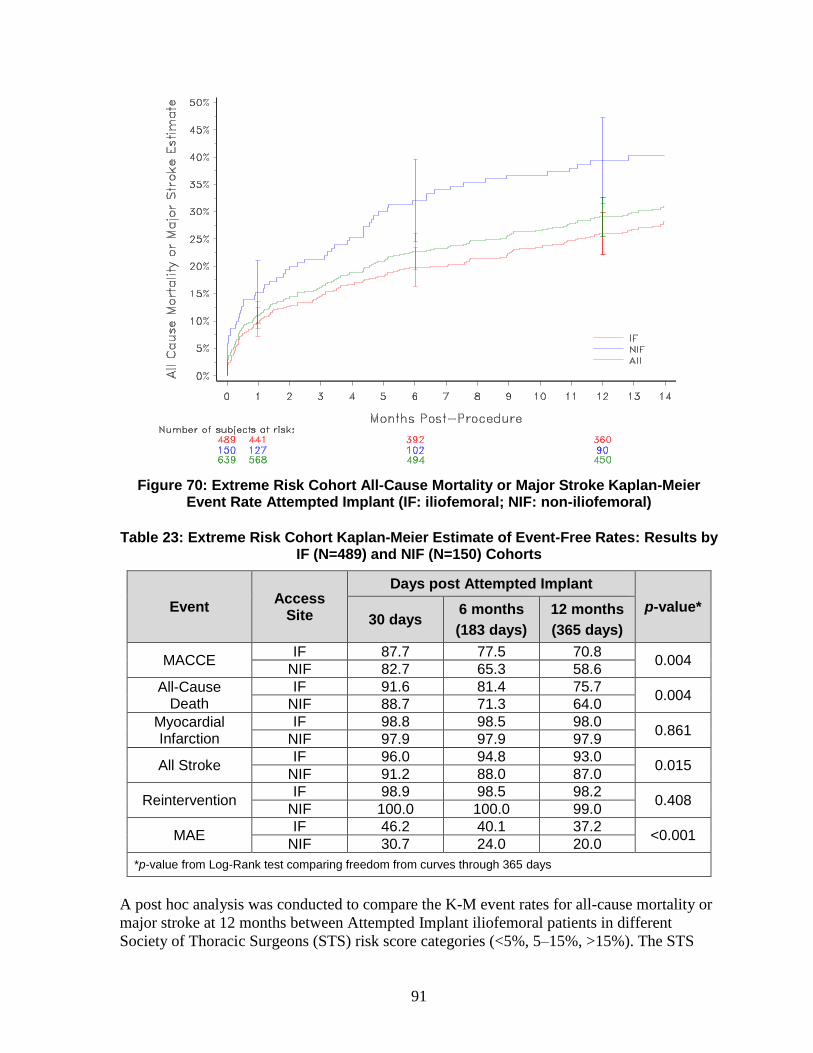
91
Figure 70: Extreme Risk Cohort All-Cause Mortality or Major Stroke Kaplan-Meier Event Rate Attempted Implant (IF: iliofemoral; NIF: non-iliofemoral)
Table 23: Extreme Risk Cohort Kaplan-Meier Estimate of Event-Free Rates: Results by IF (N=489) and NIF (N=150) Cohorts
Event Access
Site
Days post Attempted Implant
p-value* 30 days
6 months
(183 days)
12 months
(365 days)
MACCE IF 87.7 77.5 70.8
0.004 NIF 82.7 65.3 58.6
All-Cause Death
IF 91.6 81.4 75.7 0.004
NIF 88.7 71.3 64.0
Myocardial Infarction
IF 98.8 98.5 98.0 0.861
NIF 97.9 97.9 97.9
All Stroke IF 96.0 94.8 93.0
0.015 NIF 91.2 88.0 87.0
Reintervention IF 98.9 98.5 98.2
0.408 NIF 100.0 100.0 99.0
MAE IF 46.2 40.1 37.2
<0.001 NIF 30.7 24.0 20.0
*p-value from Log-Rank test comparing freedom from curves through 365 days
A post hoc analysis was conducted to compare the K-M event rates for all-cause mortality or
major stroke at 12 months between Attempted Implant iliofemoral patients in different
Society of Thoracic Surgeons (STS) risk score categories (<5%, 5–15%, >15%). The STS
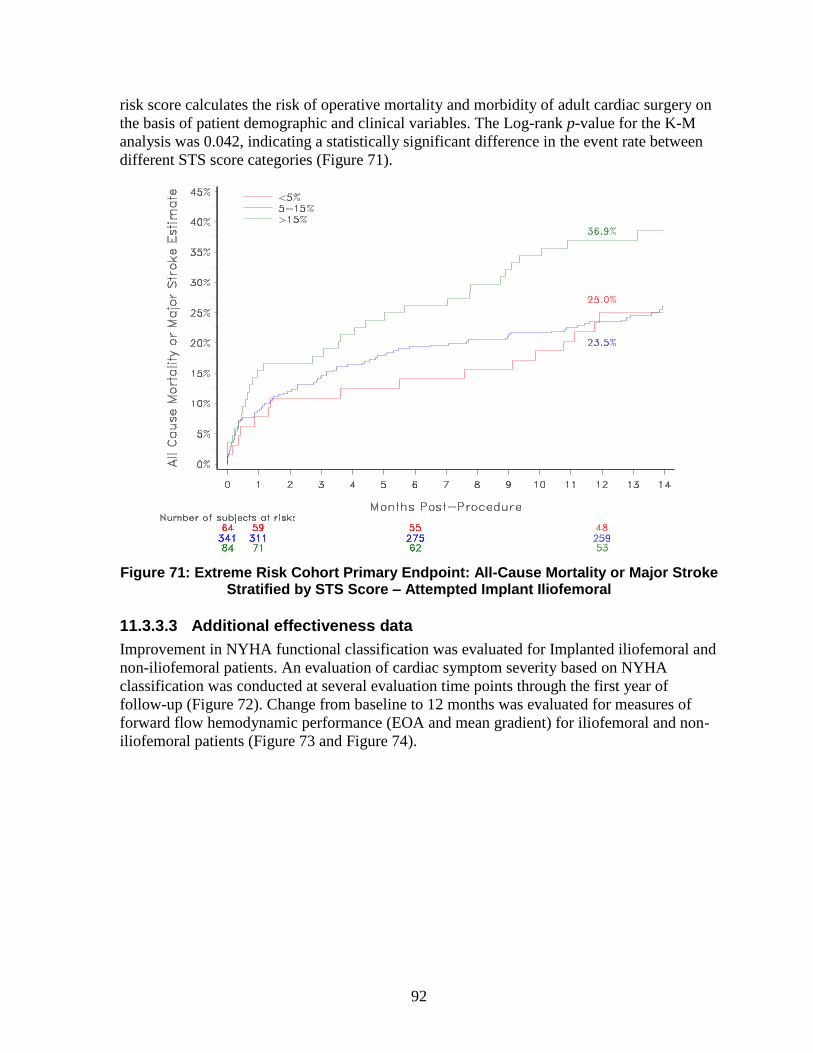
92
risk score calculates the risk of operative mortality and morbidity of adult cardiac surgery on
the basis of patient demographic and clinical variables. The Log-rank p-value for the K-M
analysis was 0.042, indicating a statistically significant difference in the event rate between
different STS score categories (Figure 71).
Figure 71: Extreme Risk Cohort Primary Endpoint: All-Cause Mortality or Major Stroke Stratified by STS Score – Attempted Implant Iliofemoral
11.3.3.3 Additional effectiveness data
Improvement in NYHA functional classification was evaluated for Implanted iliofemoral and
non-iliofemoral patients. An evaluation of cardiac symptom severity based on NYHA
classification was conducted at several evaluation time points through the first year of
follow-up (Figure 72). Change from baseline to 12 months was evaluated for measures of
forward flow hemodynamic performance (EOA and mean gradient) for iliofemoral and non-
iliofemoral patients (Figure 73 and Figure 74).
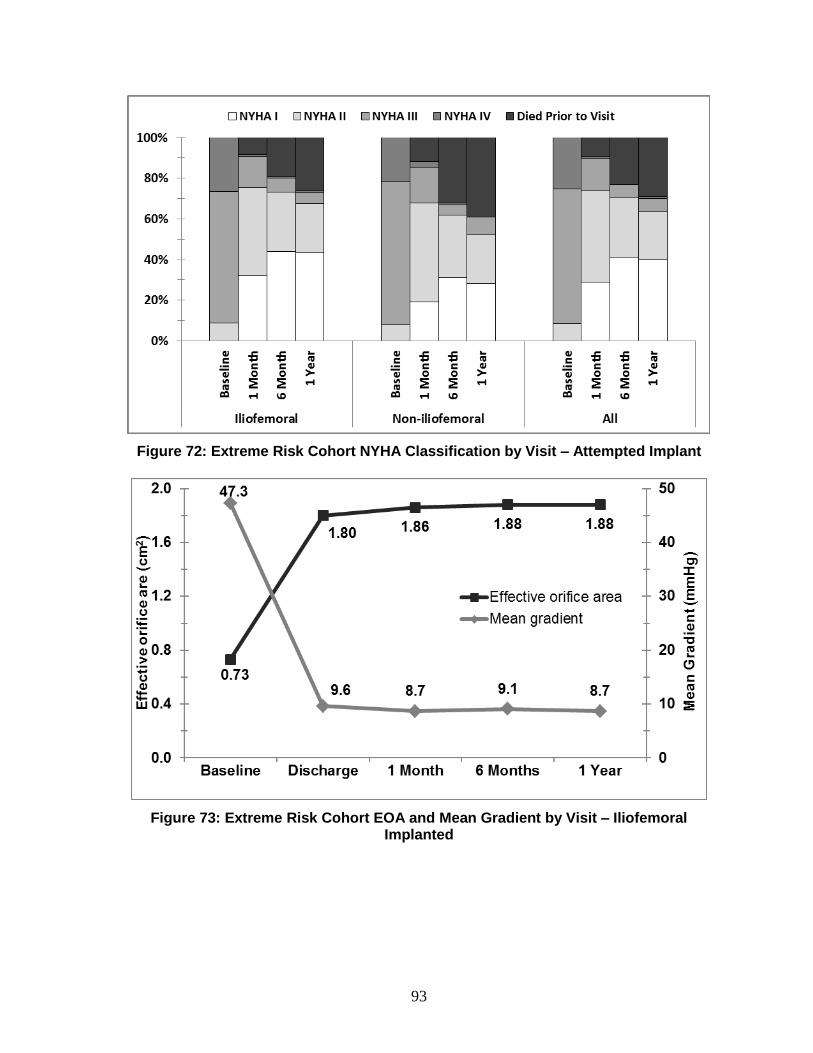
93
Figure 72: Extreme Risk Cohort NYHA Classification by Visit – Attempted Implant
Figure 73: Extreme Risk Cohort EOA and Mean Gradient by Visit – Iliofemoral Implanted
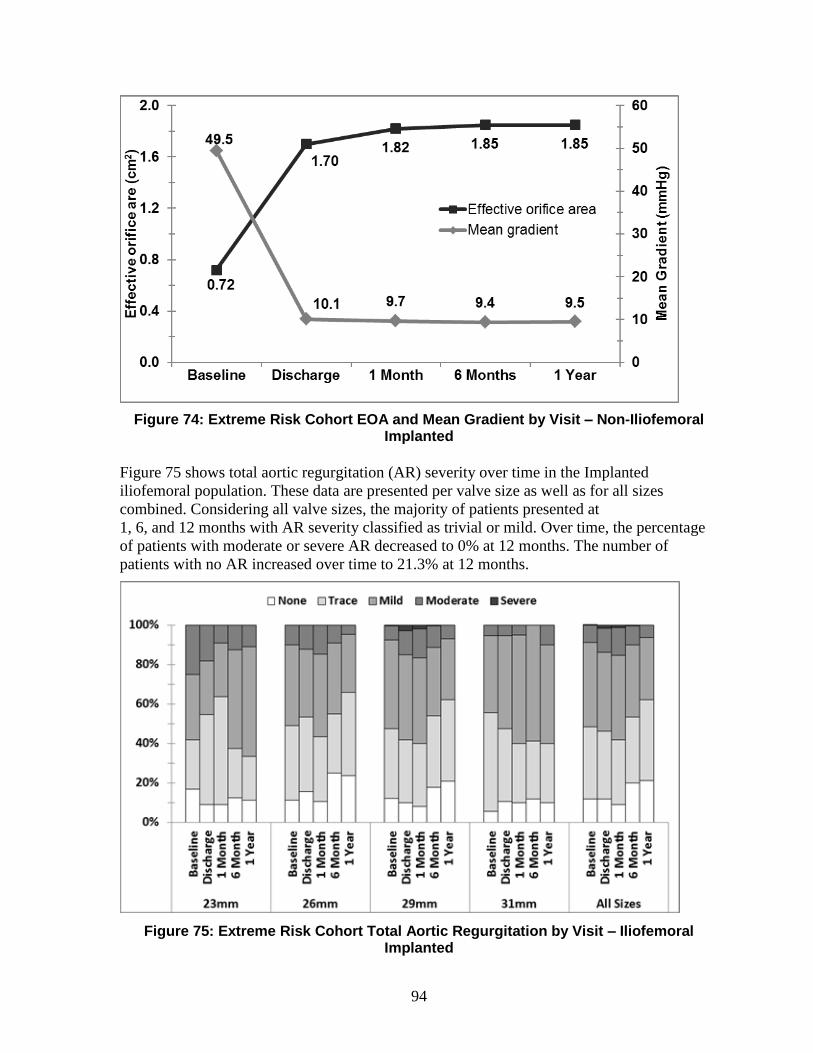
94
Figure 74: Extreme Risk Cohort EOA and Mean Gradient by Visit – Non-Iliofemoral Implanted
Figure 75 shows total aortic regurgitation (AR) severity over time in the Implanted
iliofemoral population. These data are presented per valve size as well as for all sizes
combined. Considering all valve sizes, the majority of patients presented at
1, 6, and 12 months with AR severity classified as trivial or mild. Over time, the percentage
of patients with moderate or severe AR decreased to 0% at 12 months. The number of
patients with no AR increased over time to 21.3% at 12 months.
Figure 75: Extreme Risk Cohort Total Aortic Regurgitation by Visit – Iliofemoral Implanted
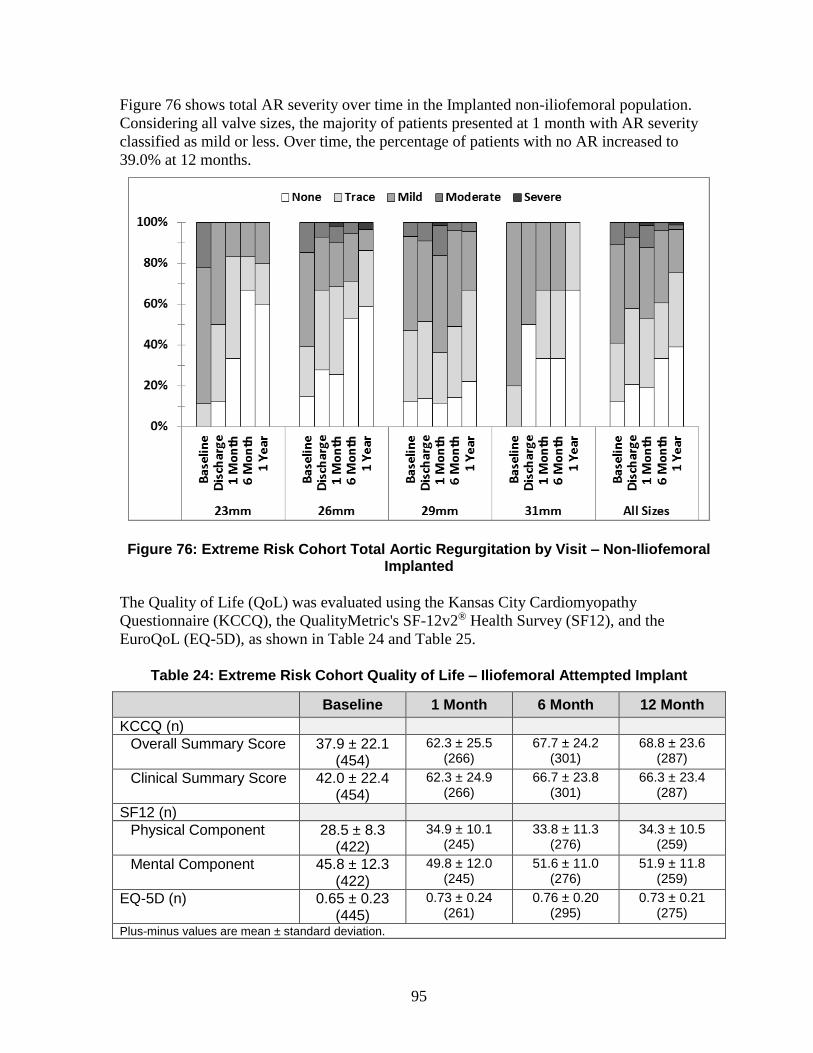
95
Figure 76 shows total AR severity over time in the Implanted non-iliofemoral population.
Considering all valve sizes, the majority of patients presented at 1 month with AR severity
classified as mild or less. Over time, the percentage of patients with no AR increased to
39.0% at 12 months.
Figure 76: Extreme Risk Cohort Total Aortic Regurgitation by Visit – Non-Iliofemoral Implanted
The Quality of Life (QoL) was evaluated using the Kansas City Cardiomyopathy
Questionnaire (KCCQ), the QualityMetric's SF-12v2® Health Survey (SF12), and the
EuroQoL (EQ-5D), as shown in Table 24 and Table 25.
Table 24: Extreme Risk Cohort Quality of Life – Iliofemoral Attempted Implant
Baseline 1 Month 6 Month 12 Month
KCCQ (n)
Overall Summary Score 37.9 ± 22.1 (454)
62.3 ± 25.5 (266)
67.7 ± 24.2 (301)
68.8 ± 23.6 (287)
Clinical Summary Score 42.0 ± 22.4 (454)
62.3 ± 24.9 (266)
66.7 ± 23.8 (301)
66.3 ± 23.4 (287)
SF12 (n)
Physical Component 28.5 ± 8.3 (422)
34.9 ± 10.1 (245)
33.8 ± 11.3 (276)
34.3 ± 10.5 (259)
Mental Component 45.8 ± 12.3 (422)
49.8 ± 12.0 (245)
51.6 ± 11.0 (276)
51.9 ± 11.8 (259)
EQ-5D (n) 0.65 ± 0.23 (445)
0.73 ± 0.24 (261)
0.76 ± 0.20 (295)
0.73 ± 0.21 (275)
Plus-minus values are mean ± standard deviation.
96
Table 25: Extreme Risk Cohort Quality of Life – Non-Iliofemoral Attempted Implant
Baseline 1 Month 6 Month 12 Month
KCCQ (n)
Overall Summary Score 42.5 ± 22.3 (141)
51.0 ± 25.5 (74)
65.7 ± 23.8 (77)
65.1 ± 22.4 (81)
Clinical Summary Score 46.7 ± 23.0 (141)
53.7 ± 24.6 (74)
64.2 ± 23.2 (77)
65.2 ± 21.3 (81)
SF12 (n)
Physical Component 27.9 ± 8.0 (130)
32.0 ± 9.2 (66)
32.5 ± 10.7 (74)
34.0 ± 9.4 (80)
Mental Component 47.6 ± 12.0 (130)
45.1 ± 14.7 (66)
51.3 ± 11.2 (74)
49.0 ± 13.3 (80)
EQ-5D (n) 0.67 ± 0.23 (138)
0.66 ± 0.25 (72)
0.74 ± 0.19 (75)
0.73 ± 0.20 (80)
Plus-minus values are mean ± standard deviation.
11.4 Expanded Use cohorts
The CoreValve US Expanded Use Study is a prospective, non-randomized, multi-center
investigational study designed to evaluate the safety and efficacy of the Medtronic
CoreValve™ system for the treatment of severe native calcific aortic stenosis or failure
(stenosed, insufficient, or combined) of a surgical bioprosthetic aortic valve in subjects with
significant co-morbidities in whom the risk of surgical aortic valve replacement has a
predicted operative mortality or serious, irreversible morbidity risk of ≥50% at 30 days. The
study consisted of the following six cohorts: (1) end stage renal disease (ESRD), (2) low-
flow/low-gradient (LFLG), (3) severe mitral regurgitation, (4) severe tricuspid regurgitation,
(5) failed bioprosthetic surgical valve (TAV in SAV), and (6) 2 or more above conditions.
Patients received the CoreValve™ bioprosthesis either through the iliofemoral access route
or through the non-illiofemoral (subclavian and direct aortic) access routes.
The following data summarize the results from the Expanded Use end stage renal disease
(ESRD), low-flow/low-gradient (LFLG), and failed bioprosthetic surgical valve
(TAV in SAV) cohorts.
11.4.1 End stage renal disease (ESRD)
11.4.1.1 Patient population
Eligible subjects presented with ESRD requiring renal replacement therapy or creatinine
clearance of <20 cc/min but not requiring renal replacement therapy, and a mean gradient of
>40 mmHg or a jet velocity >4.0 m/sec by either resting or on dobutamine stress echo if the
LVEF <50% or simultaneous pressure recordings at cardiac catheterization by either resting
or with dobutamine stress echo. The initial aortic valve area was ≤0.8 cm² or an aortic valve
index of ≤0.5 cm²/m² on resting echocardiogram or cardiac catheterization.
A total of 105 ESRD subjects were enrolled in the Expanded Use study at 35 of the
43 activated centers in the United States. Of the 105 enrolled ESRD subjects, a total of
97
104 subjects received an attempted implant and comprise the attempted implant ESRD
cohort.
The patient characteristics analyzed include demographics, clinical characteristics, medical
history, and potentially prohibitive anatomic factors for surgical aortic valve replacement
(SAVR) and assessments for co-morbidity, frailty, and disability (Table 26). The ability of a
patient to obtain a functional recovery after SAVR is largely based on the presence of
significant co-morbidities, frailties, and disabilities, with the combination of the factors
having higher weight than the individual factors alone. As detailed in Table 26, a high
proportion of patients had significant co-morbidities, frailties, or disabilities, which
established the study population as “Extreme Risk.” The mean age for patients participating
in the trial was approximately 76 years old, and 66% of patients were male. The mean
Society of Thoracic Surgeons (STS) score was approximately 16. Greater than 90% of all
patients were in NYHA classes III or IV.
Additionally, coronary artery disease was present in approximately 80% of patients, and
greater than 50% of patients had peripheral vascular disease.
Table 26: ESRD Cohort Subject Demographics and Clinical Characteristics – Attempted Implant
Demographic ESRD
N=104
Age (years) 75.9 ± 8.8
Gender (Male) 66.3% (69/104)
NYHA Classification
I 0.0% (0/104)
II 6.7% (7/104)
III 73.1% (76/104)
IV 20.2% (21/104)
STS Score (Risk of Mortality, %) 15.9 ± 7.8
Coronary Artery Disease 78.8% (82/104)
Previous MI 34.6% (36/104)
Previous Interventions
Coronary Artery Bypass Surgery 34.6% (36/104)
Percutaneous Coronary Intervention 44.2% (46/104)
Balloon Valvuloplasty 14.4% (15/104)
Cerebral Vascular Disease 17.5% (18/103)
Prior Stroke 14.4% (15/104)
Peripheral Vascular Disease 54.8% (57/104)
Chronic Lung Disease/COPD 70.2% (73/104)
Home Oxygen 23.1% (24/104)
Creatinine Level >2 mg/dl 99.0% (103/104)
Chronic Kidney Disease (Stage 4/5) 97.1% (101/104)
Chronic Renal Replacement Therapy 99.0% (103/104)
Atrial Fibrillation/Atrial Flutter 41.2% (42/102)
Preexisting Permanent Pacemaker Placement/ICD
11.5% (12/104)
Aorta Calcification1: Severe/Porcelain
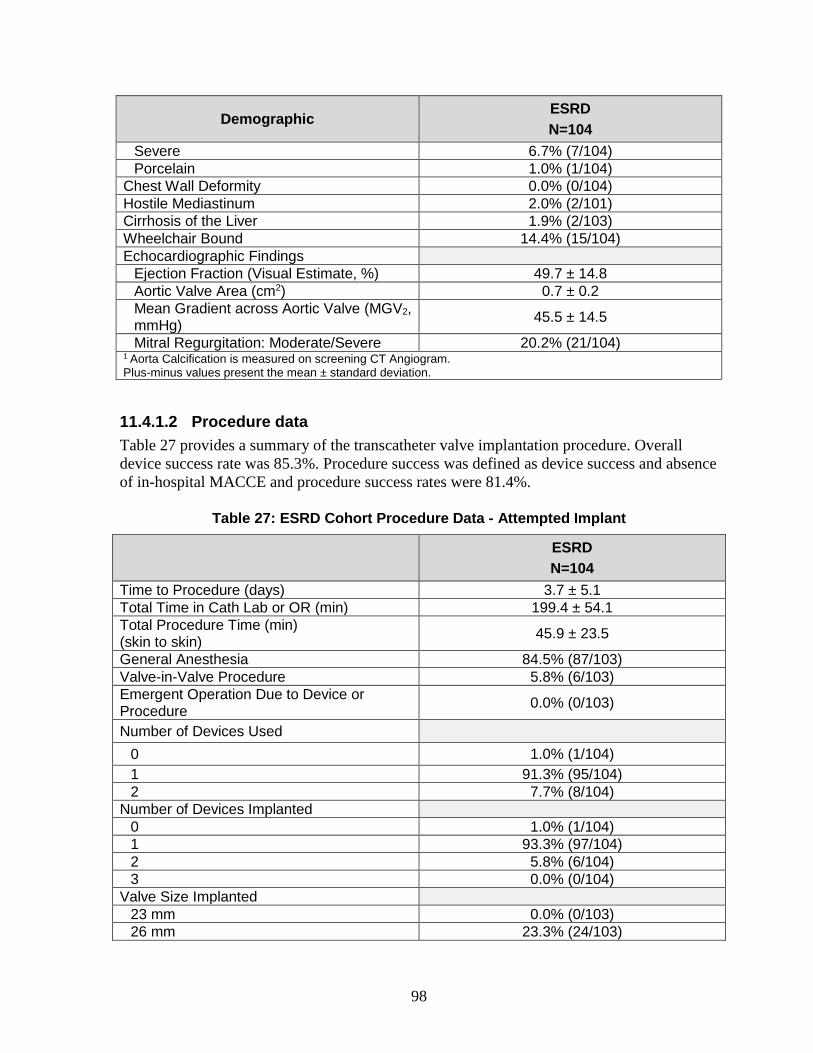
98
Demographic ESRD
N=104
Severe 6.7% (7/104)
Porcelain 1.0% (1/104)
Chest Wall Deformity 0.0% (0/104)
Hostile Mediastinum 2.0% (2/101)
Cirrhosis of the Liver 1.9% (2/103)
Wheelchair Bound 14.4% (15/104)
Echocardiographic Findings
Ejection Fraction (Visual Estimate, %) 49.7 ± 14.8
Aortic Valve Area (cm2) 0.7 ± 0.2
Mean Gradient across Aortic Valve (MGV2, mmHg)
45.5 ± 14.5
Mitral Regurgitation: Moderate/Severe 20.2% (21/104) 1 Aorta Calcification is measured on screening CT Angiogram. Plus-minus values present the mean ± standard deviation.
11.4.1.2 Procedure data
Table 27 provides a summary of the transcatheter valve implantation procedure. Overall
device success rate was 85.3%. Procedure success was defined as device success and absence
of in-hospital MACCE and procedure success rates were 81.4%.
Table 27: ESRD Cohort Procedure Data - Attempted Implant
ESRD
N=104
Time to Procedure (days) 3.7 ± 5.1
Total Time in Cath Lab or OR (min) 199.4 ± 54.1
Total Procedure Time (min) (skin to skin)
45.9 ± 23.5
General Anesthesia 84.5% (87/103)
Valve-in-Valve Procedure 5.8% (6/103)
Emergent Operation Due to Device or Procedure
0.0% (0/103)
Number of Devices Used
0 1.0% (1/104)
1 91.3% (95/104)
2 7.7% (8/104)
Number of Devices Implanted
0 1.0% (1/104)
1 93.3% (97/104)
2 5.8% (6/104)
3 0.0% (0/104)
Valve Size Implanted
23 mm 0.0% (0/103)
26 mm 23.3% (24/103)
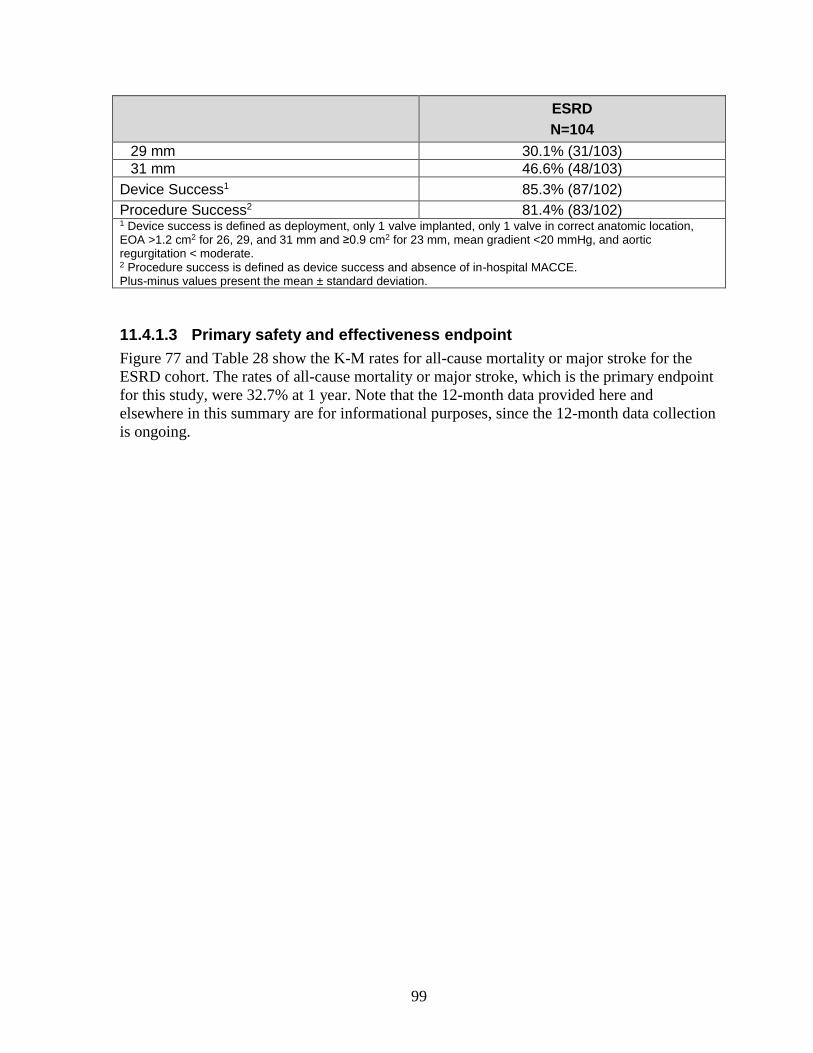
99
ESRD
N=104
29 mm 30.1% (31/103)
31 mm 46.6% (48/103)
Device Success1 85.3% (87/102)
Procedure Success2 81.4% (83/102) 1 Device success is defined as deployment, only 1 valve implanted, only 1 valve in correct anatomic location, EOA >1.2 cm2 for 26, 29, and 31 mm and ≥0.9 cm2 for 23 mm, mean gradient <20 mmHg, and aortic regurgitation < moderate. 2 Procedure success is defined as device success and absence of in-hospital MACCE. Plus-minus values present the mean ± standard deviation.
11.4.1.3 Primary safety and effectiveness endpoint
Figure 77 and Table 28 show the K-M rates for all-cause mortality or major stroke for the
ESRD cohort. The rates of all-cause mortality or major stroke, which is the primary endpoint
for this study, were 32.7% at 1 year. Note that the 12-month data provided here and
elsewhere in this summary are for informational purposes, since the 12-month data collection
is ongoing.
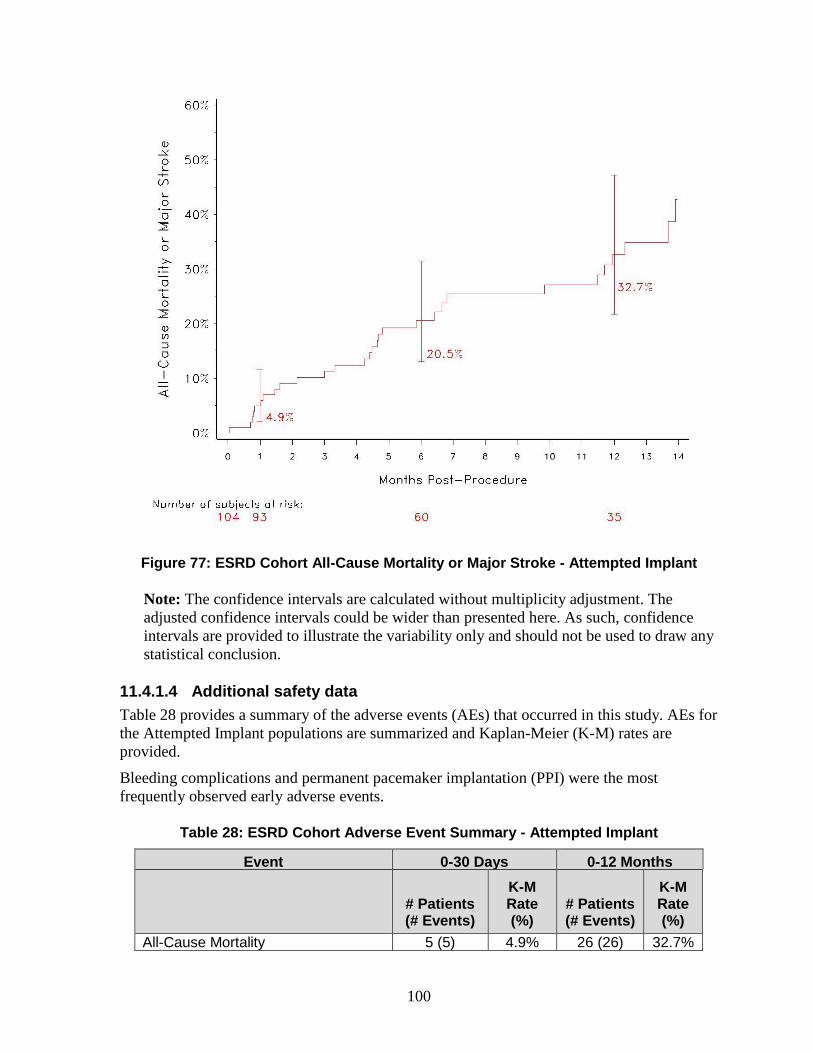
100
Figure 77: ESRD Cohort All-Cause Mortality or Major Stroke - Attempted Implant
Note: The confidence intervals are calculated without multiplicity adjustment. The
adjusted confidence intervals could be wider than presented here. As such, confidence
intervals are provided to illustrate the variability only and should not be used to draw any
statistical conclusion.
11.4.1.4 Additional safety data
Table 28 provides a summary of the adverse events (AEs) that occurred in this study. AEs for
the Attempted Implant populations are summarized and Kaplan-Meier (K-M) rates are
provided.
Bleeding complications and permanent pacemaker implantation (PPI) were the most
frequently observed early adverse events.
Table 28: ESRD Cohort Adverse Event Summary - Attempted Implant
Event 0-30 Days 0-12 Months
# Patients (# Events)
K-M Rate (%)
# Patients (# Events)
K-M Rate (%)
All-Cause Mortality 5 (5) 4.9% 26 (26) 32.7%
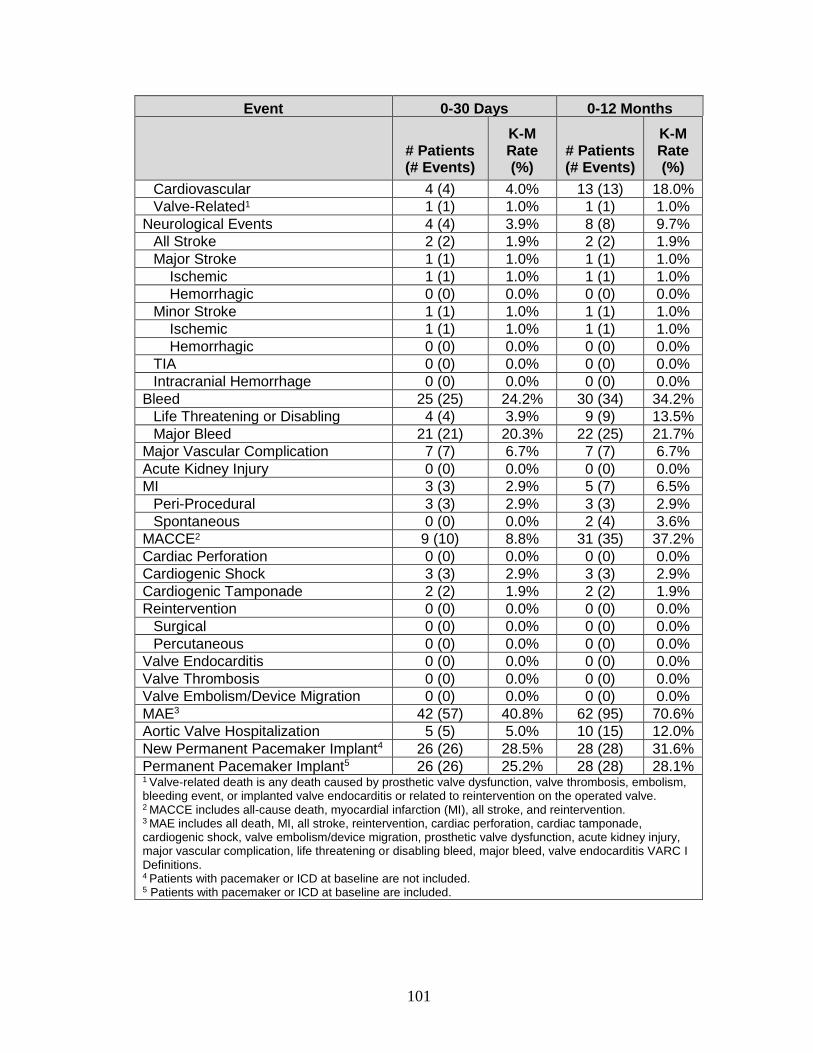
101
Event 0-30 Days 0-12 Months
# Patients (# Events)
K-M Rate (%)
# Patients (# Events)
K-M Rate (%)
Cardiovascular 4 (4) 4.0% 13 (13) 18.0%
Valve-Related1 1 (1) 1.0% 1 (1) 1.0%
Neurological Events 4 (4) 3.9% 8 (8) 9.7%
All Stroke 2 (2) 1.9% 2 (2) 1.9%
Major Stroke 1 (1) 1.0% 1 (1) 1.0%
Ischemic 1 (1) 1.0% 1 (1) 1.0%
Hemorrhagic 0 (0) 0.0% 0 (0) 0.0%
Minor Stroke 1 (1) 1.0% 1 (1) 1.0%
Ischemic 1 (1) 1.0% 1 (1) 1.0%
Hemorrhagic 0 (0) 0.0% 0 (0) 0.0%
TIA 0 (0) 0.0% 0 (0) 0.0%
Intracranial Hemorrhage 0 (0) 0.0% 0 (0) 0.0%
Bleed 25 (25) 24.2% 30 (34) 34.2%
Life Threatening or Disabling 4 (4) 3.9% 9 (9) 13.5%
Major Bleed 21 (21) 20.3% 22 (25) 21.7%
Major Vascular Complication 7 (7) 6.7% 7 (7) 6.7%
Acute Kidney Injury 0 (0) 0.0% 0 (0) 0.0%
MI 3 (3) 2.9% 5 (7) 6.5%
Peri-Procedural 3 (3) 2.9% 3 (3) 2.9%
Spontaneous 0 (0) 0.0% 2 (4) 3.6%
MACCE2 9 (10) 8.8% 31 (35) 37.2%
Cardiac Perforation 0 (0) 0.0% 0 (0) 0.0%
Cardiogenic Shock 3 (3) 2.9% 3 (3) 2.9%
Cardiogenic Tamponade 2 (2) 1.9% 2 (2) 1.9%
Reintervention 0 (0) 0.0% 0 (0) 0.0%
Surgical 0 (0) 0.0% 0 (0) 0.0%
Percutaneous 0 (0) 0.0% 0 (0) 0.0%
Valve Endocarditis 0 (0) 0.0% 0 (0) 0.0%
Valve Thrombosis 0 (0) 0.0% 0 (0) 0.0%
Valve Embolism/Device Migration 0 (0) 0.0% 0 (0) 0.0%
MAE3 42 (57) 40.8% 62 (95) 70.6%
Aortic Valve Hospitalization 5 (5) 5.0% 10 (15) 12.0%
New Permanent Pacemaker Implant4 26 (26) 28.5% 28 (28) 31.6%
Permanent Pacemaker Implant5 26 (26) 25.2% 28 (28) 28.1% 1 Valve-related death is any death caused by prosthetic valve dysfunction, valve thrombosis, embolism, bleeding event, or implanted valve endocarditis or related to reintervention on the operated valve. 2 MACCE includes all-cause death, myocardial infarction (MI), all stroke, and reintervention. 3 MAE includes all death, MI, all stroke, reintervention, cardiac perforation, cardiac tamponade, cardiogenic shock, valve embolism/device migration, prosthetic valve dysfunction, acute kidney injury, major vascular complication, life threatening or disabling bleed, major bleed, valve endocarditis VARC I Definitions. 4 Patients with pacemaker or ICD at baseline are not included. 5 Patients with pacemaker or ICD at baseline are included.
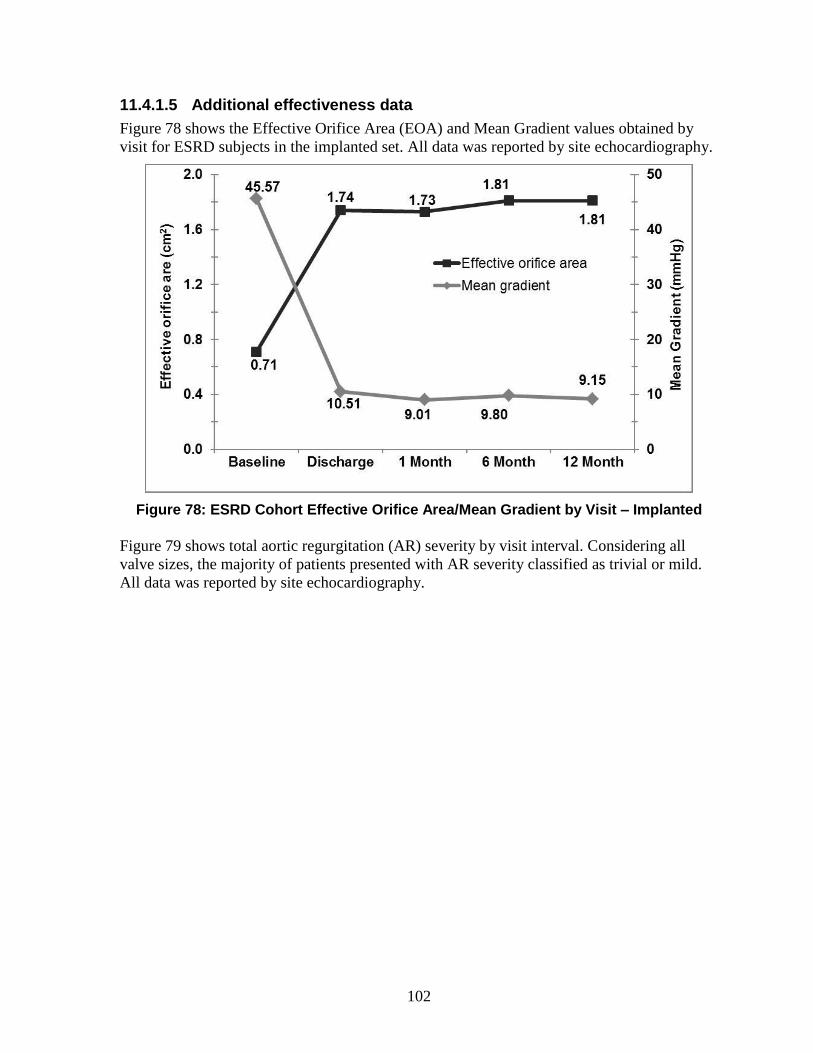
102
11.4.1.5 Additional effectiveness data
Figure 78 shows the Effective Orifice Area (EOA) and Mean Gradient values obtained by
visit for ESRD subjects in the implanted set. All data was reported by site echocardiography.
Figure 78: ESRD Cohort Effective Orifice Area/Mean Gradient by Visit – Implanted
Figure 79 shows total aortic regurgitation (AR) severity by visit interval. Considering all
valve sizes, the majority of patients presented with AR severity classified as trivial or mild.
All data was reported by site echocardiography.
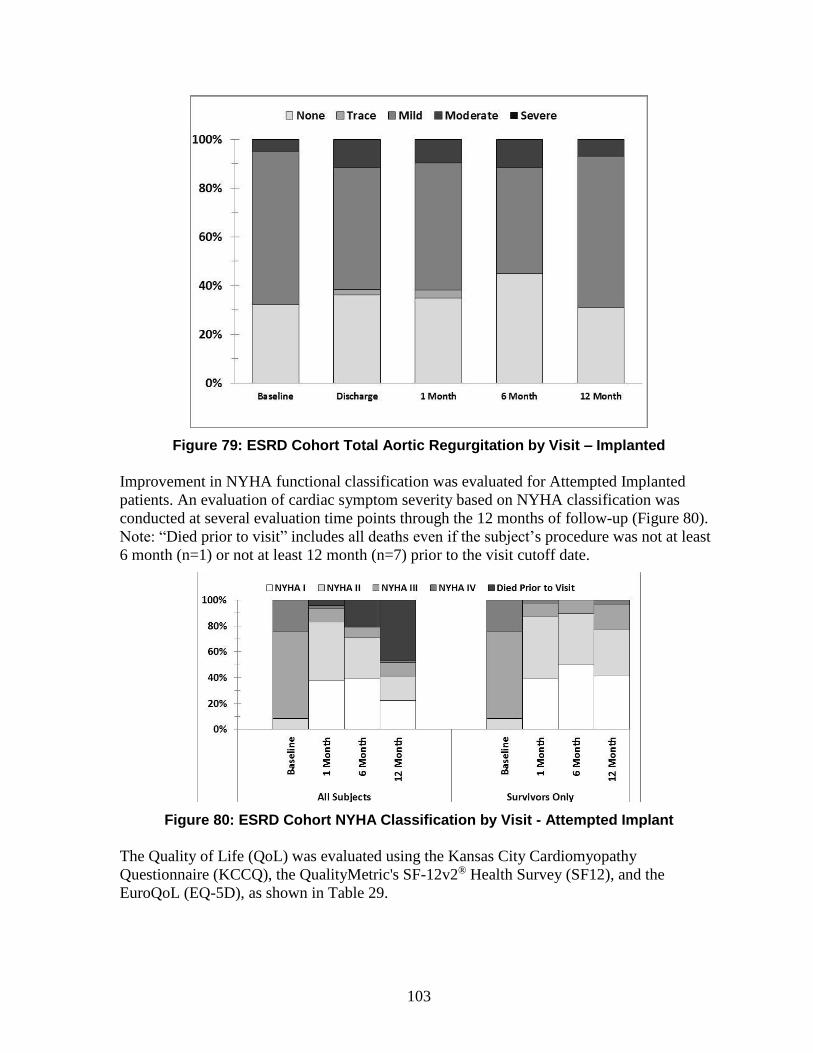
103
Figure 79: ESRD Cohort Total Aortic Regurgitation by Visit – Implanted
Improvement in NYHA functional classification was evaluated for Attempted Implanted
patients. An evaluation of cardiac symptom severity based on NYHA classification was
conducted at several evaluation time points through the 12 months of follow-up (Figure 80).
Note: “Died prior to visit” includes all deaths even if the subject’s procedure was not at least
6 month (n=1) or not at least 12 month (n=7) prior to the visit cutoff date.
Figure 80: ESRD Cohort NYHA Classification by Visit - Attempted Implant
The Quality of Life (QoL) was evaluated using the Kansas City Cardiomyopathy
Questionnaire (KCCQ), the QualityMetric's SF-12v2® Health Survey (SF12), and the
EuroQoL (EQ-5D), as shown in Table 29.
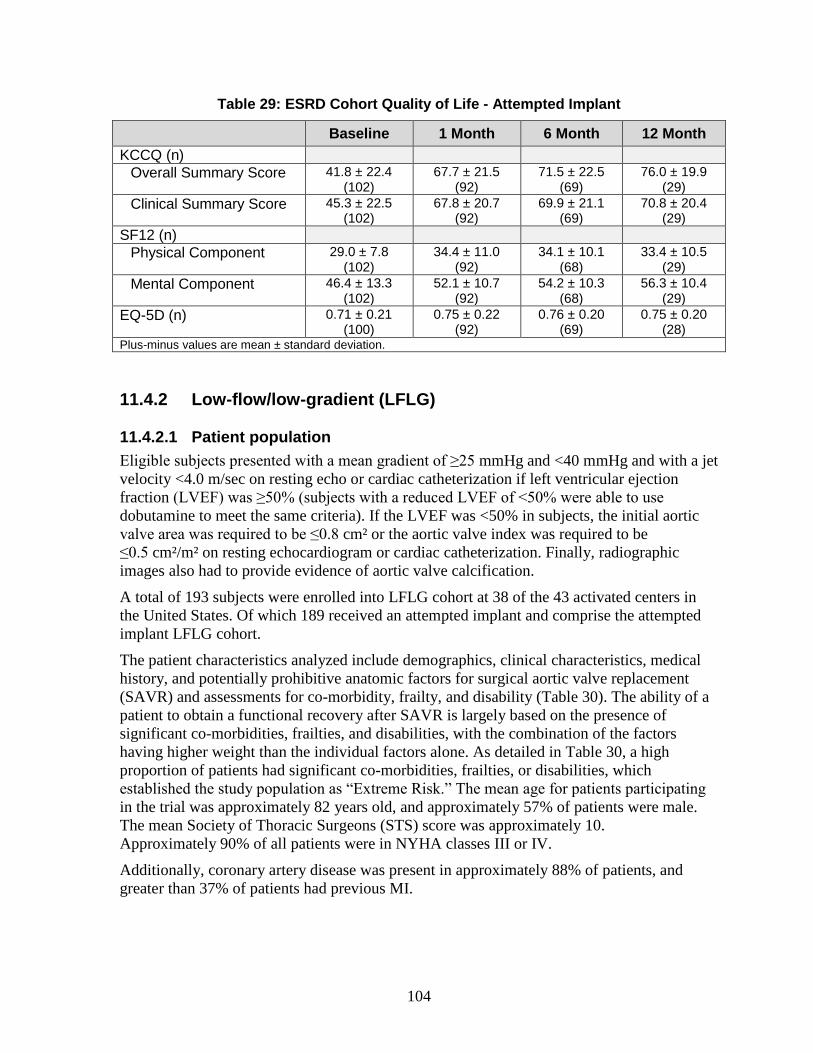
104
Table 29: ESRD Cohort Quality of Life - Attempted Implant
Baseline 1 Month 6 Month 12 Month
KCCQ (n)
Overall Summary Score 41.8 ± 22.4 (102)
67.7 ± 21.5 (92)
71.5 ± 22.5 (69)
76.0 ± 19.9 (29)
Clinical Summary Score 45.3 ± 22.5 (102)
67.8 ± 20.7 (92)
69.9 ± 21.1 (69)
70.8 ± 20.4 (29)
SF12 (n)
Physical Component 29.0 ± 7.8 (102)
34.4 ± 11.0 (92)
34.1 ± 10.1 (68)
33.4 ± 10.5 (29)
Mental Component 46.4 ± 13.3 (102)
52.1 ± 10.7 (92)
54.2 ± 10.3 (68)
56.3 ± 10.4 (29)
EQ-5D (n) 0.71 ± 0.21 (100)
0.75 ± 0.22 (92)
0.76 ± 0.20 (69)
0.75 ± 0.20 (28)
Plus-minus values are mean ± standard deviation.
11.4.2 Low-flow/low-gradient (LFLG)
11.4.2.1 Patient population
Eligible subjects presented with a mean gradient of ≥25 mmHg and <40 mmHg and with a jet
velocity <4.0 m/sec on resting echo or cardiac catheterization if left ventricular ejection
fraction (LVEF) was ≥50% (subjects with a reduced LVEF of <50% were able to use
dobutamine to meet the same criteria). If the LVEF was <50% in subjects, the initial aortic
valve area was required to be ≤0.8 cm² or the aortic valve index was required to be
≤0.5 cm²/m² on resting echocardiogram or cardiac catheterization. Finally, radiographic
images also had to provide evidence of aortic valve calcification.
A total of 193 subjects were enrolled into LFLG cohort at 38 of the 43 activated centers in
the United States. Of which 189 received an attempted implant and comprise the attempted
implant LFLG cohort.
The patient characteristics analyzed include demographics, clinical characteristics, medical
history, and potentially prohibitive anatomic factors for surgical aortic valve replacement
(SAVR) and assessments for co-morbidity, frailty, and disability (Table 30). The ability of a
patient to obtain a functional recovery after SAVR is largely based on the presence of
significant co-morbidities, frailties, and disabilities, with the combination of the factors
having higher weight than the individual factors alone. As detailed in Table 30, a high
proportion of patients had significant co-morbidities, frailties, or disabilities, which
established the study population as “Extreme Risk.” The mean age for patients participating
in the trial was approximately 82 years old, and approximately 57% of patients were male.
The mean Society of Thoracic Surgeons (STS) score was approximately 10.
Approximately 90% of all patients were in NYHA classes III or IV.
Additionally, coronary artery disease was present in approximately 88% of patients, and
greater than 37% of patients had previous MI.
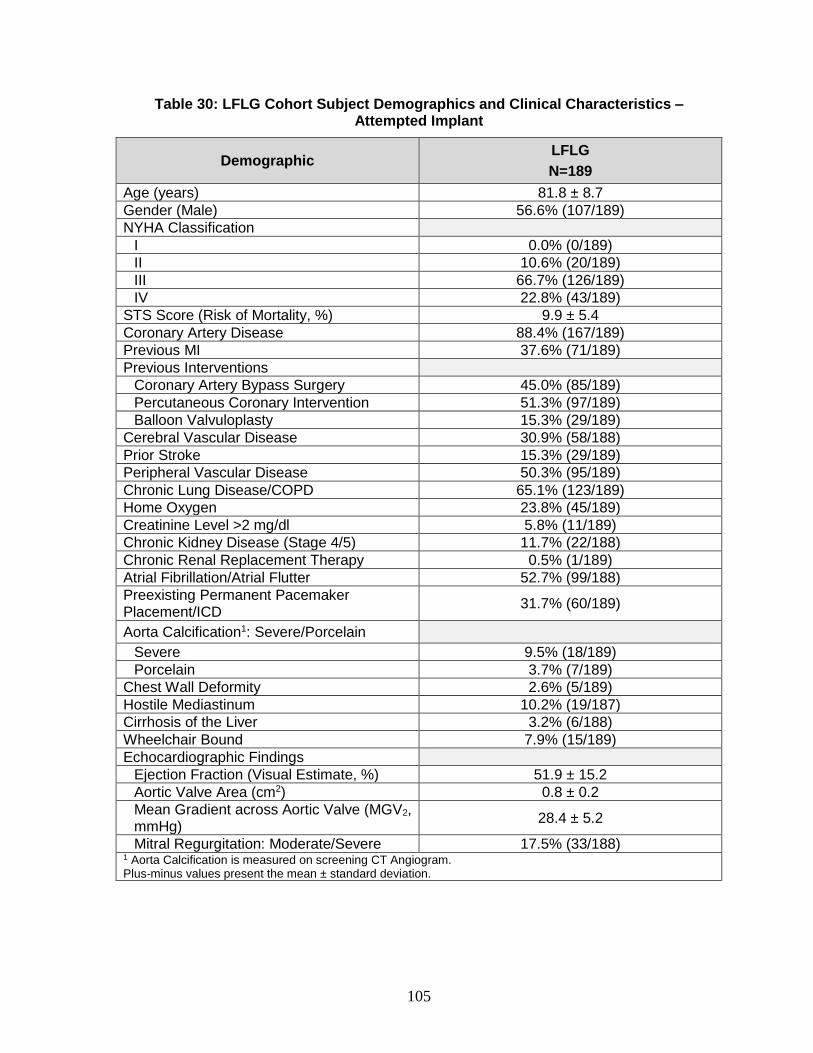
105
Table 30: LFLG Cohort Subject Demographics and Clinical Characteristics – Attempted Implant
Demographic LFLG
N=189
Age (years) 81.8 ± 8.7
Gender (Male) 56.6% (107/189)
NYHA Classification
I 0.0% (0/189)
II 10.6% (20/189)
III 66.7% (126/189)
IV 22.8% (43/189)
STS Score (Risk of Mortality, %) 9.9 ± 5.4
Coronary Artery Disease 88.4% (167/189)
Previous MI 37.6% (71/189)
Previous Interventions
Coronary Artery Bypass Surgery 45.0% (85/189)
Percutaneous Coronary Intervention 51.3% (97/189)
Balloon Valvuloplasty 15.3% (29/189)
Cerebral Vascular Disease 30.9% (58/188)
Prior Stroke 15.3% (29/189)
Peripheral Vascular Disease 50.3% (95/189)
Chronic Lung Disease/COPD 65.1% (123/189)
Home Oxygen 23.8% (45/189)
Creatinine Level >2 mg/dl 5.8% (11/189)
Chronic Kidney Disease (Stage 4/5) 11.7% (22/188)
Chronic Renal Replacement Therapy 0.5% (1/189)
Atrial Fibrillation/Atrial Flutter 52.7% (99/188)
Preexisting Permanent Pacemaker Placement/ICD
31.7% (60/189)
Aorta Calcification1: Severe/Porcelain
Severe 9.5% (18/189)
Porcelain 3.7% (7/189)
Chest Wall Deformity 2.6% (5/189)
Hostile Mediastinum 10.2% (19/187)
Cirrhosis of the Liver 3.2% (6/188)
Wheelchair Bound 7.9% (15/189)
Echocardiographic Findings
Ejection Fraction (Visual Estimate, %) 51.9 ± 15.2
Aortic Valve Area (cm2) 0.8 ± 0.2
Mean Gradient across Aortic Valve (MGV2, mmHg)
28.4 ± 5.2
Mitral Regurgitation: Moderate/Severe 17.5% (33/188) 1 Aorta Calcification is measured on screening CT Angiogram. Plus-minus values present the mean ± standard deviation.
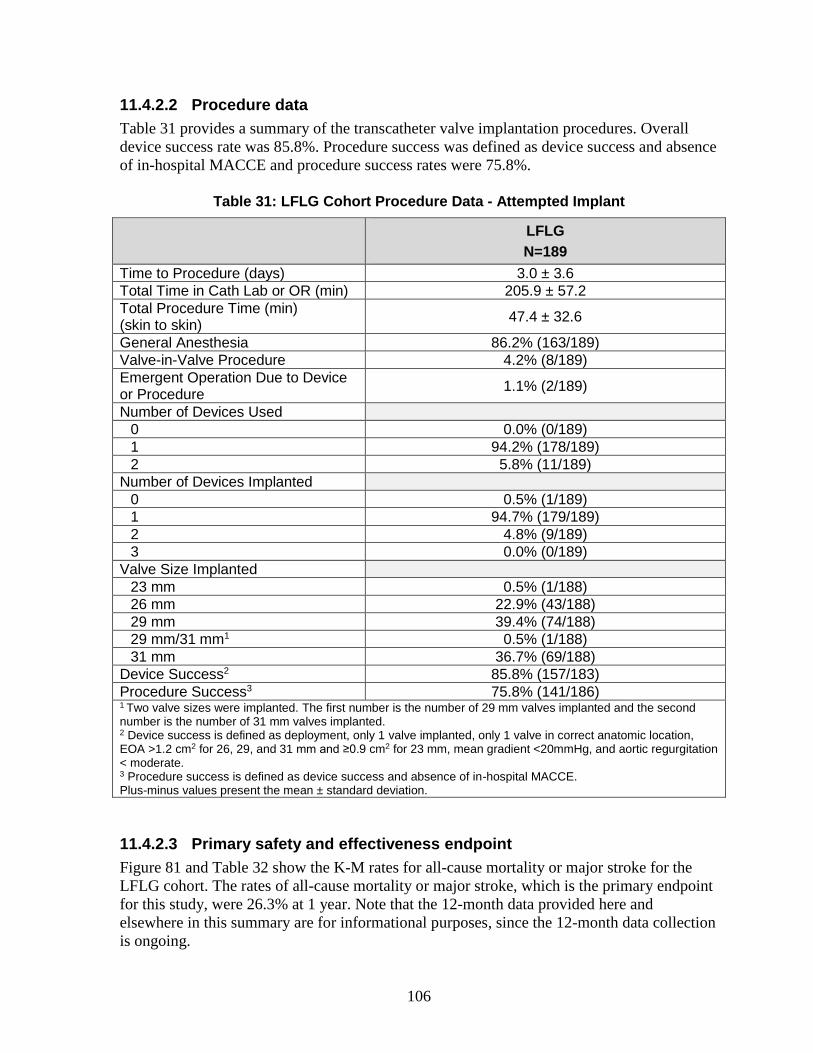
106
11.4.2.2 Procedure data
Table 31 provides a summary of the transcatheter valve implantation procedures. Overall
device success rate was 85.8%. Procedure success was defined as device success and absence
of in-hospital MACCE and procedure success rates were 75.8%.
Table 31: LFLG Cohort Procedure Data - Attempted Implant
LFLG
N=189
Time to Procedure (days) 3.0 ± 3.6
Total Time in Cath Lab or OR (min) 205.9 ± 57.2
Total Procedure Time (min) (skin to skin)
47.4 ± 32.6
General Anesthesia 86.2% (163/189)
Valve-in-Valve Procedure 4.2% (8/189)
Emergent Operation Due to Device or Procedure
1.1% (2/189)
Number of Devices Used
0 0.0% (0/189)
1 94.2% (178/189)
2 5.8% (11/189)
Number of Devices Implanted
0 0.5% (1/189)
1 94.7% (179/189)
2 4.8% (9/189)
3 0.0% (0/189)
Valve Size Implanted
23 mm 0.5% (1/188)
26 mm 22.9% (43/188)
29 mm 39.4% (74/188)
29 mm/31 mm1 0.5% (1/188)
31 mm 36.7% (69/188)
Device Success2 85.8% (157/183)
Procedure Success3 75.8% (141/186) 1 Two valve sizes were implanted. The first number is the number of 29 mm valves implanted and the second number is the number of 31 mm valves implanted. 2 Device success is defined as deployment, only 1 valve implanted, only 1 valve in correct anatomic location, EOA >1.2 cm2 for 26, 29, and 31 mm and ≥0.9 cm2 for 23 mm, mean gradient <20mmHg, and aortic regurgitation < moderate. 3 Procedure success is defined as device success and absence of in-hospital MACCE. Plus-minus values present the mean ± standard deviation.
11.4.2.3 Primary safety and effectiveness endpoint
Figure 81 and Table 32 show the K-M rates for all-cause mortality or major stroke for the
LFLG cohort. The rates of all-cause mortality or major stroke, which is the primary endpoint
for this study, were 26.3% at 1 year. Note that the 12-month data provided here and
elsewhere in this summary are for informational purposes, since the 12-month data collection
is ongoing.

107
Figure 81: LFLG Cohort All-Cause Mortality or Major Stroke Event Rate – Attempted Implant
Note: The confidence intervals are calculated without multiplicity adjustment. The
adjusted confidence intervals could be wider than presented here. As such, confidence
intervals are provided to illustrate the variability only and should not be used to draw any
statistical conclusion.
11.4.2.4 Additional safety data
Table 32 provides a summary of the adverse events (AEs) that occurred in this study. AEs for
the Attempted Implant populations are summarized and Kaplan-Meier (K-M) rates are
provided.
Bleeding complications and permanent pacemaker implantation (PPI) were the most
frequently observed early adverse events.
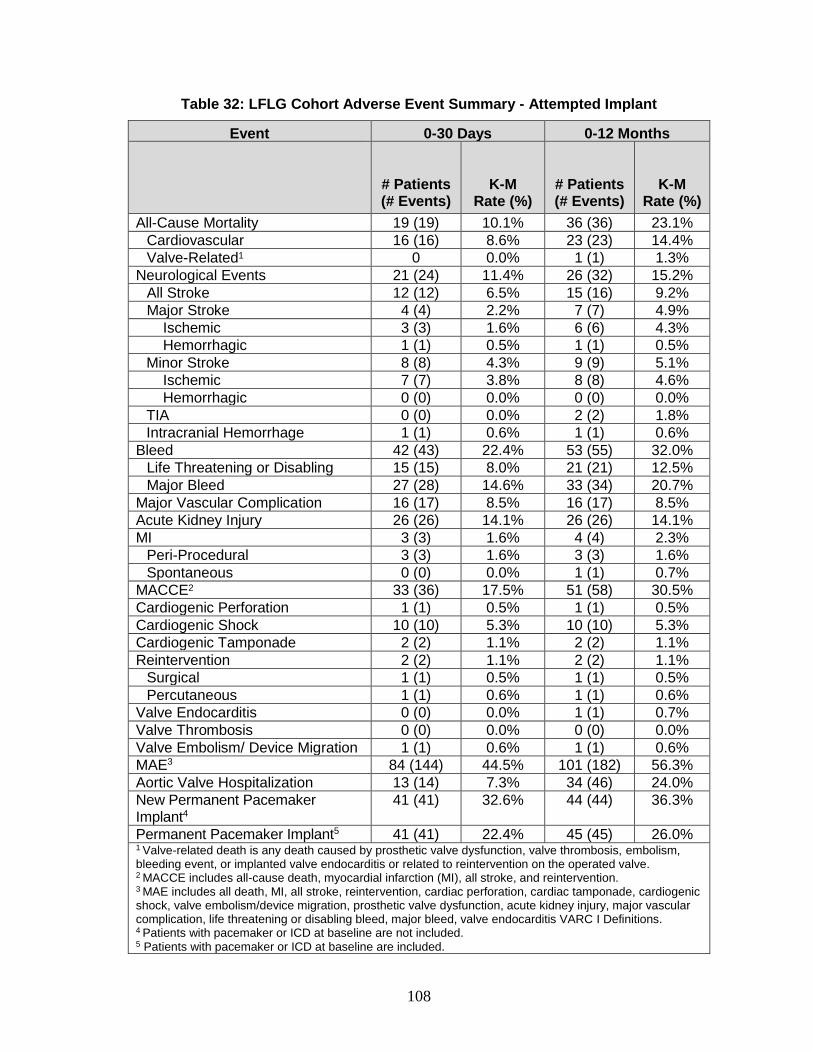
108
Table 32: LFLG Cohort Adverse Event Summary - Attempted Implant
Event 0-30 Days 0-12 Months
# Patients (# Events)
K-M Rate (%)
# Patients (# Events)
K-M Rate (%)
All-Cause Mortality 19 (19) 10.1% 36 (36) 23.1%
Cardiovascular 16 (16) 8.6% 23 (23) 14.4%
Valve-Related1 0 0.0% 1 (1) 1.3%
Neurological Events 21 (24) 11.4% 26 (32) 15.2%
All Stroke 12 (12) 6.5% 15 (16) 9.2%
Major Stroke 4 (4) 2.2% 7 (7) 4.9%
Ischemic 3 (3) 1.6% 6 (6) 4.3%
Hemorrhagic 1 (1) 0.5% 1 (1) 0.5%
Minor Stroke 8 (8) 4.3% 9 (9) 5.1%
Ischemic 7 (7) 3.8% 8 (8) 4.6%
Hemorrhagic 0 (0) 0.0% 0 (0) 0.0%
TIA 0 (0) 0.0% 2 (2) 1.8%
Intracranial Hemorrhage 1 (1) 0.6% 1 (1) 0.6%
Bleed 42 (43) 22.4% 53 (55) 32.0%
Life Threatening or Disabling 15 (15) 8.0% 21 (21) 12.5%
Major Bleed 27 (28) 14.6% 33 (34) 20.7%
Major Vascular Complication 16 (17) 8.5% 16 (17) 8.5%
Acute Kidney Injury 26 (26) 14.1% 26 (26) 14.1%
MI 3 (3) 1.6% 4 (4) 2.3%
Peri-Procedural 3 (3) 1.6% 3 (3) 1.6%
Spontaneous 0 (0) 0.0% 1 (1) 0.7%
MACCE2 33 (36) 17.5% 51 (58) 30.5%
Cardiogenic Perforation 1 (1) 0.5% 1 (1) 0.5%
Cardiogenic Shock 10 (10) 5.3% 10 (10) 5.3%
Cardiogenic Tamponade 2 (2) 1.1% 2 (2) 1.1%
Reintervention 2 (2) 1.1% 2 (2) 1.1%
Surgical 1 (1) 0.5% 1 (1) 0.5%
Percutaneous 1 (1) 0.6% 1 (1) 0.6%
Valve Endocarditis 0 (0) 0.0% 1 (1) 0.7%
Valve Thrombosis 0 (0) 0.0% 0 (0) 0.0%
Valve Embolism/ Device Migration 1 (1) 0.6% 1 (1) 0.6%
MAE3 84 (144) 44.5% 101 (182) 56.3%
Aortic Valve Hospitalization 13 (14) 7.3% 34 (46) 24.0%
New Permanent Pacemaker Implant4
41 (41) 32.6% 44 (44) 36.3%
Permanent Pacemaker Implant5 41 (41) 22.4% 45 (45) 26.0% 1 Valve-related death is any death caused by prosthetic valve dysfunction, valve thrombosis, embolism, bleeding event, or implanted valve endocarditis or related to reintervention on the operated valve. 2 MACCE includes all-cause death, myocardial infarction (MI), all stroke, and reintervention. 3 MAE includes all death, MI, all stroke, reintervention, cardiac perforation, cardiac tamponade, cardiogenic shock, valve embolism/device migration, prosthetic valve dysfunction, acute kidney injury, major vascular complication, life threatening or disabling bleed, major bleed, valve endocarditis VARC I Definitions. 4 Patients with pacemaker or ICD at baseline are not included. 5 Patients with pacemaker or ICD at baseline are included.
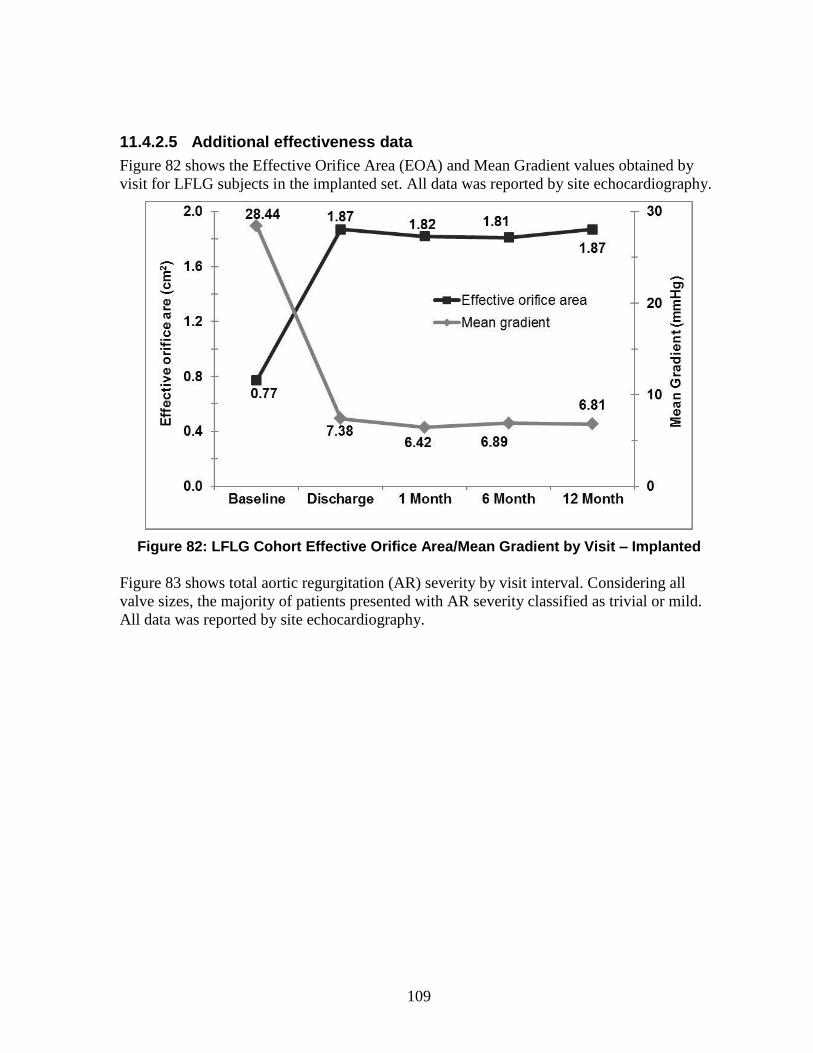
109
11.4.2.5 Additional effectiveness data
Figure 82 shows the Effective Orifice Area (EOA) and Mean Gradient values obtained by
visit for LFLG subjects in the implanted set. All data was reported by site echocardiography.
Figure 82: LFLG Cohort Effective Orifice Area/Mean Gradient by Visit – Implanted
Figure 83 shows total aortic regurgitation (AR) severity by visit interval. Considering all
valve sizes, the majority of patients presented with AR severity classified as trivial or mild.
All data was reported by site echocardiography.
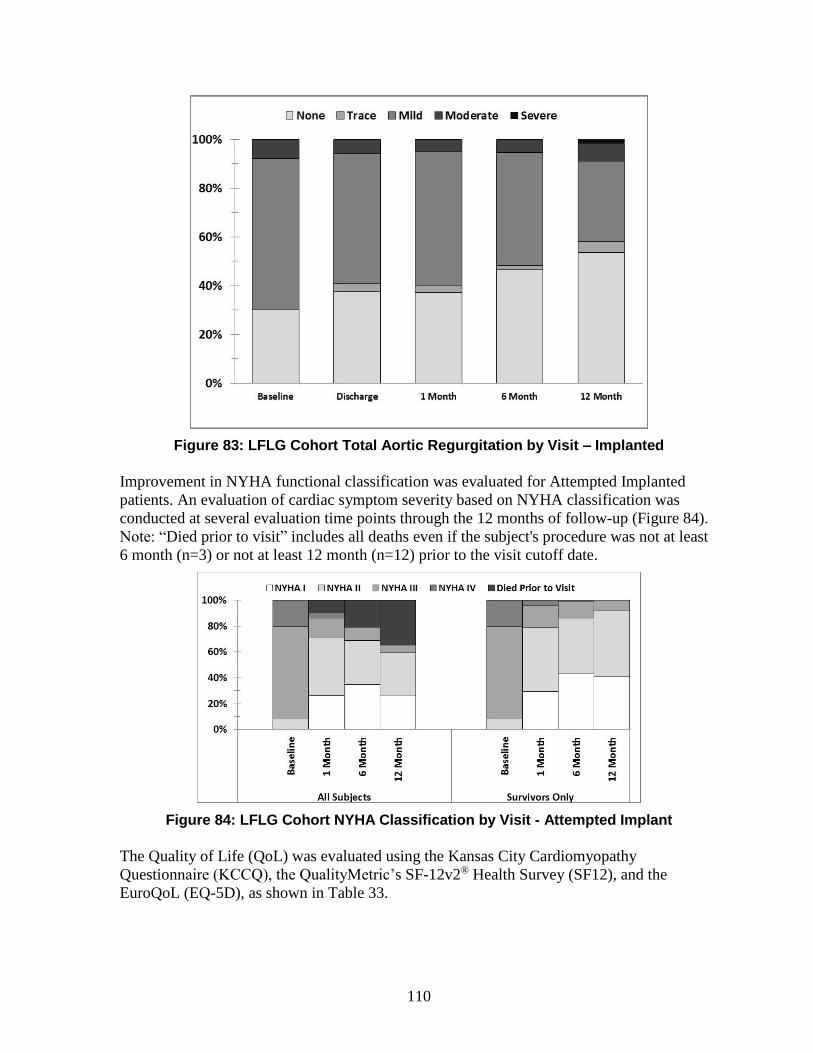
110
Figure 83: LFLG Cohort Total Aortic Regurgitation by Visit – Implanted
Improvement in NYHA functional classification was evaluated for Attempted Implanted
patients. An evaluation of cardiac symptom severity based on NYHA classification was
conducted at several evaluation time points through the 12 months of follow-up (Figure 84).
Note: “Died prior to visit” includes all deaths even if the subject's procedure was not at least
6 month (n=3) or not at least 12 month (n=12) prior to the visit cutoff date.
Figure 84: LFLG Cohort NYHA Classification by Visit - Attempted Implant
The Quality of Life (QoL) was evaluated using the Kansas City Cardiomyopathy
Questionnaire (KCCQ), the QualityMetric’s SF-12v2® Health Survey (SF12), and the
EuroQoL (EQ-5D), as shown in Table 33.
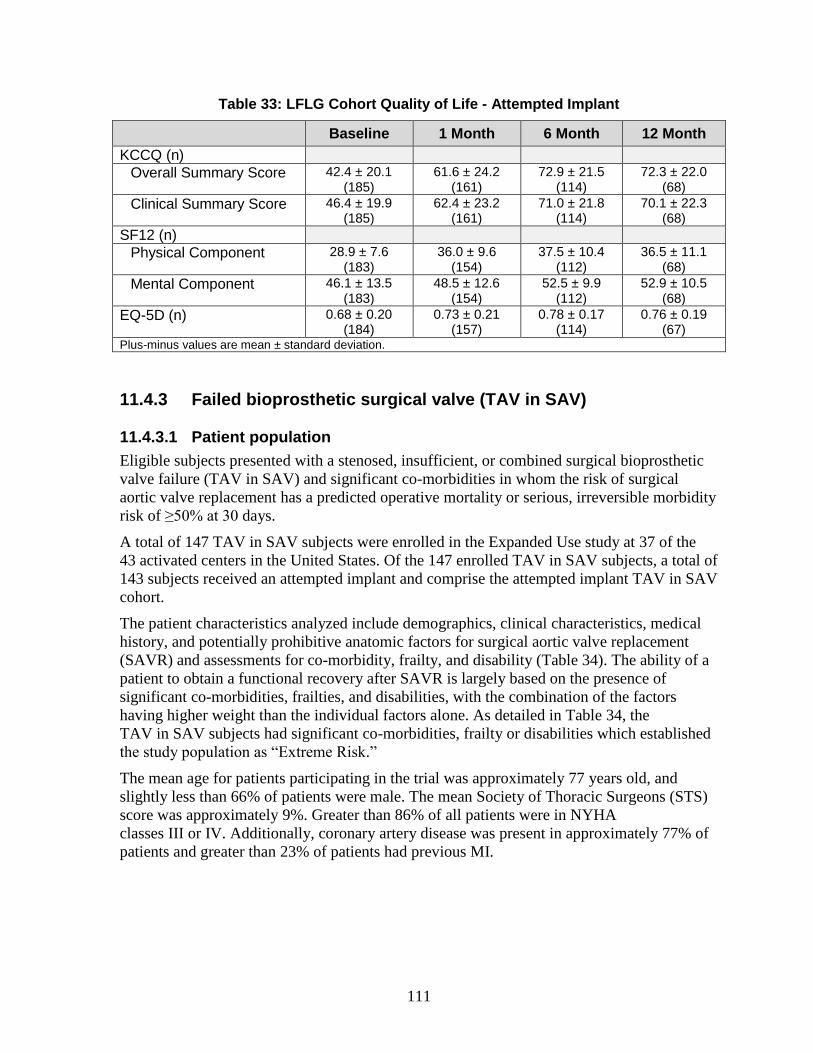
111
Table 33: LFLG Cohort Quality of Life - Attempted Implant
Baseline 1 Month 6 Month 12 Month
KCCQ (n)
Overall Summary Score 42.4 ± 20.1 (185)
61.6 ± 24.2 (161)
72.9 ± 21.5 (114)
72.3 ± 22.0 (68)
Clinical Summary Score 46.4 ± 19.9 (185)
62.4 ± 23.2 (161)
71.0 ± 21.8 (114)
70.1 ± 22.3 (68)
SF12 (n)
Physical Component 28.9 ± 7.6 (183)
36.0 ± 9.6 (154)
37.5 ± 10.4 (112)
36.5 ± 11.1 (68)
Mental Component 46.1 ± 13.5 (183)
48.5 ± 12.6 (154)
52.5 ± 9.9 (112)
52.9 ± 10.5 (68)
EQ-5D (n) 0.68 ± 0.20 (184)
0.73 ± 0.21 (157)
0.78 ± 0.17 (114)
0.76 ± 0.19 (67)
Plus-minus values are mean ± standard deviation.
11.4.3 Failed bioprosthetic surgical valve (TAV in SAV)
11.4.3.1 Patient population
Eligible subjects presented with a stenosed, insufficient, or combined surgical bioprosthetic
valve failure (TAV in SAV) and significant co-morbidities in whom the risk of surgical
aortic valve replacement has a predicted operative mortality or serious, irreversible morbidity
risk of ≥50% at 30 days.
A total of 147 TAV in SAV subjects were enrolled in the Expanded Use study at 37 of the
43 activated centers in the United States. Of the 147 enrolled TAV in SAV subjects, a total of
143 subjects received an attempted implant and comprise the attempted implant TAV in SAV
cohort.
The patient characteristics analyzed include demographics, clinical characteristics, medical
history, and potentially prohibitive anatomic factors for surgical aortic valve replacement
(SAVR) and assessments for co-morbidity, frailty, and disability (Table 34). The ability of a
patient to obtain a functional recovery after SAVR is largely based on the presence of
significant co-morbidities, frailties, and disabilities, with the combination of the factors
having higher weight than the individual factors alone. As detailed in Table 34, the
TAV in SAV subjects had significant co-morbidities, frailty or disabilities which established
the study population as “Extreme Risk.”
The mean age for patients participating in the trial was approximately 77 years old, and
slightly less than 66% of patients were male. The mean Society of Thoracic Surgeons (STS)
score was approximately 9%. Greater than 86% of all patients were in NYHA
classes III or IV. Additionally, coronary artery disease was present in approximately 77% of
patients and greater than 23% of patients had previous MI.
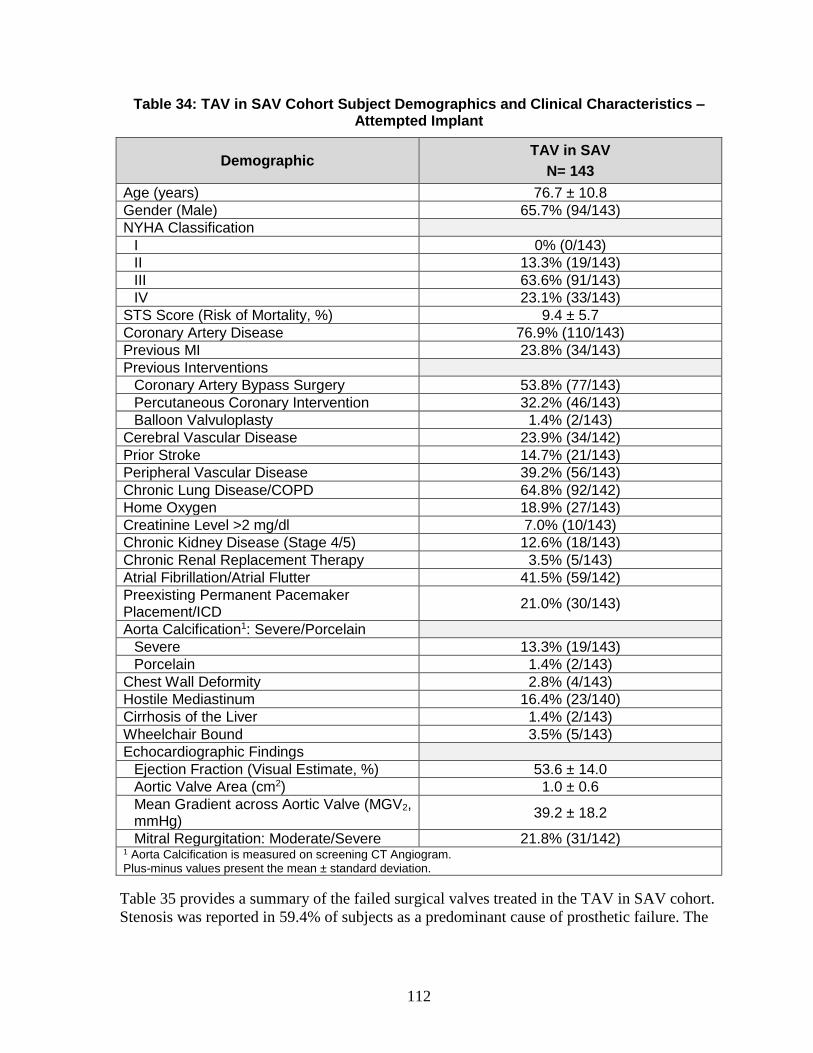
112
Table 34: TAV in SAV Cohort Subject Demographics and Clinical Characteristics – Attempted Implant
Demographic TAV in SAV
N= 143
Age (years) 76.7 ± 10.8
Gender (Male) 65.7% (94/143)
NYHA Classification
I 0% (0/143)
II 13.3% (19/143)
III 63.6% (91/143)
IV 23.1% (33/143)
STS Score (Risk of Mortality, %) 9.4 ± 5.7
Coronary Artery Disease 76.9% (110/143)
Previous MI 23.8% (34/143)
Previous Interventions
Coronary Artery Bypass Surgery 53.8% (77/143)
Percutaneous Coronary Intervention 32.2% (46/143)
Balloon Valvuloplasty 1.4% (2/143)
Cerebral Vascular Disease 23.9% (34/142)
Prior Stroke 14.7% (21/143)
Peripheral Vascular Disease 39.2% (56/143)
Chronic Lung Disease/COPD 64.8% (92/142)
Home Oxygen 18.9% (27/143)
Creatinine Level >2 mg/dl 7.0% (10/143)
Chronic Kidney Disease (Stage 4/5) 12.6% (18/143)
Chronic Renal Replacement Therapy 3.5% (5/143)
Atrial Fibrillation/Atrial Flutter 41.5% (59/142)
Preexisting Permanent Pacemaker Placement/ICD
21.0% (30/143)
Aorta Calcification1: Severe/Porcelain
Severe 13.3% (19/143)
Porcelain 1.4% (2/143)
Chest Wall Deformity 2.8% (4/143)
Hostile Mediastinum 16.4% (23/140)
Cirrhosis of the Liver 1.4% (2/143)
Wheelchair Bound 3.5% (5/143)
Echocardiographic Findings
Ejection Fraction (Visual Estimate, %) 53.6 ± 14.0
Aortic Valve Area (cm2) 1.0 ± 0.6
Mean Gradient across Aortic Valve (MGV2, mmHg)
39.2 ± 18.2
Mitral Regurgitation: Moderate/Severe 21.8% (31/142) 1 Aorta Calcification is measured on screening CT Angiogram. Plus-minus values present the mean ± standard deviation.
Table 35 provides a summary of the failed surgical valves treated in the TAV in SAV cohort.
Stenosis was reported in 59.4% of subjects as a predominant cause of prosthetic failure. The
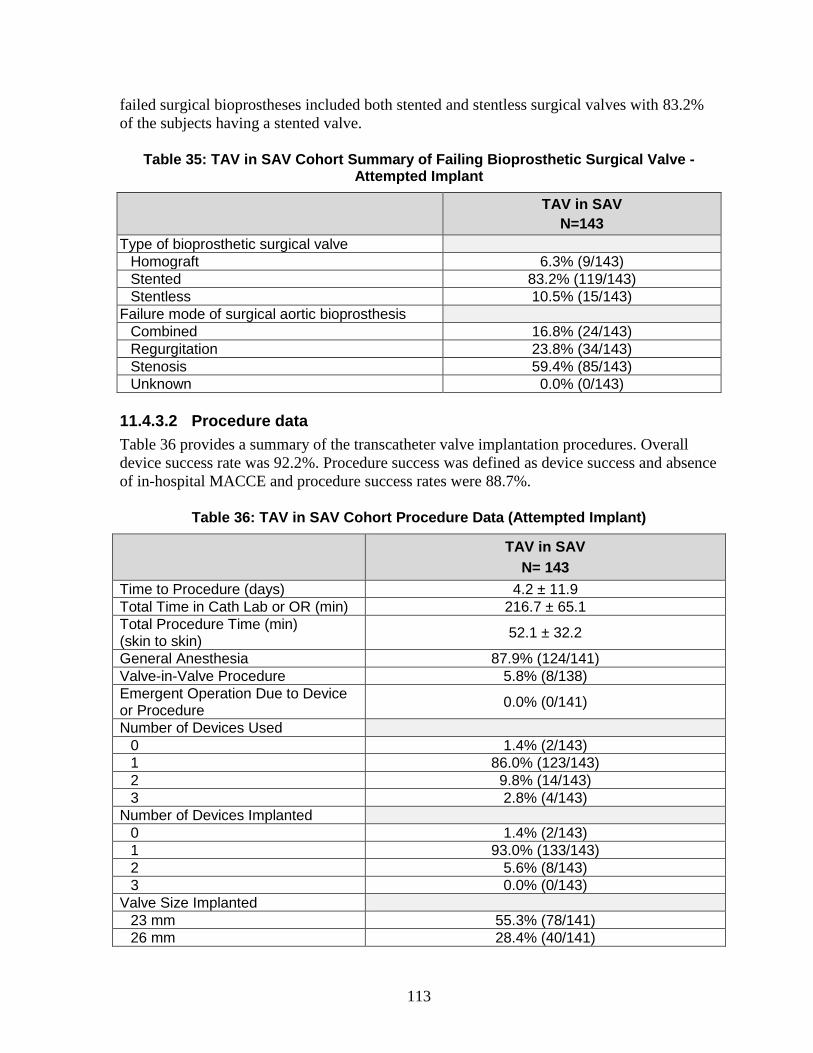
113
failed surgical bioprostheses included both stented and stentless surgical valves with 83.2%
of the subjects having a stented valve.
Table 35: TAV in SAV Cohort Summary of Failing Bioprosthetic Surgical Valve - Attempted Implant
TAV in SAV
N=143
Type of bioprosthetic surgical valve
Homograft 6.3% (9/143)
Stented 83.2% (119/143)
Stentless 10.5% (15/143)
Failure mode of surgical aortic bioprosthesis
Combined 16.8% (24/143)
Regurgitation 23.8% (34/143)
Stenosis 59.4% (85/143)
Unknown 0.0% (0/143)
11.4.3.2 Procedure data
Table 36 provides a summary of the transcatheter valve implantation procedures. Overall
device success rate was 92.2%. Procedure success was defined as device success and absence
of in-hospital MACCE and procedure success rates were 88.7%.
Table 36: TAV in SAV Cohort Procedure Data (Attempted Implant)
TAV in SAV
N= 143
Time to Procedure (days) 4.2 ± 11.9
Total Time in Cath Lab or OR (min) 216.7 ± 65.1
Total Procedure Time (min) (skin to skin)
52.1 ± 32.2
General Anesthesia 87.9% (124/141)
Valve-in-Valve Procedure 5.8% (8/138)
Emergent Operation Due to Device or Procedure
0.0% (0/141)
Number of Devices Used
0 1.4% (2/143)
1 86.0% (123/143)
2 9.8% (14/143)
3 2.8% (4/143)
Number of Devices Implanted
0 1.4% (2/143)
1 93.0% (133/143)
2 5.6% (8/143)
3 0.0% (0/143)
Valve Size Implanted
23 mm 55.3% (78/141)
26 mm 28.4% (40/141)
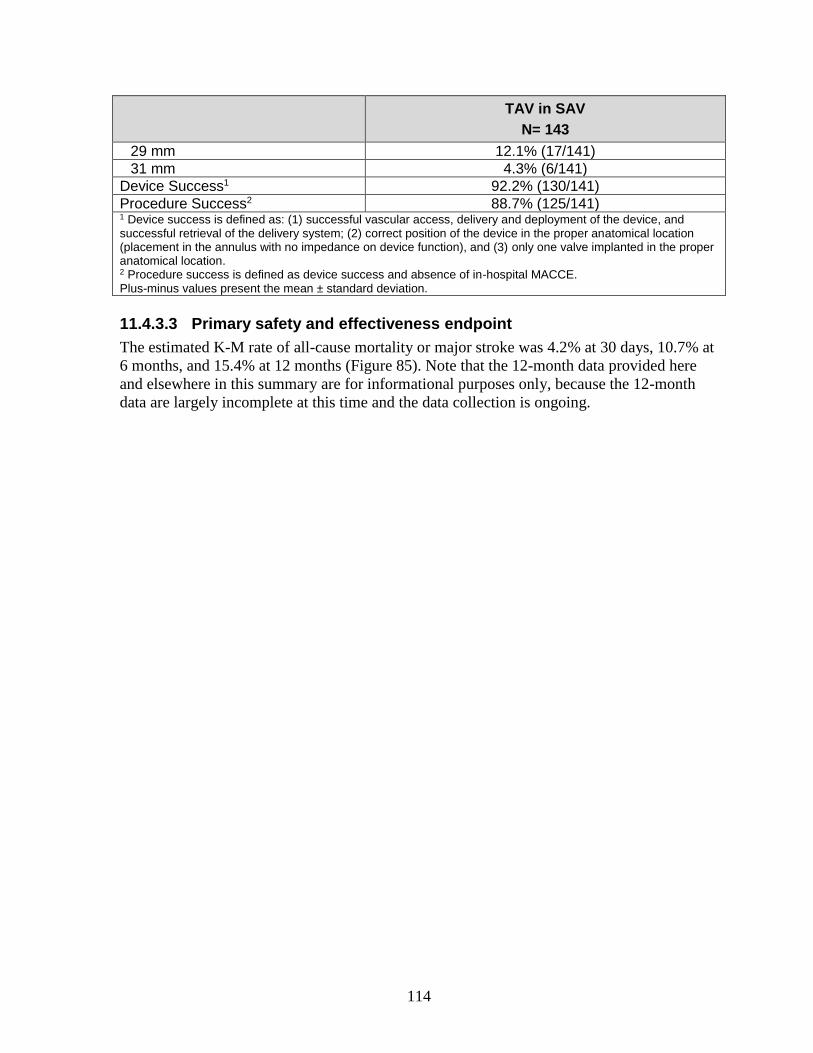
114
TAV in SAV
N= 143
29 mm 12.1% (17/141)
31 mm 4.3% (6/141)
Device Success1 92.2% (130/141)
Procedure Success2 88.7% (125/141) 1 Device success is defined as: (1) successful vascular access, delivery and deployment of the device, and successful retrieval of the delivery system; (2) correct position of the device in the proper anatomical location (placement in the annulus with no impedance on device function), and (3) only one valve implanted in the proper anatomical location. 2 Procedure success is defined as device success and absence of in-hospital MACCE. Plus-minus values present the mean ± standard deviation.
11.4.3.3 Primary safety and effectiveness endpoint
The estimated K-M rate of all-cause mortality or major stroke was 4.2% at 30 days, 10.7% at
6 months, and 15.4% at 12 months (Figure 85). Note that the 12-month data provided here
and elsewhere in this summary are for informational purposes only, because the 12-month
data are largely incomplete at this time and the data collection is ongoing.
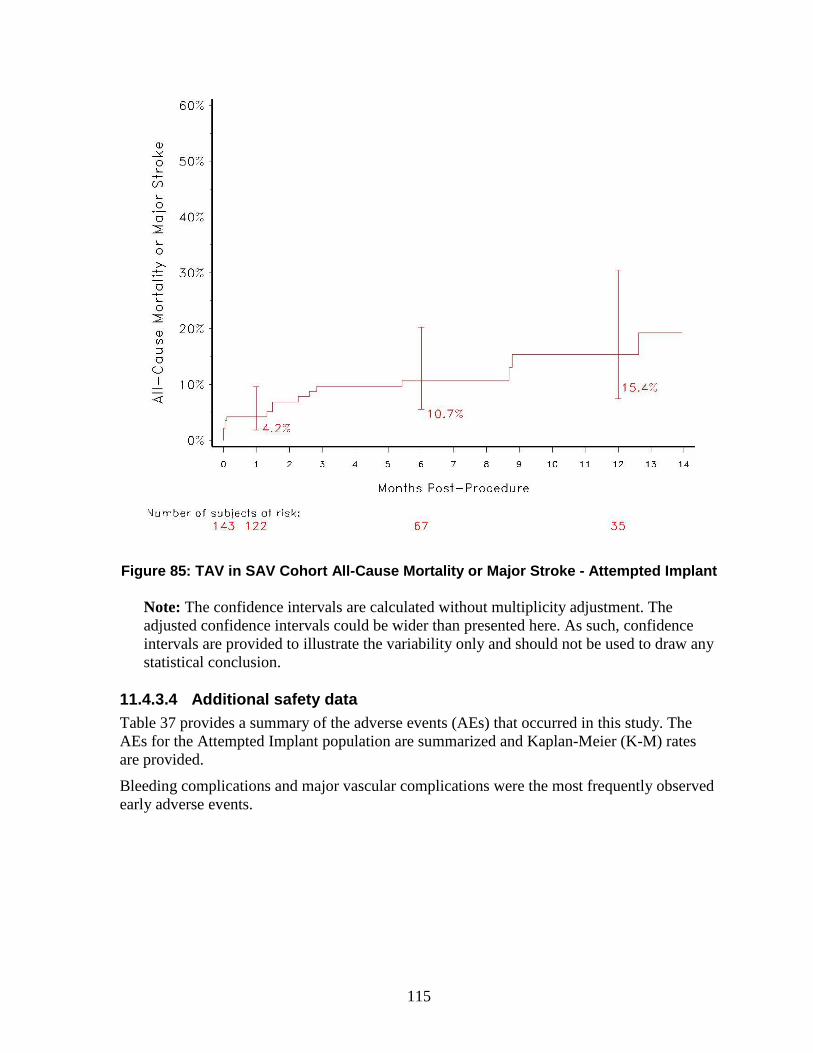
115
Figure 85: TAV in SAV Cohort All-Cause Mortality or Major Stroke - Attempted Implant
Note: The confidence intervals are calculated without multiplicity adjustment. The
adjusted confidence intervals could be wider than presented here. As such, confidence
intervals are provided to illustrate the variability only and should not be used to draw any
statistical conclusion.
11.4.3.4 Additional safety data
Table 37 provides a summary of the adverse events (AEs) that occurred in this study. The
AEs for the Attempted Implant population are summarized and Kaplan-Meier (K-M) rates
are provided.
Bleeding complications and major vascular complications were the most frequently observed
early adverse events.
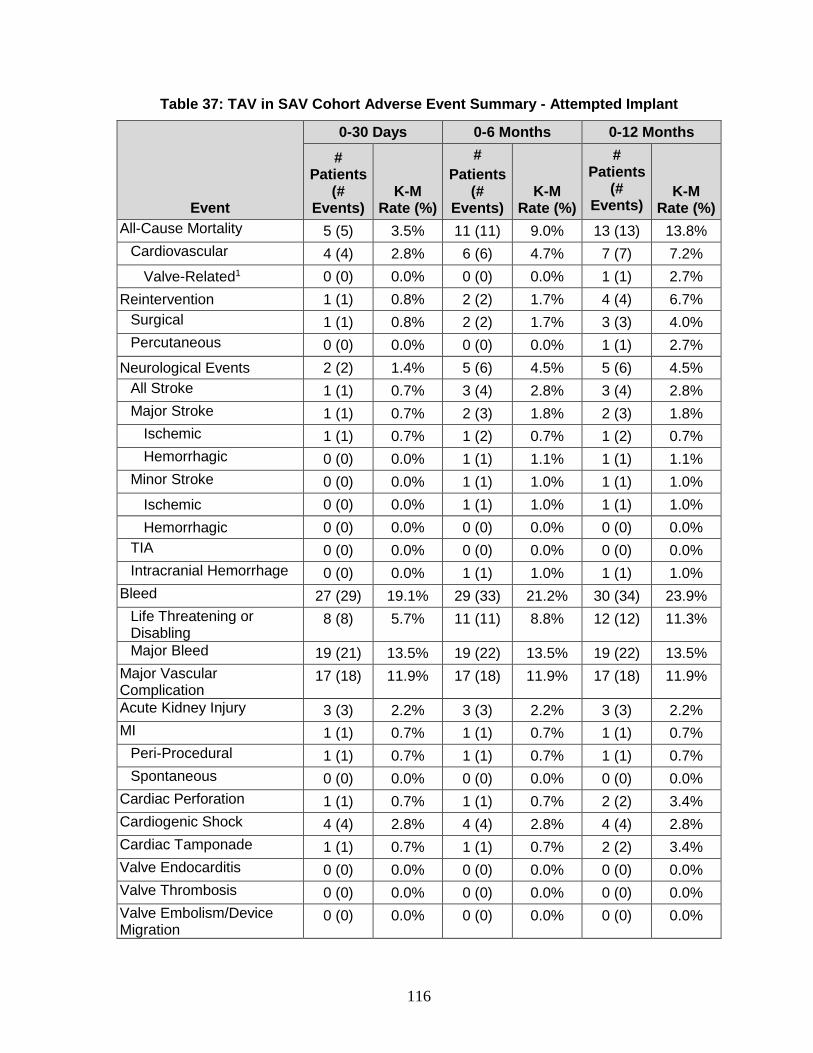
116
Table 37: TAV in SAV Cohort Adverse Event Summary - Attempted Implant
Event
0-30 Days 0-6 Months 0-12 Months
# Patients
(# Events)
K-M Rate (%)
#
Patients (#
Events) K-M
Rate (%)
# Patients
(# Events)
K-M Rate (%)
All-Cause Mortality 5 (5) 3.5% 11 (11) 9.0% 13 (13) 13.8%
Cardiovascular 4 (4) 2.8% 6 (6) 4.7% 7 (7) 7.2%
Valve-Related1 0 (0) 0.0% 0 (0) 0.0% 1 (1) 2.7%
Reintervention 1 (1) 0.8% 2 (2) 1.7% 4 (4) 6.7%
Surgical 1 (1) 0.8% 2 (2) 1.7% 3 (3) 4.0%
Percutaneous 0 (0) 0.0% 0 (0) 0.0% 1 (1) 2.7%
Neurological Events 2 (2) 1.4% 5 (6) 4.5% 5 (6) 4.5%
All Stroke 1 (1) 0.7% 3 (4) 2.8% 3 (4) 2.8%
Major Stroke 1 (1) 0.7% 2 (3) 1.8% 2 (3) 1.8%
Ischemic 1 (1) 0.7% 1 (2) 0.7% 1 (2) 0.7%
Hemorrhagic 0 (0) 0.0% 1 (1) 1.1% 1 (1) 1.1%
Minor Stroke 0 (0) 0.0% 1 (1) 1.0% 1 (1) 1.0%
Ischemic 0 (0) 0.0% 1 (1) 1.0% 1 (1) 1.0%
Hemorrhagic 0 (0) 0.0% 0 (0) 0.0% 0 (0) 0.0%
TIA 0 (0) 0.0% 0 (0) 0.0% 0 (0) 0.0%
Intracranial Hemorrhage 0 (0) 0.0% 1 (1) 1.0% 1 (1) 1.0%
Bleed 27 (29) 19.1% 29 (33) 21.2% 30 (34) 23.9%
Life Threatening or Disabling
8 (8) 5.7% 11 (11) 8.8% 12 (12) 11.3%
Major Bleed 19 (21) 13.5% 19 (22) 13.5% 19 (22) 13.5%
Major Vascular Complication
17 (18) 11.9% 17 (18) 11.9% 17 (18) 11.9%
Acute Kidney Injury 3 (3) 2.2% 3 (3) 2.2% 3 (3) 2.2%
MI 1 (1) 0.7% 1 (1) 0.7% 1 (1) 0.7%
Peri-Procedural 1 (1) 0.7% 1 (1) 0.7% 1 (1) 0.7%
Spontaneous 0 (0) 0.0% 0 (0) 0.0% 0 (0) 0.0%
Cardiac Perforation 1 (1) 0.7% 1 (1) 0.7% 2 (2) 3.4%
Cardiogenic Shock 4 (4) 2.8% 4 (4) 2.8% 4 (4) 2.8%
Cardiac Tamponade 1 (1) 0.7% 1 (1) 0.7% 2 (2) 3.4%
Valve Endocarditis 0 (0) 0.0% 0 (0) 0.0% 0 (0) 0.0%
Valve Thrombosis 0 (0) 0.0% 0 (0) 0.0% 0 (0) 0.0%
Valve Embolism/Device Migration
0 (0) 0.0% 0 (0) 0.0% 0 (0) 0.0%
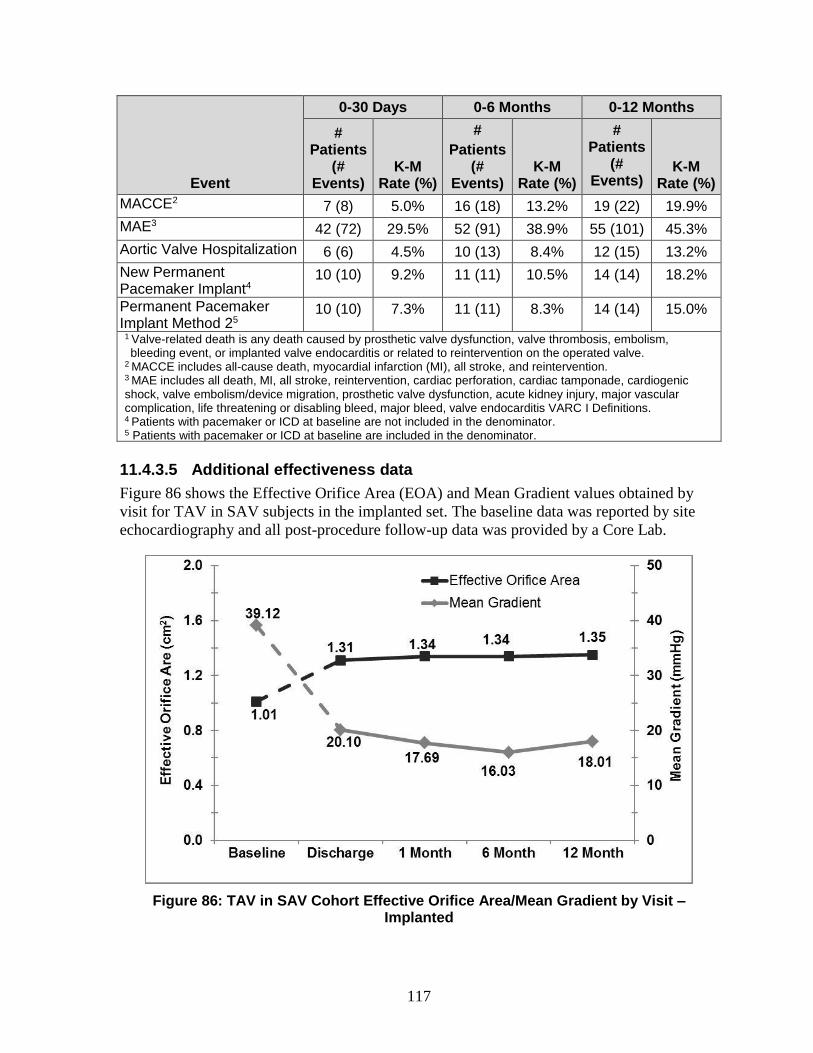
117
Event
0-30 Days 0-6 Months 0-12 Months
# Patients
(# Events)
K-M Rate (%)
#
Patients (#
Events) K-M
Rate (%)
# Patients
(# Events)
K-M Rate (%)
MACCE2 7 (8) 5.0% 16 (18) 13.2% 19 (22) 19.9%
MAE3 42 (72) 29.5% 52 (91) 38.9% 55 (101) 45.3%
Aortic Valve Hospitalization 6 (6) 4.5% 10 (13) 8.4% 12 (15) 13.2%
New Permanent Pacemaker Implant4
10 (10) 9.2% 11 (11) 10.5% 14 (14) 18.2%
Permanent Pacemaker Implant Method 25
10 (10) 7.3% 11 (11) 8.3% 14 (14) 15.0%
1 Valve-related death is any death caused by prosthetic valve dysfunction, valve thrombosis, embolism, bleeding event, or implanted valve endocarditis or related to reintervention on the operated valve.
2 MACCE includes all-cause death, myocardial infarction (MI), all stroke, and reintervention. 3 MAE includes all death, MI, all stroke, reintervention, cardiac perforation, cardiac tamponade, cardiogenic shock, valve embolism/device migration, prosthetic valve dysfunction, acute kidney injury, major vascular complication, life threatening or disabling bleed, major bleed, valve endocarditis VARC I Definitions. 4 Patients with pacemaker or ICD at baseline are not included in the denominator. 5 Patients with pacemaker or ICD at baseline are included in the denominator.
11.4.3.5 Additional effectiveness data
Figure 86 shows the Effective Orifice Area (EOA) and Mean Gradient values obtained by
visit for TAV in SAV subjects in the implanted set. The baseline data was reported by site
echocardiography and all post-procedure follow-up data was provided by a Core Lab.
Figure 86: TAV in SAV Cohort Effective Orifice Area/Mean Gradient by Visit – Implanted
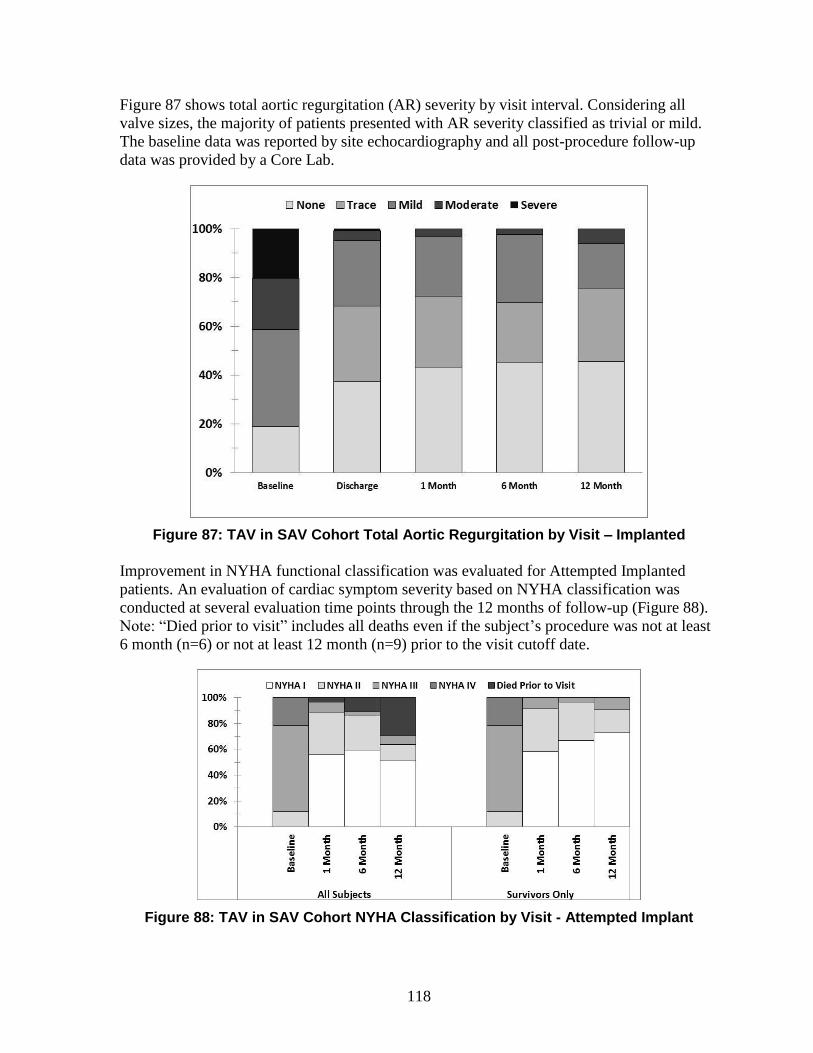
118
Figure 87 shows total aortic regurgitation (AR) severity by visit interval. Considering all
valve sizes, the majority of patients presented with AR severity classified as trivial or mild.
The baseline data was reported by site echocardiography and all post-procedure follow-up
data was provided by a Core Lab.
Figure 87: TAV in SAV Cohort Total Aortic Regurgitation by Visit – Implanted
Improvement in NYHA functional classification was evaluated for Attempted Implanted
patients. An evaluation of cardiac symptom severity based on NYHA classification was
conducted at several evaluation time points through the 12 months of follow-up (Figure 88).
Note: “Died prior to visit” includes all deaths even if the subject’s procedure was not at least
6 month (n=6) or not at least 12 month (n=9) prior to the visit cutoff date.
Figure 88: TAV in SAV Cohort NYHA Classification by Visit - Attempted Implant
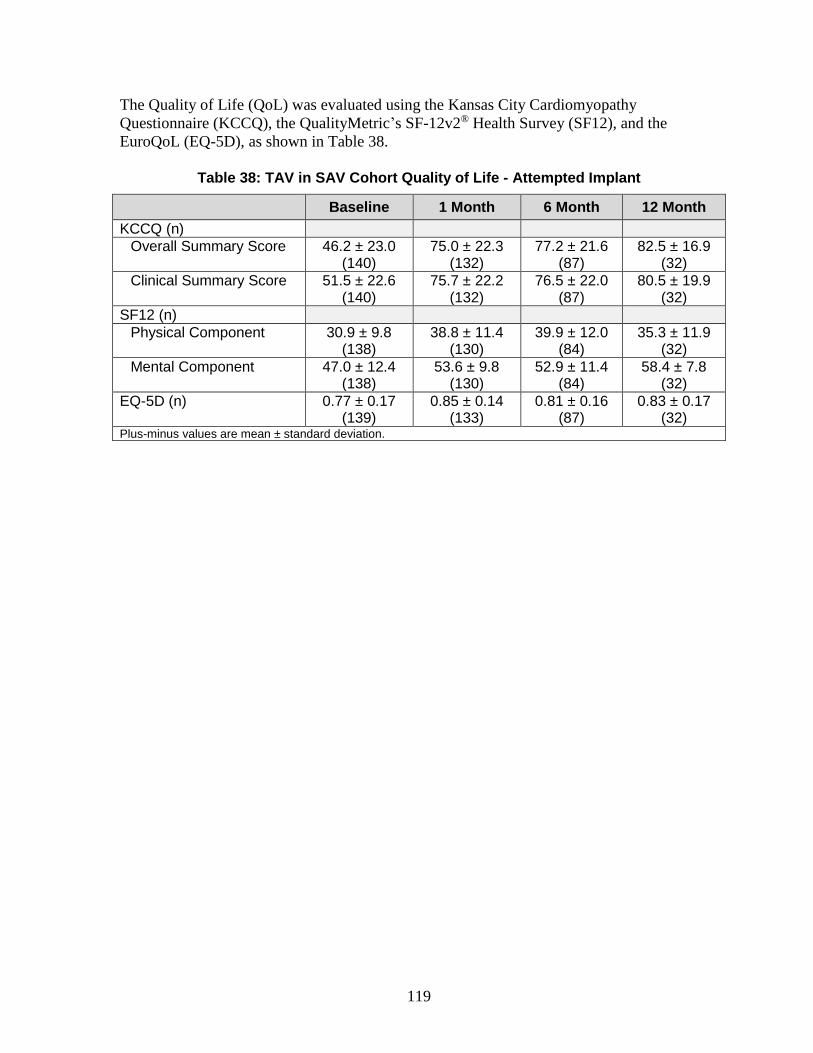
119
The Quality of Life (QoL) was evaluated using the Kansas City Cardiomyopathy
Questionnaire (KCCQ), the QualityMetric’s SF-12v2® Health Survey (SF12), and the
EuroQoL (EQ-5D), as shown in Table 38.
Table 38: TAV in SAV Cohort Quality of Life - Attempted Implant
Baseline 1 Month 6 Month 12 Month
KCCQ (n)
Overall Summary Score 46.2 ± 23.0 (140)
75.0 ± 22.3 (132)
77.2 ± 21.6 (87)
82.5 ± 16.9 (32)
Clinical Summary Score 51.5 ± 22.6 (140)
75.7 ± 22.2 (132)
76.5 ± 22.0 (87)
80.5 ± 19.9 (32)
SF12 (n)
Physical Component 30.9 ± 9.8 (138)
38.8 ± 11.4 (130)
39.9 ± 12.0 (84)
35.3 ± 11.9 (32)
Mental Component 47.0 ± 12.4 (138)
53.6 ± 9.8 (130)
52.9 ± 11.4 (84)
58.4 ± 7.8 (32)
EQ-5D (n) 0.77 ± 0.17 (139)
0.85 ± 0.14 (133)
0.81 ± 0.16 (87)
0.83 ± 0.17 (32)
Plus-minus values are mean ± standard deviation.

120
12.0 Disclaimer of warranty
The Following Disclaimer of Warranty Applies to United States Customers Only:
DISCLAIMER OF WARRANTY
ALTHOUGH THE MEDTRONIC COREVALVE™ TRANSCATHETER AORTIC
VALVE (MODELS MCS-P4-23-AOA-US, MCS-P3-26-AOA-US, MCS-P3-29-AOA-US,
AND MCS-P3-31-AOA-US), DELIVERY CATHETER SYSTEM (MODELS DCS-C4-
18F-23US AND DCS-C4-18F-US), AND COMPRESSION LOADING SYSTEM
(MODEL CLS-3000-18F-US), HEREAFTER REFERRED TO AS “PRODUCT”,
HAVE BEEN MANUFACTURED UNDER CAREFULLY CONTROLLED
CONDITIONS, MEDTRONIC HAS NO CONTROL OVER THE CONDITIONS
UNDER WHICH THIS PRODUCT IS USED. MEDTRONIC THEREFORE
DISCLAIMS ALL WARRANTIES, BOTH EXPRESS AND IMPLIED, WITH
RESPECT TO THE PRODUCT, INCLUDING, BUT NOT LIMITED TO, ANY
IMPLIED WARRANTY OF MERCHANTABILITY OR FITNESS FOR A
PARTICULAR PURPOSE. MEDTRONIC SHALL NOT BE LIABLE TO ANY
PERSON OR ENTITY FOR ANY MEDICAL EXPENSES OR ANY DIRECT,
INCIDENTAL OR CONSEQUENTIAL DAMAGES CAUSED BY ANY USE,
DEFECT, FAILURE OR MALFUNCTION OF THE PRODUCT, WHETHER A
CLAIM FOR SUCH DAMAGES IS BASED UPON WARRANTY, CONTRACT,
TORT OR OTHERWISE. NO PERSON HAS ANY AUTHORITY TO BIND
MEDTRONIC TO ANY REPRESENTATION OR WARRANTY WITH RESPECT
TO THE PRODUCT.
The exclusions and limitations set out above are not intended to, and should not be construed
so as to, contravene mandatory provisions of applicable law. If any part or term of this
DISCLAIMER OF WARRANTY is held by any court of competent jurisdiction to be illegal,
unenforceable or in conflict with applicable law, the validity of the remaining portion of the
DISCLAIMER OF WARRANTY shall not be affected, and all rights and obligations shall be
construed and enforced as if this DISCLAIMER OF WARRANTY did not contain the
particular part or term held to be invalid.

Medtronic CoreValve LLC
1851 E Deere Avenue
Santa Ana, CA 92705
USA
www.medtronic.com
+1 763 514 4000
LifeLine Technical Support,
24-hour consultation service:
1 877 526 7890
Protected by one or more of the following United States Patents: 8,226,710 and 7,914,569.
© 2017 Medtronic M053136T001 Rev. 1G
CoreValve™ Evolut™ R System
CoreValve™ Evolut™ R Transcatheter Aortic Valve
EnVeo™ R Delivery Catheter System
EnVeo™ R Loading System
Caution: Implantation of the Medtronic CoreValve™ Evolut™ R system should be performed only by physicians who have received Medtronic CoreValve™ Evolut™ R training.
These devices are supplied sterile for single use only. After use, dispose of the delivery catheter system and the loading system in accordance with local regulations and hospital procedures. Do not resterilize.
Instructions for Use
Caution: Federal (USA) law restricts this device to sale by or on the order of a physician.

Trademarks may be registered and are the property of their respective owners.
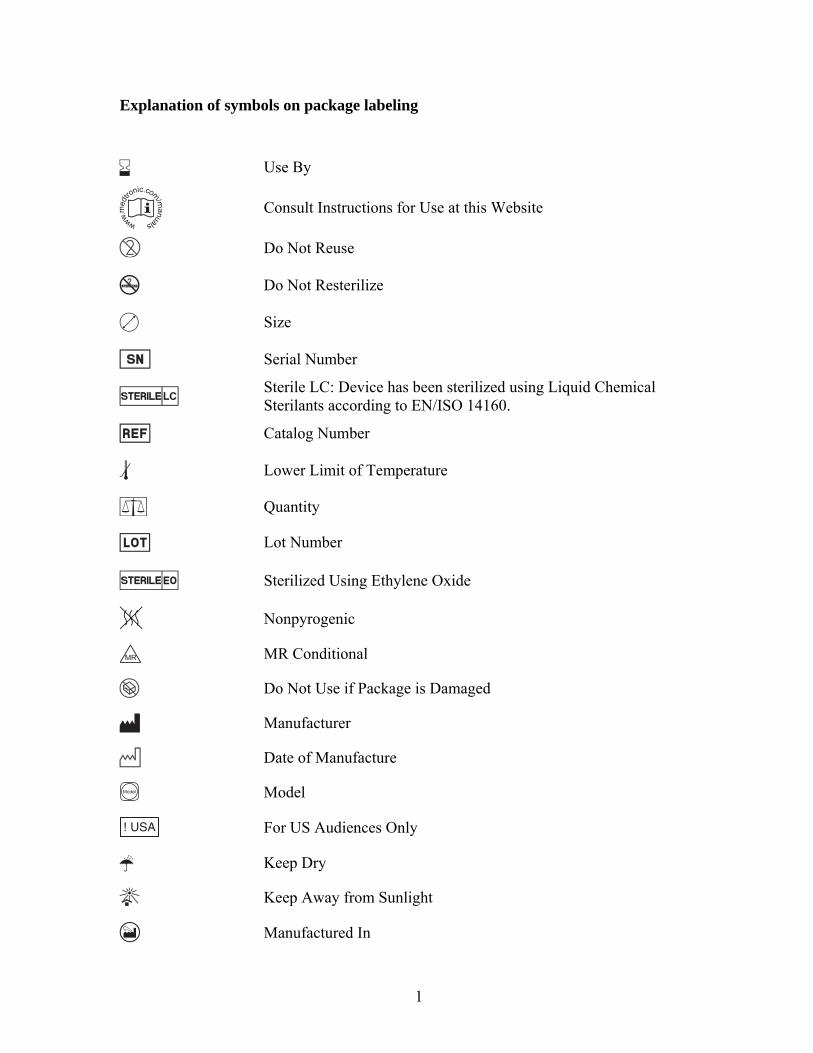
1
Explanation of symbols on package labeling
Use By
Consult Instructions for Use at this Website
Do Not Reuse
Do Not Resterilize
Size
Serial Number
Sterile LC: Device has been sterilized using Liquid Chemical Sterilants according to EN/ISO 14160.
Catalog Number
Lower Limit of Temperature
Quantity
Lot Number
Sterilized Using Ethylene Oxide
Nonpyrogenic
MR Conditional
Do Not Use if Package is Damaged
Manufacturer
Date of Manufacture
Model
For US Audiences Only
Keep Dry
Keep Away from Sunlight
Manufactured In

2
Maximum Guidewire Diameter
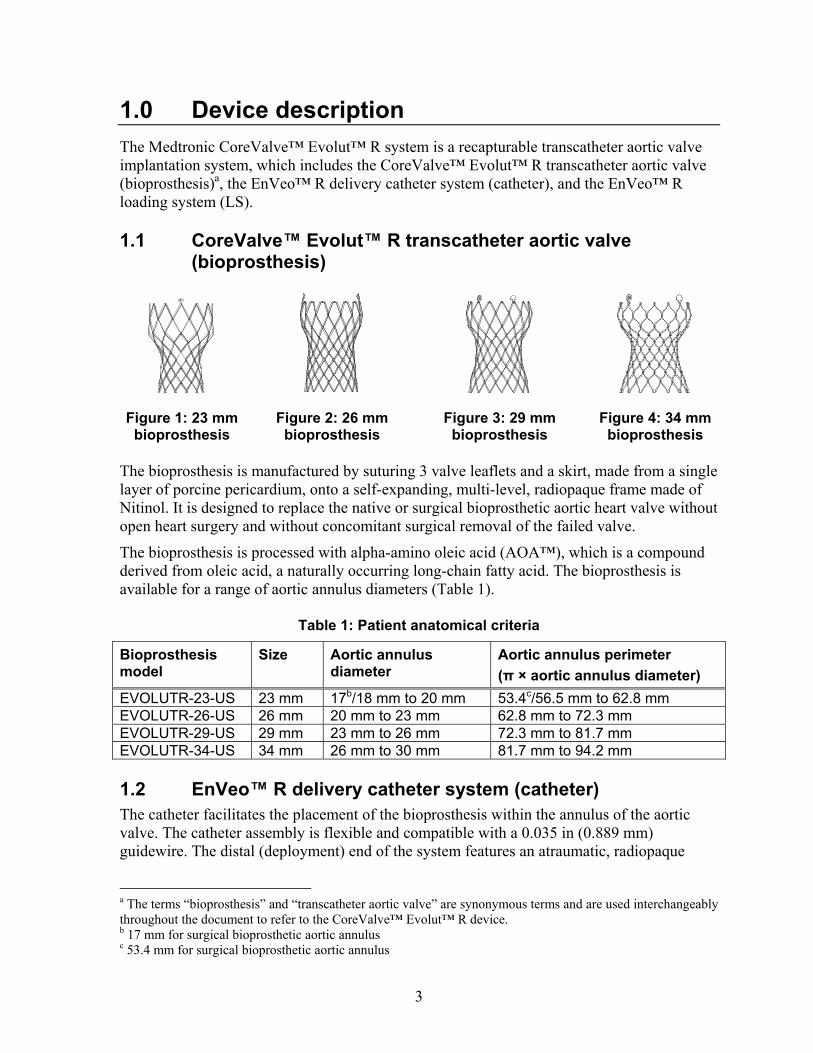
3
1.0 Device description
The Medtronic CoreValve™ Evolut™ R system is a recapturable transcatheter aortic valve implantation system, which includes the CoreValve™ Evolut™ R transcatheter aortic valve (bioprosthesis)a, the EnVeo™ R delivery catheter system (catheter), and the EnVeo™ R loading system (LS).
1.1 CoreValve™ Evolut™ R transcatheter aortic valve (bioprosthesis)
Figure 1: 23 mm bioprosthesis
Figure 2: 26 mm bioprosthesis
Figure 3: 29 mm bioprosthesis
Figure 4: 34 mm bioprosthesis
The bioprosthesis is manufactured by suturing 3 valve leaflets and a skirt, made from a single layer of porcine pericardium, onto a self-expanding, multi-level, radiopaque frame made of Nitinol. It is designed to replace the native or surgical bioprosthetic aortic heart valve without open heart surgery and without concomitant surgical removal of the failed valve.
The bioprosthesis is processed with alpha-amino oleic acid (AOA™), which is a compound derived from oleic acid, a naturally occurring long-chain fatty acid. The bioprosthesis is available for a range of aortic annulus diameters (Table 1).
Table 1: Patient anatomical criteria
Bioprosthesis model
Size Aortic annulus diameter
Aortic annulus perimeter
(π × aortic annulus diameter)
EVOLUTR-23-US 23 mm 17b/18 mm to 20 mm 53.4c/56.5 mm to 62.8 mm EVOLUTR-26-US 26 mm 20 mm to 23 mm 62.8 mm to 72.3 mm EVOLUTR-29-US 29 mm 23 mm to 26 mm 72.3 mm to 81.7 mm EVOLUTR-34-US 34 mm 26 mm to 30 mm 81.7 mm to 94.2 mm
1.2 EnVeo™ R delivery catheter system (catheter) The catheter facilitates the placement of the bioprosthesis within the annulus of the aortic valve. The catheter assembly is flexible and compatible with a 0.035 in (0.889 mm) guidewire. The distal (deployment) end of the system features an atraumatic, radiopaque
a The terms “bioprosthesis” and “transcatheter aortic valve” are synonymous terms and are used interchangeably throughout the document to refer to the CoreValve™ Evolut™ R device. b 17 mm for surgical bioprosthetic aortic annulus c 53.4 mm for surgical bioprosthetic aortic annulus
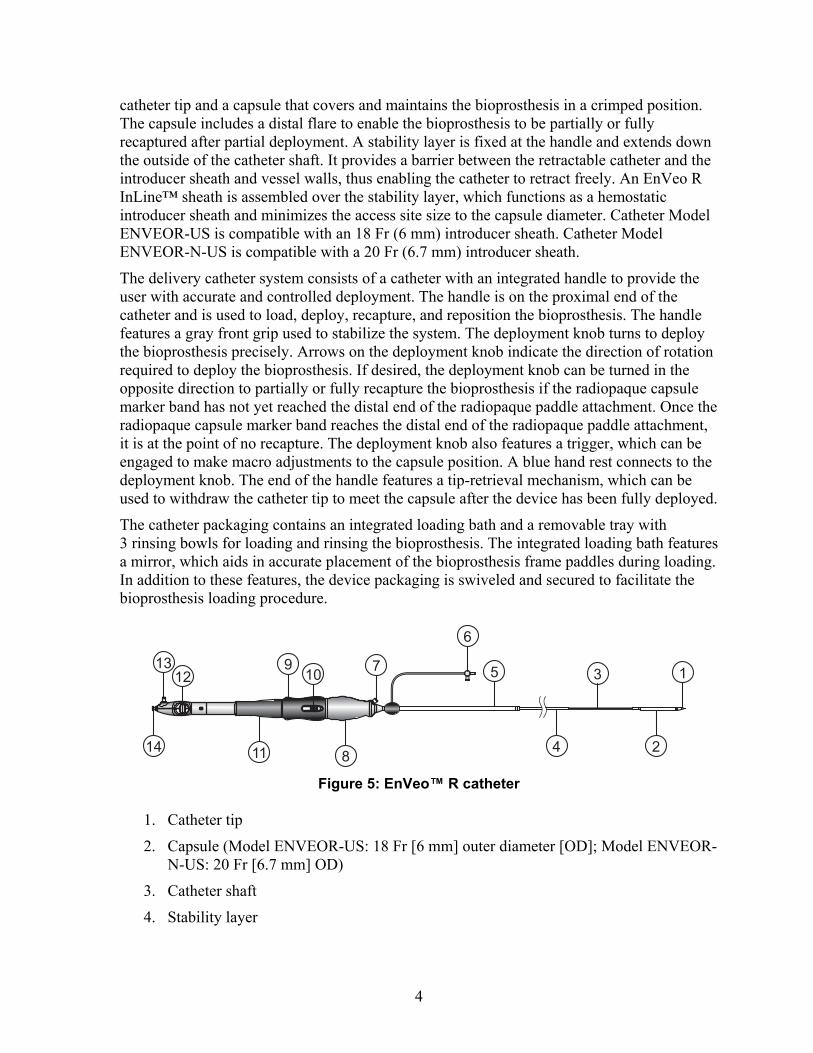
4
catheter tip and a capsule that covers and maintains the bioprosthesis in a crimped position. The capsule includes a distal flare to enable the bioprosthesis to be partially or fully recaptured after partial deployment. A stability layer is fixed at the handle and extends down the outside of the catheter shaft. It provides a barrier between the retractable catheter and the introducer sheath and vessel walls, thus enabling the catheter to retract freely. An EnVeo R InLine™ sheath is assembled over the stability layer, which functions as a hemostatic introducer sheath and minimizes the access site size to the capsule diameter. Catheter Model ENVEOR-US is compatible with an 18 Fr (6 mm) introducer sheath. Catheter Model ENVEOR-N-US is compatible with a 20 Fr (6.7 mm) introducer sheath.
The delivery catheter system consists of a catheter with an integrated handle to provide the user with accurate and controlled deployment. The handle is on the proximal end of the catheter and is used to load, deploy, recapture, and reposition the bioprosthesis. The handle features a gray front grip used to stabilize the system. The deployment knob turns to deploy the bioprosthesis precisely. Arrows on the deployment knob indicate the direction of rotation required to deploy the bioprosthesis. If desired, the deployment knob can be turned in the opposite direction to partially or fully recapture the bioprosthesis if the radiopaque capsule marker band has not yet reached the distal end of the radiopaque paddle attachment. Once the radiopaque capsule marker band reaches the distal end of the radiopaque paddle attachment, it is at the point of no recapture. The deployment knob also features a trigger, which can be engaged to make macro adjustments to the capsule position. A blue hand rest connects to the deployment knob. The end of the handle features a tip-retrieval mechanism, which can be used to withdraw the catheter tip to meet the capsule after the device has been fully deployed.
The catheter packaging contains an integrated loading bath and a removable tray with 3 rinsing bowls for loading and rinsing the bioprosthesis. The integrated loading bath features a mirror, which aids in accurate placement of the bioprosthesis frame paddles during loading. In addition to these features, the device packaging is swiveled and secured to facilitate the bioprosthesis loading procedure.
Figure 5: EnVeo™ R catheter
1. Catheter tip
2. Capsule (Model ENVEOR-US: 18 Fr [6 mm] outer diameter [OD]; Model ENVEOR-N-US: 20 Fr [6.7 mm] OD)
3. Catheter shaft
4. Stability layer
135
6
7109
1213
14 11 8 4 2

5
5. Model ENVEOR-US: 14 Fr equivalent EnVeo R InLine™ sheath (18 Fr [6 mm] OD); Model ENVEOR-N-US: 16 Fr equivalent EnVeo R InLine™ sheath (20 Fr [6.7 mm] OD)
6. EnVeo R InLine™ sheath flush port
7. Stability layer flush port
8. Gray front grip
9. Deployment knob
10. Trigger
11. Blue hand rest
12. Tip-retrieval mechanism
13. Capsule flush port
14. Wire lumen flush port
Figure 6: EnVeo™ R catheter
1. Model ENVEOR-US: 7.6 cm; Model ENVEOR-N-US: 7.7 cm
2. 107 cm
3. 88.6 cm
4. 30 cm
1
32
4
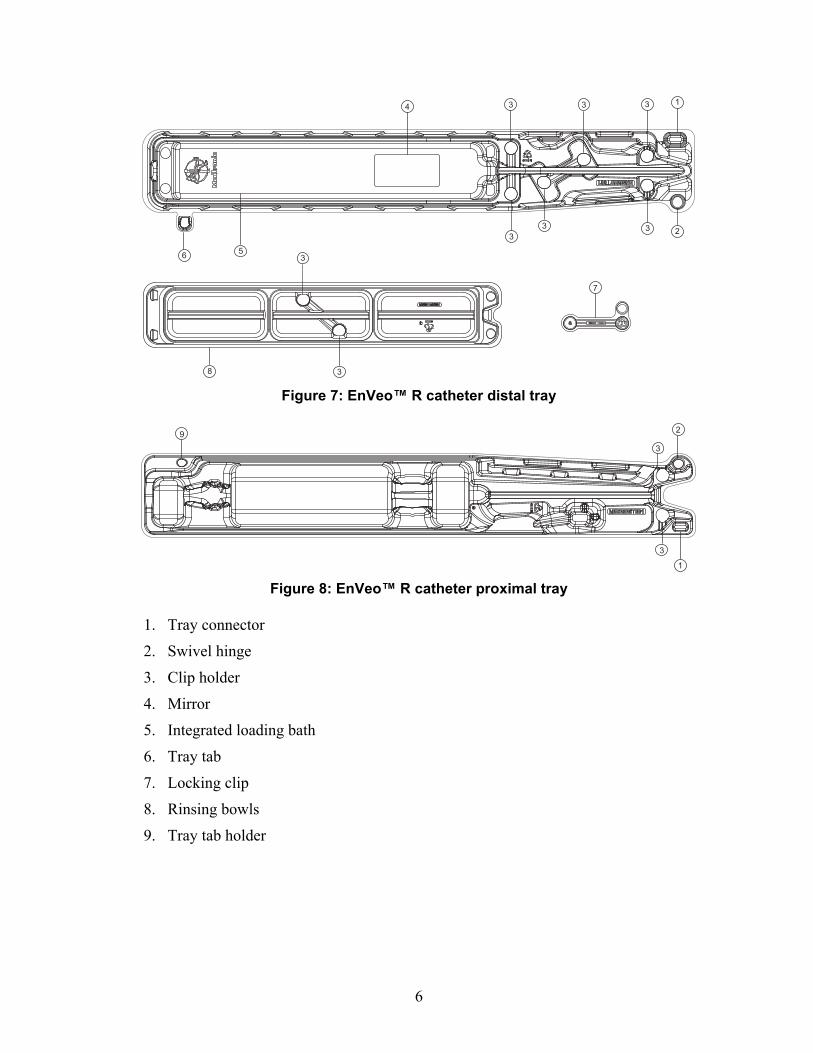
6
Figure 7: EnVeo™ R catheter distal tray
Figure 8: EnVeo™ R catheter proximal tray
1. Tray connector
2. Swivel hinge
3. Clip holder
4. Mirror
5. Integrated loading bath
6. Tray tab
7. Locking clip
8. Rinsing bowls
9. Tray tab holder
3
3
2
1
7
33
356
8
3 334
9
3
1
3
2
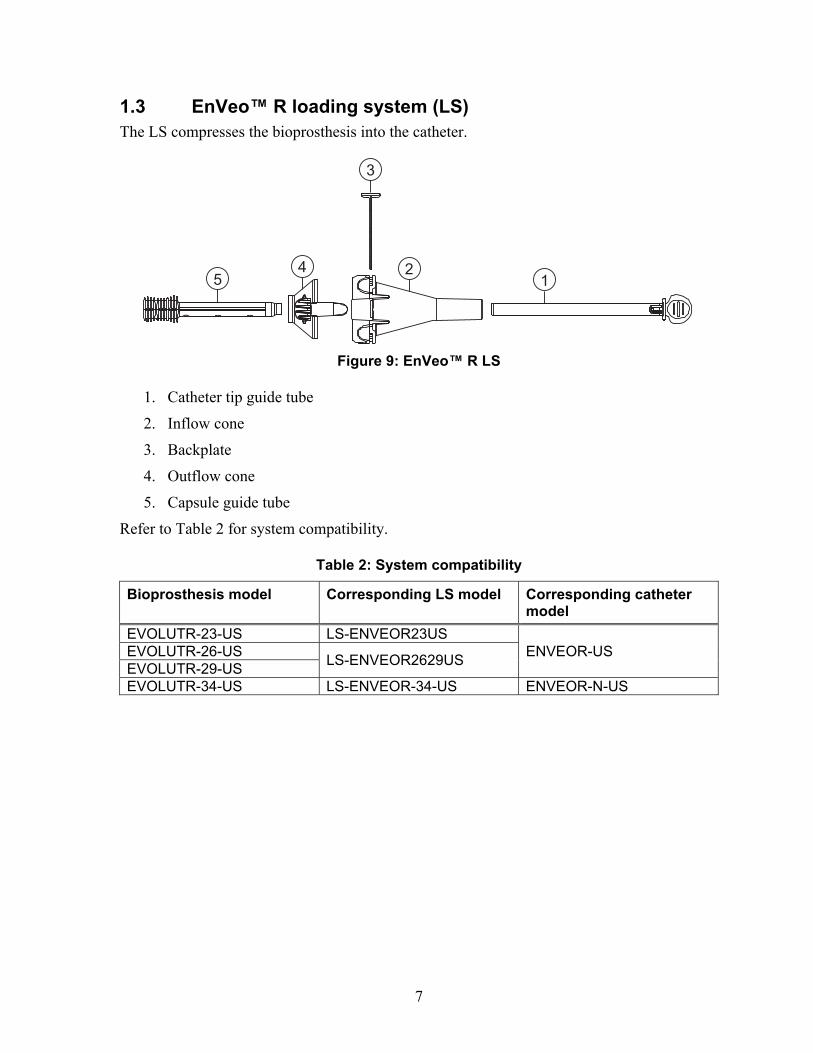
7
1.3 EnVeo™ R loading system (LS) The LS compresses the bioprosthesis into the catheter.
Figure 9: EnVeo™ R LS
1. Catheter tip guide tube
2. Inflow cone
3. Backplate
4. Outflow cone
5. Capsule guide tube
Refer to Table 2 for system compatibility.
Table 2: System compatibility
Bioprosthesis model Corresponding LS model Corresponding catheter model
EVOLUTR-23-US LS-ENVEOR23US ENVEOR-US EVOLUTR-26-US
LS-ENVEOR2629US EVOLUTR-29-US EVOLUTR-34-US LS-ENVEOR-34-US ENVEOR-N-US
12
3
45
8
2.0 Indications
The Medtronic CoreValve™ Evolut™ R system is indicated for relief of aortic stenosis in patients with symptomatic heart disease due to severe native calcific aortic stenosis who are judged by a heart team, including a cardiac surgeon, to be at intermediate or greater risk for open surgical therapy (i.e., predicted risk of surgical mortality ≥ 3% at 30 days, based on the Society of Thoracic Surgeons (STS) risk score and other clinical comorbidities unmeasured by the STS risk calculator).
The Medtronic CoreValve™ Evolut™ R system is indicated for use in patients with symptomatic heart disease due to failure (stenosed, insufficient, or combined) of a surgical bioprosthetic aortic valve who are judged by a heart team, including a cardiac surgeon, to be at high or greater risk for open surgical therapy (i.e., STS predicted risk of operative mortality score ≥8% or at a ≥15% risk of mortality at 30 days).
9
3.0 Contraindications
The CoreValve™ Evolut™ R system is contraindicated for patients presenting with any of the following conditions:
Known hypersensitivity or contraindication to aspirin, heparin (HIT/HITTS) and bivalirudin, ticlopidine, clopidogrel, Nitinol (Titanium or Nickel), or sensitivity to contrast media, which cannot be adequately premedicated
Ongoing sepsis, including active endocarditis
Preexisting mechanical heart valve in aortic position
10
4.0 Warnings and precautions
Carefully read all warnings, precautions, and instructions for use for all components of the system before use. Failure to read and follow all instructions or failure to observe all stated warnings could cause serious injury or death to the patient.
4.1 Warnings
General
Implantation of the Medtronic CoreValve™ Evolut™ R system should be performed only by physicians who have received Medtronic CoreValve™ Evolut™ R training.
The transcatheter aortic valve is to be used only in conjunction with the delivery catheter system and the loading system.
This procedure should only be performed where emergency aortic valve surgery can be performed promptly.
Do not use any of the Medtronic CoreValve™ Evolut™ R system components if any of the following has occurred:
It has been dropped, damaged, or mishandled in any way
The Use By date has elapsed
Mechanical failure of the delivery catheter system and/or accessories may result in patient complications.
Transcatheter aortic valve (bioprosthesis)
Do not use the bioprosthesis if any of the following conditions is observed:
There is any damage to the container (for example, cracked jar or lid, leakage, broken or missing seals)
The serial number tag does not match the container label
The freeze indicator in the secondary package has activated
The storage solution does not completely cover the bioprosthesis
Accelerated deterioration of the bioprosthesis may occur in patients presenting with an altered calcium metabolism.
4.2 Precautions
General
Do not contact any of the Medtronic CoreValve™ Evolut™ R system components with cotton or cotton swabs.
Do not expose any of the Medtronic CoreValve™ Evolut™ R system components to organic solvents, such as alcohol.
11
Do not introduce air into the catheter.
Do not expose the bioprosthesis to solutions other than the storage and rinse solutions.
Do not add antibiotics or any other substance to either the storage or rinse solutions. Do not apply antibiotics or any other substance to the bioprosthesis.
Do not allow the bioprosthesis to dry. Maintain tissue moisture with irrigation or immersion.
Do not attempt to repair a damaged bioprosthesis.
Do not handle or use forceps to manipulate the bioprosthesis leaflet tissue.
Do not deform the bioprosthesis in excess of what is experienced during crimping, loading, and implantation.
The safety and effectiveness of the Medtronic CoreValve™ Evolut™ R system have not been evaluated in the pediatric population.
The safety and effectiveness of the bioprosthesis for aortic valve replacement have not been evaluated in the following patient populations:
Patients who do not meet the criteria for symptomatic severe native aortic stenosis as defined below:
Symptomatic severe high-gradient aortic stenosis: aortic valve area ≤1.0 cm2 or aortic valve area index ≤0.6 cm2/m2, a mean aortic valve gradient ≥40 mmHg, or a peak aortic-jet velocity ≥4.0 m/s
Symptomatic severe low-flow/low-gradient aortic stenosis: aortic valve area ≤1.0 cm2 or aortic valve area index ≤0.6 cm2/m2; a mean aortic valve gradient <40 mmHg; and a peak aortic-jet velocity <4.0 m/s
Who are at low surgical risk (predicted perioperative mortality risk of <3%)
With untreated, clinically significant coronary artery disease requiring revascularization
With a preexisting prosthetic heart valve with a rigid support structure in either the mitral or pulmonic position if either the preexisting prosthetic heart valve could affect the implantation or function of the bioprosthesis or the implantation of the bioprosthesis could affect the function of the preexisting prosthetic heart valve
With cardiogenic shock manifested by low cardiac output, vasopressor dependence, or mechanical hemodynamic support
The safety and effectiveness of a CoreValve™ Evolut™ R bioprosthesis implanted within a failed preexisting transcatheter bioprosthesis have not been demonstrated.
Implanting a CoreValve™ Evolut™ R bioprosthesis in a degenerated surgical bioprosthesis (transcatheter aortic valve in surgical aortic valve [TAV in SAV]) should be avoided in the following conditions. The degenerated surgical bioprosthesis presents with a:
12
Significant concomitant paravalvular leak (between the prosthesis and the native annulus), is not securely fixed in the native annulus, or is not structurally intact (for example, wireform frame fracture)
Partially detached leaflet that in the aortic position may obstruct a coronary ostium
Stent frame with a manufacturer’s labeled inner diameter <17 mm
The safety and effectiveness of the bioprosthesis for aortic valve replacement have not been evaluated in patient populations presenting with the following:
Blood dyscrasias as defined: leukopenia (WBC <1000 cells/mm3), thrombocytopenia (platelet count <50,000 cells/mm3), history of bleeding diathesis or coagulopathy, or hypercoagulable states
Congenital bicuspid or unicuspid valve
Mixed native aortic valve disease (aortic stenosis and aortic regurgitation with predominant aortic regurgitation [3–4+])
Moderate to severe (3–4+) or severe (4+) mitral or severe (4+) tricuspid regurgitation
Hypertrophic obstructive cardiomyopathy
New or untreated echocardiographic evidence of intracardiac mass, thrombus, or vegetation
Native aortic annulus size <18 mm or >30 mm per the baseline diagnostic imaging or surgical bioprosthetic aortic annulus size <17 mm or >30 mm
Transarterial access not able to accommodate an 18 Fr introducer sheath or the 14 Fr equivalent EnVeo™ R InLine sheath when using Model ENVEOR-US or transarterial access not able to accommodate a 20 Fr introducer sheath or the 16 Fr equivalent EnVeo™ R InLine sheath when using Model ENVEOR-N-US
Sinus of valsalva anatomy that would prevent adequate coronary perfusion
Moderate to severe mitral stenosis
Severe ventricular dysfunction with left ventricular ejection fraction (LVEF) <20%
Symptomatic carotid or vertebral artery disease
Severe basal septal hypertrophy with an outflow gradient
Prior to use
The bioprosthesis size must be appropriate to fit the patient’s anatomy. Proper sizing of the device is the responsibility of the physician. Refer to Table 1 for available sizes. Failure to implant a device within the sizing matrix could lead to adverse effects such as those listed in Section 5.0.
13
Patients must present with transarterial access vessels with diameters that are either ≥5 mm when using Model ENVEOR-US or ≥5.5 mm when using Model ENVEOR-N-US, or patients must present with an ascending aortic (direct aortic) access site ≥60 mm from the basal plane.
Implantation of the bioprosthesis should be avoided in patients with aortic root angulation (angle between plane of aortic valve annulus and horizontal plane/vertebrae) of >30° for right subclavian/axillary access or >70° for femoral and left subclavian/axillary access.
Use caution when using the subclavian/axillary approach in patients with a patent Left Internal Mammary Artery (LIMA) graft (for left subclavian/axillary approach only) or patent Right Internal Mammary Artery (RIMA) graft (for right subclavian/axillary approach only).
For direct aortic access, ensure the access site and trajectory are free of patent RIMA or a preexisting patent RIMA graft.
For transfemoral access, use caution in patients who present with multiplanar curvature of the aorta, acute angulation of the aortic arch, an ascending aortic aneurysm, or severe calcification in the aorta and/or vasculature. If ≥2 of these factors are present, consider an alternative access route to prevent vascular complications.
Exposure to glutaraldehyde may cause irritation of the skin, eyes, nose, and throat. Avoid prolonged or repeated exposure to the vapors. Use only with adequate ventilation. If skin contact occurs, immediately flush the affected area with water (minimum of 15 minutes). In the event of eye contact, flush with water for a minimum of 15 minutes and seek medical attention immediately.
The bioprosthesis and the glutaraldehyde storage solution are sterile. The outside of the bioprosthesis container is nonsterile and must not be placed in the sterile field.
Damage may result from forceful handling of the catheter. Prevent kinking of the catheter when removing it from the packaging.
This device was designed for single patient use only. Do not reuse, reprocess, or resterilize this product. Reuse, reprocessing, or resterilization may compromise the structural integrity of the device and/or create a risk of contamination of the device, which could result in patient injury, illness, or death.
Before catheter insertion, remove the loading stylet.
During use
For direct aortic and subclavian access procedures, care must be exercised when using the tip-retrieval mechanism to ensure adequate clearance to avoid advancement of the catheter tip through the bioprosthesis leaflets during device closure.
For direct aortic access procedures, use a separate introducer sheath; do not use the EnVeo R InLine™ sheath. Maintain the EnVeo R InLine™ sheath at the proximal end of the catheter throughout the procedure.
Adequate rinsing of the bioprosthesis with sterile saline, as described in the Instructions for Use, is mandatory before implantation. No other solutions, drugs, chemicals, or
14
antibiotics should ever be added to the glutaraldehyde or rinse solutions, as irreparable damage to the leaflet tissue, which may not be apparent under visual inspection, may result.
During rinsing, do not touch the leaflets or squeeze the bioprosthesis.
If a misload is detected, unsheath the bioprosthesis and examine the bioprosthesis for damage (for example, permanent frame deformation, frayed sutures, or valve damage). Do not attempt to reload a damaged bioprosthesis; if no issues are found, a second attempt may be made to load an undamaged bioprosthesis. However, the catheter, LS, loading tray, and saline must be replaced with new sterile components. Do not load the bioprosthesis onto the catheter more than 2 times or after it has been inserted into a patient.
Prevent contamination of the bioprosthesis, its storage solution, the catheter, and the LS with glove powder.
If a bioprosthesis and catheter have been removed from a patient, dispose of both the bioprosthesis and catheter; do not attempt to reuse either component. Both the bioprosthesis and catheter must be replaced with new sterile components.
While the catheter is in the patient, ensure the guidewire is extending from the proximal end of the catheter. Do not remove the guidewire from the catheter while the catheter is inserted in the patient.
There will be some resistance when the catheter is advanced through the vasculature. If there is a significant increase in resistance, stop advancement and investigate the cause of the resistance (for example, magnify the area of resistance) before proceeding. Do not force passage. Forcing passage could increase the risk of vascular complications (for example, vessel dissection or rupture).
Use the deployment knob to deploy and recapture the bioprosthesis. Do not use the trigger for deploying or recapturing because it could cause inaccurate placement of the bioprosthesis.
If the radiopaque capsule marker band has not yet reached the distal end of the radiopaque paddle attachment, the bioprosthesis can be recaptured or repositioned. During deployment, the deployment knob provides a tactile indication as a notification before the point of no recapture.
Once the radiopaque capsule marker band reaches the distal end of the radiopaque paddle attachment (point of no recapture), retrieval of the bioprosthesis from the patient (for example, use of the catheter) is not recommended. Retrieval after the point of no recapture may cause mechanical failure of the delivery catheter system, aortic root damage, coronary artery damage, myocardial damage, vascular complications, prosthetic valve dysfunction (including device malposition), embolization, stroke, and/or emergent surgery.
During deployment, the bioprosthesis can be advanced or withdrawn as long as annular contact has not been made. Once annular contact is made, the bioprosthesis cannot be advanced in the retrograde direction; recapture until the bioprosthesis is free from annular
15
contact, and then reposition in the retrograde direction. If necessary, and the radiopaque capsule marker band has not yet reached the distal end of the radiopaque paddle attachment, the bioprosthesis can be withdrawn (repositioned) in the antegrade direction. However, use caution when moving the bioprosthesis in the antegrade direction.
Caution: Use the handle of the delivery system to reposition the bioprosthesis. Do not use the outer catheter sheath.
Once deployment is complete, repositioning of the bioprosthesis (for example, use of a snare and/or forceps) is not recommended. Repositioning of a deployed valve may cause aortic root damage, coronary artery damage, myocardial damage, vascular complications, prosthetic valve dysfunction (including device malposition), embolization, stroke, and/or emergent surgery.
Do not attempt to retrieve or to recapture a bioprosthesis if any one of the outflow struts is protruding from the capsule. If any one of the outflow struts has deployed from the capsule, the bioprosthesis must be released from the catheter before the catheter can be withdrawn.
Ensure the capsule is closed before catheter removal.
When using a separate introducer sheath, if increased resistance is encountered when removing the catheter through the introducer sheath, do not force passage. Increased resistance may indicate a problem and forced passage may result in damage to the device and/or harm to the patient. If the cause of resistance cannot be determined or corrected, remove the catheter and introducer sheath as a single unit over the guidewire, and inspect the catheter and confirm that it is complete.
Clinical long-term durability has not been established for the bioprosthesis. Evaluate bioprosthesis performance as needed during patient follow-up.
Postprocedure, administer appropriate antibiotic prophylaxis as needed for patients at risk for prosthetic valve infection and endocarditis.
Postprocedure, administer anticoagulation and/or antiplatelet therapy per physician/clinical judgment.
Excessive contrast media may cause renal failure. Preprocedure, measure the patient’s creatinine level. During the procedure, monitor contrast media usage.
Conduct the procedure under fluoroscopy. Fluoroscopic procedures are associated with the risk of radiation damage to the skin, which may be painful, disfiguring, and long-term.
The safety and efficacy of a CoreValve™ Evolut™ R bioprosthesis implanted within a transcatheter bioprosthesis have not been demonstrated. However, in the event that a CoreValve™ Evolut™ R bioprosthesis must be implanted within a transcatheter bioprosthesis to improve valve function, valve size and patient anatomy must be considered before implantation of the CoreValve™ Evolut™ R bioprosthesis to ensure patient safety (for example, to avoid coronary obstruction).
In the event that valve function or sealing is impaired due to excessive calcification or incomplete expansion, a postimplant balloon dilatation of the bioprosthesis may improve
16
valve function and sealing. To ensure patient safety, valve size and patient anatomy must be considered when selecting the size of the balloon used for dilatation. The balloon size chosen for dilatation should not exceed the diameter of the native aortic annulus or, for surgical bioprosthetic valves, the manufacturer’s labeled inner diameter. Refer to the specific balloon catheter manufacturer’s compliance chart to ensure that the applied inflation pressure does not result in a balloon diameter that exceeds the indicated annulus range for the bioprosthesis. Refer to the specific balloon catheter manufacturer’s labeling for proper instruction on the use of balloon catheter devices. Note: Bench testing has only been conducted to confirm compatibility with NuMED Z-MED™ and Z-MED II™ Balloon Aortic Valvuloplasty catheters where CoreValve™ Evolut™ R bioprosthesis device performance was maintained after dilatation. Data on file.
4.3 Magnetic resonance imaging (MRI) MRI may be used on the bioprosthesis only under specific conditions. See Section 6.2: MRI Safety Information for more information.
17
5.0 Potential adverse events
Potential risks associated with the implantation of the CoreValve™ Evolut™ R bioprosthesis may include, but are not limited to, the following:
Death
Myocardial infarction, cardiac arrest, cardiogenic shock, cardiac tamponade
Coronary occlusion, obstruction, or vessel spasm (including acute coronary closure)
Cardiovascular injury (including rupture, perforation, tissue erosion, or dissection of vessels, ascending aorta trauma, ventricle, myocardium, or valvular structures that may require intervention)
Emergent surgical or transcatheter intervention (for example, coronary artery bypass, heart valve replacement, valve explant, percutaneous coronary intervention [PCI], balloon valvuloplasty)
Prosthetic valve dysfunction (regurgitation or stenosis) due to fracture; bending (out-of-round configuration) of the valve frame; underexpansion of the valve frame; calcification; pannus; leaflet wear, tear, prolapse, or retraction; poor valve coaptation; suture breaks or disruption; leaks; mal-sizing (prosthesis-patient mismatch); malposition (either too high or too low)/malplacement
Prosthetic valve migration/embolization
Prosthetic valve endocarditis
Prosthetic valve thrombosis
Delivery catheter system malfunction resulting in the need for additional re-crossing of the aortic valve and prolonged procedural time
Delivery catheter system component migration/embolization
Stroke (ischemic or hemorrhagic), transient ischemic attack (TIA), or other neurological deficits
Individual organ (for example, cardiac, respiratory, renal [including acute kidney failure]) or multi-organ insufficiency or failure
Major or minor bleeding that may require transfusion or intervention (including life-threatening or disabling bleeding)
Vascular access-related complications (for example, dissection, perforation, pain, bleeding, hematoma, pseudoaneurysm, irreversible nerve injury, compartment syndrome, arteriovenous fistula, stenosis)
Mitral valve regurgitation or injury
Conduction system disturbances (for example, atrioventricular node block, left-bundle branch block, asystole), which may require a permanent pacemaker
Infection (including septicemia)
18
Hypotension or hypertension
Hemolysis
Peripheral ischemia
Bowel ischemia
Abnormal lab values (including electrolyte imbalance)
Allergic reaction to antiplatelet agents, contrast medium, or anesthesia
Exposure to radiation through fluoroscopy and angiography
Permanent disability
19
6.0 Patient information
6.1 Registration information A patient registration form is included in each bioprosthesis package. After implantation, please complete all requested information. The serial number is located on both the package and the identification tag attached to the bioprosthesis. Return the original form to the Medtronic address indicated on the form and provide the temporary identification card to the patient prior to discharge.
Medtronic will provide an Implanted Device Identification Card to the patient. The card contains the name and telephone number of the patient’s physician as well as information that medical personnel would require in the event of an emergency. Patients should be encouraged to carry this card with them at all times.
6.2 MRI safety information Nonclinical testing and modeling have demonstrated that the Medtronic CoreValve™ Evolut™ R bioprosthesis is MR Conditional. A patient with this device can be safely scanned in an MR system meeting the following conditions:
Static magnetic field of 1.5 T and 3.0 T
Maximum spatial field gradient of 2500 gauss/cm (25 T/m)
Maximum MR system reported, whole body averaged specific absorption rate (SAR) of 2.0 W/kg (Normal Operating Mode)
Based on nonclinical testing and modeling, under the scan conditions defined above, the Medtronic CoreValve™ Evolut™ R bioprosthesis is expected to produce a maximum in vivo temperature rise of less than 4.0°C after 15 minutes of continuous scanning. Based on nonclinical data, the image artifact caused by the device will extend no greater than 7 mm from the Medtronic CoreValve™ Evolut™ R bioprosthesis when imaged with a gradient echo pulse sequence and a 3.0 T MRI system.
Scanning under the conditions defined above may be performed immediately after implantation.
The presence of other implants or medical circumstances of the patient may require lower limits on some or all of the above parameters. For deployment of a Medtronic CoreValve™ Evolut™ R bioprosthesis inside of a failed surgical bioprosthetic valve, consult the MRI labeling pertaining to the failed valve for additional artifact information.

20
7.0 How supplied
7.1 Packaging The bioprosthesis is supplied sterile and nonpyrogenic in a glass container and a screw cap with a liner. The outside of the container is nonsterile and must not be placed in the sterile field. A freeze indicator is placed inside the labeled carton. If the freeze indicator has been activated, do not use the bioprosthesis.
The catheter is packaged in a single-pouch configuration and sterilized with ethylene oxide gas. The catheter is sterile if the package is undamaged and unopened. The outer surfaces of the pouch are nonsterile and must not be placed in the sterile field.
The LS is packaged in a double-pouch configuration. The LS is sterile if the pouches are undamaged and unopened. The outer surfaces of the outer pouch are nonsterile and must not be placed in the sterile field. The LS is sterilized with ethylene oxide gas.
7.2 Storage Store the bioprosthesis at room temperature. Avoid exposing to extreme fluctuations of temperature. Avoid freezing. Appropriate inventory control should be maintained so that bioprostheses with earlier Use By dates are implanted preferentially.
Store the catheter and LS in a cool, dry environment.
21
8.0 Additional Equipment
Note: While extensive, this equipment list is not meant to cover all possible scenarios.
Transesophogeal echocardiogram (TEE) or transthoracic echocardiography (TTE) on standby
Temporary pacer insertion
Temporary pacemaker lead
Sterile sleeve for pacemaker lead
Hemostatic vessel introducer sheath
Temporary pacemaker generator
Sterile temporary pacemaker-to-generator cable
If indicated, pulmonary artery catheter insertion
Standard pulmonary artery catheter
Hemostatic vessel introducer sheath
Saline flush line connected to pressure transducer
Baseline aortography via radial, brachial, or femoral approach
5 Fr or 6 Fr pigtail angiographic catheter
6 Fr hemostatic vessel introducer sheath
2-port manifold with saline flush line and pressure tubing or transducer
Power injector syringe
Contrast media
High-pressure power injector tubing
Predilatation of implant site
2-port manifold with saline flush and transducer
9 Fr hemostatic vessel introducer sheath and a 14 Fr, 16 Fr, 18 Fr, or 20 Fr hemostatic vessel introducer sheath
Note: Catheter Model ENVEOR-US is compatible with an 18 Fr introducer sheath. Catheter Model ENVEOR-N-US is compatible with a 20 Fr introducer sheath.
Standard length 0.035 in (0.889 mm) straight guidewire
Appropriate suture-mediated closure system, if applicable
Angiographic catheter
22
0.035 in (0.889 mm) × 260 cm standard high support guidewire to be shaped with a pigtail loop
Balloon valvuloplasty catheters, ≤4 cm length × 18 mm, 20 mm, 22 mm or 23 mm, 25 mm, 28 mm, and 30 mm diameters
Inflation device or syringe and diluted 1:5 contrast media
Bioprosthesis implantation
18 Fr or 20 Fr hemostatic vessel introducer sheath
Note: Catheter Model ENVEOR-US is compatible with an 18 Fr introducer sheath. Catheter Model ENVEOR-N-US is compatible with a 20 Fr introducer sheath.
Note: A separate introducer sheath is optional for transfemoral and subclavian access procedures.
Standby supplies (must be available in the room)
Pericardiocentesis tray
35 mm × 120 cm single loop snare
Standard percutaneous coronary intervention (PCI) equipment
14 Fr and 16 Fr hemostatic vessel introducer sheaths
Standard cardiac catheterization lab equipment
Intra-aortic balloon pump (IABP)
23
9.0 Instructions for use
9.1 Inspection and bioprosthesis loading procedure Caution: Once the bioprosthesis is removed from its container and the catheter and LS are removed from their packaging, ensure all subsequent procedures are performed in a sterile field.
Inspection prior to use and swivel tray setup
1. Before removing the bioprosthesis, catheter, or LS from its primary packaging, carefully inspect the packaging for any evidence of damage that could compromise the sterility or integrity of the device (for example, cracked jar or lid, leakage, broken or missing seals, torn or punctured pouch).
Caution: Do not use after the Use By date or if there is evidence of damage.
Caution: Do not use the bioprosthesis if the freeze indicator has been activated.
2. Remove the product from the protective package.
3. Visually check that the product is free of defects. Do not use if any defects are noted.
4. Remove the locking clip attached to the rinsing bowls.
5. Remove the rinsing bowls from the integrated loading bath.
6. Remove the locking clips that connect the distal and proximal trays.
7. Lift the tray connector from the distal tray, and swivel the distal tray 180° counterclockwise.
8. Clip the tray tab on the distal tray to the tray tab holder on the proximal tray.
9. Fill the integrated loading bath with cold, sterile saline (0°C to 8°C [32°F to 46°F]).
Preparation of the catheter and LS
1. Attach a 10 mL syringe filled with sterile saline to the capsule flush port on the proximal end of the handle.
2. Carefully lift the distal end of the catheter to a near vertical orientation. To prevent kinking, do not bend the catheter severely.
3. Open the capsule and expose the paddle attachment.
Note: Use the deployment knob to open the capsule completely until the paddle attachment is fully exposed.
4. With the capsule held vertically, flush the capsule flush port. Verify that no catheter leakage is observed during any of the flushing steps. If leakage is observed, use a new system.
5. Submerge the capsule completely in the cold saline bath while flushing the capsule flush port. Continue flushing the capsule until it is completely submerged in the bath to prevent air from entering the catheter (Figure 10).
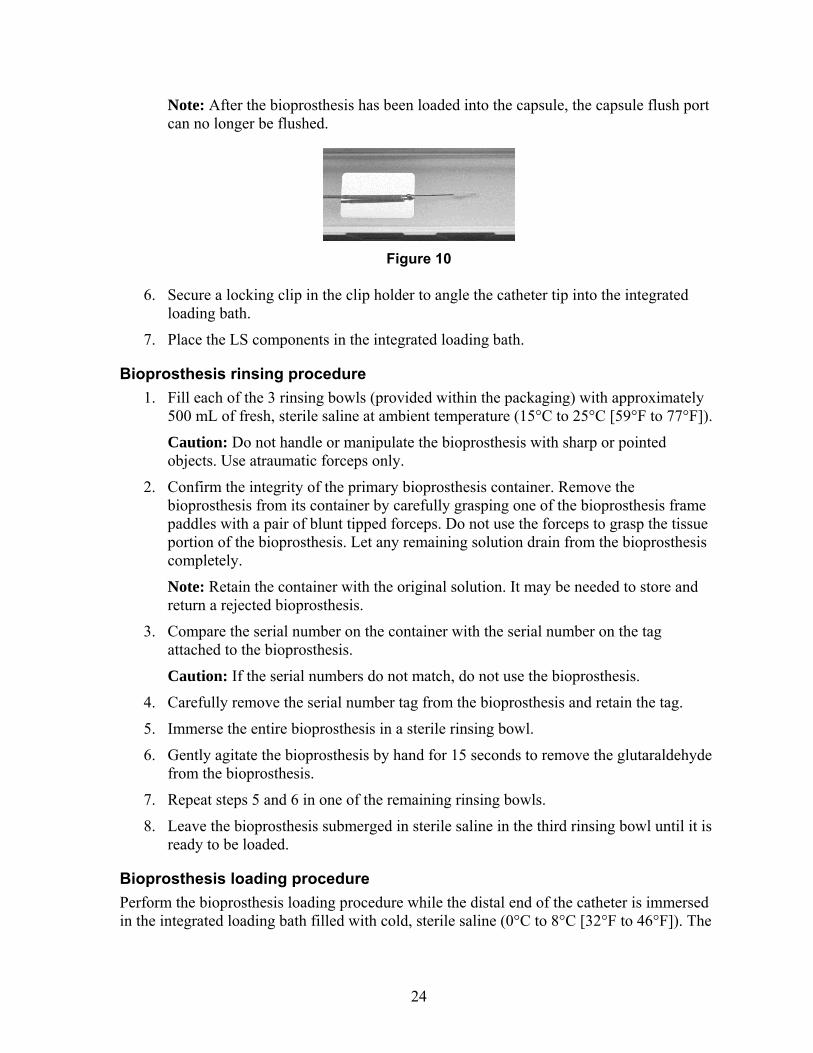
24
Note: After the bioprosthesis has been loaded into the capsule, the capsule flush port can no longer be flushed.
Figure 10
6. Secure a locking clip in the clip holder to angle the catheter tip into the integrated loading bath.
7. Place the LS components in the integrated loading bath.
Bioprosthesis rinsing procedure
1. Fill each of the 3 rinsing bowls (provided within the packaging) with approximately 500 mL of fresh, sterile saline at ambient temperature (15°C to 25°C [59°F to 77°F]).
Caution: Do not handle or manipulate the bioprosthesis with sharp or pointed objects. Use atraumatic forceps only.
2. Confirm the integrity of the primary bioprosthesis container. Remove the bioprosthesis from its container by carefully grasping one of the bioprosthesis frame paddles with a pair of blunt tipped forceps. Do not use the forceps to grasp the tissue portion of the bioprosthesis. Let any remaining solution drain from the bioprosthesis completely.
Note: Retain the container with the original solution. It may be needed to store and return a rejected bioprosthesis.
3. Compare the serial number on the container with the serial number on the tag attached to the bioprosthesis.
Caution: If the serial numbers do not match, do not use the bioprosthesis.
4. Carefully remove the serial number tag from the bioprosthesis and retain the tag.
5. Immerse the entire bioprosthesis in a sterile rinsing bowl.
6. Gently agitate the bioprosthesis by hand for 15 seconds to remove the glutaraldehyde from the bioprosthesis.
7. Repeat steps 5 and 6 in one of the remaining rinsing bowls.
8. Leave the bioprosthesis submerged in sterile saline in the third rinsing bowl until it is ready to be loaded.
Bioprosthesis loading procedure
Perform the bioprosthesis loading procedure while the distal end of the catheter is immersed in the integrated loading bath filled with cold, sterile saline (0°C to 8°C [32°F to 46°F]). The
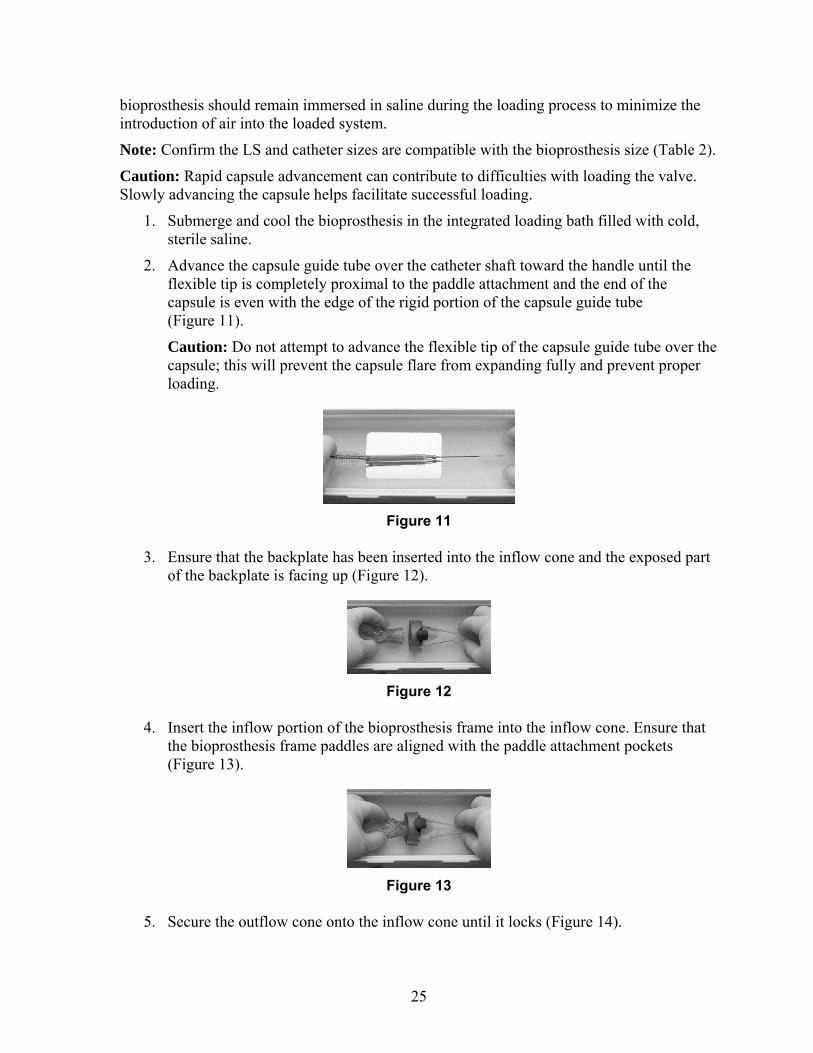
25
bioprosthesis should remain immersed in saline during the loading process to minimize the introduction of air into the loaded system.
Note: Confirm the LS and catheter sizes are compatible with the bioprosthesis size (Table 2).
Caution: Rapid capsule advancement can contribute to difficulties with loading the valve. Slowly advancing the capsule helps facilitate successful loading.
1. Submerge and cool the bioprosthesis in the integrated loading bath filled with cold, sterile saline.
2. Advance the capsule guide tube over the catheter shaft toward the handle until the flexible tip is completely proximal to the paddle attachment and the end of the capsule is even with the edge of the rigid portion of the capsule guide tube (Figure 11).
Caution: Do not attempt to advance the flexible tip of the capsule guide tube over the capsule; this will prevent the capsule flare from expanding fully and prevent proper loading.
Figure 11
3. Ensure that the backplate has been inserted into the inflow cone and the exposed part of the backplate is facing up (Figure 12).
Figure 12
4. Insert the inflow portion of the bioprosthesis frame into the inflow cone. Ensure that the bioprosthesis frame paddles are aligned with the paddle attachment pockets (Figure 13).
Figure 13
5. Secure the outflow cone onto the inflow cone until it locks (Figure 14).
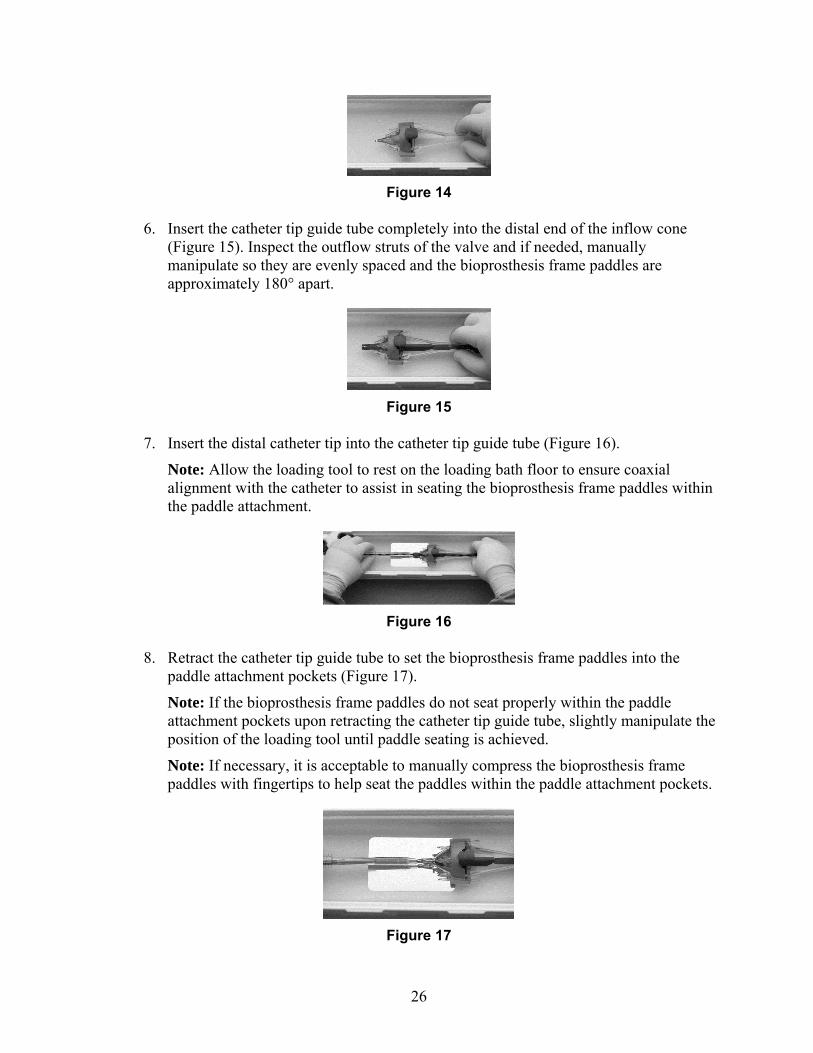
26
Figure 14
6. Insert the catheter tip guide tube completely into the distal end of the inflow cone (Figure 15). Inspect the outflow struts of the valve and if needed, manually manipulate so they are evenly spaced and the bioprosthesis frame paddles are approximately 180° apart.
Figure 15
7. Insert the distal catheter tip into the catheter tip guide tube (Figure 16).
Note: Allow the loading tool to rest on the loading bath floor to ensure coaxial alignment with the catheter to assist in seating the bioprosthesis frame paddles within the paddle attachment.
Figure 16
8. Retract the catheter tip guide tube to set the bioprosthesis frame paddles into the paddle attachment pockets (Figure 17).
Note: If the bioprosthesis frame paddles do not seat properly within the paddle attachment pockets upon retracting the catheter tip guide tube, slightly manipulate the position of the loading tool until paddle seating is achieved.
Note: If necessary, it is acceptable to manually compress the bioprosthesis frame paddles with fingertips to help seat the paddles within the paddle attachment pockets.
Figure 17
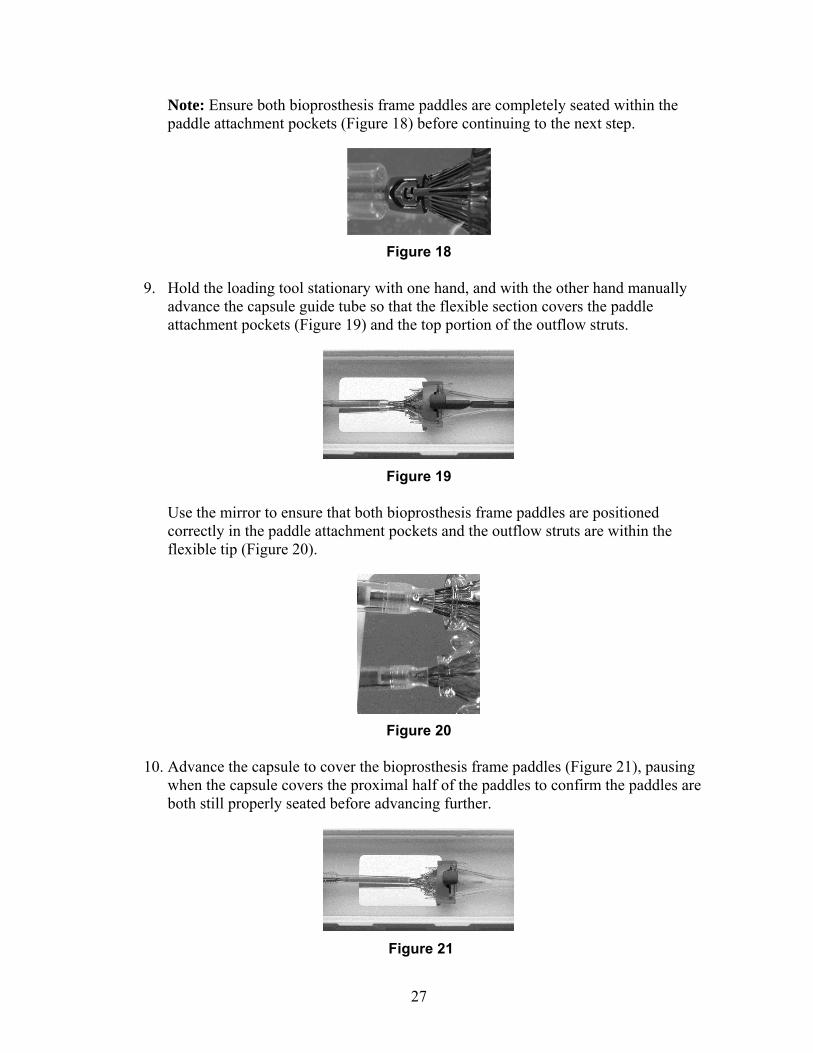
27
Note: Ensure both bioprosthesis frame paddles are completely seated within the paddle attachment pockets (Figure 18) before continuing to the next step.
Figure 18
9. Hold the loading tool stationary with one hand, and with the other hand manually advance the capsule guide tube so that the flexible section covers the paddle attachment pockets (Figure 19) and the top portion of the outflow struts.
Figure 19
Use the mirror to ensure that both bioprosthesis frame paddles are positioned correctly in the paddle attachment pockets and the outflow struts are within the flexible tip (Figure 20).
Figure 20
10. Advance the capsule to cover the bioprosthesis frame paddles (Figure 21), pausing when the capsule covers the proximal half of the paddles to confirm the paddles are both still properly seated before advancing further.
Figure 21
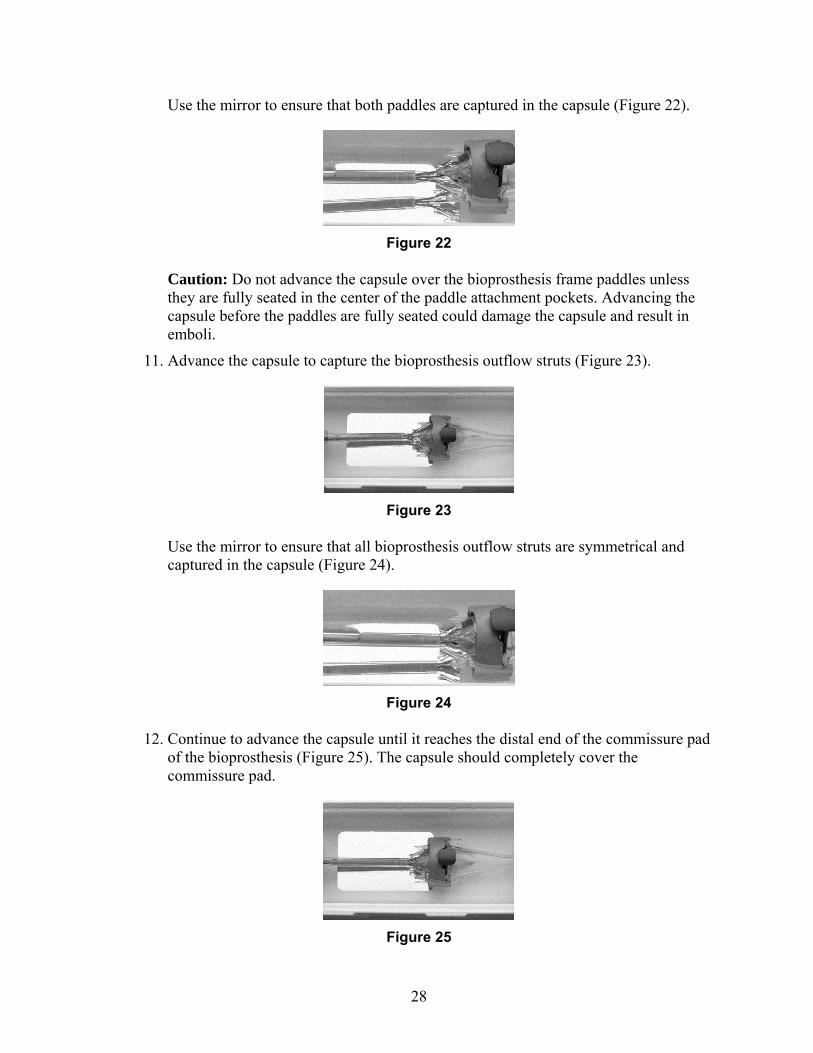
28
Use the mirror to ensure that both paddles are captured in the capsule (Figure 22).
Figure 22
Caution: Do not advance the capsule over the bioprosthesis frame paddles unless they are fully seated in the center of the paddle attachment pockets. Advancing the capsule before the paddles are fully seated could damage the capsule and result in emboli.
11. Advance the capsule to capture the bioprosthesis outflow struts (Figure 23).
Figure 23
Use the mirror to ensure that all bioprosthesis outflow struts are symmetrical and captured in the capsule (Figure 24).
Figure 24
12. Continue to advance the capsule until it reaches the distal end of the commissure pad of the bioprosthesis (Figure 25). The capsule should completely cover the commissure pad.
Figure 25
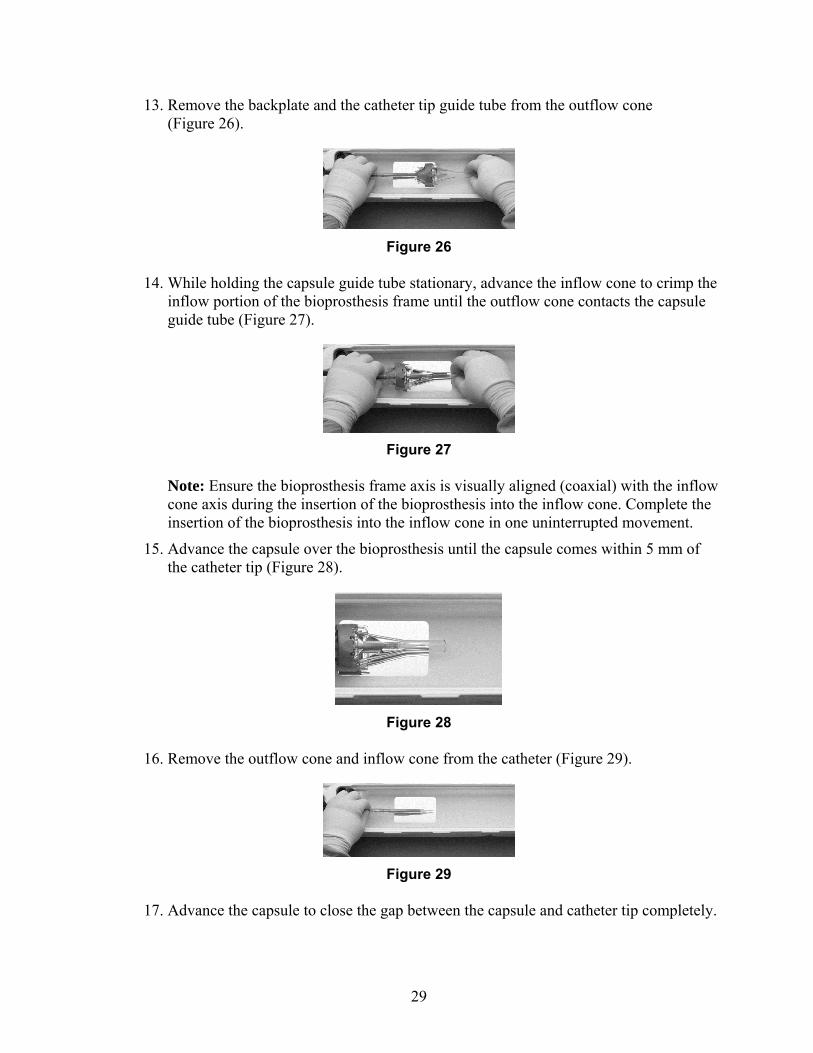
29
13. Remove the backplate and the catheter tip guide tube from the outflow cone (Figure 26).
Figure 26
14. While holding the capsule guide tube stationary, advance the inflow cone to crimp the inflow portion of the bioprosthesis frame until the outflow cone contacts the capsule guide tube (Figure 27).
Figure 27
Note: Ensure the bioprosthesis frame axis is visually aligned (coaxial) with the inflow cone axis during the insertion of the bioprosthesis into the inflow cone. Complete the insertion of the bioprosthesis into the inflow cone in one uninterrupted movement.
15. Advance the capsule over the bioprosthesis until the capsule comes within 5 mm of the catheter tip (Figure 28).
Figure 28
16. Remove the outflow cone and inflow cone from the catheter (Figure 29).
Figure 29
17. Advance the capsule to close the gap between the capsule and catheter tip completely.
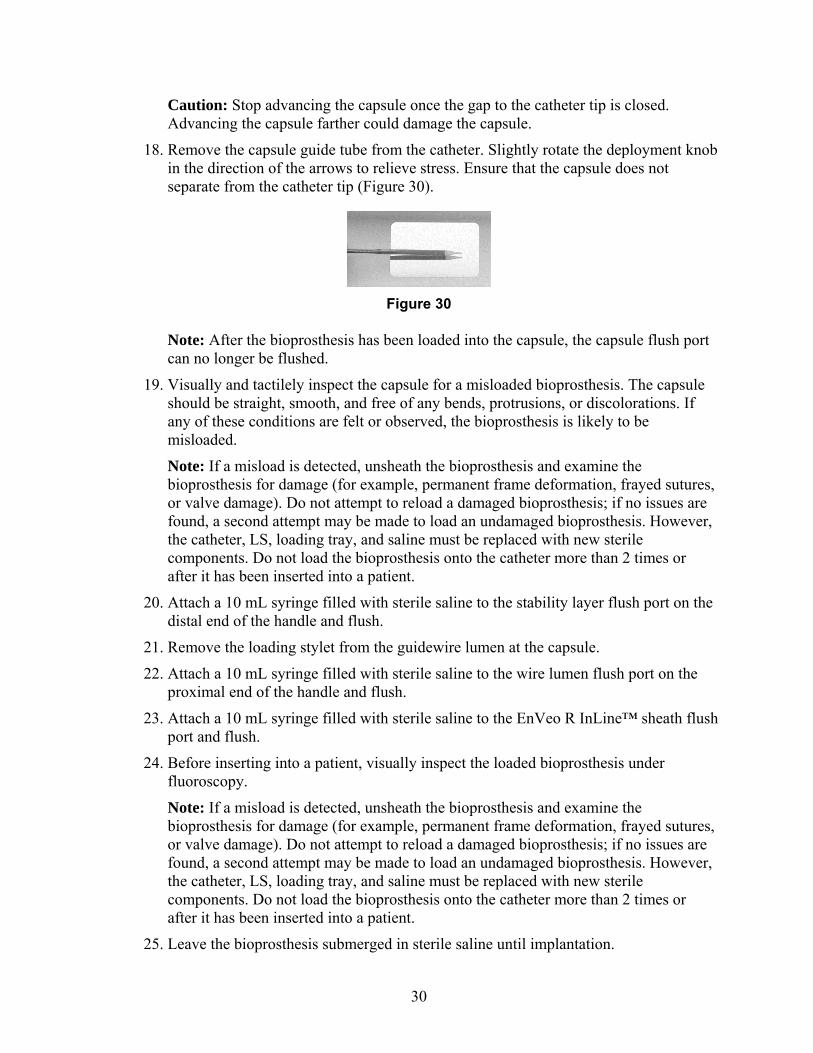
30
Caution: Stop advancing the capsule once the gap to the catheter tip is closed. Advancing the capsule farther could damage the capsule.
18. Remove the capsule guide tube from the catheter. Slightly rotate the deployment knob in the direction of the arrows to relieve stress. Ensure that the capsule does not separate from the catheter tip (Figure 30).
Figure 30
Note: After the bioprosthesis has been loaded into the capsule, the capsule flush port can no longer be flushed.
19. Visually and tactilely inspect the capsule for a misloaded bioprosthesis. The capsule should be straight, smooth, and free of any bends, protrusions, or discolorations. If any of these conditions are felt or observed, the bioprosthesis is likely to be misloaded.
Note: If a misload is detected, unsheath the bioprosthesis and examine the bioprosthesis for damage (for example, permanent frame deformation, frayed sutures, or valve damage). Do not attempt to reload a damaged bioprosthesis; if no issues are found, a second attempt may be made to load an undamaged bioprosthesis. However, the catheter, LS, loading tray, and saline must be replaced with new sterile components. Do not load the bioprosthesis onto the catheter more than 2 times or after it has been inserted into a patient.
20. Attach a 10 mL syringe filled with sterile saline to the stability layer flush port on the distal end of the handle and flush.
21. Remove the loading stylet from the guidewire lumen at the capsule.
22. Attach a 10 mL syringe filled with sterile saline to the wire lumen flush port on the proximal end of the handle and flush.
23. Attach a 10 mL syringe filled with sterile saline to the EnVeo R InLine™ sheath flush port and flush.
24. Before inserting into a patient, visually inspect the loaded bioprosthesis under fluoroscopy.
Note: If a misload is detected, unsheath the bioprosthesis and examine the bioprosthesis for damage (for example, permanent frame deformation, frayed sutures, or valve damage). Do not attempt to reload a damaged bioprosthesis; if no issues are found, a second attempt may be made to load an undamaged bioprosthesis. However, the catheter, LS, loading tray, and saline must be replaced with new sterile components. Do not load the bioprosthesis onto the catheter more than 2 times or after it has been inserted into a patient.
25. Leave the bioprosthesis submerged in sterile saline until implantation.

31
9.2 Bioprosthesis implantation Note: Use systemic anticoagulation during the implantation procedure based on physician/clinical judgment. If heparin is contraindicated, consider an alternative anticoagulant.
Vascular access
Note: Vascular access should be achieved per standard practice (either percutaneously or via surgical cutdown).
Note: The primary access artery will be used to introduce the CoreValve™ Evolut™ R device and, if predilatation is performed, the balloon catheter; the secondary access artery will be used to introduce the reference pigtail.
1. Establish a central venous line. Insert a temporary pacemaker lead via the right internal jugular vein (or other appropriate access vessel) per physician/clinical judgment.
2. Insert an introducer sheath into the secondary access artery.
3. Insert an introducer sheath into the primary access artery.
4. Administer anticoagulant according to physician/clinical judgment. If heparin is administered as an anticoagulant, check activated clotting time (ACT) and monitor every 30 minutes after initial bolus of heparin. Maintain ACT ≥250 seconds.
Note: Anticoagulant may be administered at any time prior to this point, but avoid delaying beyond this point.
Crossing the valve
5. Advance the graduated pigtail catheter to the ascending aorta and position the distal tip in the noncoronary cusp of the aortic valve.
6. Identify the ideal annular viewing plane using contrast injections at various angiographic angles.
Note: It is recommended that a dedicated individual prepare and operate the contrast injector.
7. Insert an angiographic catheter over a standard J-tip guidewire into the primary access sheath and advance to the ascending aorta.
8. Exchange the J-tip guidewire for a 0.035 in (0.889 mm) straight-tip guidewire. Advance the straight-tip guidewire across the aortic valve into the left ventricle (LV).
9. After crossing the aortic valve with the guidewire, advance the angiographic catheter into the LV.
10. Exchange the straight-tip guidewire for an exchange length J-tip guidewire.
11. Exchange the angiographic catheter for a 6 Fr pigtail catheter.
12. Remove the guidewire and connect the catheter to the transducer. Using both catheters, record the aortic pressure gradient.

32
13. Using a right anterior oblique (RAO) projection, advance the previously pigtail-shaped, 0.035 in (0.889 mm) high support guidewire through the pigtail catheter and position in the apex of the LV.
14. Remove the pigtail catheter while maintaining guidewire position in the LV.
Predilatation of the implant site
Note: The need for predilatation of the native valve is determined by the heart team.
Information for failed surgical bioprostheses: Balloon predilatation of a stenotic surgical aortic bioprosthesis has not been evaluated. In cases where there is severe stenosis, predilatation of the surgical aortic bioprosthesis may be done at the discretion of the heart team and the steps used are identical to native valve predilatation.
15. Insert the valvuloplasty balloon through the introducer sheath in the primary access artery and advance it to the ascending aorta.
16. Reposition the angiographic equipment to the ideal viewing plane. Position the valvuloplasty balloon across the valve, while maintaining strict fluoroscopic surveillance of the distal tip of the guidewire in the LV.
17. Perform balloon valvuloplasty per standard practice and remove the valvuloplasty balloon while maintaining guidewire position across the aortic valve.
Deployment
18. Insert the device over the 0.035 in (0.889 mm) guidewire. Insert the catheter tip and capsule through the access site, while maintaining the EnVeo R InLine™ sheath tip against the proximal end of the capsule. Then, insert the EnVeo R InLine™ sheath through the access site, maintaining contact with the capsule. Maintain strict fluoroscopic surveillance of the guidewire in the LV.
Note: Catheter Model ENVEOR-US is compatible with an 18 Fr introducer sheath. Catheter Model ENVEOR-N-US is compatible with a 20 Fr introducer sheath.
Note: For transfemoral and subclavian access procedures, a separate introducer sheath is optional. For direct aortic access procedures, use a separate introducer sheath; do not use the EnVeo R InLine™ sheath. Maintain the EnVeo R InLine™ sheath at the proximal end of the catheter throughout the procedure.
19. Under fluoroscopic guidance, advance the catheter over the guidewire to the aortic annulus. Do not rotate the catheter as it is advanced; rotating the handle does not rotate the capsule.
Caution: There will be some resistance when the catheter is advanced through the vasculature. If there is a significant increase in resistance, stop advancement and investigate the cause of the resistance (for example, magnify the area of resistance) before proceeding. Do not force passage. Forcing passage could increase the risk of vascular complications (for example, vessel dissection or rupture).
Caution: Persistent force on the catheter can cause the catheter to kink, which could increase the risk of vascular complications (for example, vessel dissection or rupture).
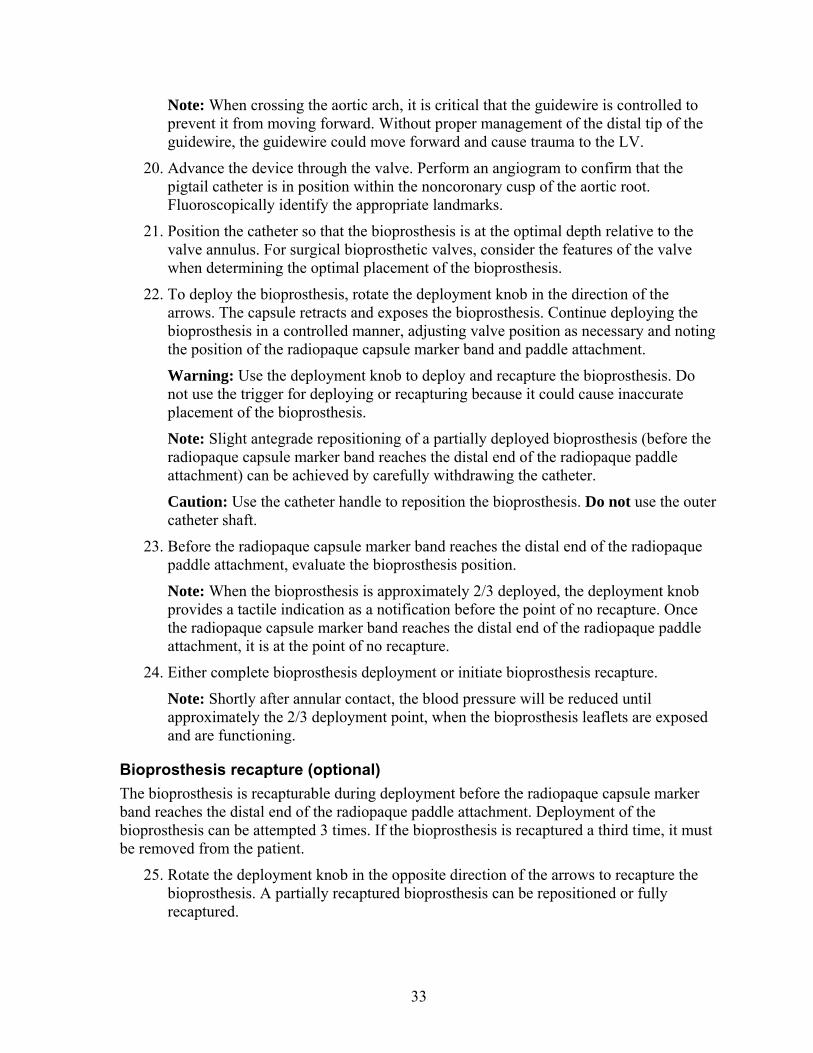
33
Note: When crossing the aortic arch, it is critical that the guidewire is controlled to prevent it from moving forward. Without proper management of the distal tip of the guidewire, the guidewire could move forward and cause trauma to the LV.
20. Advance the device through the valve. Perform an angiogram to confirm that the pigtail catheter is in position within the noncoronary cusp of the aortic root. Fluoroscopically identify the appropriate landmarks.
21. Position the catheter so that the bioprosthesis is at the optimal depth relative to the valve annulus. For surgical bioprosthetic valves, consider the features of the valve when determining the optimal placement of the bioprosthesis.
22. To deploy the bioprosthesis, rotate the deployment knob in the direction of the arrows. The capsule retracts and exposes the bioprosthesis. Continue deploying the bioprosthesis in a controlled manner, adjusting valve position as necessary and noting the position of the radiopaque capsule marker band and paddle attachment.
Warning: Use the deployment knob to deploy and recapture the bioprosthesis. Do not use the trigger for deploying or recapturing because it could cause inaccurate placement of the bioprosthesis.
Note: Slight antegrade repositioning of a partially deployed bioprosthesis (before the radiopaque capsule marker band reaches the distal end of the radiopaque paddle attachment) can be achieved by carefully withdrawing the catheter.
Caution: Use the catheter handle to reposition the bioprosthesis. Do not use the outer catheter shaft.
23. Before the radiopaque capsule marker band reaches the distal end of the radiopaque paddle attachment, evaluate the bioprosthesis position.
Note: When the bioprosthesis is approximately 2/3 deployed, the deployment knob provides a tactile indication as a notification before the point of no recapture. Once the radiopaque capsule marker band reaches the distal end of the radiopaque paddle attachment, it is at the point of no recapture.
24. Either complete bioprosthesis deployment or initiate bioprosthesis recapture.
Note: Shortly after annular contact, the blood pressure will be reduced until approximately the 2/3 deployment point, when the bioprosthesis leaflets are exposed and are functioning.
Bioprosthesis recapture (optional)
The bioprosthesis is recapturable during deployment before the radiopaque capsule marker band reaches the distal end of the radiopaque paddle attachment. Deployment of the bioprosthesis can be attempted 3 times. If the bioprosthesis is recaptured a third time, it must be removed from the patient.
25. Rotate the deployment knob in the opposite direction of the arrows to recapture the bioprosthesis. A partially recaptured bioprosthesis can be repositioned or fully recaptured.

34
Warning: Use the deployment knob to deploy and recapture the bioprosthesis. Do not use the trigger for deploying or recapturing because it could cause inaccurate placement of the bioprosthesis.
26. To fully recapture the bioprosthesis, continue rotating the deployment knob until the gap between the capsule and catheter tip is closed.
Caution: Stop advancing the capsule once the gap between the capsule and the catheter tip is closed. Advancing the capsule farther could damage the capsule.
27. Reposition the recaptured bioprosthesis at the optimal depth relative to the valve annulus. For surgical bioprosthetic valves, consider the features of the valve when determining the optimal placement of the bioprosthesis.
28. Redeploy the bioprosthesis (Section 9.2, steps 22 and 23).
29. Either complete bioprosthesis redeployment or initiate bioprosthesis recapture. If the bioprosthesis has been recaptured 3 times, withdraw the recaptured bioprosthesis.
Note: Shortly after annular contact, the blood pressure will be reduced until approximately the 2/3 deployment point, when the bioprosthesis leaflets are exposed and are functioning.
Postdeployment
30. Perform an angiogram to assess the location of the bioprosthesis.
31. Under fluoroscopic guidance, confirm that the catheter tip is coaxial with the inflow portion of the bioprosthesis.
32. Withdraw the catheter to the aorta while maintaining guidewire position.
Note: For transfemoral access, withdraw the catheter until the catheter tip is positioned in the descending aorta. For direct aortic access and subclavian access, withdraw the catheter until the catheter tip is close to the distal tip of the introducer sheath.
33. Under fluoroscopic guidance, close the catheter capsule.
Caution: Close the capsule until it is aligned with the catheter tip. Do not overcapture the catheter tip, because it could interfere with catheter withdrawal through the introducer sheath or cause vessel trauma upon removal.
Caution: Ensure the capsule is closed before catheter removal.
Caution: When using a separate introducer sheath, if increased resistance is encountered when removing the catheter through the introducer sheath, do not force passage. Increased resistance may indicate a problem and forced passage may result in damage to the device and/or harm to the patient. If the cause of resistance cannot be determined or corrected, remove the catheter and introducer sheath as a single unit over the guidewire, and inspect the catheter and confirm that it is complete.
34. Withdraw the catheter until the capsule meets the distal end of the EnVeo R InLine™ sheath.
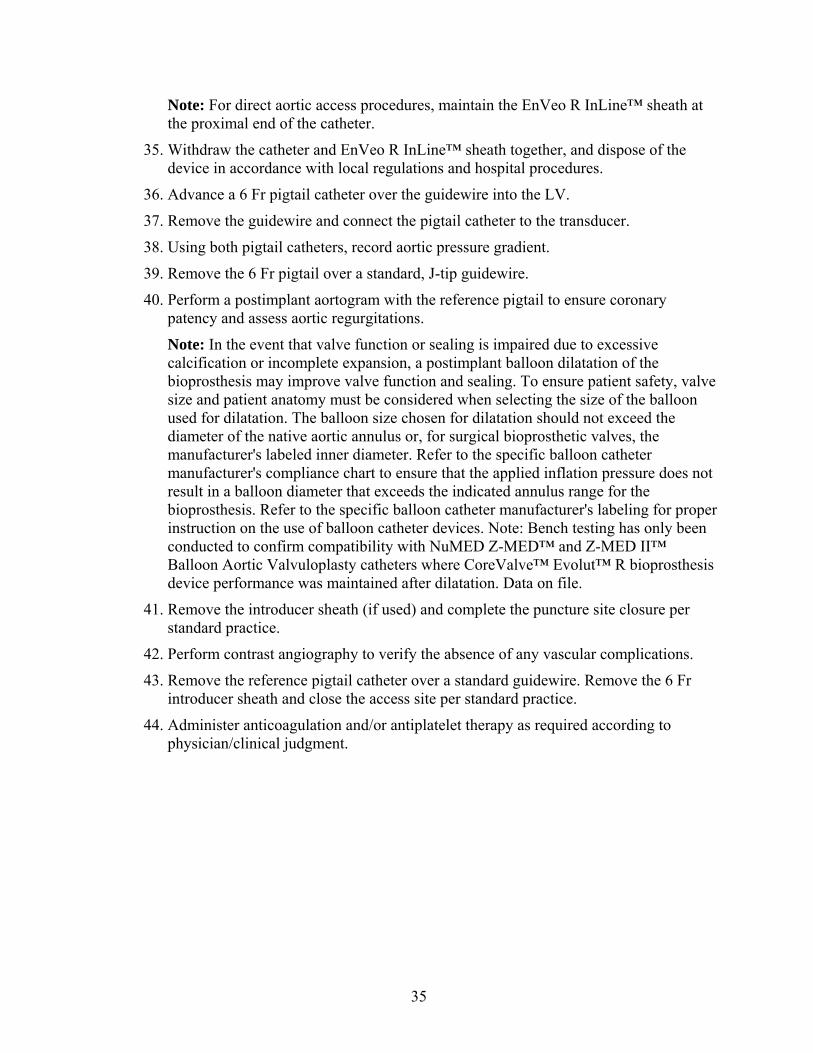
35
Note: For direct aortic access procedures, maintain the EnVeo R InLine™ sheath at the proximal end of the catheter.
35. Withdraw the catheter and EnVeo R InLine™ sheath together, and dispose of the device in accordance with local regulations and hospital procedures.
36. Advance a 6 Fr pigtail catheter over the guidewire into the LV.
37. Remove the guidewire and connect the pigtail catheter to the transducer.
38. Using both pigtail catheters, record aortic pressure gradient.
39. Remove the 6 Fr pigtail over a standard, J-tip guidewire.
40. Perform a postimplant aortogram with the reference pigtail to ensure coronary patency and assess aortic regurgitations.
Note: In the event that valve function or sealing is impaired due to excessive calcification or incomplete expansion, a postimplant balloon dilatation of the bioprosthesis may improve valve function and sealing. To ensure patient safety, valve size and patient anatomy must be considered when selecting the size of the balloon used for dilatation. The balloon size chosen for dilatation should not exceed the diameter of the native aortic annulus or, for surgical bioprosthetic valves, the manufacturer's labeled inner diameter. Refer to the specific balloon catheter manufacturer's compliance chart to ensure that the applied inflation pressure does not result in a balloon diameter that exceeds the indicated annulus range for the bioprosthesis. Refer to the specific balloon catheter manufacturer's labeling for proper instruction on the use of balloon catheter devices. Note: Bench testing has only been conducted to confirm compatibility with NuMED Z-MED™ and Z-MED II™ Balloon Aortic Valvuloplasty catheters where CoreValve™ Evolut™ R bioprosthesis device performance was maintained after dilatation. Data on file.
41. Remove the introducer sheath (if used) and complete the puncture site closure per standard practice.
42. Perform contrast angiography to verify the absence of any vascular complications.
43. Remove the reference pigtail catheter over a standard guidewire. Remove the 6 Fr introducer sheath and close the access site per standard practice.
44. Administer anticoagulation and/or antiplatelet therapy as required according to physician/clinical judgment.

36
10.0 Return of explanted bioprostheses
Medtronic is interested in obtaining recovered bioprostheses. Specific pathological studies of the explanted bioprosthesis will be conducted under the direction of a consulting pathologist. A written summary of the findings will be returned to the physician. To obtain a product return kit, contact a Medtronic distribution center or a Medtronic Representative. If a kit is not available, place the explanted bioprosthesis in a container of glutaraldehyde or 10% buffered formalin immediately after excision. For further instructions on the return of an explanted device, contact a Medtronic Representative.
37
11.0 Summary of clinical studies
The Medtronic CoreValve™ SURTAVI Trial was designed and executed to evaluate the safety and efficacy of transcatheter aortic valve implantation (TAVR) in subjects with severe, symptomatic aortic stenosis (AS) at intermediate surgical risk (heart team agreement of predicted risk of operative mortality is ≥3% and <15% at 30 days) by randomizing subjects to either surgical aortic valve replacement (SAVR) or TAVR. Section 11.1 presents the results of the SURTAVI Trial.
The Medtronic CoreValve™ Evolut™ R Global Clinical Studies are prospective, single-arm, historical-controlled, multi-center studies designed to evaluate the safety and efficacy of the Evolut™ R system (23 mm, 26 mm, and 29 mm valves) for the treatment of severe aortic stenosis in patients considered at high through extreme risk for surgical aortic valve replacement. The US IDE study addendum evaluated the safety and effectiveness of the 34 mm valve in a subset of the US study sites included in the CoreValve™ Evolut™ R Global Clinical Studies. The results of these studies are presented as a combined population in Section 11.2, with the exception of the Quality of Life data (Table 17), which were only collected at the US study sites.
Patients received the Evolut™ R bioprosthesis either through the iliofemoral access route [95.2% (158/166)] or through the non-iliofemoral—subclavian [0.6% (1/166)] and direct aortic [4.2% (7/166)]—access routes. The recapture/resheath feature, unique to the Evolut™ R system, was used in 38/166 subjects.
The data in Section 11.2 summarize the results from the Evolut™ R clinical studies.
11.1 Intermediate Risk trial (SURTAVI) The Surgical Replacement and Transcatheter Aortic Valve Implantation (SURTAVI) trial is a prospective, randomized, unblinded, multi-center investigational study. The purpose of this trial is to investigate the safety and efficacy of transcatheter aortic valve implantation (TAVR) in subjects with severe, symptomatic aortic stenosis (AS) at intermediate surgical risk by randomizing subjects to either surgical aortic valve replacement (SAVR) or TAVR.
A total of 1746 subjects were randomized in this study (879 subjects were randomized to TAVR and 867 subjects were randomized to surgical aortic valve replacement [SAVR]) at 87 activated centers. Severe aortic stenosis was defined as an aortic valve area of ≤0.8 cm2 or aortic valve area index ≤0.5 cm2, a mean aortic valve gradient of >40 mmHg or jet velocity >4 m/sec. The primary objective of the study was to demonstrate that the safety and effectiveness of the Medtronic CoreValve™ system (TAVR), as measured by all-cause mortality or disabling stroke at 24 months, is non-inferior to surgical aortic valve replacement (SAVR) in the treatment of symptomatic severe aortic stenosis in subjects who have a predicted intermediate risk for aortic valve surgery.
Of the 879 subjects randomized to TAVR, 864 received an attempted implant and comprise the primary analysis cohort (the modified intention-to-treat [mITT] cohort) TAVR set, while 796 of the 867 randomized to SAVR received an attempted implant and comprise the mITT SAVR cohort. The implanted population (863 TAVR and 794 SAVR) consists of all subjects who were implanted with a valve. Of the 863 subjects in the Implanted TAVR group, 724
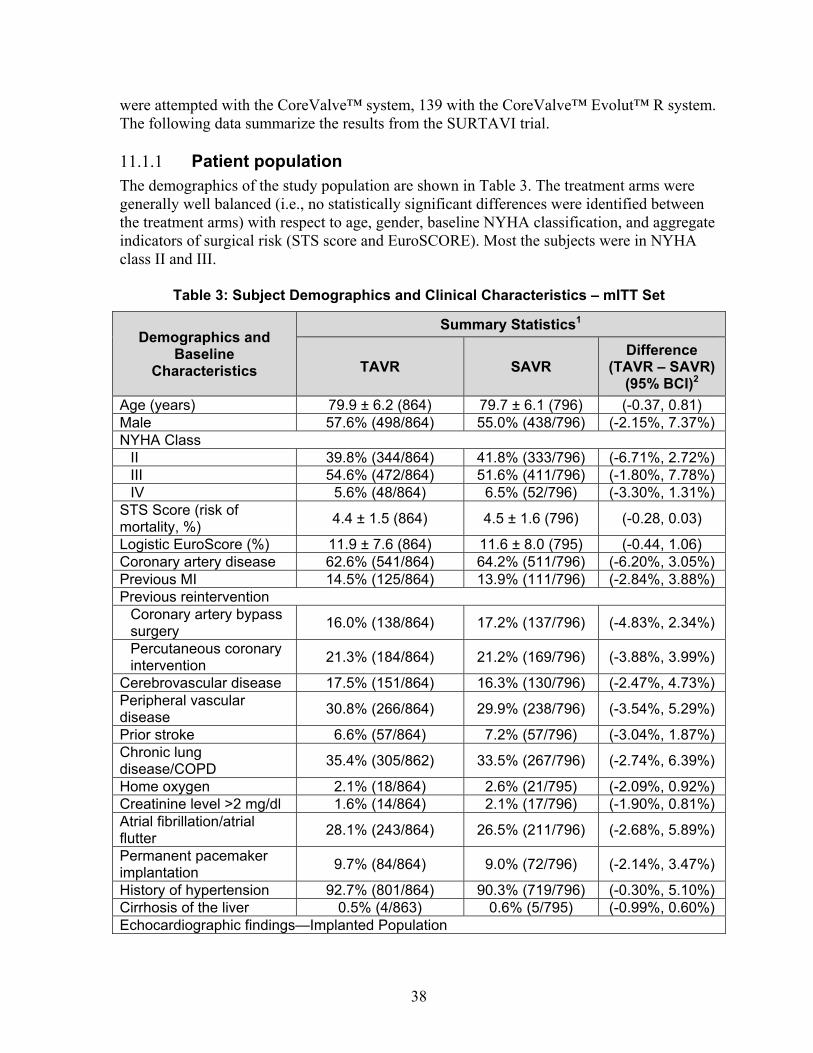
38
were attempted with the CoreValve™ system, 139 with the CoreValve™ Evolut™ R system. The following data summarize the results from the SURTAVI trial.
Patient population 11.1.1The demographics of the study population are shown in Table 3. The treatment arms were generally well balanced (i.e., no statistically significant differences were identified between the treatment arms) with respect to age, gender, baseline NYHA classification, and aggregate indicators of surgical risk (STS score and EuroSCORE). Most the subjects were in NYHA class II and III.
Table 3: Subject Demographics and Clinical Characteristics – mITT Set
Demographics and Baseline
Characteristics
Summary Statistics1
TAVR SAVR Difference
(TAVR – SAVR)(95% BCI)2
Age (years) 79.9 ± 6.2 (864) 79.7 ± 6.1 (796) (-0.37, 0.81)Male 57.6% (498/864) 55.0% (438/796) (-2.15%, 7.37%)NYHA Class
II 39.8% (344/864) 41.8% (333/796) (-6.71%, 2.72%)III 54.6% (472/864) 51.6% (411/796) (-1.80%, 7.78%)IV 5.6% (48/864) 6.5% (52/796) (-3.30%, 1.31%)
STS Score (risk of mortality, %)
4.4 ± 1.5 (864) 4.5 ± 1.6 (796) (-0.28, 0.03)
Logistic EuroScore (%) 11.9 ± 7.6 (864) 11.6 ± 8.0 (795) (-0.44, 1.06)Coronary artery disease 62.6% (541/864) 64.2% (511/796) (-6.20%, 3.05%)Previous MI 14.5% (125/864) 13.9% (111/796) (-2.84%, 3.88%)Previous reintervention
Coronary artery bypass surgery
16.0% (138/864) 17.2% (137/796) (-4.83%, 2.34%)
Percutaneous coronary intervention 21.3% (184/864) 21.2% (169/796) (-3.88%, 3.99%)
Cerebrovascular disease 17.5% (151/864) 16.3% (130/796) (-2.47%, 4.73%)Peripheral vascular disease
30.8% (266/864) 29.9% (238/796) (-3.54%, 5.29%)
Prior stroke 6.6% (57/864) 7.2% (57/796) (-3.04%, 1.87%)Chronic lung disease/COPD
35.4% (305/862) 33.5% (267/796) (-2.74%, 6.39%)
Home oxygen 2.1% (18/864) 2.6% (21/795) (-2.09%, 0.92%)Creatinine level >2 mg/dl 1.6% (14/864) 2.1% (17/796) (-1.90%, 0.81%)Atrial fibrillation/atrial flutter
28.1% (243/864) 26.5% (211/796) (-2.68%, 5.89%)
Permanent pacemaker implantation
9.7% (84/864) 9.0% (72/796) (-2.14%, 3.47%)
History of hypertension 92.7% (801/864) 90.3% (719/796) (-0.30%, 5.10%)Cirrhosis of the liver 0.5% (4/863) 0.6% (5/795) (-0.99%, 0.60%)Echocardiographic findings—Implanted Population

39
Effective orifice area (cm2)
0.8 ± 0.2 (790) 0.8 ± 0.2 (727) (-0.01, 0.03)
Mean gradient (mmHg) 47.2 ± 14.3 (856) 47.8 ± 13.8 (786) (-2.03, 0.70)1 Continuous measures - Mean ± SD (Total no.); categorical measures - % (no./Total no.) 2 BCI: Bayesian credible interval
Procedure data 11.1.2As shown in Table 4, total time the delivery catheter was in the body was approximately 15 minutes. A majority of TAVR subjects were administered general anesthesia while the remaining subjects underwent the procedure with conscious sedation. A substantial majority of the subjects (greater than 90%) has the valve delivered via iliofemoral access and percutaneous access was more common than surgical cut-down. Balloon predilatation was performed in approximately half of the subjects and postdilatation was performed in approximately 30%.
Table 4: Procedural Data Summary for TAVR Subjects – mITT Set
Assessment Summary Statistics1
N=864
Number of Index Procedures 863 Total delivery catheter in the body time (min) 15.0 ± 15.9 Type of Anesthesia
General 75.7% (653/863) Conscious Sedation 24.3% (210/863)
Respiratory Support Required 69.8% (602/863) Access Site
Femoral 93.2% (804/863) Percutaneous 81.3% (654/804) Surgical cut-down 18.7% (150/804)
Iliac 0.5% (4/863) Percutaneous 75.0% (3/4) Surgical cut-down 25.0% (1/4)
Subclavian axillary 2.3% (20/863) Direct Aortic 4.1% (35/863) Other 0.0% (0/863)
Total Time in Cath Lab or OR (min) 190.8 ± 61.3 Total Procedure Time (min) 52.3 ± 32.7 Pre-TAVR balloon valvuloplasty performed 47.2% (407/863) Post-TAVR balloon valvuloplasty performed 29.0% (250/863) 1 Continuous measures - Mean ± SD; categorical measures - % (no./Total no.). Data include subjects with the index procedure defined as the first procedure that the delivery catheter is introduced.
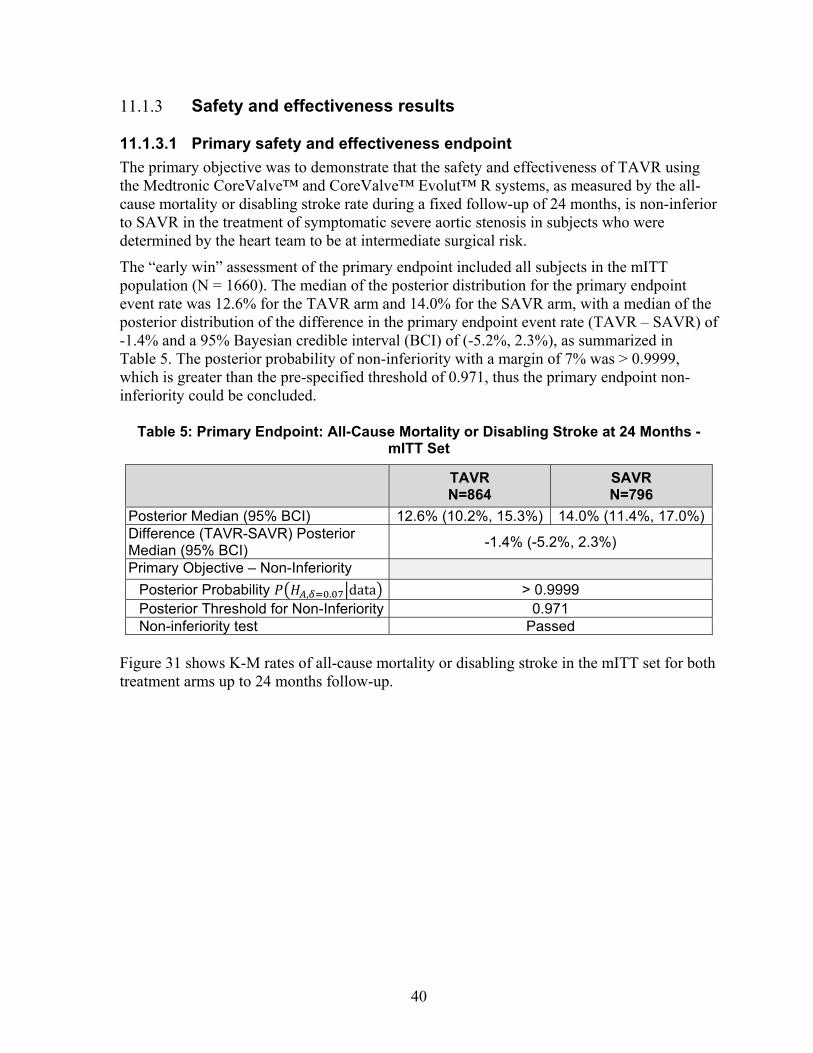
40
Safety and effectiveness results 11.1.3
11.1.3.1 Primary safety and effectiveness endpoint
The primary objective was to demonstrate that the safety and effectiveness of TAVR using the Medtronic CoreValve™ and CoreValve™ Evolut™ R systems, as measured by the all-cause mortality or disabling stroke rate during a fixed follow-up of 24 months, is non-inferior to SAVR in the treatment of symptomatic severe aortic stenosis in subjects who were determined by the heart team to be at intermediate surgical risk.
The “early win” assessment of the primary endpoint included all subjects in the mITT population (N = 1660). The median of the posterior distribution for the primary endpoint event rate was 12.6% for the TAVR arm and 14.0% for the SAVR arm, with a median of the posterior distribution of the difference in the primary endpoint event rate (TAVR – SAVR) of -1.4% and a 95% Bayesian credible interval (BCI) of (-5.2%, 2.3%), as summarized in Table 5. The posterior probability of non-inferiority with a margin of 7% was > 0.9999, which is greater than the pre-specified threshold of 0.971, thus the primary endpoint non-inferiority could be concluded.
Table 5: Primary Endpoint: All-Cause Mortality or Disabling Stroke at 24 Months - mITT Set
TAVR N=864
SAVR N=796
Posterior Median (95% BCI) 12.6% (10.2%, 15.3%) 14.0% (11.4%, 17.0%)Difference (TAVR-SAVR) Posterior Median (95% BCI)
-1.4% (-5.2%, 2.3%)
Primary Objective – Non-Inferiority
Posterior Probability , . data > 0.9999 Posterior Threshold for Non-Inferiority 0.971 Non-inferiority test Passed
Figure 31 shows K-M rates of all-cause mortality or disabling stroke in the mITT set for both treatment arms up to 24 months follow-up.

41
Figure 31: Primary Endpoint: All-Cause Mortality or Disabling Stroke Kaplan-Meier
Event Rate – mITT Set
Note: The confidence intervals were calculated without multiplicity adjustment. The adjusted confidence intervals could be wider than presented here. As such, confidence intervals are provided to illustrate the variability only and should not be used to draw any statistical conclusion.
11.1.3.2 Key secondary safety and effectiveness endpoints
Hierarchical testing of secondary endpoints
Hypothesis testing was performed on pre-specified secondary endpoints using a hierarchical test procedure, as shown in Table 6. TAVR was found to be non-inferior to SAVR within the pre-specified non-inferiority margins in terms of mean gradient and EOA at 12 months, the NYHA functional classification change from baseline to 12 months, and the KCCQ score change from baseline to 30 days. TAVR was determined to be superior to SAVR with respect to length of index procedure hospital stay, the mean pressure gradient at 12 months, EOA at 12 months, and the KCCQ score change from baseline to 30-days.
TAVR was not found to be superior to SAVR with respect to days alive and out of hospital at 12 months. The remaining secondary endpoints were not tested.
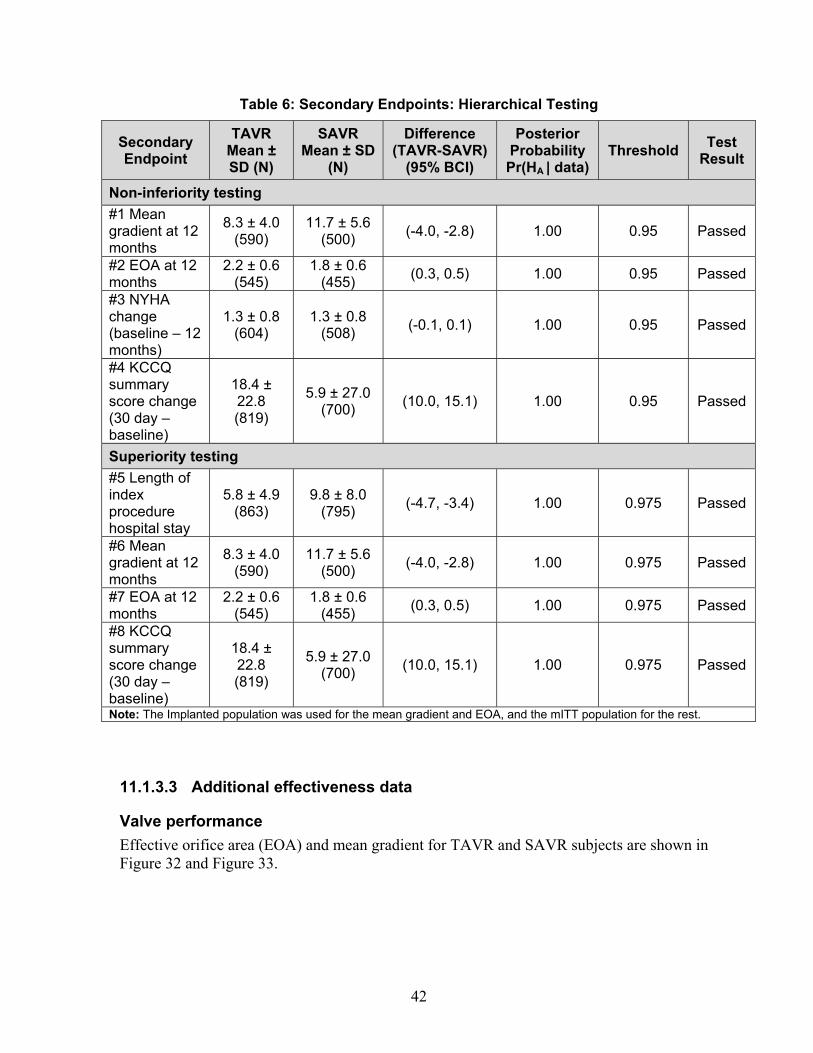
42
Table 6: Secondary Endpoints: Hierarchical Testing
Secondary Endpoint
TAVR Mean ± SD (N)
SAVR Mean ± SD
(N)
Difference (TAVR-SAVR)
(95% BCI)
Posterior Probability Pr(HA | data)
Threshold Test
Result
Non-inferiority testing
#1 Mean gradient at 12 months
8.3 ± 4.0 (590)
11.7 ± 5.6 (500)
(-4.0, -2.8) 1.00 0.95 Passed
#2 EOA at 12 months
2.2 ± 0.6 (545)
1.8 ± 0.6 (455)
(0.3, 0.5) 1.00 0.95 Passed
#3 NYHA change (baseline – 12 months)
1.3 ± 0.8 (604)
1.3 ± 0.8 (508)
(-0.1, 0.1) 1.00 0.95 Passed
#4 KCCQ summary score change (30 day – baseline)
18.4 ± 22.8 (819)
5.9 ± 27.0 (700)
(10.0, 15.1) 1.00 0.95 Passed
Superiority testing
#5 Length of index procedure hospital stay
5.8 ± 4.9 (863)
9.8 ± 8.0 (795)
(-4.7, -3.4) 1.00 0.975 Passed
#6 Mean gradient at 12 months
8.3 ± 4.0 (590)
11.7 ± 5.6 (500)
(-4.0, -2.8) 1.00 0.975 Passed
#7 EOA at 12 months
2.2 ± 0.6 (545)
1.8 ± 0.6 (455)
(0.3, 0.5) 1.00 0.975 Passed
#8 KCCQ summary score change (30 day – baseline)
18.4 ± 22.8 (819)
5.9 ± 27.0 (700)
(10.0, 15.1) 1.00 0.975 Passed
Note: The Implanted population was used for the mean gradient and EOA, and the mITT population for the rest.
11.1.3.3 Additional effectiveness data
Valve performance
Effective orifice area (EOA) and mean gradient for TAVR and SAVR subjects are shown in Figure 32 and Figure 33.
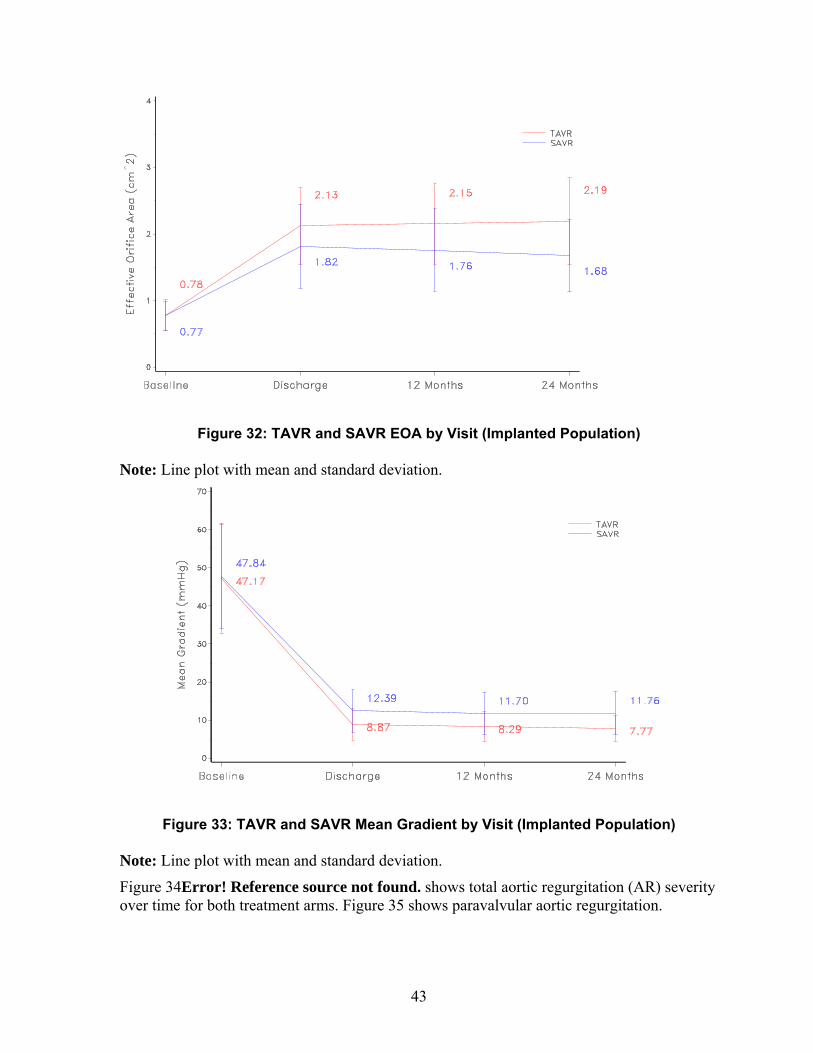
43
Figure 32: TAVR and SAVR EOA by Visit (Implanted Population)
Note: Line plot with mean and standard deviation.
Figure 33: TAVR and SAVR Mean Gradient by Visit (Implanted Population)
Note: Line plot with mean and standard deviation.
Figure 34Error! Reference source not found. shows total aortic regurgitation (AR) severity over time for both treatment arms. Figure 35 shows paravalvular aortic regurgitation.

44
Figure 34: TAVR and SAVR Total Aortic Regurgitation by Visit (Implanted Population)
Note: Values < 1.0% are not labeled.
Figure 35: Paravalvular Aortic Regurgitation by Visit (Implanted Population)
Note: Values < 1.0% are not labeled.
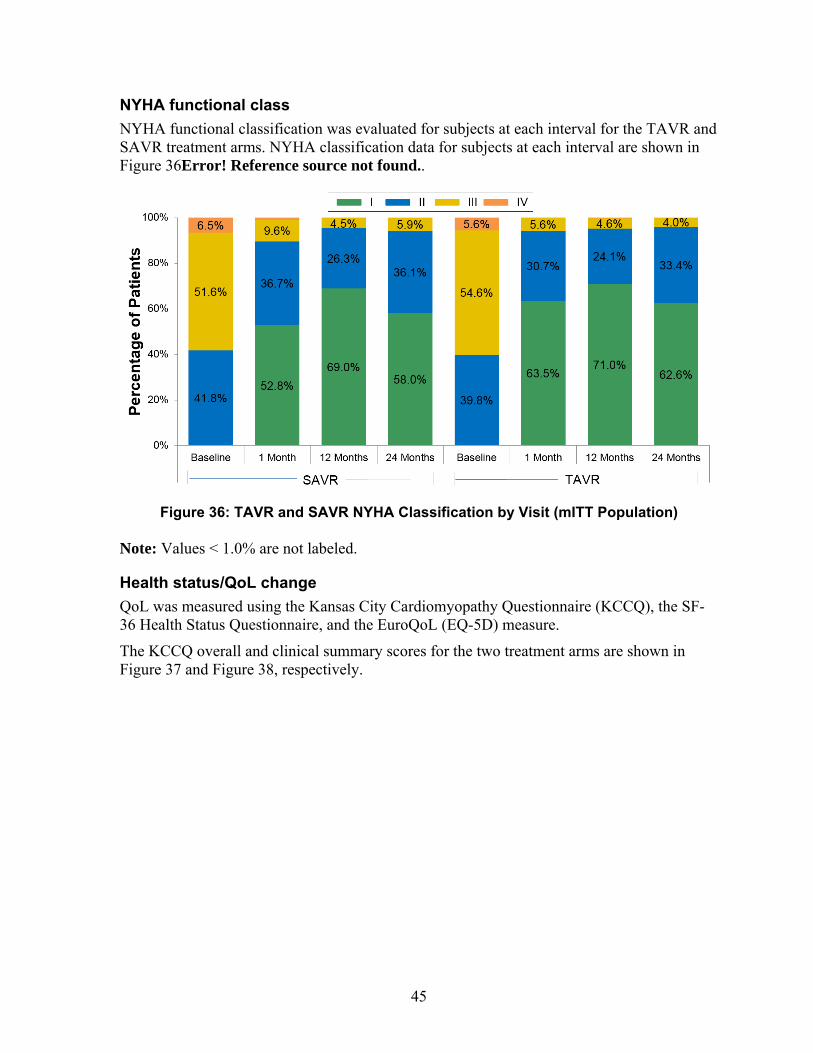
45
NYHA functional class
NYHA functional classification was evaluated for subjects at each interval for the TAVR and SAVR treatment arms. NYHA classification data for subjects at each interval are shown in Figure 36Error! Reference source not found..
Figure 36: TAVR and SAVR NYHA Classification by Visit (mITT Population)
Note: Values < 1.0% are not labeled.
Health status/QoL change
QoL was measured using the Kansas City Cardiomyopathy Questionnaire (KCCQ), the SF-36 Health Status Questionnaire, and the EuroQoL (EQ-5D) measure.
The KCCQ overall and clinical summary scores for the two treatment arms are shown in Figure 37 and Figure 38, respectively.

46
Figure 37: KCCQ Overall Summary Scores
Note: Line plot with mean and standard deviation.
Figure 38: KCCQ Clinical Summary Scores
Note: Line plot with mean and standard deviation.
The SF-36 physical and mental component summary scores for the two treatment arms are shown in Figure 39 and Figure 40, respectively.
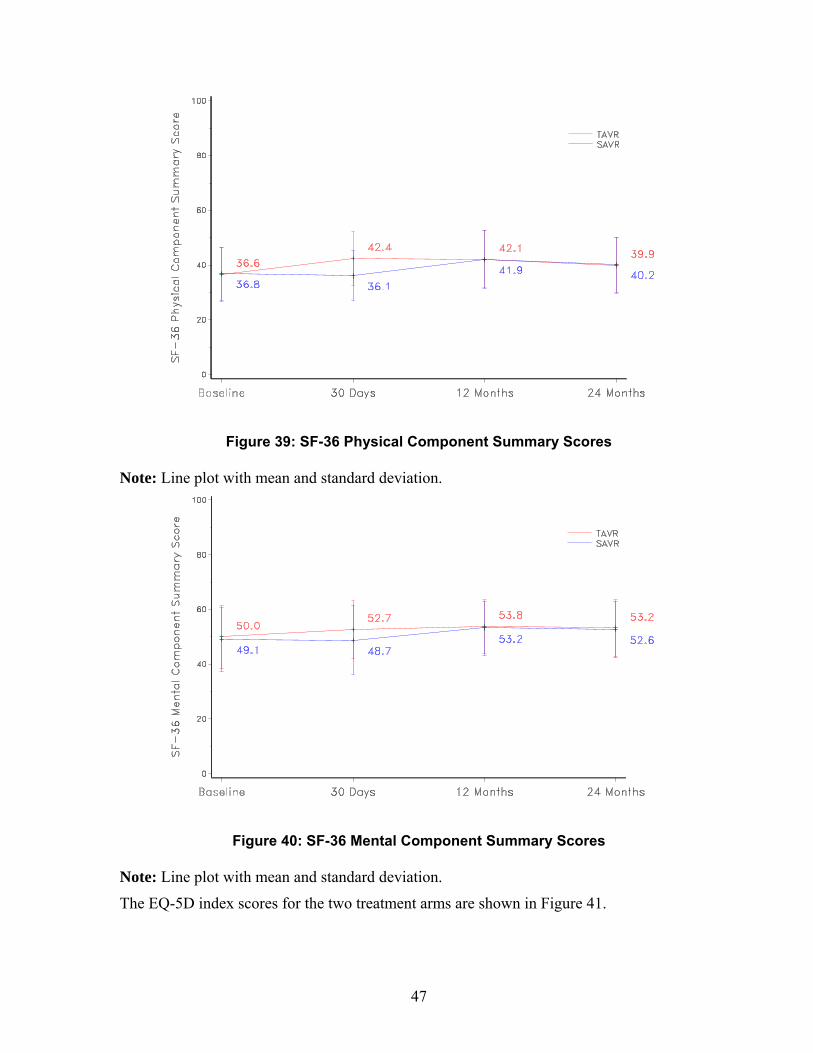
47
Figure 39: SF-36 Physical Component Summary Scores
Note: Line plot with mean and standard deviation.
Figure 40: SF-36 Mental Component Summary Scores
Note: Line plot with mean and standard deviation.
The EQ-5D index scores for the two treatment arms are shown in Figure 41.
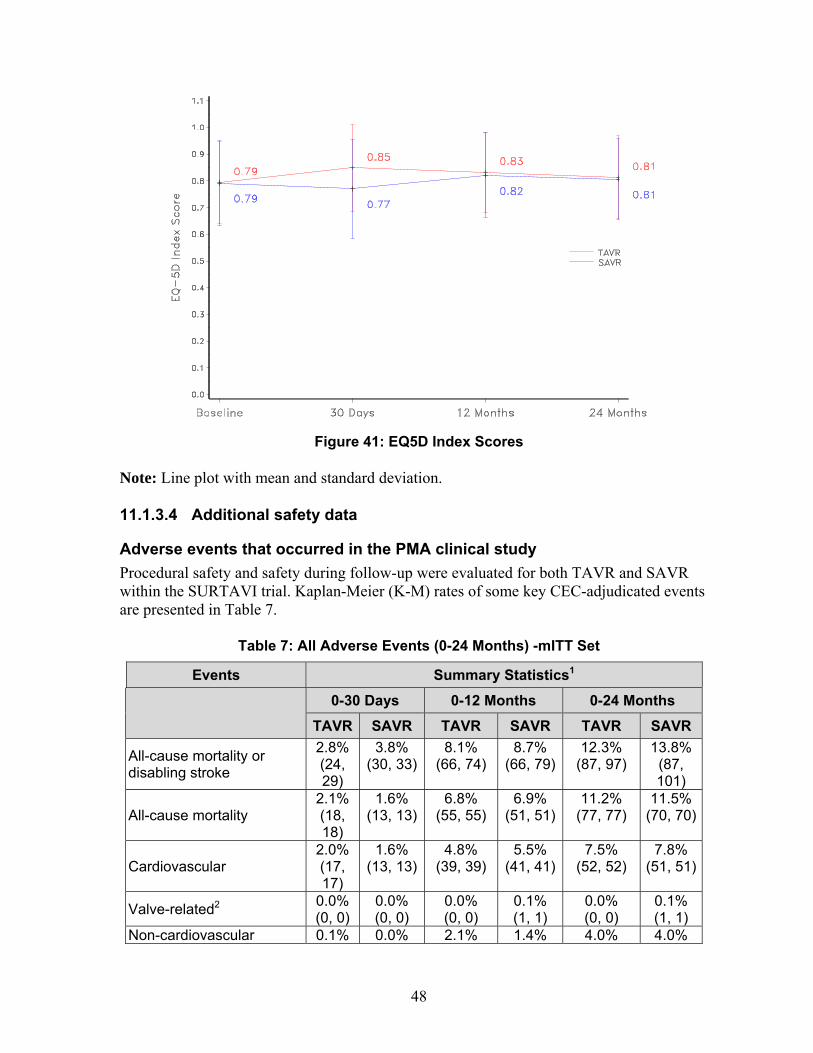
48
Figure 41: EQ5D Index Scores
Note: Line plot with mean and standard deviation.
11.1.3.4 Additional safety data
Adverse events that occurred in the PMA clinical study
Procedural safety and safety during follow-up were evaluated for both TAVR and SAVR within the SURTAVI trial. Kaplan-Meier (K-M) rates of some key CEC-adjudicated events are presented in Table 7.
Table 7: All Adverse Events (0-24 Months) -mITT Set
Events Summary Statistics1
0-30 Days 0-12 Months 0-24 Months
TAVR SAVR TAVR SAVR TAVR SAVR
All-cause mortality or disabling stroke
2.8% (24, 29)
3.8% (30, 33)
8.1% (66, 74)
8.7% (66, 79)
12.3% (87, 97)
13.8% (87, 101)
All-cause mortality 2.1% (18, 18)
1.6% (13, 13)
6.8% (55, 55)
6.9% (51, 51)
11.2% (77, 77)
11.5% (70, 70)
Cardiovascular 2.0% (17, 17)
1.6% (13, 13)
4.8% (39, 39)
5.5% (41, 41)
7.5% (52, 52)
7.8% (51, 51)
Valve-related2 0.0% (0, 0)
0.0% (0, 0)
0.0% (0, 0)
0.1% (1, 1)
0.0% (0, 0)
0.1% (1, 1)
Non-cardiovascular 0.1% 0.0% 2.1% 1.4% 4.0% 4.0%

49
Events Summary Statistics1
0-30 Days 0-12 Months 0-24 Months
TAVR SAVR TAVR SAVR TAVR SAVR
(1, 1) (0, 0) (16, 16) (10, 10) (25, 25) (19, 19)
Reintervention 0.8% (7, 7)
0.1% (1, 1)
2.1% (17, 19)
0.4% (3, 3)
2.6% (20, 22)
0.4% (3, 3)
All stroke 3.3% (28, 29)
5.4% (43, 45)
5.3% (44, 45)
6.7% (52, 55)
6.3% (48, 50)
8.0% (58, 61)
Disabling stroke 1.2% (10, 11)
2.4% (19, 20)
2.2% (18, 19)
3.4% (26, 28)
2.4% (19, 20)
4.1% (29, 31)
Non-disabling stroke 2.1% (18, 18)
3.0% (24, 25)
3.1% (26, 26)
3.3% (26, 27)
4.1% (30, 30)
4.0% (29, 30)
Life threatening/disabling bleeding
5.7% (49, 51)
5.9% (47, 47)
7.1% (60, 66)
7.8% (60, 61)
8.0% (64, 72)
8.4% (63, 65)
Major vascular complication
5.9% (51, 55)
1.0% (8, 8)
6.3% (54, 59)
1.0% (8, 8)
6.3% (54, 59)
1.0% (8, 8)
Acute kidney injury - Stage 3
0.7% (6, 6)
1.3% (10, 10)
0.7% (6, 6)
1.3% (10, 10)
0.7% (6, 6)
1.3% (10, 10)
MI 0.8% (7, 7)
0.9% (7, 7)
1.9% (15, 15)
1.4% (11, 11)
2.6% (18, 18)
1.9% (13, 13)
Aortic valve hospitalization 2.8% (24, 26)
4.1% (32, 34)
8.4% (68, 104)
7.4% (55, 68)
13.2% (90, 134)
9.0% (62, 85)
Permanent pacemaker implantation3
28.1%(217, 217)
6.8% (48, 48)
31.3% (239, 241)
9.0% (62, 64)
34.6% (253, 257)
10.3% (67, 70)
Permanent pacemaker implantation4
25.6%(220, 220)
6.5% (51, 51)
28.5% (242, 244)
8.6% (66, 68)
31.5% (256, 260)
9.8% (71, 74)
1 Kaplan-Meier rate (# patients, # events). 2 Valve-related death is any death caused by structural or non-structural valve dysfunction or aortic valve re-intervention. 3 Subjects with pacemaker or ICD at baseline are not included. Not adjudicated by CEC. 4 Subjects with pacemaker or ICD at baseline are included. Not adjudicated by CEC.
Additional study observations 11.1.4
11.1.4.1 Pre-specified analyses
The primary endpoint was examined for treatment arm differences in outcome between the stratified randomization designation (revascularization or no revascularization) and gender.
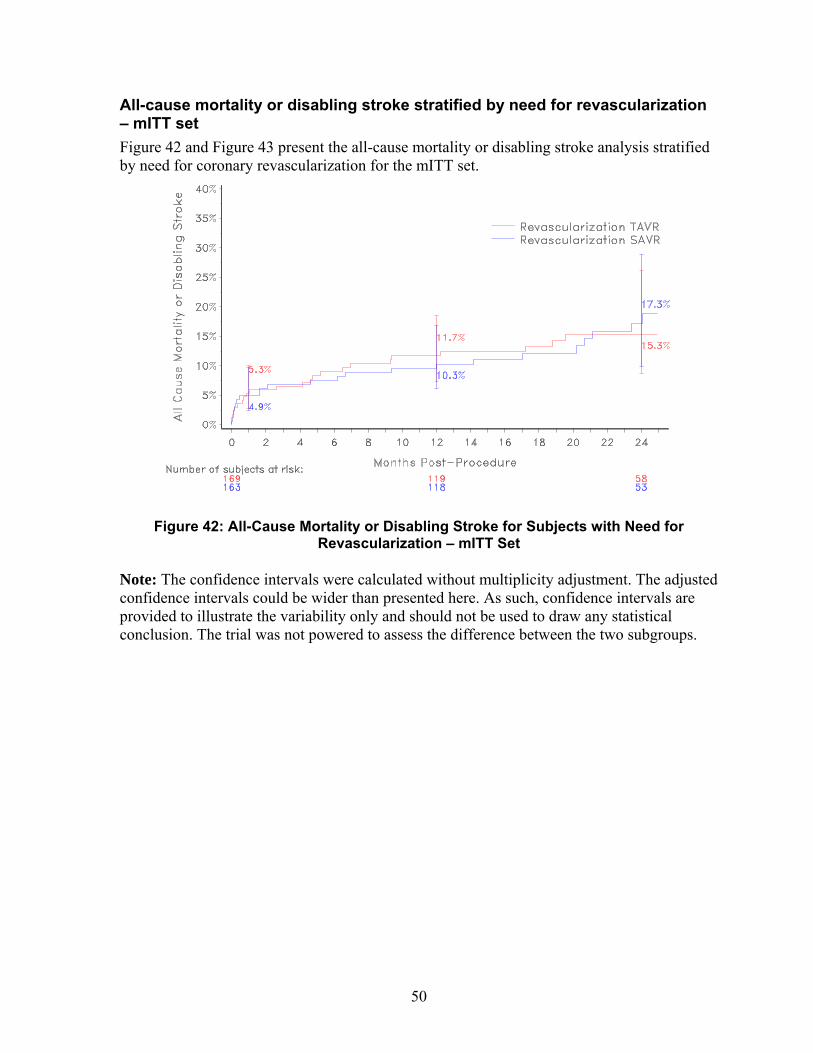
50
All-cause mortality or disabling stroke stratified by need for revascularization – mITT set
Figure 42 and Figure 43 present the all-cause mortality or disabling stroke analysis stratified by need for coronary revascularization for the mITT set.
Figure 42: All-Cause Mortality or Disabling Stroke for Subjects with Need for
Revascularization – mITT Set
Note: The confidence intervals were calculated without multiplicity adjustment. The adjusted confidence intervals could be wider than presented here. As such, confidence intervals are provided to illustrate the variability only and should not be used to draw any statistical conclusion. The trial was not powered to assess the difference between the two subgroups.
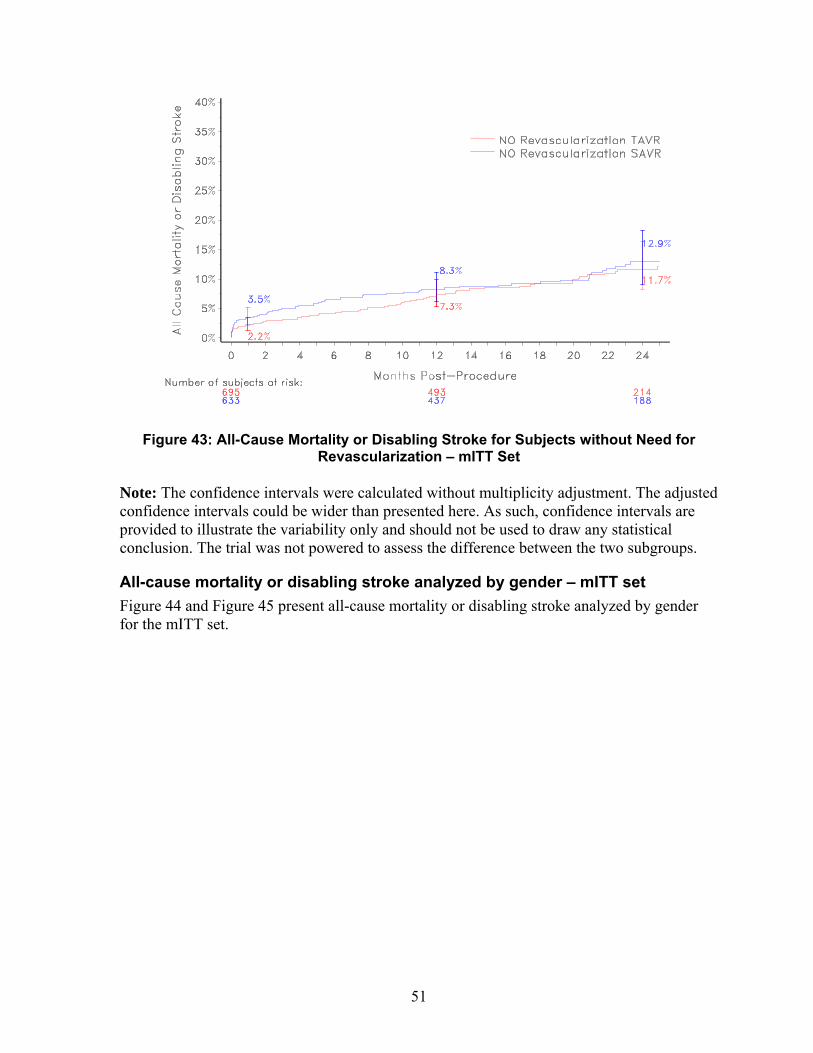
51
Figure 43: All-Cause Mortality or Disabling Stroke for Subjects without Need for
Revascularization – mITT Set
Note: The confidence intervals were calculated without multiplicity adjustment. The adjusted confidence intervals could be wider than presented here. As such, confidence intervals are provided to illustrate the variability only and should not be used to draw any statistical conclusion. The trial was not powered to assess the difference between the two subgroups.
All-cause mortality or disabling stroke analyzed by gender – mITT set
Figure 44 and Figure 45 present all-cause mortality or disabling stroke analyzed by gender for the mITT set.
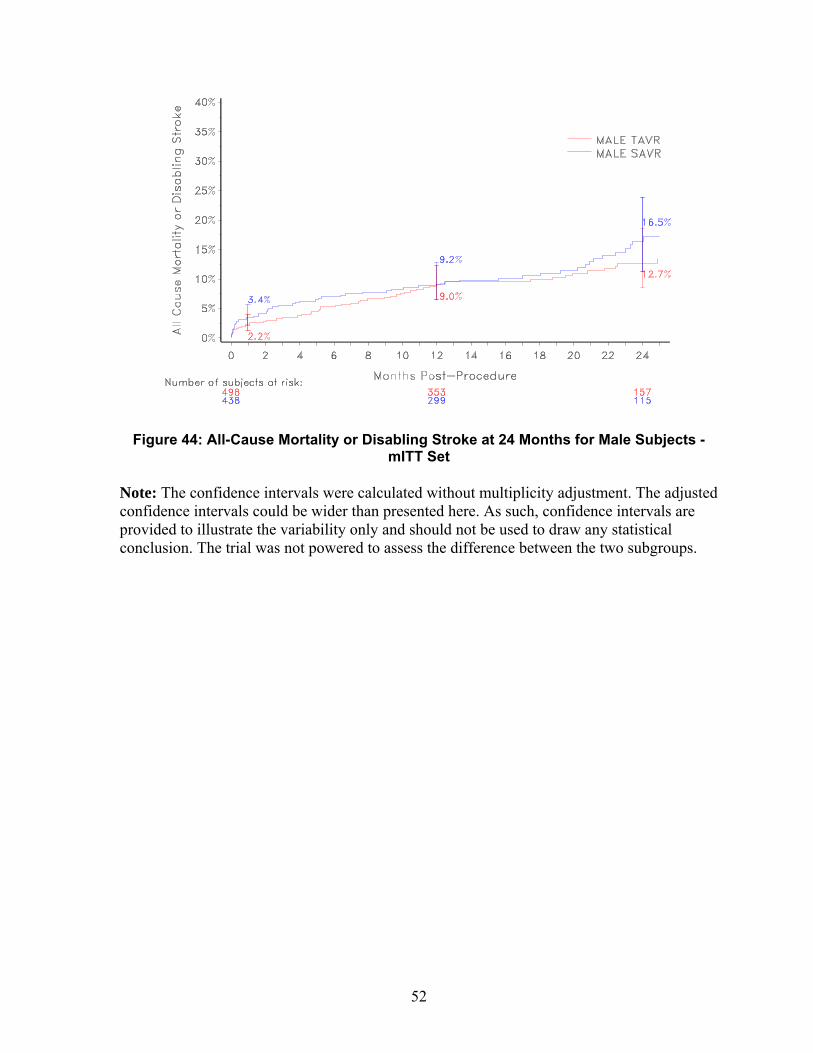
52
Figure 44: All-Cause Mortality or Disabling Stroke at 24 Months for Male Subjects -
mITT Set
Note: The confidence intervals were calculated without multiplicity adjustment. The adjusted confidence intervals could be wider than presented here. As such, confidence intervals are provided to illustrate the variability only and should not be used to draw any statistical conclusion. The trial was not powered to assess the difference between the two subgroups.

53
Figure 45: All-Cause Mortality or Disabling Stroke at 24 Months for Female Subjects –
mITT Set
Note: The confidence intervals were calculated without multiplicity adjustment. The adjusted confidence intervals could be wider than presented here. As such, confidence intervals are provided to illustrate the variability only and should not be used to draw any statistical conclusion. The trial was not powered to assess the difference between the two subgroups.
11.1.4.2 All-cause mortality by severity of aortic regurgitation
A sub-group analysis was performed to investigate the relationship between all-cause mortality and severity of aortic regurgitation at discharge. Two sub-groups of subjects with none/trace and mild/moderate/severe total AR as assessed at discharge were analyzed.
The results from the analysis with 2 subgroups are shown for the TAVR treatment arm in Figure 46.

54
Figure 46: All-Cause Mortality by Severity of Aortic Regurgitation (2 Groups) – TAVR
Implanted Set
Note: The confidence intervals were calculated without multiplicity adjustment. The adjusted confidence intervals could be wider than presented here. As such, confidence intervals are provided to illustrate the variability only and should not be used to draw any statistical conclusion. The trial was not powered to assess the difference between the two subgroups.
11.1.4.3 All-cause mortality by conduction disturbance requiring a permanent pacemaker post-TAVR
An analysis was performed for implanted TAVR subjects to investigate the relationship between all-cause mortality and permanent pacemaker implantation (PPI) through 30 days post TAVR (Figure 47). Similar rates between subjects without a PPI and subjects with a new PPI indicate that new-onset conduction disturbance and resultant PPI was not significantly associated with mortality in this study.
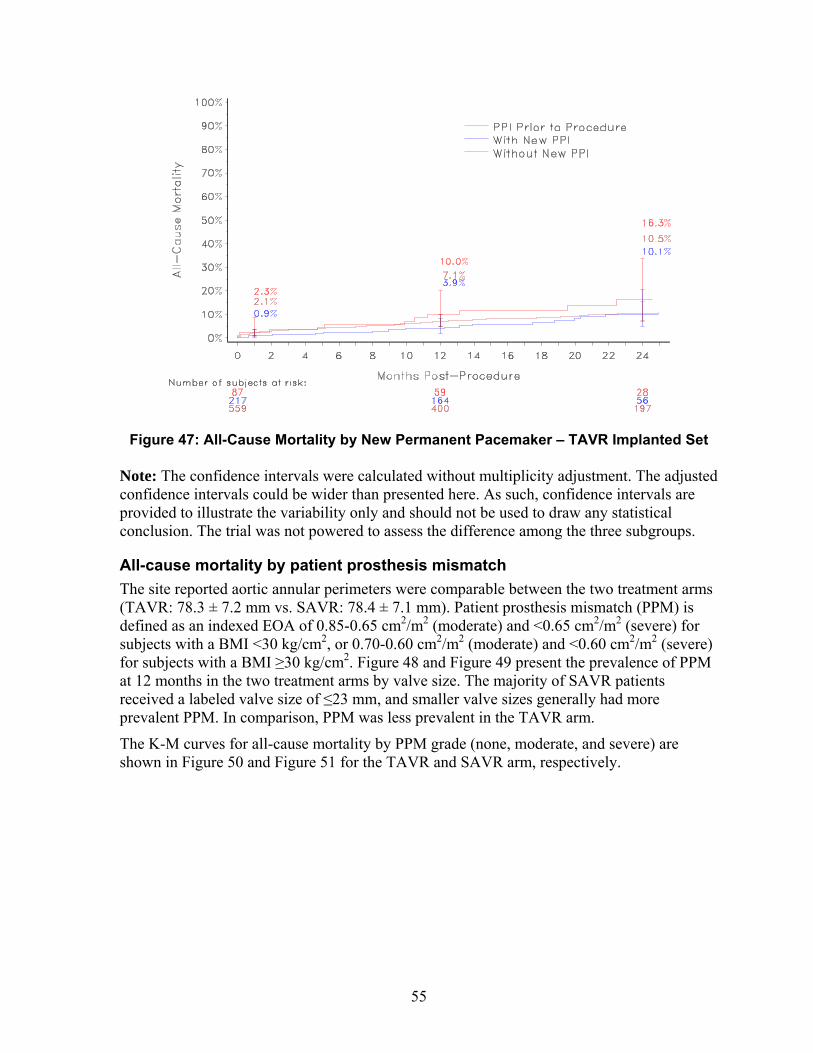
55
Figure 47: All-Cause Mortality by New Permanent Pacemaker – TAVR Implanted Set
Note: The confidence intervals were calculated without multiplicity adjustment. The adjusted confidence intervals could be wider than presented here. As such, confidence intervals are provided to illustrate the variability only and should not be used to draw any statistical conclusion. The trial was not powered to assess the difference among the three subgroups.
All-cause mortality by patient prosthesis mismatch
The site reported aortic annular perimeters were comparable between the two treatment arms (TAVR: 78.3 ± 7.2 mm vs. SAVR: 78.4 ± 7.1 mm). Patient prosthesis mismatch (PPM) is defined as an indexed EOA of 0.85-0.65 cm2/m2 (moderate) and <0.65 cm2/m2 (severe) for subjects with a BMI <30 kg/cm2, or 0.70-0.60 cm2/m2 (moderate) and <0.60 cm2/m2 (severe) for subjects with a BMI ≥30 kg/cm2. Figure 48 and Figure 49 present the prevalence of PPM at 12 months in the two treatment arms by valve size. The majority of SAVR patients received a labeled valve size of ≤23 mm, and smaller valve sizes generally had more prevalent PPM. In comparison, PPM was less prevalent in the TAVR arm.
The K-M curves for all-cause mortality by PPM grade (none, moderate, and severe) are shown in Figure 50 and Figure 51 for the TAVR and SAVR arm, respectively.
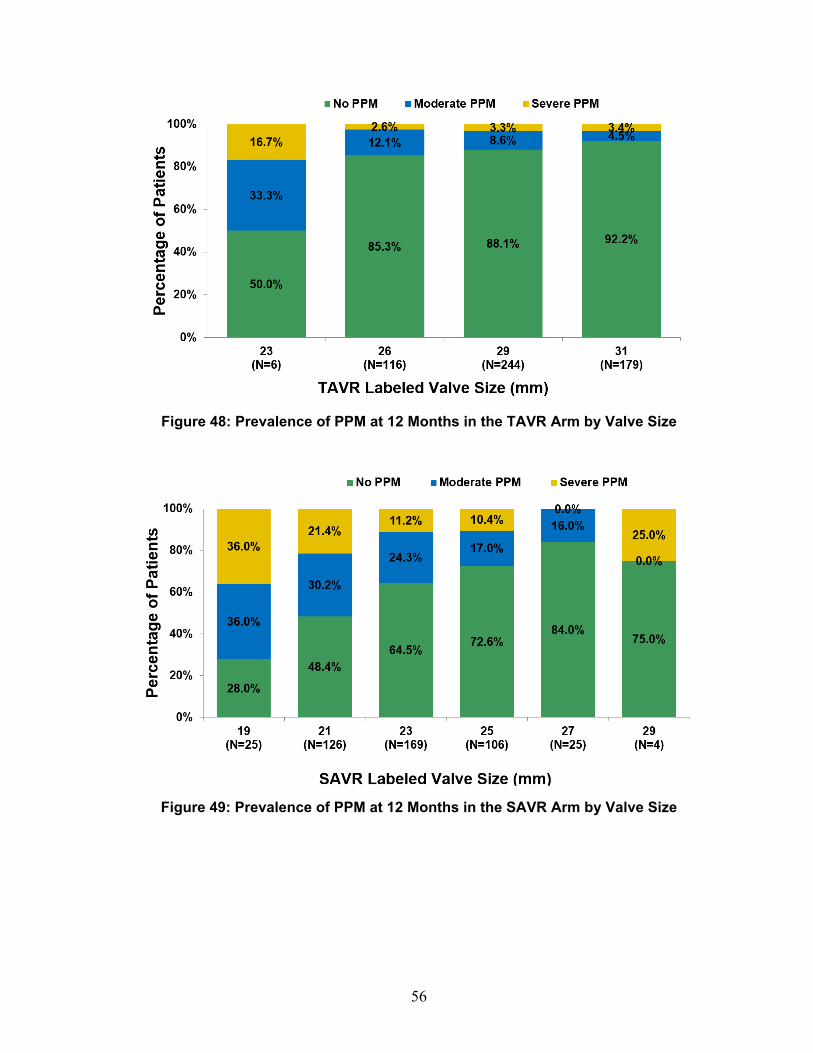
56
Figure 48: Prevalence of PPM at 12 Months in the TAVR Arm by Valve Size
Figure 49: Prevalence of PPM at 12 Months in the SAVR Arm by Valve Size

57
Figure 50: All-Cause Mortality by PPM - TAVR Implanted Population
Note: The confidence intervals were calculated without multiplicity adjustment. The adjusted confidence intervals could be wider than presented here. As such, confidence intervals are provided to illustrate the variability only and should not be used to draw any statistical conclusion. The trial was not powered to assess the difference among the three subgroups.
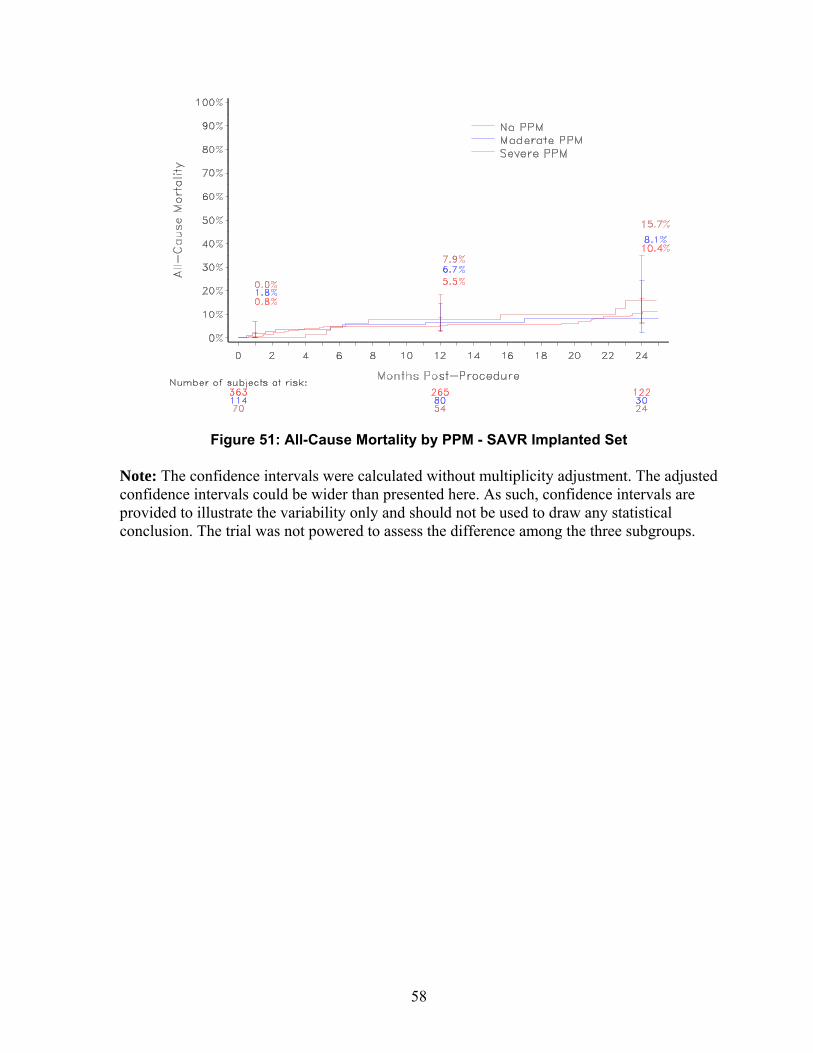
58
Figure 51: All-Cause Mortality by PPM - SAVR Implanted Set
Note: The confidence intervals were calculated without multiplicity adjustment. The adjusted confidence intervals could be wider than presented here. As such, confidence intervals are provided to illustrate the variability only and should not be used to draw any statistical conclusion. The trial was not powered to assess the difference among the three subgroups.
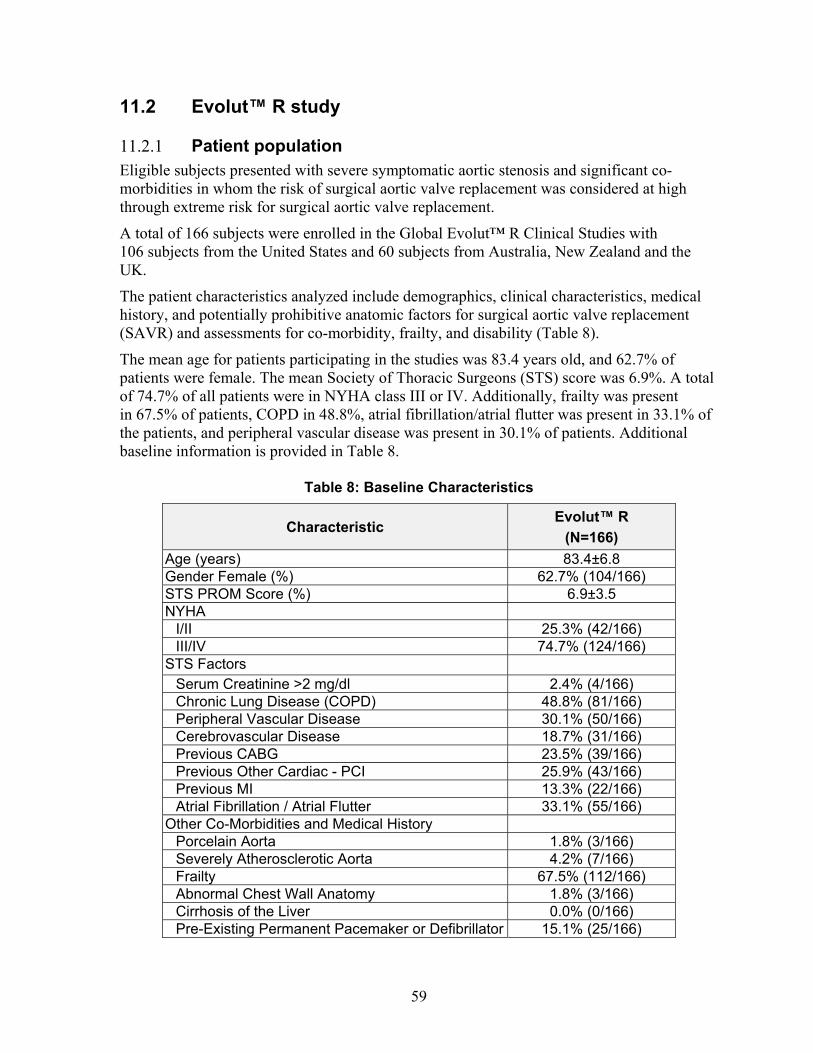
59
11.2 Evolut™ R study
Patient population 11.2.1Eligible subjects presented with severe symptomatic aortic stenosis and significant co-morbidities in whom the risk of surgical aortic valve replacement was considered at high through extreme risk for surgical aortic valve replacement.
A total of 166 subjects were enrolled in the Global Evolut™ R Clinical Studies with 106 subjects from the United States and 60 subjects from Australia, New Zealand and the UK.
The patient characteristics analyzed include demographics, clinical characteristics, medical history, and potentially prohibitive anatomic factors for surgical aortic valve replacement (SAVR) and assessments for co-morbidity, frailty, and disability (Table 8).
The mean age for patients participating in the studies was 83.4 years old, and 62.7% of patients were female. The mean Society of Thoracic Surgeons (STS) score was 6.9%. A total of 74.7% of all patients were in NYHA class III or IV. Additionally, frailty was present in 67.5% of patients, COPD in 48.8%, atrial fibrillation/atrial flutter was present in 33.1% of the patients, and peripheral vascular disease was present in 30.1% of patients. Additional baseline information is provided in Table 8.
Table 8: Baseline Characteristics
Characteristic Evolut™ R
(N=166)
Age (years) 83.4±6.8 Gender Female (%) 62.7% (104/166) STS PROM Score (%) 6.9±3.5 NYHA
I/II 25.3% (42/166) III/IV 74.7% (124/166)
STS Factors Serum Creatinine >2 mg/dl 2.4% (4/166) Chronic Lung Disease (COPD) 48.8% (81/166) Peripheral Vascular Disease 30.1% (50/166) Cerebrovascular Disease 18.7% (31/166) Previous CABG 23.5% (39/166) Previous Other Cardiac - PCI 25.9% (43/166) Previous MI 13.3% (22/166) Atrial Fibrillation / Atrial Flutter 33.1% (55/166)
Other Co-Morbidities and Medical History Porcelain Aorta 1.8% (3/166) Severely Atherosclerotic Aorta 4.2% (7/166) Frailty 67.5% (112/166) Abnormal Chest Wall Anatomy 1.8% (3/166) Cirrhosis of the Liver 0.0% (0/166) Pre-Existing Permanent Pacemaker or Defibrillator 15.1% (25/166)
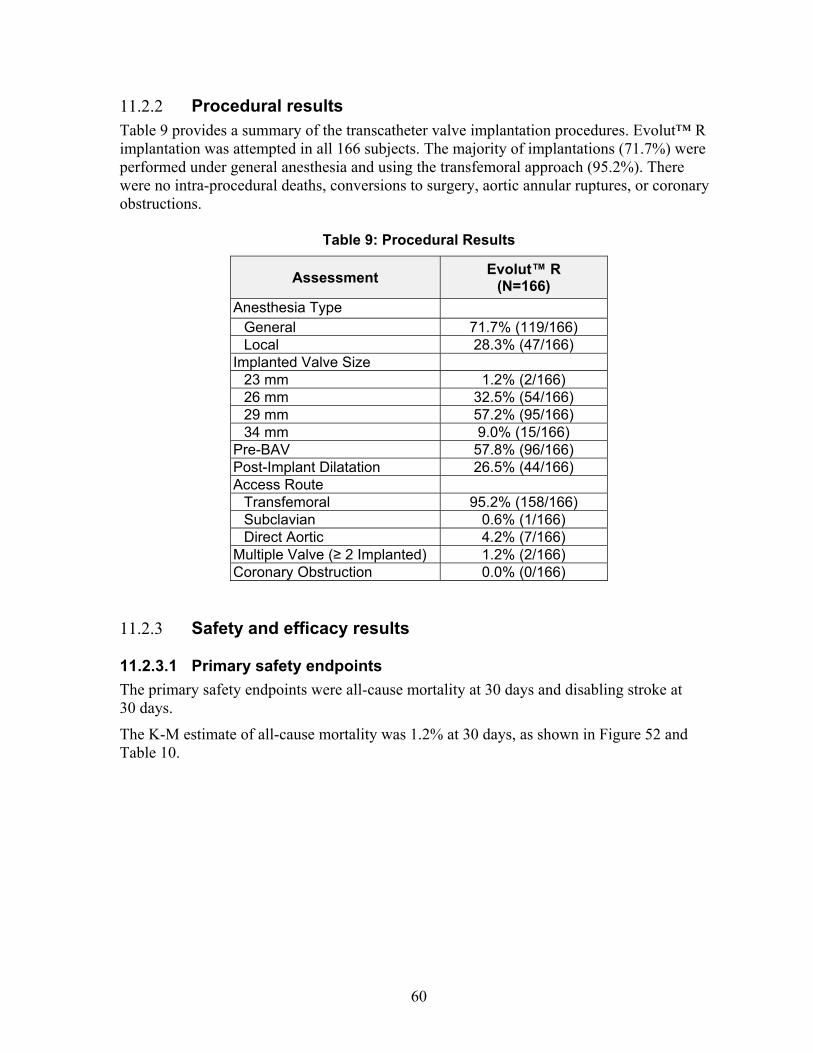
60
Procedural results 11.2.2Table 9 provides a summary of the transcatheter valve implantation procedures. Evolut™ R implantation was attempted in all 166 subjects. The majority of implantations (71.7%) were performed under general anesthesia and using the transfemoral approach (95.2%). There were no intra-procedural deaths, conversions to surgery, aortic annular ruptures, or coronary obstructions.
Table 9: Procedural Results
Assessment Evolut™ R
(N=166)
Anesthesia Type
General 71.7% (119/166) Local 28.3% (47/166)
Implanted Valve Size 23 mm 1.2% (2/166) 26 mm 32.5% (54/166) 29 mm 57.2% (95/166) 34 mm 9.0% (15/166)
Pre-BAV 57.8% (96/166) Post-Implant Dilatation 26.5% (44/166) Access Route
Transfemoral 95.2% (158/166) Subclavian 0.6% (1/166) Direct Aortic 4.2% (7/166)
Multiple Valve (≥ 2 Implanted) 1.2% (2/166) Coronary Obstruction 0.0% (0/166)
Safety and efficacy results 11.2.3
11.2.3.1 Primary safety endpoints
The primary safety endpoints were all-cause mortality at 30 days and disabling stroke at 30 days.
The K-M estimate of all-cause mortality was 1.2% at 30 days, as shown in Figure 52 and Table 10.

61
Figure 52: All-Cause Mortality
Note: The confidence intervals are calculated without multiplicity adjustment. The adjusted confidence intervals could be wider than presented here. As such, confidence intervals are provided to illustrate the variability only and should not be used to draw any statistical conclusion. Note the 6-month and 12-month data are incomplete at this time and the data collection is ongoing.
Table 10: All-Cause Mortality
Evolut™ R
(N=166)
30 Days 6 Months 12 Months
Number at Risk 164 140 126
# Subjects (# Events) 2 (2) 8 (8) 12 (12)
K-M Rate (%) 1.2% 5.2% 8.0%
Two-Sided 95% CI 0.3% - 4.7% 2.6% - 10.3% 4.5% - 14.0%
The K-M estimate of disabling stroke was 3.0% at 30 days, as shown in Figure 53 and Table 11.
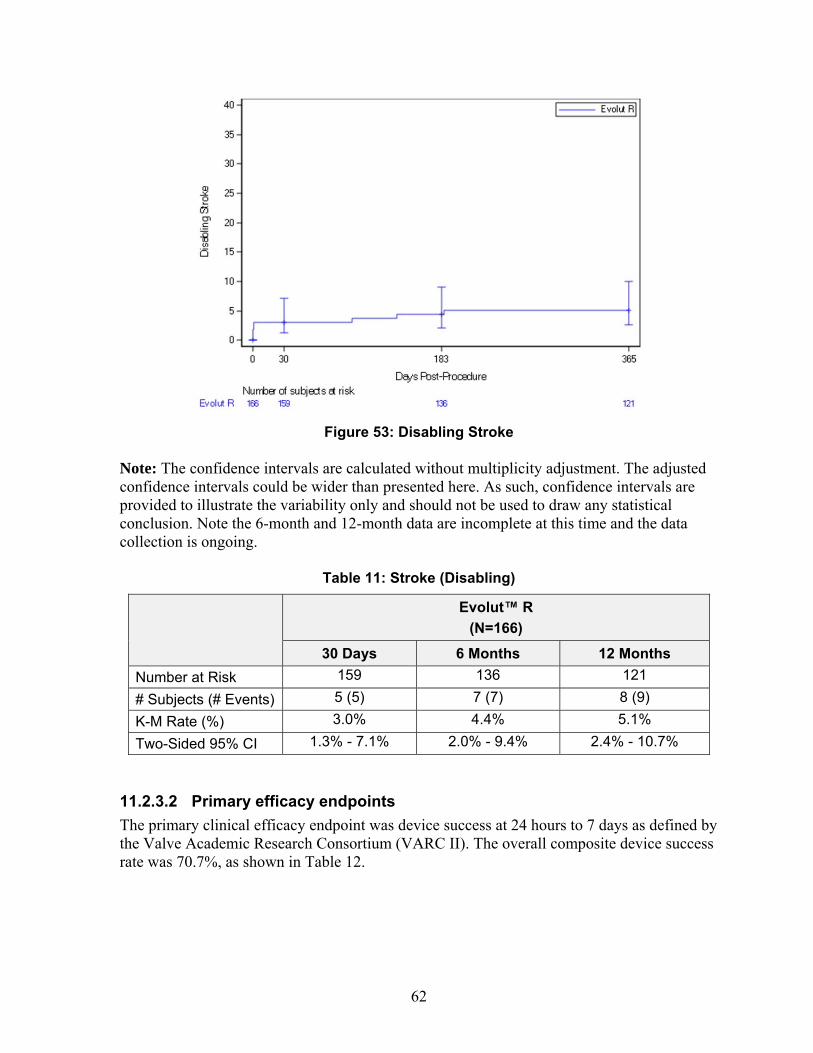
62
Figure 53: Disabling Stroke
Note: The confidence intervals are calculated without multiplicity adjustment. The adjusted confidence intervals could be wider than presented here. As such, confidence intervals are provided to illustrate the variability only and should not be used to draw any statistical conclusion. Note the 6-month and 12-month data are incomplete at this time and the data collection is ongoing.
Table 11: Stroke (Disabling)
Evolut™ R
(N=166)
30 Days 6 Months 12 Months
Number at Risk 159 136 121
# Subjects (# Events) 5 (5) 7 (7) 8 (9)
K-M Rate (%) 3.0% 4.4% 5.1%
Two-Sided 95% CI 1.3% - 7.1% 2.0% - 9.4% 2.4% - 10.7%
11.2.3.2 Primary efficacy endpoints
The primary clinical efficacy endpoint was device success at 24 hours to 7 days as defined by the Valve Academic Research Consortium (VARC II). The overall composite device success rate was 70.7%, as shown in Table 12.

63
Table 12: Device Success Rate – VARC II
Device Success (24 hours to 7 days)
(N=166)
Absence of Procedural Mortality 98.8% (164/166) Correct Positioning of Single Valve in Proper Anatomical Location 98.8% (164/166) Intended Performance of Prosthetic Heart Valve 71.8% (107/149)
Absence of Patient Prosthesis Mismatch 74.8% (110/147) Mean Gradient < 20 mmHg or Peak Velocity < 3 m/sec 98.8% (161/163) Absence of Moderate or Severe Prosthetic Regurgitation 94.5% (156/165)
Overall Device Success 70.7% (106/150)
The second primary clinical efficacy endpoint was the percentage of subjects with no more than mild aortic regurgitation at early post procedure echocardiogram (24 hours to 7 days). The result for this endpoint was 94.5% (refer to Table 15 for additional hemodynamic performance results).
11.2.3.3 Comparison of primary endpoints to historical control rates
The Evolut™ R study endpoints were intended to confirm the changes and features incorporated in the Evolut™ R system did not adversely affect safety and clinical performance characteristics of the predecessor CoreValve™ system. Table 13 summarizes the results for the primary endpoints, along with the corresponding historical control rates, which were established through data from the U.S. CoreValve™ Extreme and High Risk clinical studies, and a review of the contemporary published literature on the Medtronic CoreValve™ system. The results confirmed that the Evolut™ R system performed comparably with the CoreValve™ system.
Table 13: Primary Endpoints
Endpoint Historical
Control Rates Evolut™ R
Result
All-cause mortality at 30 days 7.3% 1.2% Disabling stroke at 30 days 3.3% 3.0% Device Success 73.2% 70.7% % with ≤ mild AR at early post procedure echo 84.4% 94.5%
11.2.3.4 Additional safety endpoints
Table 14 provides a summary of the adverse events (AEs) that occurred in this study. Bleeding complications and major vascular access site and access-related complications were the most frequently observed early adverse events.
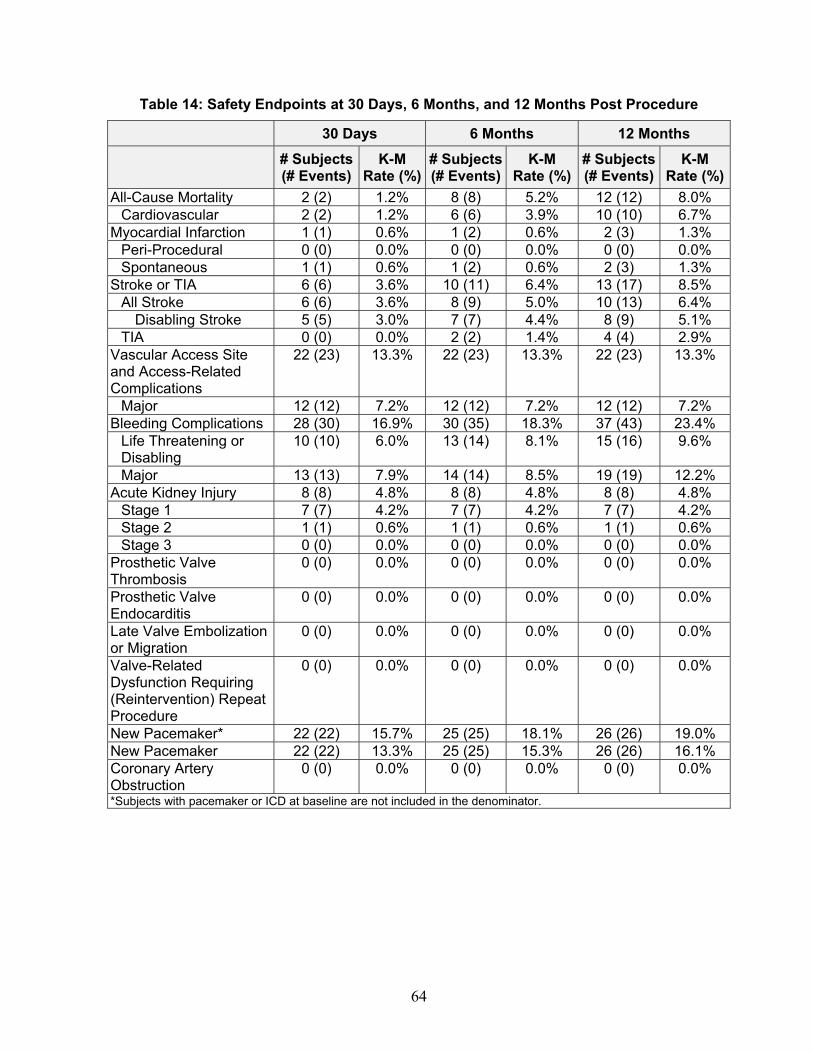
64
Table 14: Safety Endpoints at 30 Days, 6 Months, and 12 Months Post Procedure
30 Days 6 Months 12 Months
# Subjects(# Events)
K-M Rate (%)
# Subjects(# Events)
K-M Rate (%)
# Subjects(# Events)
K-M Rate (%)
All-Cause Mortality 2 (2) 1.2% 8 (8) 5.2% 12 (12) 8.0% Cardiovascular 2 (2) 1.2% 6 (6) 3.9% 10 (10) 6.7%
Myocardial Infarction 1 (1) 0.6% 1 (2) 0.6% 2 (3) 1.3% Peri-Procedural 0 (0) 0.0% 0 (0) 0.0% 0 (0) 0.0% Spontaneous 1 (1) 0.6% 1 (2) 0.6% 2 (3) 1.3%
Stroke or TIA 6 (6) 3.6% 10 (11) 6.4% 13 (17) 8.5% All Stroke 6 (6) 3.6% 8 (9) 5.0% 10 (13) 6.4%
Disabling Stroke 5 (5) 3.0% 7 (7) 4.4% 8 (9) 5.1% TIA 0 (0) 0.0% 2 (2) 1.4% 4 (4) 2.9%
Vascular Access Site and Access-Related Complications
22 (23) 13.3% 22 (23) 13.3% 22 (23) 13.3%
Major 12 (12) 7.2% 12 (12) 7.2% 12 (12) 7.2% Bleeding Complications 28 (30) 16.9% 30 (35) 18.3% 37 (43) 23.4%
Life Threatening or Disabling
10 (10) 6.0% 13 (14) 8.1% 15 (16) 9.6%
Major 13 (13) 7.9% 14 (14) 8.5% 19 (19) 12.2% Acute Kidney Injury 8 (8) 4.8% 8 (8) 4.8% 8 (8) 4.8%
Stage 1 7 (7) 4.2% 7 (7) 4.2% 7 (7) 4.2% Stage 2 1 (1) 0.6% 1 (1) 0.6% 1 (1) 0.6% Stage 3 0 (0) 0.0% 0 (0) 0.0% 0 (0) 0.0%
Prosthetic Valve Thrombosis
0 (0) 0.0% 0 (0) 0.0% 0 (0) 0.0%
Prosthetic Valve Endocarditis
0 (0) 0.0% 0 (0) 0.0% 0 (0) 0.0%
Late Valve Embolization or Migration
0 (0) 0.0% 0 (0) 0.0% 0 (0) 0.0%
Valve-Related Dysfunction Requiring (Reintervention) Repeat Procedure
0 (0) 0.0% 0 (0) 0.0% 0 (0) 0.0%
New Pacemaker* 22 (22) 15.7% 25 (25) 18.1% 26 (26) 19.0% New Pacemaker 22 (22) 13.3% 25 (25) 15.3% 26 (26) 16.1% Coronary Artery Obstruction
0 (0) 0.0% 0 (0) 0.0% 0 (0) 0.0%
*Subjects with pacemaker or ICD at baseline are not included in the denominator.
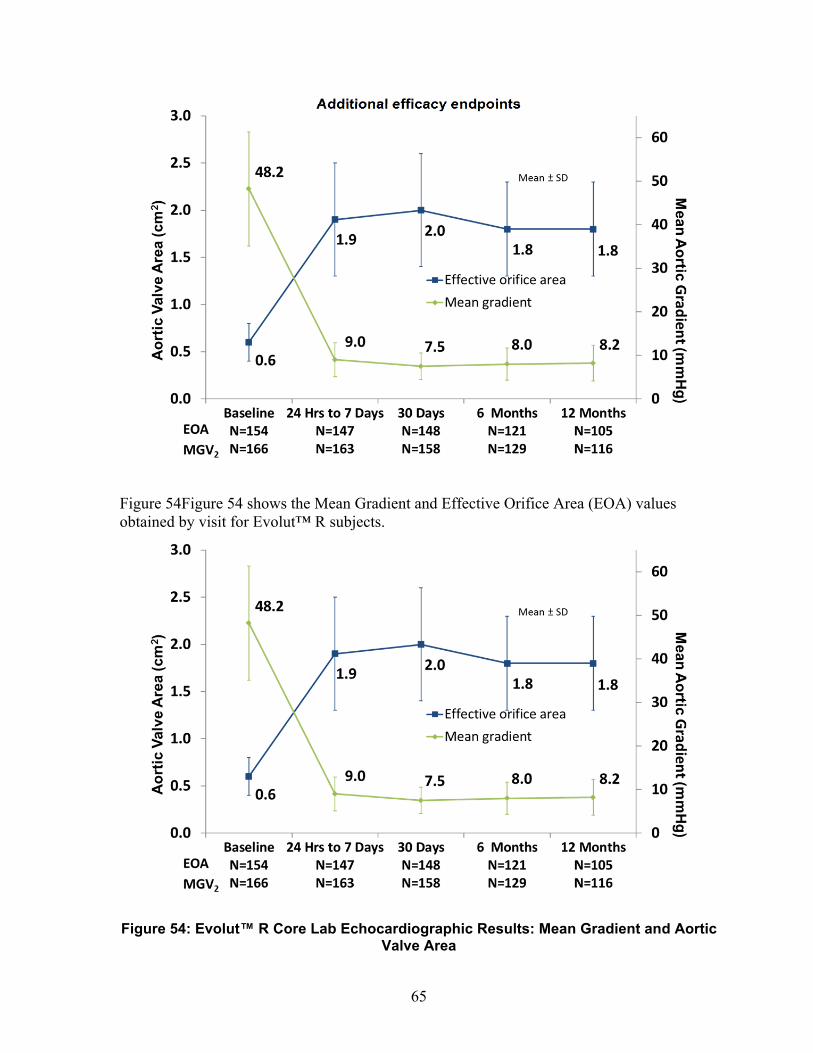
65
Additional efficacy endpoints
Figure 54Figure 54 shows the Mean Gradient and Effective Orifice Area (EOA) values obtained by visit for Evolut™ R subjects.
Figure 54: Evolut™ R Core Lab Echocardiographic Results: Mean Gradient and Aortic Valve Area
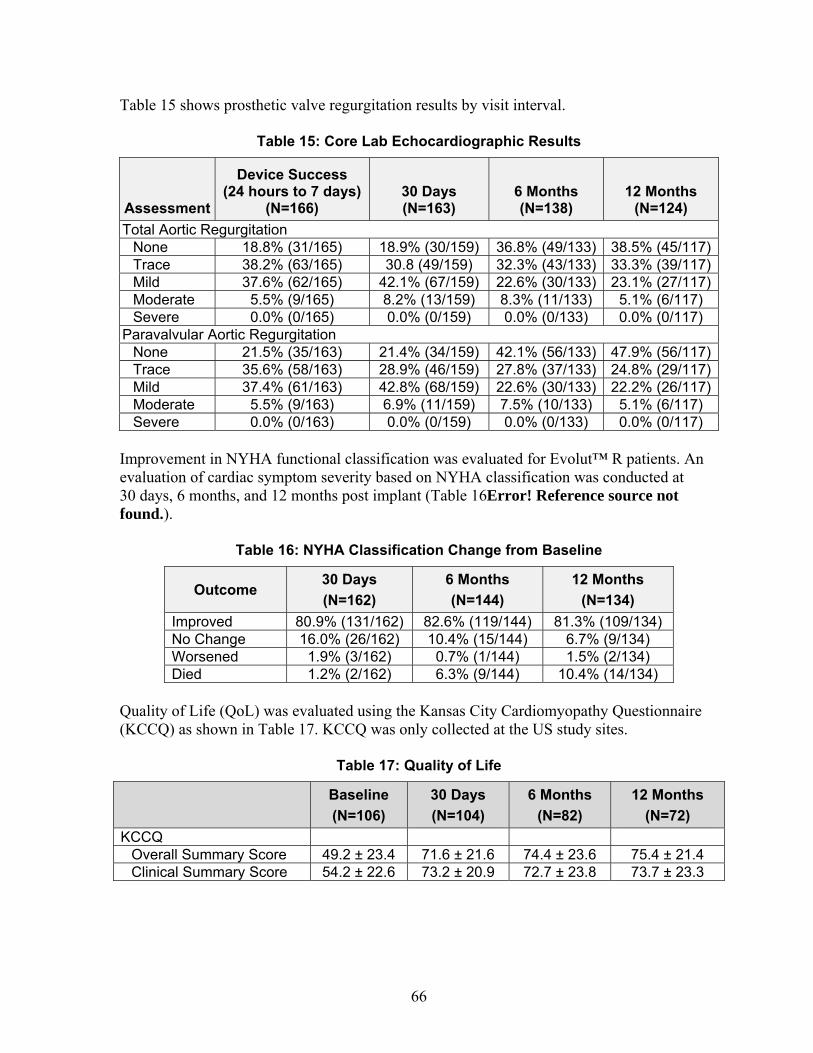
66
Table 15 shows prosthetic valve regurgitation results by visit interval.
Table 15: Core Lab Echocardiographic Results
Assessment
Device Success (24 hours to 7 days)
(N=166) 30 Days (N=163)
6 Months (N=138)
12 Months (N=124)
Total Aortic Regurgitation None 18.8% (31/165) 18.9% (30/159) 36.8% (49/133) 38.5% (45/117)Trace 38.2% (63/165) 30.8 (49/159) 32.3% (43/133) 33.3% (39/117)Mild 37.6% (62/165) 42.1% (67/159) 22.6% (30/133) 23.1% (27/117)Moderate 5.5% (9/165) 8.2% (13/159) 8.3% (11/133) 5.1% (6/117) Severe 0.0% (0/165) 0.0% (0/159) 0.0% (0/133) 0.0% (0/117)
Paravalvular Aortic Regurgitation None 21.5% (35/163) 21.4% (34/159) 42.1% (56/133) 47.9% (56/117)Trace 35.6% (58/163) 28.9% (46/159) 27.8% (37/133) 24.8% (29/117)Mild 37.4% (61/163) 42.8% (68/159) 22.6% (30/133) 22.2% (26/117)Moderate 5.5% (9/163) 6.9% (11/159) 7.5% (10/133) 5.1% (6/117) Severe 0.0% (0/163) 0.0% (0/159) 0.0% (0/133) 0.0% (0/117)
Improvement in NYHA functional classification was evaluated for Evolut™ R patients. An evaluation of cardiac symptom severity based on NYHA classification was conducted at 30 days, 6 months, and 12 months post implant (Table 16Error! Reference source not found.).
Table 16: NYHA Classification Change from Baseline
Outcome 30 Days
(N=162)
6 Months
(N=144)
12 Months
(N=134)
Improved 80.9% (131/162) 82.6% (119/144) 81.3% (109/134) No Change 16.0% (26/162) 10.4% (15/144) 6.7% (9/134) Worsened 1.9% (3/162) 0.7% (1/144) 1.5% (2/134) Died 1.2% (2/162) 6.3% (9/144) 10.4% (14/134)
Quality of Life (QoL) was evaluated using the Kansas City Cardiomyopathy Questionnaire (KCCQ) as shown in Table 17. KCCQ was only collected at the US study sites.
Table 17: Quality of Life
Baseline
(N=106)
30 Days
(N=104)
6 Months
(N=82)
12 Months
(N=72)
KCCQ Overall Summary Score 49.2 ± 23.4 71.6 ± 21.6 74.4 ± 23.6 75.4 ± 21.4 Clinical Summary Score 54.2 ± 22.6 73.2 ± 20.9 72.7 ± 23.8 73.7 ± 23.3
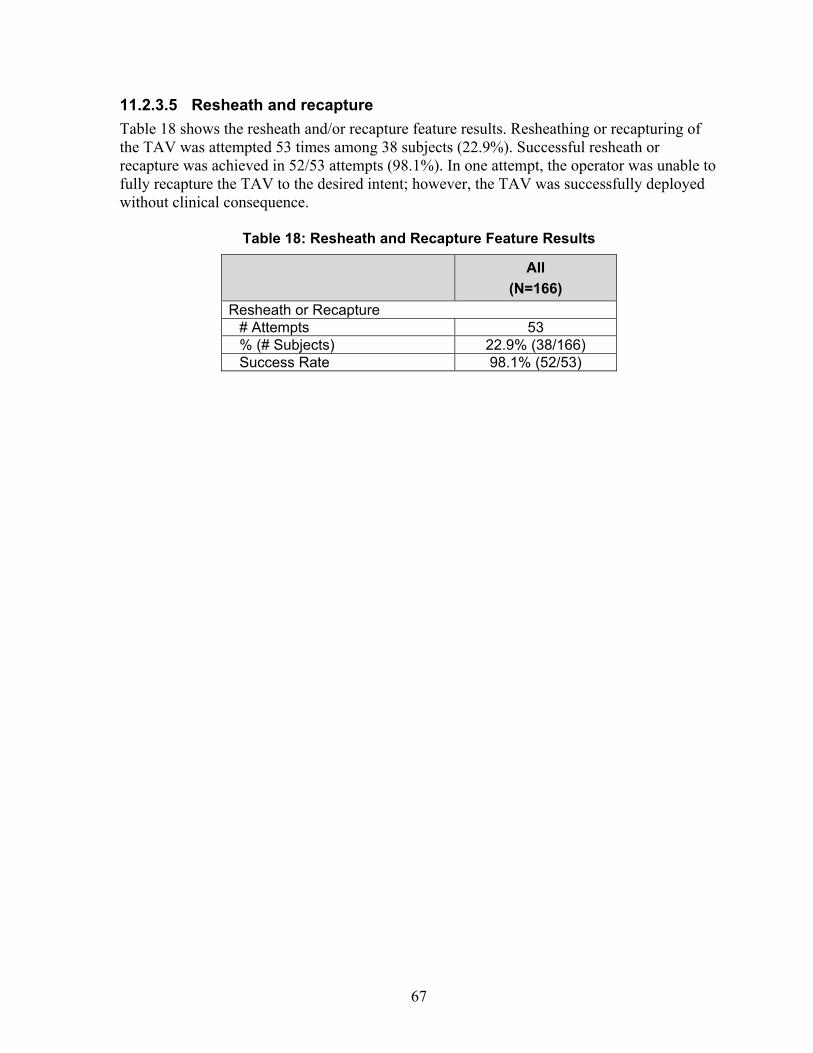
67
11.2.3.5 Resheath and recapture
Table 18 shows the resheath and/or recapture feature results. Resheathing or recapturing of the TAV was attempted 53 times among 38 subjects (22.9%). Successful resheath or recapture was achieved in 52/53 attempts (98.1%). In one attempt, the operator was unable to fully recapture the TAV to the desired intent; however, the TAV was successfully deployed without clinical consequence.
Table 18: Resheath and Recapture Feature Results
All
(N=166)
Resheath or Recapture # Attempts 53 % (# Subjects) 22.9% (38/166) Success Rate 98.1% (52/53)
68
12.0 Disclaimer of warranty
The Following Disclaimer of Warranty Applies to United States Customers Only:
DISCLAIMER OF WARRANTY
ALTHOUGH THE MEDTRONIC COREVALVE™ EVOLUT™ R TRANSCATHETER AORTIC VALVE (MODELS EVOLUTR-23-US, EVOLUTR-26-US, EVOLUTR-29-US, AND EVOLUTR-34-US), ENVEO™ R DELIVERY CATHETER SYSTEM (MODELS ENVEOR-US AND ENVEOR-N-US) AND ENVEO™ R LOADING SYSTEM (MODELS LS-ENVEOR23US, LS-ENVEOR2629US, AND LS-ENVEOR-34-US), HEREAFTER REFERRED TO AS “PRODUCT”, HAVE BEEN MANUFACTURED UNDER CAREFULLY CONTROLLED CONDITIONS, MEDTRONIC HAS NO CONTROL OVER THE CONDITIONS UNDER WHICH THIS PRODUCT IS USED. MEDTRONIC THEREFORE DISCLAIMS ALL WARRANTIES, BOTH EXPRESS AND IMPLIED, WITH RESPECT TO THE PRODUCT, INCLUDING, BUT NOT LIMITED TO, ANY IMPLIED WARRANTY OF MERCHANTABILITY OR FITNESS FOR A PARTICULAR PURPOSE. MEDTRONIC SHALL NOT BE LIABLE TO ANY PERSON OR ENTITY FOR ANY MEDICAL EXPENSES OR ANY DIRECT, INCIDENTAL OR CONSEQUENTIAL DAMAGES CAUSED BY ANY USE, DEFECT, FAILURE OR MALFUNCTION OF THE PRODUCT, WHETHER A CLAIM FOR SUCH DAMAGES IS BASED UPON WARRANTY, CONTRACT, TORT OR OTHERWISE. NO PERSON HAS ANY AUTHORITY TO BIND MEDTRONIC TO ANY REPRESENTATION OR WARRANTY WITH RESPECT TO THE PRODUCT.
The exclusions and limitations set out above are not intended to, and should not be construed so as to, contravene mandatory provisions of applicable law. If any part or term of this DISCLAIMER OF WARRANTY is held by any court of competent jurisdiction to be illegal, unenforceable or in conflict with applicable law, the validity of the remaining portion of the DISCLAIMER OF WARRANTY shall not be affected, and all rights and obligations shall be construed and enforced as if this DISCLAIMER OF WARRANTY did not contain the particular part or term held to be invalid.

Manufacturer: Medtronic CoreValve LLC 1851 E Deere Avenue Santa Ana, CA 92705 USA www.medtronic.com +1 763 514 4000 LifeLine Technical Support, 24-hour consultation service: 1 877 526 7890
Protected by one or more of the following United States Patents: 8,226,710 and 7,914,569.
*M056© 2017 Medtronic
M056197T001 Rev. 1G

197T001*
CoreValve™ Evolut™ PRO System
CoreValve™ Evolut™ PRO Transcatheter Aortic Valve
EnVeo™ R Delivery Catheter System
EnVeo™ R Loading System
Caution: Implantation of the Medtronic CoreValve™ Evolut™ PRO system should be performed only by physicians who have received Medtronic CoreValve™ Evolut™ PRO training.
These devices are supplied sterile for single use only. After use, dispose of the delivery catheter system and the loading system in accordance with local regulations and hospital procedures. Do not resterilize.
Instructions for Use
Caution: Federal (USA) law restricts this device to sale by or on the order of a physician.

Trademarks may be registered and are the property of their respective owners.
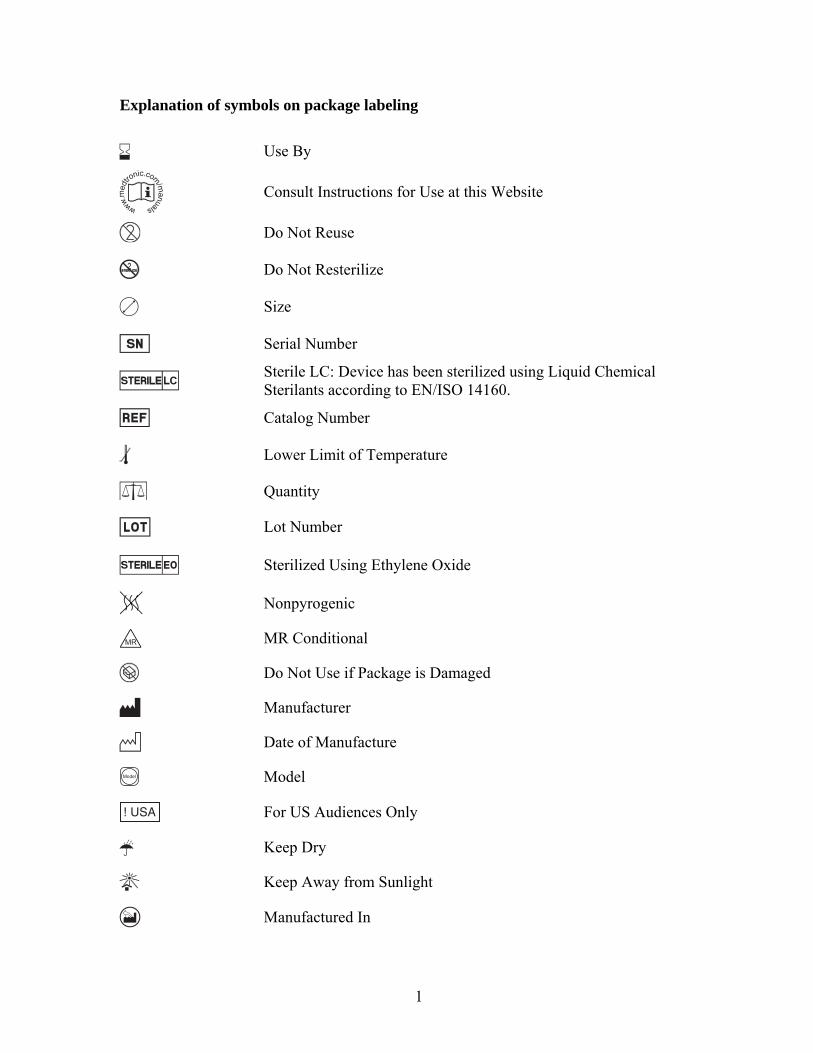
1
Explanation of symbols on package labeling
Use By
Consult Instructions for Use at this Website
Do Not Reuse
Do Not Resterilize
Size
Serial Number
Sterile LC: Device has been sterilized using Liquid Chemical Sterilants according to EN/ISO 14160.
Catalog Number
Lower Limit of Temperature
Quantity
Lot Number
Sterilized Using Ethylene Oxide
Nonpyrogenic
MR Conditional
Do Not Use if Package is Damaged
Manufacturer
Date of Manufacture
Model
For US Audiences Only
Keep Dry
Keep Away from Sunlight
Manufactured In

2
Maximum Guidewire Diameter
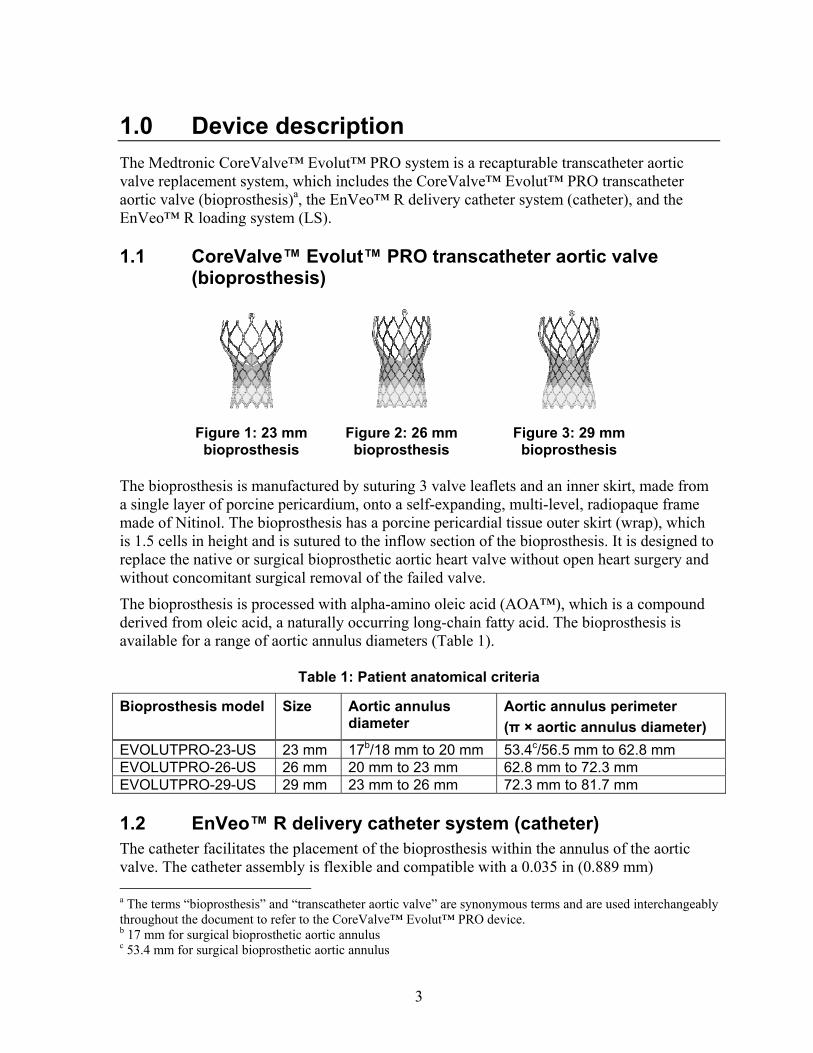
3
1.0 Device description
The Medtronic CoreValve™ Evolut™ PRO system is a recapturable transcatheter aortic valve replacement system, which includes the CoreValve™ Evolut™ PRO transcatheter aortic valve (bioprosthesis)a, the EnVeo™ R delivery catheter system (catheter), and the EnVeo™ R loading system (LS).
1.1 CoreValve™ Evolut™ PRO transcatheter aortic valve (bioprosthesis)
Figure 1: 23 mm bioprosthesis
Figure 2: 26 mm bioprosthesis
Figure 3: 29 mm bioprosthesis
The bioprosthesis is manufactured by suturing 3 valve leaflets and an inner skirt, made from a single layer of porcine pericardium, onto a self-expanding, multi-level, radiopaque frame made of Nitinol. The bioprosthesis has a porcine pericardial tissue outer skirt (wrap), which is 1.5 cells in height and is sutured to the inflow section of the bioprosthesis. It is designed to replace the native or surgical bioprosthetic aortic heart valve without open heart surgery and without concomitant surgical removal of the failed valve.
The bioprosthesis is processed with alpha-amino oleic acid (AOA™), which is a compound derived from oleic acid, a naturally occurring long-chain fatty acid. The bioprosthesis is available for a range of aortic annulus diameters (Table 1).
Table 1: Patient anatomical criteria
Bioprosthesis model Size Aortic annulus diameter
Aortic annulus perimeter
(π × aortic annulus diameter)
EVOLUTPRO-23-US 23 mm 17b/18 mm to 20 mm 53.4c/56.5 mm to 62.8 mm EVOLUTPRO-26-US 26 mm 20 mm to 23 mm 62.8 mm to 72.3 mm EVOLUTPRO-29-US 29 mm 23 mm to 26 mm 72.3 mm to 81.7 mm
1.2 EnVeo™ R delivery catheter system (catheter) The catheter facilitates the placement of the bioprosthesis within the annulus of the aortic valve. The catheter assembly is flexible and compatible with a 0.035 in (0.889 mm) a The terms “bioprosthesis” and “transcatheter aortic valve” are synonymous terms and are used interchangeably throughout the document to refer to the CoreValve™ Evolut™ PRO device. b 17 mm for surgical bioprosthetic aortic annulus c 53.4 mm for surgical bioprosthetic aortic annulus
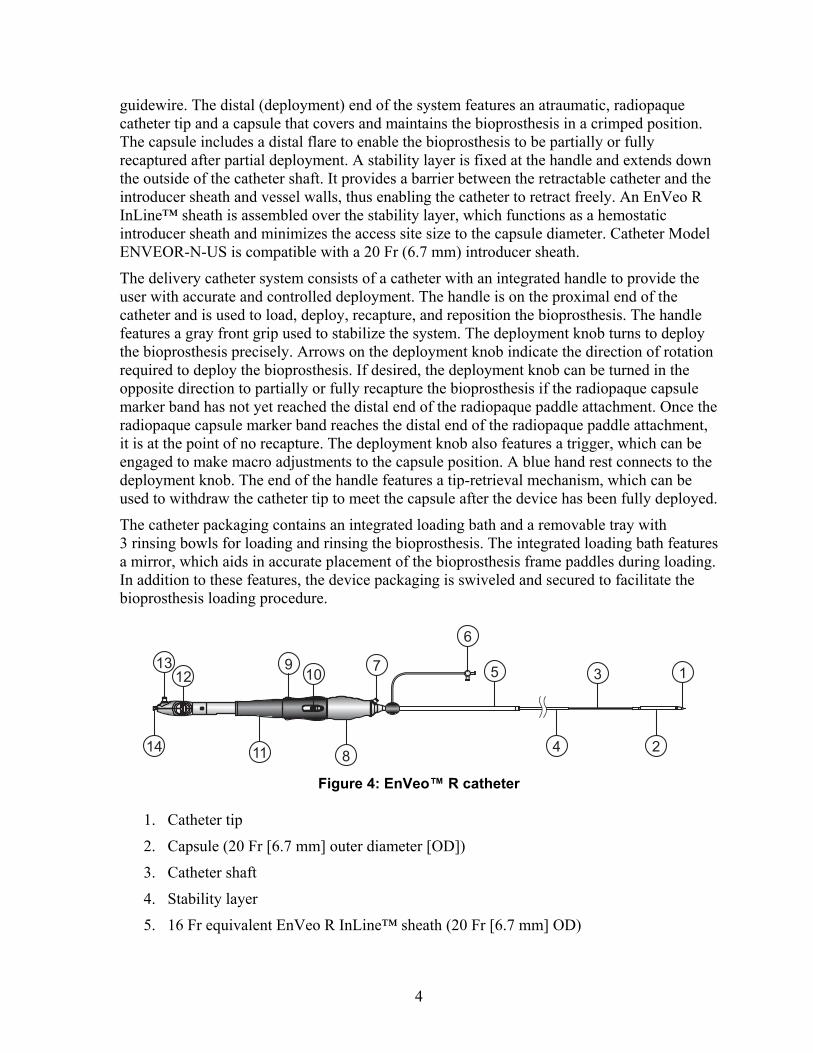
4
guidewire. The distal (deployment) end of the system features an atraumatic, radiopaque catheter tip and a capsule that covers and maintains the bioprosthesis in a crimped position. The capsule includes a distal flare to enable the bioprosthesis to be partially or fully recaptured after partial deployment. A stability layer is fixed at the handle and extends down the outside of the catheter shaft. It provides a barrier between the retractable catheter and the introducer sheath and vessel walls, thus enabling the catheter to retract freely. An EnVeo R InLine™ sheath is assembled over the stability layer, which functions as a hemostatic introducer sheath and minimizes the access site size to the capsule diameter. Catheter Model ENVEOR-N-US is compatible with a 20 Fr (6.7 mm) introducer sheath.
The delivery catheter system consists of a catheter with an integrated handle to provide the user with accurate and controlled deployment. The handle is on the proximal end of the catheter and is used to load, deploy, recapture, and reposition the bioprosthesis. The handle features a gray front grip used to stabilize the system. The deployment knob turns to deploy the bioprosthesis precisely. Arrows on the deployment knob indicate the direction of rotation required to deploy the bioprosthesis. If desired, the deployment knob can be turned in the opposite direction to partially or fully recapture the bioprosthesis if the radiopaque capsule marker band has not yet reached the distal end of the radiopaque paddle attachment. Once the radiopaque capsule marker band reaches the distal end of the radiopaque paddle attachment, it is at the point of no recapture. The deployment knob also features a trigger, which can be engaged to make macro adjustments to the capsule position. A blue hand rest connects to the deployment knob. The end of the handle features a tip-retrieval mechanism, which can be used to withdraw the catheter tip to meet the capsule after the device has been fully deployed.
The catheter packaging contains an integrated loading bath and a removable tray with 3 rinsing bowls for loading and rinsing the bioprosthesis. The integrated loading bath features a mirror, which aids in accurate placement of the bioprosthesis frame paddles during loading. In addition to these features, the device packaging is swiveled and secured to facilitate the bioprosthesis loading procedure.
135
6
7109
1213
14 11 8 4 2
Figure 4: EnVeo™ R catheter
1. Catheter tip
2. Capsule (20 Fr [6.7 mm] outer diameter [OD])
3. Catheter shaft
4. Stability layer
5. 16 Fr equivalent EnVeo R InLine™ sheath (20 Fr [6.7 mm] OD)
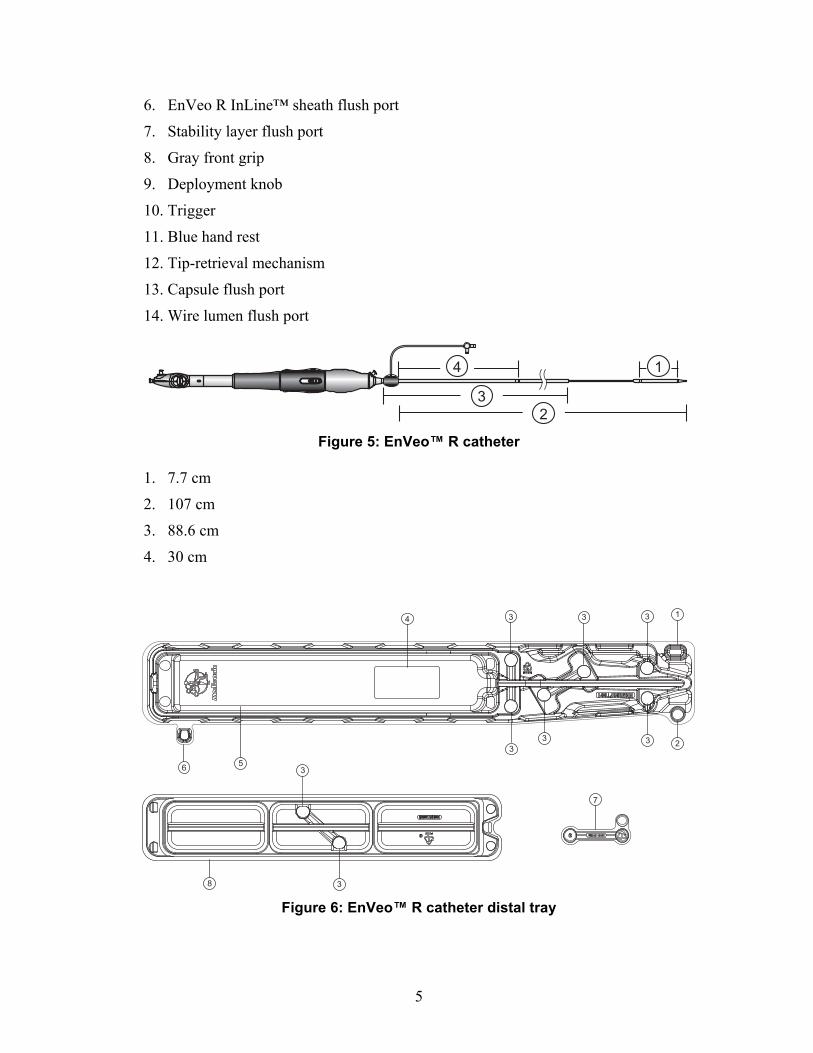
5
6. EnVeo R InLine™ sheath flush port
7. Stability layer flush port
8. Gray front grip
9. Deployment knob
10. Trigger
11. Blue hand rest
12. Tip-retrieval mechanism
13. Capsule flush port
14. Wire lumen flush port
1
32
4
Figure 5: EnVeo™ R catheter
1. 7.7 cm
2. 107 cm
3. 88.6 cm
4. 30 cm
3
3
2
1
7
33
356
8
3 334
Figure 6: EnVeo™ R catheter distal tray

6
9
3
1
3
2
Figure 7: EnVeo™ R catheter proximal tray
1. Tray connector
2. Swivel hinge
3. Clip holder
4. Mirror
5. Integrated loading bath
6. Tray tab
7. Locking clip
8. Rinsing bowls
9. Tray tab holder
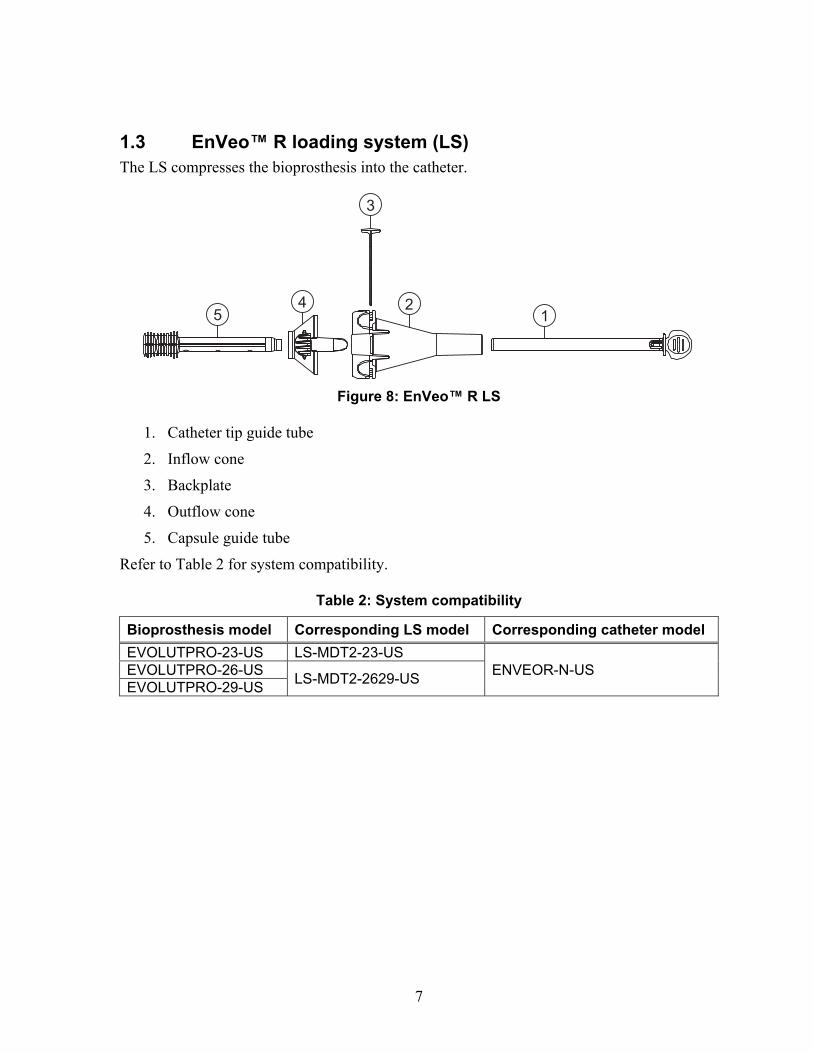
7
1.3 EnVeo™ R loading system (LS) The LS compresses the bioprosthesis into the catheter.
12
3
45
Figure 8: EnVeo™ R LS
1. Catheter tip guide tube
2. Inflow cone
3. Backplate
4. Outflow cone
5. Capsule guide tube
Refer to Table 2 for system compatibility.
Table 2: System compatibility
Bioprosthesis model Corresponding LS model Corresponding catheter model
EVOLUTPRO-23-US LS-MDT2-23-US ENVEOR-N-US EVOLUTPRO-26-US
LS-MDT2-2629-US EVOLUTPRO-29-US
8
2.0 Indications
The Medtronic CoreValve™ Evolut™ PRO system is indicated for relief of aortic stenosis in patients with symptomatic heart disease due to severe native calcific aortic stenosis who are judged by a heart team, including a cardiac surgeon, to be at intermediate or greater risk for open surgical therapy (i.e., predicted risk of surgical mortality ≥ 3% at 30 days, based on the Society of Thoracic Surgeons (STS) risk score and other clinical comorbidities unmeasured by the STS risk calculator).
The Medtronic CoreValve™ Evolut™ PRO system is indicated for use in patients with symptomatic heart disease due to failure (stenosed, insufficient, or combined) of a surgical bioprosthetic aortic valve who are judged by a heart team, including a cardiac surgeon, to be at high or greater risk for open surgical therapy (i.e., STS predicted risk of operative mortality score ≥8% or at a ≥15% risk of mortality at 30 days).
9
3.0 Contraindications
The CoreValve™ Evolut™ PRO system is contraindicated for patients presenting with any of the following conditions:
Known hypersensitivity or contraindication to aspirin, heparin (HIT/HITTS) and bivalirudin, ticlopidine, clopidogrel, Nitinol (Titanium or Nickel), or sensitivity to contrast media, which cannot be adequately premedicated
Ongoing sepsis, including active endocarditis
Preexisting mechanical heart valve in aortic position

10
4.0 Warnings and precautions
Carefully read all warnings, precautions, and instructions for use for all components of the system before use. Failure to read and follow all instructions or failure to observe all stated warnings could cause serious injury or death to the patient.
4.1 Warnings
General
Implantation of the Medtronic CoreValve™ Evolut™ PRO system should be performed only by physicians who have received Medtronic CoreValve™ Evolut™ PRO training.
The transcatheter aortic valve is to be used only in conjunction with the delivery catheter system and the loading system.
This procedure should only be performed where emergency aortic valve surgery can be performed promptly.
Do not use any of the Medtronic CoreValve™ Evolut™ PRO system components if any of the following has occurred:
It has been dropped, damaged, or mishandled in any way
The Use By date has elapsed
Mechanical failure of the delivery catheter system and/or accessories may result in patient complications.
Transcatheter aortic valve (bioprosthesis)
Do not use the bioprosthesis if any of the following conditions is observed:
There is any damage to the container (for example, cracked jar or lid, leakage, broken or missing seals)
The serial number tag does not match the container label
The freeze indicator in the secondary package has activated
The storage solution does not completely cover the bioprosthesis
Accelerated deterioration of the bioprosthesis may occur in patients presenting with an altered calcium metabolism.
4.2 Precautions
General
Do not contact any of the Medtronic CoreValve™ Evolut™ PRO system components with cotton or cotton swabs.
Do not expose any of the Medtronic CoreValve™ Evolut™ PRO system components to organic solvents, such as alcohol.

11
Do not introduce air into the catheter.
Do not expose the bioprosthesis to solutions other than the storage and rinse solutions.
Do not add antibiotics or any other substance to either the storage or rinse solutions. Do not apply antibiotics or any other substance to the bioprosthesis.
Do not allow the bioprosthesis to dry. Maintain tissue moisture with irrigation or immersion.
Do not attempt to repair a damaged bioprosthesis.
Do not handle or use forceps to manipulate the bioprosthesis leaflet tissue.
Do not deform the bioprosthesis in excess of what is experienced during crimping, loading, and implantation.
The safety and effectiveness of the Medtronic CoreValve™ Evolut™ PRO system have not been evaluated in the pediatric population.
The safety and effectiveness of the bioprosthesis for aortic valve replacement have not been evaluated in the following patient populations:
Patients who do not meet the criteria for symptomatic severe native aortic stenosis as defined below:
Symptomatic severe high-gradient aortic stenosis: aortic valve area ≤1.0 cm2 or aortic valve area index ≤0.6 cm2/m2, a mean aortic valve gradient ≥40 mmHg, or a peak aortic-jet velocity ≥4.0 m/s
Symptomatic severe low-flow/low-gradient aortic stenosis: aortic valve area ≤1.0 cm2 or aortic valve area index ≤0.6 cm2/m2; a mean aortic valve gradient <40 mmHg; and a peak aortic-jet velocity <4.0 m/s
Who are at low surgical risk (predicted perioperative mortality risk of <3%)
With untreated, clinically significant coronary artery disease requiring revascularization
With a preexisting prosthetic heart valve with a rigid support structure in either the mitral or pulmonic position if either the preexisting prosthetic heart valve could affect the implantation or function of the bioprosthesis or the implantation of the bioprosthesis could affect the function of the preexisting prosthetic heart valve
With cardiogenic shock manifested by low cardiac output, vasopressor dependence, or mechanical hemodynamic support
The safety and effectiveness of a CoreValve™ Evolut™ PRO bioprosthesis implanted within a failed preexisting transcatheter bioprosthesis have not been demonstrated.
Implanting a CoreValve™ Evolut™ PRO bioprosthesis in a degenerated surgical bioprosthesis (transcatheter aortic valve in surgical aortic valve [TAV in SAV]) should be avoided in the following conditions. The degenerated surgical bioprosthesis presents with a:
12
Significant concomitant paravalvular leak (between the prosthesis and the native annulus), is not securely fixed in the native annulus, or is not structurally intact (for example, wireform frame fracture)
Partially detached leaflet that in the aortic position may obstruct a coronary ostium
Stent frame with a manufacturer’s labeled inner diameter <17 mm
The safety and effectiveness of the bioprosthesis for aortic valve replacement have not been evaluated in patient populations presenting with the following:
Blood dyscrasias as defined: leukopenia (WBC <1000 cells/mm3), thrombocytopenia (platelet count <50,000 cells/mm3), history of bleeding diathesis or coagulopathy, or hypercoagulable states
Congenital bicuspid or unicuspid valve
Mixed native aortic valve disease (aortic stenosis and aortic regurgitation with predominant aortic regurgitation [3–4+])
Moderate to severe (3–4+) or severe (4+) mitral or severe (4+) tricuspid regurgitation
Hypertrophic obstructive cardiomyopathy
New or untreated echocardiographic evidence of intracardiac mass, thrombus, or vegetation
Native aortic annulus size <18 mm or >26 mm per the baseline diagnostic imaging or surgical bioprosthetic aortic annulus size <17 mm or >26 mm
Transarterial access not able to accommodate a 20 Fr introducer sheath or the 16 Fr equivalent EnVeo™ R InLine sheath
Sinus of valsalva anatomy that would prevent adequate coronary perfusion
Moderate to severe mitral stenosis
Severe ventricular dysfunction with left ventricular ejection fraction (LVEF) <20%
Symptomatic carotid or vertebral artery disease
Severe basal septal hypertrophy with an outflow gradient
Before use
The bioprosthesis size must be appropriate to fit the patient’s anatomy. Proper sizing of the device is the responsibility of the physician. Refer to Table 1 for available sizes. Failure to implant a device within the sizing matrix could lead to adverse effects such as those listed in Section 5.0.
Patients must present with transarterial access vessels with diameters that are ≥5.5 mm, or patients must present with an ascending aortic (direct aortic) access site ≥60 mm from the basal plane.

13
Implantation of the bioprosthesis should be avoided in patients with aortic root angulation (angle between plane of aortic valve annulus and horizontal plane/vertebrae) of >30° for right subclavian/axillary access or >70° for femoral and left subclavian/axillary access.
Use caution when using the subclavian/axillary approach in patients with a patent Left Internal Mammary Artery (LIMA) graft (for left subclavian/axillary approach only) or patent Right Internal Mammary Artery (RIMA) graft (for right subclavian/axillary approach only).
For direct aortic access, ensure the access site and trajectory are free of patent RIMA or a preexisting patent RIMA graft.
For transfemoral access, use caution in patients who present with multiplanar curvature of the aorta, acute angulation of the aortic arch, an ascending aortic aneurysm, or severe calcification in the aorta and/or vasculature. If ≥2 of these factors are present, consider an alternative access route to prevent vascular complications.
Exposure to glutaraldehyde may cause irritation of the skin, eyes, nose, and throat. Avoid prolonged or repeated exposure to the vapors. Use only with adequate ventilation. If skin contact occurs, immediately flush the affected area with water (minimum of 15 minutes). In the event of eye contact, flush with water for a minimum of 15 minutes and seek medical attention immediately.
The bioprosthesis and the glutaraldehyde storage solution are sterile. The outside of the bioprosthesis container is nonsterile and must not be placed in the sterile field.
Damage may result from forceful handling of the catheter. Prevent kinking of the catheter when removing it from the packaging.
This device was designed for single patient use only. Do not reuse, reprocess, or resterilize this product. Reuse, reprocessing, or resterilization may compromise the structural integrity of the device and/or create a risk of contamination of the device, which could result in patient injury, illness, or death.
Before catheter insertion, remove the loading stylet.
During use
For direct aortic and subclavian access procedures, care must be exercised when using the tip-retrieval mechanism to ensure adequate clearance to avoid advancement of the catheter tip through the bioprosthesis leaflets during device closure.
For direct aortic access procedures, use a separate introducer sheath; do not use the EnVeo R InLine™ sheath. Maintain the EnVeo R InLine™ sheath at the proximal end of the catheter throughout the procedure.
Adequate rinsing of the bioprosthesis with sterile saline, as described in the Instructions for Use, is mandatory before implantation. No other solutions, drugs, chemicals, or antibiotics should ever be added to the glutaraldehyde or rinse solutions, as irreparable damage to the leaflet tissue, which may not be apparent under visual inspection, may result.
During rinsing, do not touch the leaflets or squeeze the bioprosthesis.
14
If a misload is detected, unsheath the bioprosthesis and examine the bioprosthesis for damage (for example, permanent frame deformation, frayed sutures, or valve damage). Do not attempt to reload a damaged bioprosthesis; if no issues are found, a second attempt may be made to load an undamaged bioprosthesis. However, the catheter, LS, loading tray, and saline must be replaced with new sterile components. Do not load the bioprosthesis onto the catheter more than 2 times or after it has been inserted into a patient.
Prevent contamination of the bioprosthesis, its storage solution, the catheter, and the LS with glove powder.
If a bioprosthesis and catheter have been removed from a patient, dispose of both the bioprosthesis and catheter; do not attempt to reuse either component. Both the bioprosthesis and catheter must be replaced with new sterile components.
While the catheter is in the patient, ensure the guidewire is extending from the proximal end of the catheter. Do not remove the guidewire from the catheter while the catheter is inserted in the patient.
There will be some resistance when the catheter is advanced through the vasculature. If there is a significant increase in resistance, stop advancement and investigate the cause of the resistance (for example, magnify the area of resistance) before proceeding. Do not force passage. Forcing passage could increase the risk of vascular complications (for example, vessel dissection or rupture).
Use the deployment knob to deploy and recapture the bioprosthesis. Do not use the trigger for deploying or recapturing because it could cause inaccurate placement of the bioprosthesis.
If the radiopaque capsule marker band has not yet reached the distal end of the radiopaque paddle attachment, the bioprosthesis can be recaptured or repositioned. During deployment, the deployment knob provides a tactile indication as a notification before the point of no recapture.
Once the radiopaque capsule marker band reaches the distal end of the radiopaque paddle attachment (point of no recapture), retrieval of the bioprosthesis from the patient (for example, use of the catheter) is not recommended. Retrieval after the point of no recapture may cause mechanical failure of the delivery catheter system, aortic root damage, coronary artery damage, myocardial damage, vascular complications, prosthetic valve dysfunction (including device malposition), embolization, stroke, and/or emergent surgery.
During deployment, the bioprosthesis can be advanced or withdrawn as long as annular contact has not been made. Once annular contact is made, the bioprosthesis cannot be advanced in the retrograde direction; recapture until the bioprosthesis is free from annular contact, and then reposition in the retrograde direction. If necessary, and the radiopaque capsule marker band has not yet reached the distal end of the radiopaque paddle attachment, the bioprosthesis can be withdrawn (repositioned) in the antegrade direction. However, use caution when moving the bioprosthesis in the antegrade direction.
15
Caution: Use the handle of the delivery system to reposition the bioprosthesis. Do not use the outer catheter sheath.
Once deployment is complete, repositioning of the bioprosthesis (for example, use of a snare and/or forceps) is not recommended. Repositioning of a deployed valve may cause aortic root damage, coronary artery damage, myocardial damage, vascular complications, prosthetic valve dysfunction (including device malposition), embolization, stroke, and/or emergent surgery.
Do not attempt to retrieve or to recapture a bioprosthesis if any one of the outflow struts is protruding from the capsule. If any one of the outflow struts has deployed from the capsule, the bioprosthesis must be released from the catheter before the catheter can be withdrawn.
Ensure the capsule is closed before catheter removal.
When using a separate introducer sheath, if increased resistance is encountered when removing the catheter through the introducer sheath, do not force passage. Increased resistance may indicate a problem and forced passage may result in damage to the device and/or harm to the patient. If the cause of resistance cannot be determined or corrected, remove the catheter and introducer sheath as a single unit over the guidewire, and inspect the catheter and confirm that it is complete.
Clinical long-term durability has not been established for the bioprosthesis. Evaluate bioprosthesis performance as needed during patient follow-up.
Postprocedure, administer appropriate antibiotic prophylaxis as needed for patients at risk for prosthetic valve infection and endocarditis.
Postprocedure, administer anticoagulation and/or antiplatelet therapy per physician/clinical judgment.
Excessive contrast media may cause renal failure. Preprocedure, measure the patient’s creatinine level. During the procedure, monitor contrast media usage.
Conduct the procedure under fluoroscopy. Fluoroscopic procedures are associated with the risk of radiation damage to the skin, which may be painful, disfiguring, and long-term.
The safety and efficacy of a CoreValve™ Evolut™ PRO bioprosthesis implanted within a transcatheter bioprosthesis have not been demonstrated. However, in the event that a CoreValve™ Evolut™ PRO bioprosthesis must be implanted within a transcatheter bioprosthesis to improve valve function, valve size and patient anatomy must be considered before implantation of the CoreValve™ Evolut™ PRO bioprosthesis to ensure patient safety (for example, to avoid coronary obstruction).
In the event that valve function or sealing is impaired due to excessive calcification or incomplete expansion, a postimplant balloon dilatation of the bioprosthesis may improve valve function and sealing. To ensure patient safety, valve size and patient anatomy must be considered when selecting the size of the balloon used for dilatation. The balloon size chosen for dilatation should not exceed the diameter of the native aortic annulus or, for surgical bioprosthetic valves, the manufacturer’s labeled inner diameter. Refer to the
16
specific balloon catheter manufacturer's compliance chart to ensure that the applied inflation pressure does not result in a balloon diameter that exceeds the indicated annulus range for the bioprosthesis. Refer to the specific balloon catheter manufacturer’s labeling for proper instruction on the use of balloon catheter devices. Note: Bench testing has only been conducted to confirm compatibility with NuMED Z-MED™ and Z-MED II™ Balloon Aortic Valvuloplasty catheters where CoreValve™ Evolut™ PRO bioprosthesis device performance was maintained after dilatation. Data on file.
4.3 Magnetic resonance imaging (MRI) MRI may be used on the bioprosthesis only under specific conditions. See Section 6.2: MRI Safety Information for more information.

17
5.0 Potential adverse events
Potential risks associated with the implantation of the CoreValve™ Evolut™ PRO bioprosthesis may include, but are not limited to, the following:
Death
Myocardial infarction, cardiac arrest, cardiogenic shock, cardiac tamponade
Coronary occlusion, obstruction, or vessel spasm (including acute coronary closure)
Cardiovascular injury (including rupture, perforation, tissue erosion, or dissection of vessels, ascending aorta trauma, ventricle, myocardium, or valvular structures that may require intervention)
Emergent surgical or transcatheter intervention (for example, coronary artery bypass, heart valve replacement, valve explant, percutaneous coronary intervention [PCI], balloon valvuloplasty)
Prosthetic valve dysfunction (regurgitation or stenosis) due to fracture; bending (out-of-round configuration) of the valve frame; underexpansion of the valve frame; calcification; pannus; leaflet wear, tear, prolapse, or retraction; poor valve coaptation; suture breaks or disruption; leaks; mal-sizing (prosthesis-patient mismatch); malposition (either too high or too low)/malplacement
Prosthetic valve migration/embolization
Prosthetic valve endocarditis
Prosthetic valve thrombosis
Delivery catheter system malfunction resulting in the need for additional re-crossing of the aortic valve and prolonged procedural time
Delivery catheter system component migration/embolization
Stroke (ischemic or hemorrhagic), transient ischemic attack (TIA), or other neurological deficits
Individual organ (for example, cardiac, respiratory, renal [including acute kidney failure]) or multi-organ insufficiency or failure
Major or minor bleeding that may require transfusion or intervention (including life-threatening or disabling bleeding)
Vascular access-related complications (for example, dissection, perforation, pain, bleeding, hematoma, pseudoaneurysm, irreversible nerve injury, compartment syndrome, arteriovenous fistula, stenosis)
Mitral valve regurgitation or injury
Conduction system disturbances (for example, atrioventricular node block, left-bundle branch block, asystole), which may require a permanent pacemaker
Infection (including septicemia)

18
Hypotension or hypertension
Hemolysis
Peripheral ischemia
Bowel ischemia
Abnormal lab values (including electrolyte imbalance)
Allergic reaction to antiplatelet agents, contrast medium, or anesthesia
Exposure to radiation through fluoroscopy and angiography
Permanent disability

19
6.0 Patient information
6.1 Registration information A patient registration form is included in each bioprosthesis package. After implantation, please complete all requested information. The serial number is located on both the package and the identification tag attached to the bioprosthesis. Return the original form to the Medtronic address indicated on the form and provide the temporary identification card to the patient prior to discharge.
Medtronic will provide an Implanted Device Identification Card to the patient. The card contains the name and telephone number of the patient’s physician as well as information that medical personnel would require in the event of an emergency. Patients should be encouraged to carry this card with them at all times.
6.2 MRI safety information Nonclinical testing and modeling have demonstrated that the Medtronic CoreValve™ Evolut™ PRO bioprosthesis is MR Conditional. A patient with this device can be safely scanned in an MR system meeting the following conditions:
Static magnetic field of 1.5 T and 3.0 T
Maximum spatial field gradient of 2500 gauss/cm (25 T/m)
Maximum MR system reported, whole body averaged specific absorption rate (SAR) of 2.0 W/kg (Normal Operating Mode)
Based on nonclinical testing and modeling, under the scan conditions defined above, the Medtronic CoreValve™ Evolut™ PRO bioprosthesis is expected to produce a maximum in vivo temperature rise of less than 4.0°C after 15 minutes of continuous scanning. Based on nonclinical data, the image artifact caused by the device will extend no greater than 7 mm from the Medtronic CoreValve™ Evolut™ PRO bioprosthesis when imaged with a gradient echo pulse sequence and a 3.0 T MRI system.
Scanning under the conditions defined above may be performed immediately after implantation.
The presence of other implants or medical circumstances of the patient may require lower limits on some or all of the above parameters. For deployment of a Medtronic CoreValve™ Evolut™ PRO bioprosthesis inside of a failed surgical bioprosthetic valve, consult the MRI labeling pertaining to the failed valve for additional artifact information.
20
7.0 How supplied
7.1 Packaging The bioprosthesis is supplied sterile and nonpyrogenic in a glass container and a screw cap with a liner. The outside of the container is nonsterile and must not be placed in the sterile field. A freeze indicator is placed inside the labeled carton. If the freeze indicator has been activated, do not use the bioprosthesis.
The catheter is packaged in a single-pouch configuration and sterilized with ethylene oxide gas. The catheter is sterile if the package is undamaged and unopened. The outer surfaces of the pouch are nonsterile and must not be placed in the sterile field.
The LS is packaged in a double-pouch configuration. The LS is sterile if the pouches are undamaged and unopened. The outer surfaces of the outer pouch are nonsterile and must not be placed in the sterile field. The LS is sterilized with ethylene oxide gas.
7.2 Storage Store the bioprosthesis at room temperature. Avoid exposing to extreme fluctuations of temperature. Avoid freezing. Appropriate inventory control should be maintained so that bioprostheses with earlier Use By dates are implanted preferentially.
Store the catheter and LS in a cool, dry environment.

21
8.0 Additional equipment
Note: While extensive, this equipment list is not meant to cover all possible scenarios.
Transesophogeal echocardiogram (TEE) or transthoracic echocardiography (TTE) on standby
Temporary pacer insertion
Temporary pacemaker lead
Sterile sleeve for pacemaker lead
Hemostatic vessel introducer sheath
Temporary pacemaker generator
Sterile temporary pacemaker-to-generator cable
If indicated, pulmonary artery catheter insertion
Standard pulmonary artery catheter
Hemostatic vessel introducer sheath
Saline flush line connected to pressure transducer
Baseline aortography via radial, brachial, or femoral approach
5 Fr or 6 Fr pigtail angiographic catheter
6 Fr hemostatic vessel introducer sheath
2-port manifold with saline flush line and pressure tubing or transducer
Power injector syringe
Contrast media
High-pressure power injector tubing
Predilatation of implant site
2-port manifold with saline flush and transducer
9 Fr hemostatic vessel introducer sheath and a 16 Fr or 20 Fr hemostatic vessel introducer sheath
Note: Catheter Model ENVEOR-N-US is compatible with a 20 Fr introducer sheath.
Standard length 0.035 in (0.889 mm) straight guidewire
Appropriate suture-mediated closure system, if applicable
Angiographic catheter
0.035 in (0.889 mm) × 260 cm standard high support guidewire to be shaped with a pigtail loop
22
Balloon valvuloplasty catheters, ≤4 cm length × 18 mm, 20 mm, 22 mm or 23 mm, and 25 mm diameters
Inflation device or syringe and diluted 1:5 contrast media
Bioprosthesis implantation
20 Fr hemostatic vessel introducer sheath
Note: Catheter Model ENVEOR-N-US is compatible with a 20 Fr introducer sheath.
Note: A separate introducer sheath is optional for transfemoral and subclavian access procedures.
Standby supplies (must be available in the room)
Pericardiocentesis tray
35 mm × 120 cm single loop snare
Standard percutaneous coronary intervention (PCI) equipment
14 Fr and 16 Fr hemostatic vessel introducer sheaths
Standard cardiac catheterization lab equipment
Intra-aortic balloon pump (IABP)

23
9.0 Instructions for use
9.1 Inspection and bioprosthesis loading procedure Caution: Once the bioprosthesis is removed from its container and the catheter and LS are removed from their packaging, ensure all subsequent procedures are performed in a sterile field.
Caution: Do not allow the bioprosthesis to dry. Maintain tissue moisture with irrigation or immersion.
Inspection before use and swivel tray setup
1. Before removing the bioprosthesis, catheter, or LS from its primary packaging, carefully inspect the packaging for any evidence of damage that could compromise the sterility or integrity of the device (for example, cracked jar or lid, leakage, broken or missing seals, torn or punctured pouch).
Caution: Do not use after the Use By date or if there is evidence of damage.
Caution: Do not use the bioprosthesis if the freeze indicator has been activated.
2. Remove the product from the protective package.
3. Visually check that the product is free of defects. Do not use if any defects are noted.
4. Remove the locking clip attached to the rinsing bowls.
5. Remove the rinsing bowls from the integrated loading bath.
6. Remove the locking clips that connect the distal and proximal trays.
7. Lift the tray connector from the distal tray, and swivel the distal tray 180° counterclockwise.
8. Clip the tray tab on the distal tray to the tray tab holder on the proximal tray.
9. Fill the integrated loading bath with cold, sterile saline (0°C to 8°C [32°F to 46°F]).
Preparation of the catheter and LS
1. Attach a 10 mL syringe filled with sterile saline to the capsule flush port on the proximal end of the handle.
2. Carefully lift the distal end of the catheter to a near vertical orientation. To prevent kinking, do not bend the catheter severely.
3. Open the capsule and expose the paddle attachment.
Note: Use the deployment knob to open the capsule completely until the paddle attachment is fully exposed.
4. With the capsule held vertically, flush the capsule flush port. Verify that no catheter leakage is observed during any of the flushing steps. If leakage is observed, use a new system.
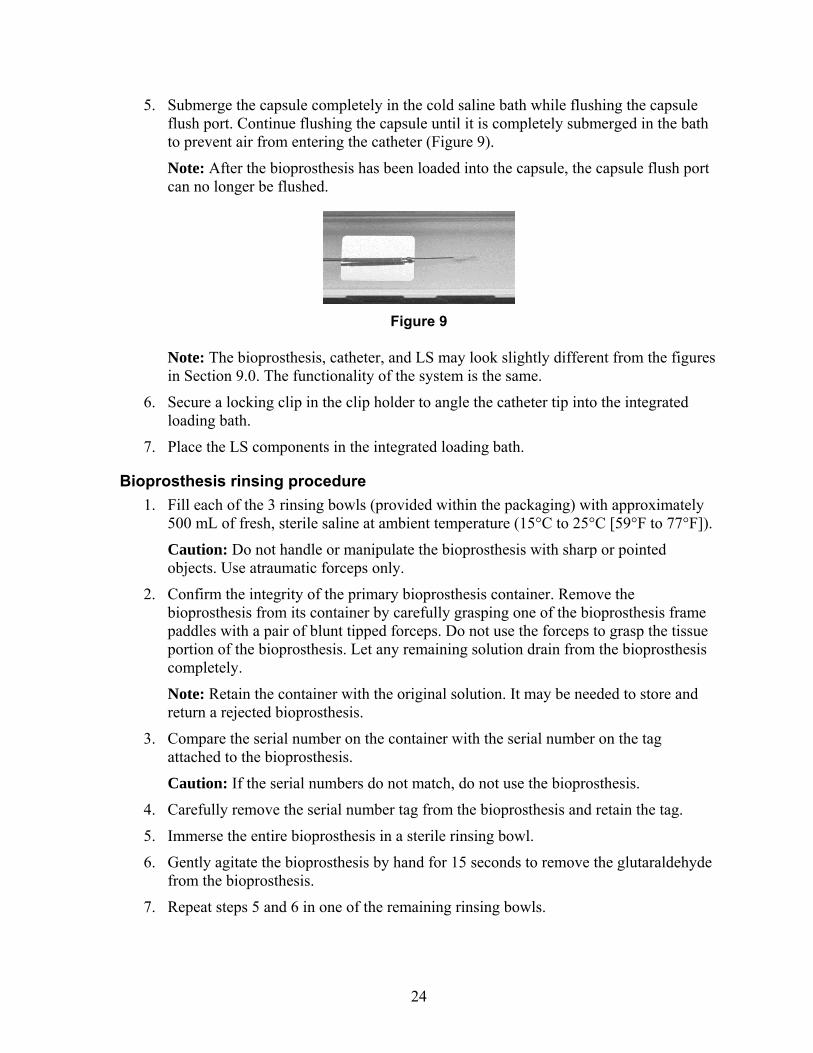
24
5. Submerge the capsule completely in the cold saline bath while flushing the capsule flush port. Continue flushing the capsule until it is completely submerged in the bath to prevent air from entering the catheter (Figure 9).
Note: After the bioprosthesis has been loaded into the capsule, the capsule flush port can no longer be flushed.
Figure 9
Note: The bioprosthesis, catheter, and LS may look slightly different from the figures in Section 9.0. The functionality of the system is the same.
6. Secure a locking clip in the clip holder to angle the catheter tip into the integrated loading bath.
7. Place the LS components in the integrated loading bath.
Bioprosthesis rinsing procedure
1. Fill each of the 3 rinsing bowls (provided within the packaging) with approximately 500 mL of fresh, sterile saline at ambient temperature (15°C to 25°C [59°F to 77°F]).
Caution: Do not handle or manipulate the bioprosthesis with sharp or pointed objects. Use atraumatic forceps only.
2. Confirm the integrity of the primary bioprosthesis container. Remove the bioprosthesis from its container by carefully grasping one of the bioprosthesis frame paddles with a pair of blunt tipped forceps. Do not use the forceps to grasp the tissue portion of the bioprosthesis. Let any remaining solution drain from the bioprosthesis completely.
Note: Retain the container with the original solution. It may be needed to store and return a rejected bioprosthesis.
3. Compare the serial number on the container with the serial number on the tag attached to the bioprosthesis.
Caution: If the serial numbers do not match, do not use the bioprosthesis.
4. Carefully remove the serial number tag from the bioprosthesis and retain the tag.
5. Immerse the entire bioprosthesis in a sterile rinsing bowl.
6. Gently agitate the bioprosthesis by hand for 15 seconds to remove the glutaraldehyde from the bioprosthesis.
7. Repeat steps 5 and 6 in one of the remaining rinsing bowls.
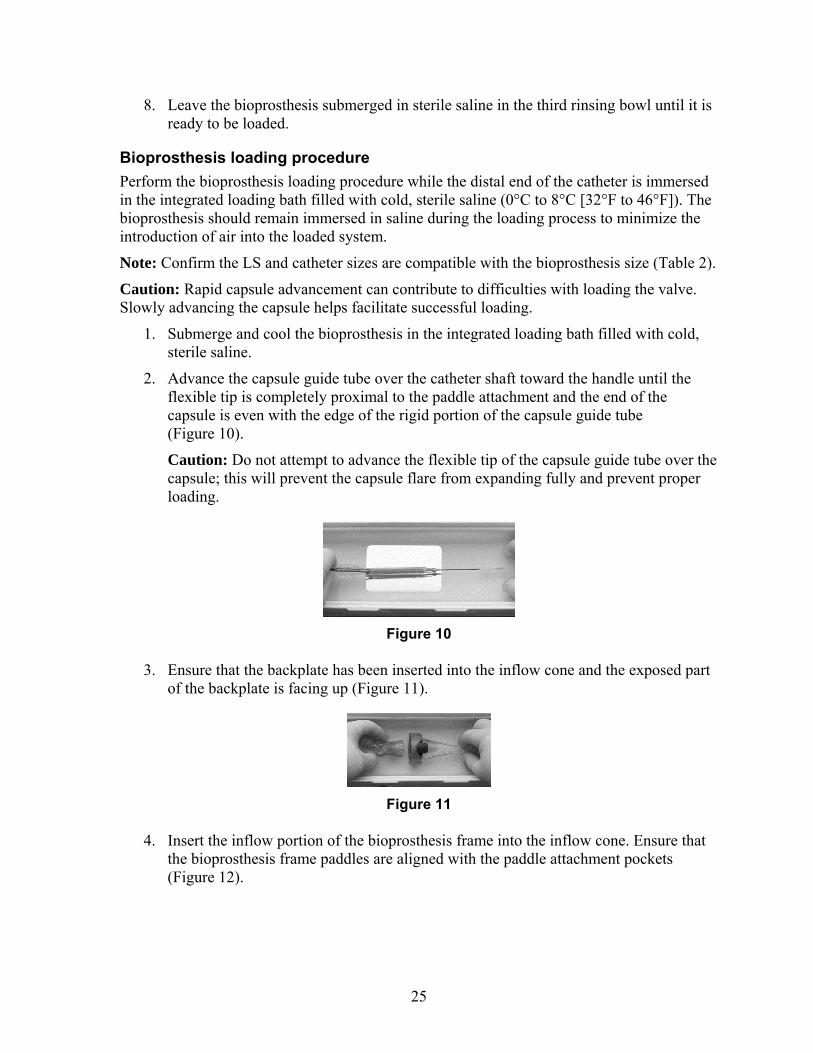
25
8. Leave the bioprosthesis submerged in sterile saline in the third rinsing bowl until it is ready to be loaded.
Bioprosthesis loading procedure
Perform the bioprosthesis loading procedure while the distal end of the catheter is immersed in the integrated loading bath filled with cold, sterile saline (0°C to 8°C [32°F to 46°F]). The bioprosthesis should remain immersed in saline during the loading process to minimize the introduction of air into the loaded system.
Note: Confirm the LS and catheter sizes are compatible with the bioprosthesis size (Table 2).
Caution: Rapid capsule advancement can contribute to difficulties with loading the valve. Slowly advancing the capsule helps facilitate successful loading.
1. Submerge and cool the bioprosthesis in the integrated loading bath filled with cold, sterile saline.
2. Advance the capsule guide tube over the catheter shaft toward the handle until the flexible tip is completely proximal to the paddle attachment and the end of the capsule is even with the edge of the rigid portion of the capsule guide tube (Figure 10).
Caution: Do not attempt to advance the flexible tip of the capsule guide tube over the capsule; this will prevent the capsule flare from expanding fully and prevent proper loading.
Figure 10
3. Ensure that the backplate has been inserted into the inflow cone and the exposed part of the backplate is facing up (Figure 11).
Figure 11
4. Insert the inflow portion of the bioprosthesis frame into the inflow cone. Ensure that the bioprosthesis frame paddles are aligned with the paddle attachment pockets (Figure 12).
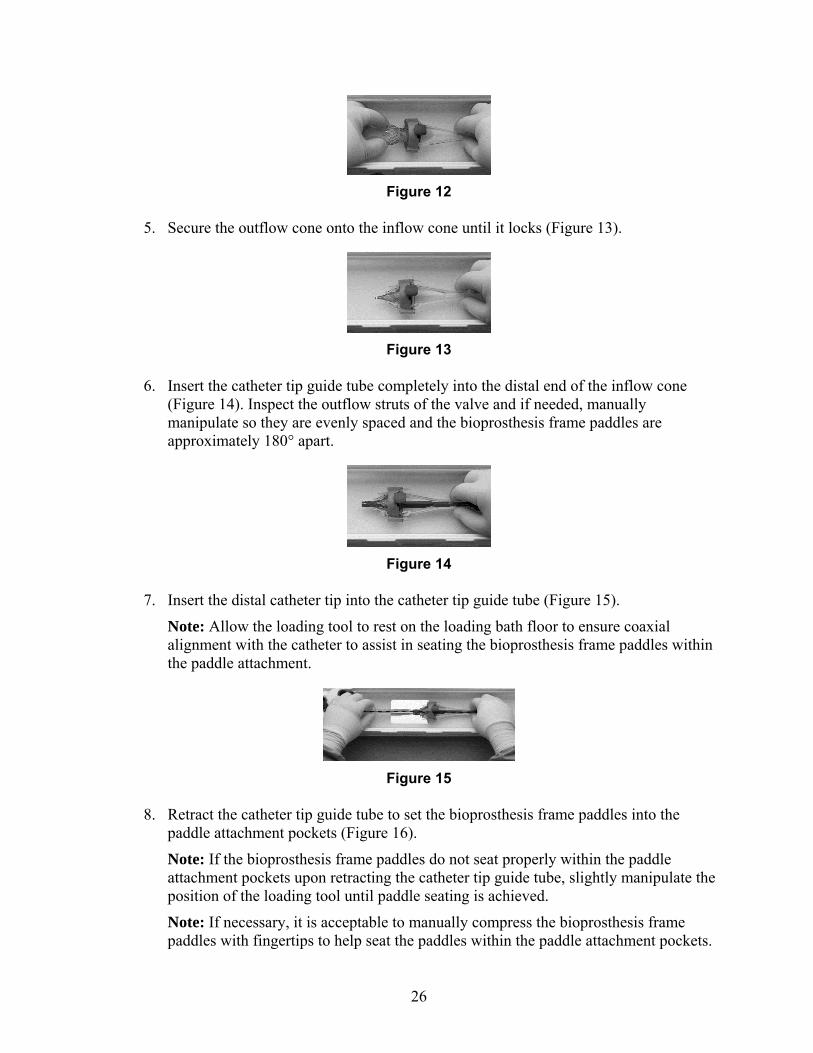
26
Figure 12
5. Secure the outflow cone onto the inflow cone until it locks (Figure 13).
Figure 13
6. Insert the catheter tip guide tube completely into the distal end of the inflow cone (Figure 14). Inspect the outflow struts of the valve and if needed, manually manipulate so they are evenly spaced and the bioprosthesis frame paddles are approximately 180° apart.
Figure 14
7. Insert the distal catheter tip into the catheter tip guide tube (Figure 15).
Note: Allow the loading tool to rest on the loading bath floor to ensure coaxial alignment with the catheter to assist in seating the bioprosthesis frame paddles within the paddle attachment.
Figure 15
8. Retract the catheter tip guide tube to set the bioprosthesis frame paddles into the paddle attachment pockets (Figure 16).
Note: If the bioprosthesis frame paddles do not seat properly within the paddle attachment pockets upon retracting the catheter tip guide tube, slightly manipulate the position of the loading tool until paddle seating is achieved.
Note: If necessary, it is acceptable to manually compress the bioprosthesis frame paddles with fingertips to help seat the paddles within the paddle attachment pockets.
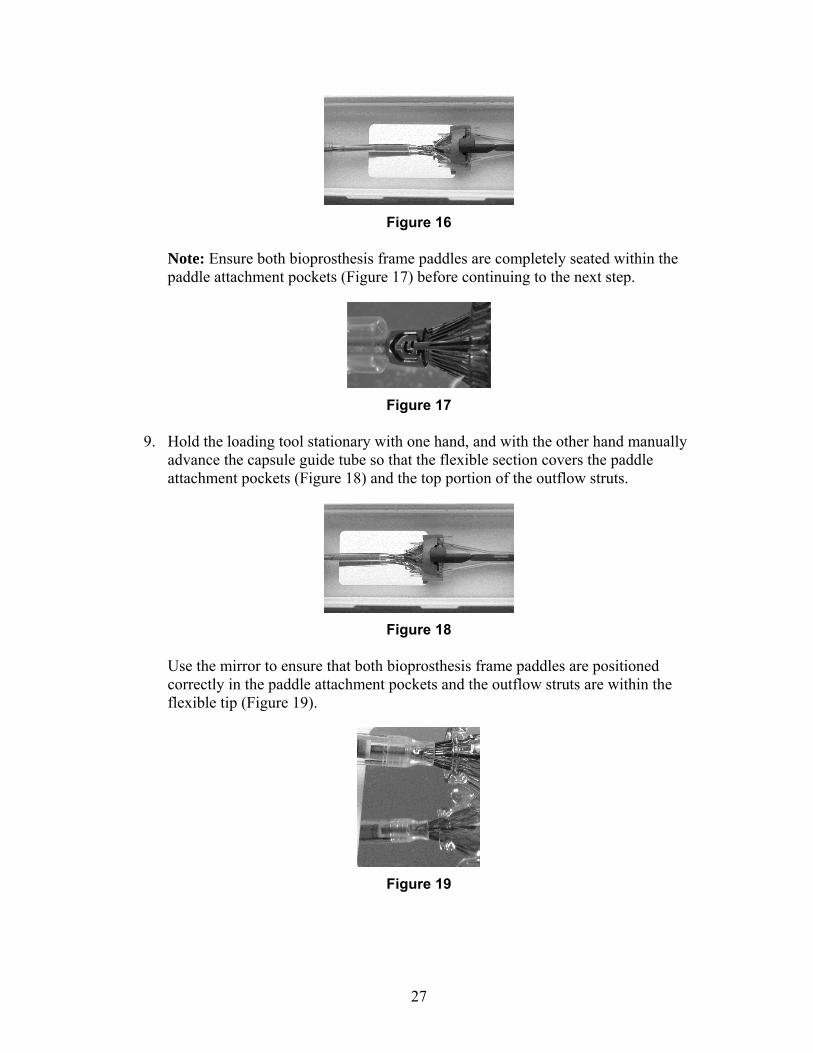
27
Figure 16
Note: Ensure both bioprosthesis frame paddles are completely seated within the paddle attachment pockets (Figure 17) before continuing to the next step.
Figure 17
9. Hold the loading tool stationary with one hand, and with the other hand manually advance the capsule guide tube so that the flexible section covers the paddle attachment pockets (Figure 18) and the top portion of the outflow struts.
Figure 18
Use the mirror to ensure that both bioprosthesis frame paddles are positioned correctly in the paddle attachment pockets and the outflow struts are within the flexible tip (Figure 19).
Figure 19
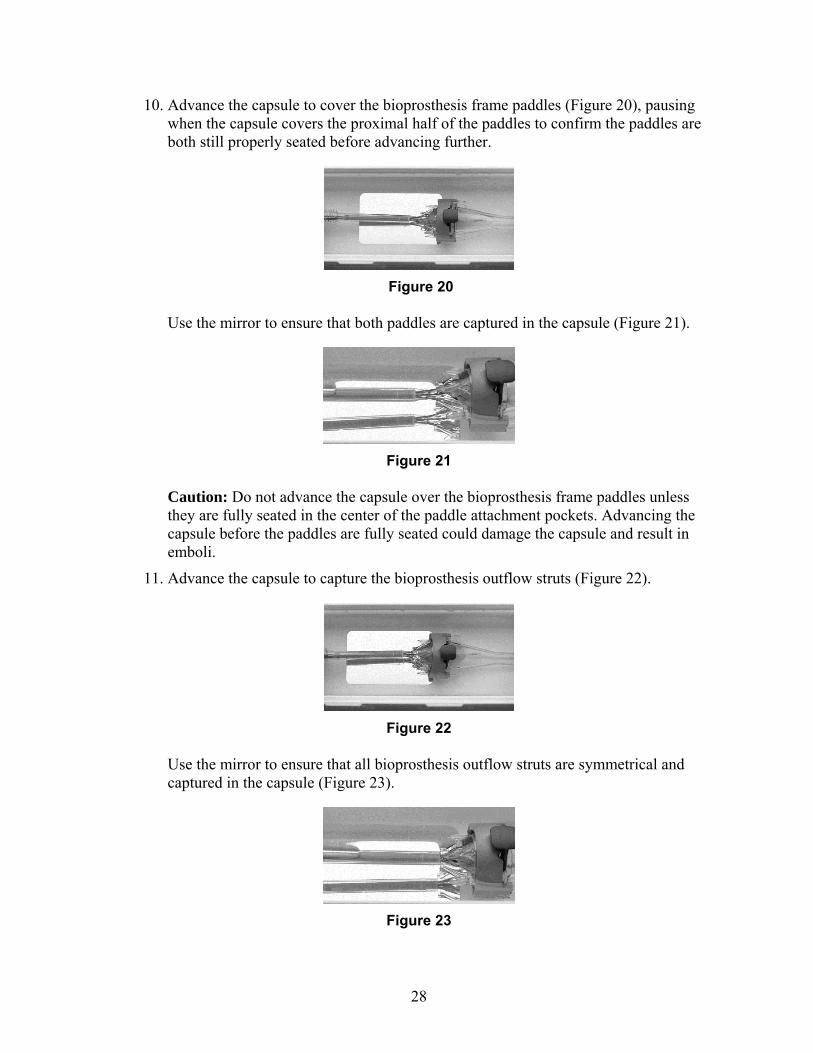
28
10. Advance the capsule to cover the bioprosthesis frame paddles (Figure 20), pausing when the capsule covers the proximal half of the paddles to confirm the paddles are both still properly seated before advancing further.
Figure 20
Use the mirror to ensure that both paddles are captured in the capsule (Figure 21).
Figure 21
Caution: Do not advance the capsule over the bioprosthesis frame paddles unless they are fully seated in the center of the paddle attachment pockets. Advancing the capsule before the paddles are fully seated could damage the capsule and result in emboli.
11. Advance the capsule to capture the bioprosthesis outflow struts (Figure 22).
Figure 22
Use the mirror to ensure that all bioprosthesis outflow struts are symmetrical and captured in the capsule (Figure 23).
Figure 23
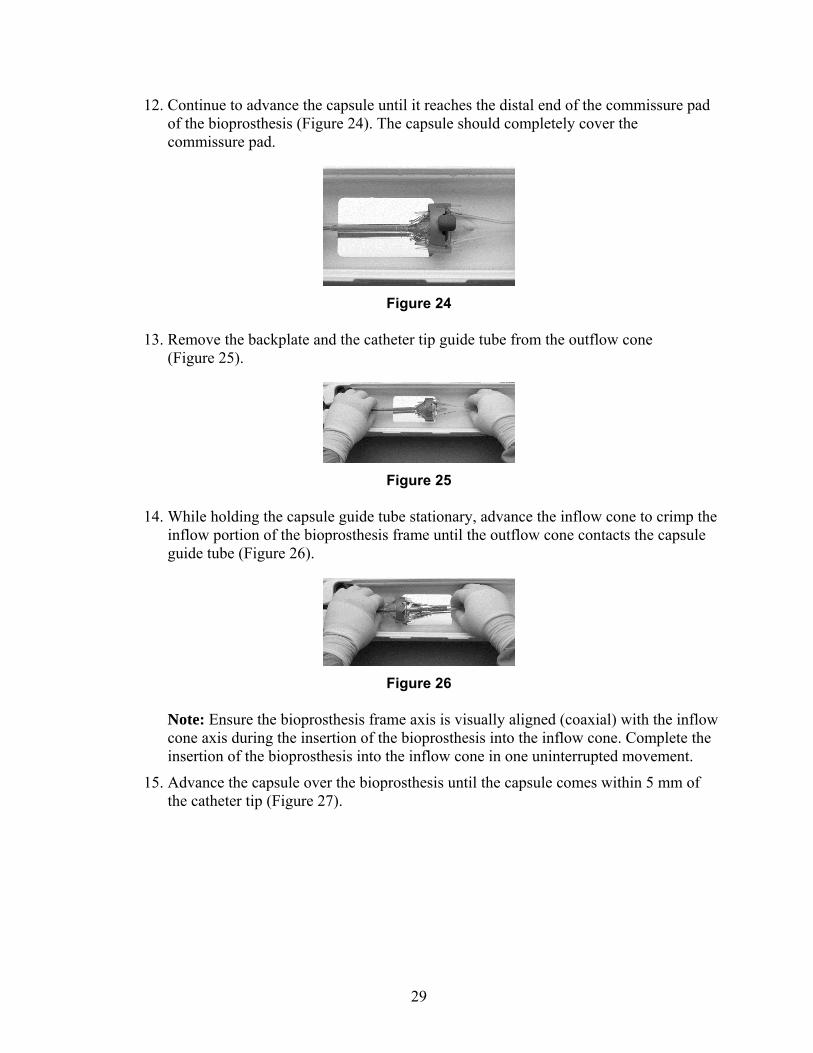
29
12. Continue to advance the capsule until it reaches the distal end of the commissure pad of the bioprosthesis (Figure 24). The capsule should completely cover the commissure pad.
Figure 24
13. Remove the backplate and the catheter tip guide tube from the outflow cone (Figure 25).
Figure 25
14. While holding the capsule guide tube stationary, advance the inflow cone to crimp the inflow portion of the bioprosthesis frame until the outflow cone contacts the capsule guide tube (Figure 26).
Figure 26
Note: Ensure the bioprosthesis frame axis is visually aligned (coaxial) with the inflow cone axis during the insertion of the bioprosthesis into the inflow cone. Complete the insertion of the bioprosthesis into the inflow cone in one uninterrupted movement.
15. Advance the capsule over the bioprosthesis until the capsule comes within 5 mm of the catheter tip (Figure 27).
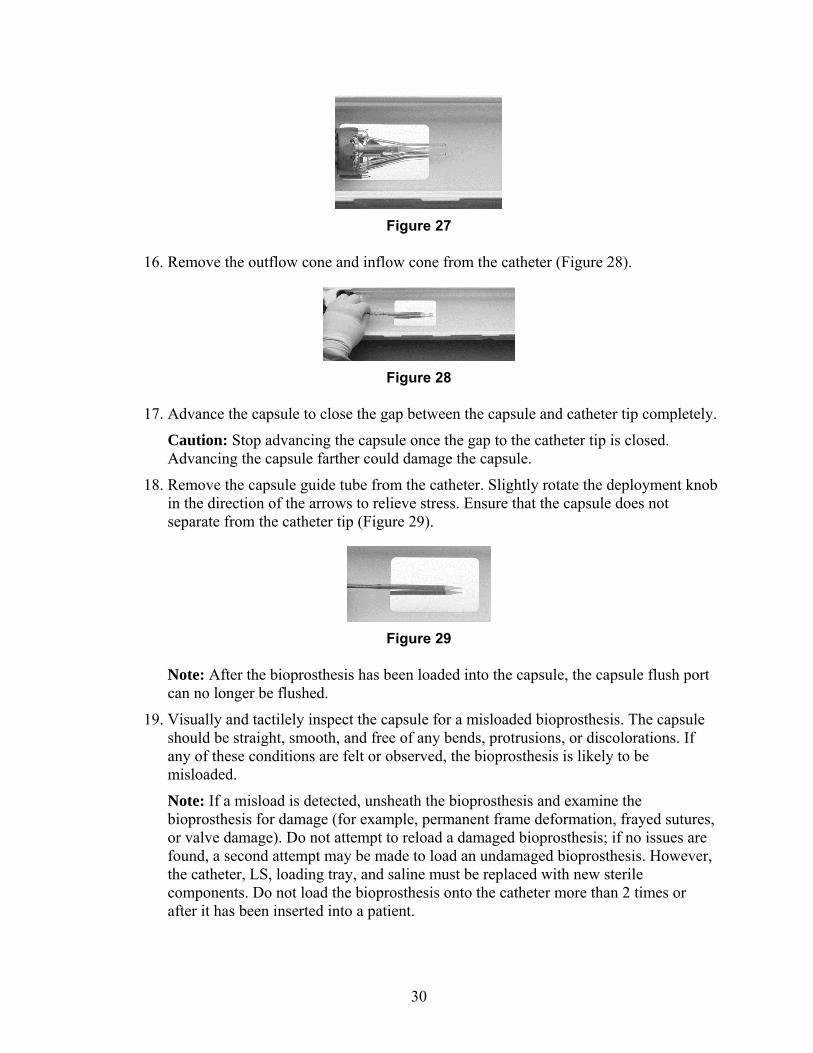
30
Figure 27
16. Remove the outflow cone and inflow cone from the catheter (Figure 28).
Figure 28
17. Advance the capsule to close the gap between the capsule and catheter tip completely.
Caution: Stop advancing the capsule once the gap to the catheter tip is closed. Advancing the capsule farther could damage the capsule.
18. Remove the capsule guide tube from the catheter. Slightly rotate the deployment knob in the direction of the arrows to relieve stress. Ensure that the capsule does not separate from the catheter tip (Figure 29).
Figure 29
Note: After the bioprosthesis has been loaded into the capsule, the capsule flush port can no longer be flushed.
19. Visually and tactilely inspect the capsule for a misloaded bioprosthesis. The capsule should be straight, smooth, and free of any bends, protrusions, or discolorations. If any of these conditions are felt or observed, the bioprosthesis is likely to be misloaded.
Note: If a misload is detected, unsheath the bioprosthesis and examine the bioprosthesis for damage (for example, permanent frame deformation, frayed sutures, or valve damage). Do not attempt to reload a damaged bioprosthesis; if no issues are found, a second attempt may be made to load an undamaged bioprosthesis. However, the catheter, LS, loading tray, and saline must be replaced with new sterile components. Do not load the bioprosthesis onto the catheter more than 2 times or after it has been inserted into a patient.
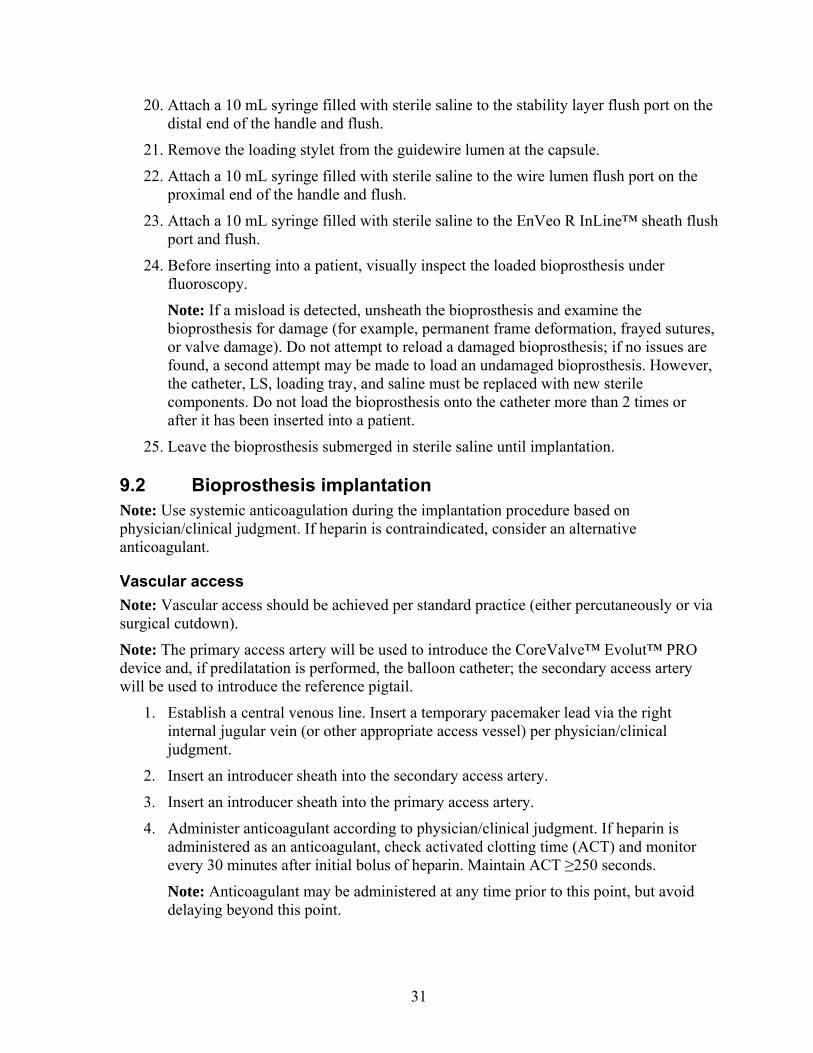
31
20. Attach a 10 mL syringe filled with sterile saline to the stability layer flush port on the distal end of the handle and flush.
21. Remove the loading stylet from the guidewire lumen at the capsule.
22. Attach a 10 mL syringe filled with sterile saline to the wire lumen flush port on the proximal end of the handle and flush.
23. Attach a 10 mL syringe filled with sterile saline to the EnVeo R InLine™ sheath flush port and flush.
24. Before inserting into a patient, visually inspect the loaded bioprosthesis under fluoroscopy.
Note: If a misload is detected, unsheath the bioprosthesis and examine the bioprosthesis for damage (for example, permanent frame deformation, frayed sutures, or valve damage). Do not attempt to reload a damaged bioprosthesis; if no issues are found, a second attempt may be made to load an undamaged bioprosthesis. However, the catheter, LS, loading tray, and saline must be replaced with new sterile components. Do not load the bioprosthesis onto the catheter more than 2 times or after it has been inserted into a patient.
25. Leave the bioprosthesis submerged in sterile saline until implantation.
9.2 Bioprosthesis implantation Note: Use systemic anticoagulation during the implantation procedure based on physician/clinical judgment. If heparin is contraindicated, consider an alternative anticoagulant.
Vascular access
Note: Vascular access should be achieved per standard practice (either percutaneously or via surgical cutdown).
Note: The primary access artery will be used to introduce the CoreValve™ Evolut™ PRO device and, if predilatation is performed, the balloon catheter; the secondary access artery will be used to introduce the reference pigtail.
1. Establish a central venous line. Insert a temporary pacemaker lead via the right internal jugular vein (or other appropriate access vessel) per physician/clinical judgment.
2. Insert an introducer sheath into the secondary access artery.
3. Insert an introducer sheath into the primary access artery.
4. Administer anticoagulant according to physician/clinical judgment. If heparin is administered as an anticoagulant, check activated clotting time (ACT) and monitor every 30 minutes after initial bolus of heparin. Maintain ACT ≥250 seconds.
Note: Anticoagulant may be administered at any time prior to this point, but avoid delaying beyond this point.
32
Crossing the valve
5. Advance the graduated pigtail catheter to the ascending aorta and position the distal tip in the noncoronary cusp of the aortic valve.
6. Identify the ideal annular viewing plane using contrast injections at various angiographic angles.
Note: It is recommended that a dedicated individual prepare and operate the contrast injector.
7. Insert an angiographic catheter over a standard J-tip guidewire into the primary access sheath and advance to the ascending aorta.
8. Exchange the J-tip guidewire for a 0.035 in (0.889 mm) straight-tip guidewire. Advance the straight-tip guidewire across the aortic valve into the left ventricle (LV).
9. After crossing the aortic valve with the guidewire, advance the angiographic catheter into the LV.
10. Exchange the straight-tip guidewire for an exchange length J-tip guidewire.
11. Exchange the angiographic catheter for a 6 Fr pigtail catheter.
12. Remove the guidewire and connect the catheter to the transducer. Using both catheters, record the aortic pressure gradient.
13. Using a right anterior oblique (RAO) projection, advance the previously pigtail-shaped, 0.035 in (0.889 mm) high support guidewire through the pigtail catheter and position in the apex of the LV.
14. Remove the pigtail catheter while maintaining guidewire position in the LV.
Predilatation of the implant site
Note: The need for predilatation of the native valve is determined by the heart team.
Information for failed surgical bioprostheses: Balloon predilatation of a stenotic surgical aortic bioprosthesis has not been evaluated. In cases where there is severe stenosis, predilatation of the surgical aortic bioprosthesis may be done at the discretion of the heart team and the steps used are identical to native valve predilatation.
15. Insert the valvuloplasty balloon through the introducer sheath in the primary access artery and advance it to the ascending aorta.
16. Reposition the angiographic equipment to the ideal viewing plane. Position the valvuloplasty balloon across the valve, while maintaining strict fluoroscopic surveillance of the distal tip of the guidewire in the LV.
17. Perform balloon valvuloplasty per standard practice and remove the valvuloplasty balloon while maintaining guidewire position across the aortic valve.
Deployment
18. Insert the device over the 0.035 in (0.889 mm) guidewire. Insert the catheter tip and capsule through the access site, while maintaining the EnVeo R InLine™ sheath tip against the proximal end of the capsule. Then, insert the EnVeo R InLine™ sheath

33
through the access site, maintaining contact with the capsule. Maintain strict fluoroscopic surveillance of the guidewire in the LV.
Note: Catheter Model ENVEOR-N-US is compatible with a 20 Fr introducer sheath.
Note: For transfemoral and subclavian access procedures, a separate introducer sheath is optional. For direct aortic access procedures, use a separate introducer sheath; do not use the EnVeo R InLine™ sheath. Maintain the EnVeo R InLine™ sheath at the proximal end of the catheter throughout the procedure.
19. Under fluoroscopic guidance, advance the catheter over the guidewire to the aortic annulus. Do not rotate the catheter as it is advanced; rotating the handle does not rotate the capsule.
Caution: There will be some resistance when the catheter is advanced through the vasculature. If there is a significant increase in resistance, stop advancement and investigate the cause of the resistance (for example, magnify the area of resistance) before proceeding. Do not force passage. Forcing passage could increase the risk of vascular complications (for example, vessel dissection or rupture).
Caution: Persistent force on the catheter can cause the catheter to kink, which could increase the risk of vascular complications (for example, vessel dissection or rupture).
Note: When crossing the aortic arch, it is critical that the guidewire is controlled to prevent it from moving forward. Without proper management of the distal tip of the guidewire, the guidewire could move forward and cause trauma to the LV.
20. Advance the device through the valve. Perform an angiogram to confirm that the pigtail catheter is in position within the noncoronary cusp of the aortic root. Fluoroscopically identify the appropriate landmarks.
21. Position the catheter so that the bioprosthesis is at the optimal depth relative to the valve annulus. For surgical bioprosthetic valves, consider the features of the valve when determining the optimal placement of the bioprosthesis.
22. To deploy the bioprosthesis, rotate the deployment knob in the direction of the arrows. The capsule retracts and exposes the bioprosthesis. Continue deploying the bioprosthesis in a controlled manner, adjusting valve position as necessary and noting the position of the radiopaque capsule marker band and paddle attachment.
Warning: Use the deployment knob to deploy and recapture the bioprosthesis. Do not use the trigger for deploying or recapturing because it could cause inaccurate placement of the bioprosthesis.
Note: Slight antegrade repositioning of a partially deployed bioprosthesis (before the radiopaque capsule marker band reaches the distal end of the radiopaque paddle attachment) can be achieved by carefully withdrawing the catheter.
Caution: Use the catheter handle to reposition the bioprosthesis. Do not use the outer catheter shaft.
23. Before the radiopaque capsule marker band reaches the distal end of the radiopaque paddle attachment, evaluate the bioprosthesis position.
34
Note: When the bioprosthesis is approximately 2/3 deployed, the deployment knob provides a tactile indication as a notification before the point of no recapture. Once the radiopaque capsule marker band reaches the distal end of the radiopaque paddle attachment, it is at the point of no recapture.
24. Either complete bioprosthesis deployment or initiate bioprosthesis recapture.
Note: Shortly after annular contact, the blood pressure will be reduced until approximately the 2/3 deployment point, when the bioprosthesis leaflets are exposed and are functioning.
Bioprosthesis recapture (optional)
The bioprosthesis is recapturable during deployment before the radiopaque capsule marker band reaches the distal end of the radiopaque paddle attachment. Deployment of the bioprosthesis can be attempted 3 times. If the bioprosthesis is recaptured a third time, it must be removed from the patient.
25. Rotate the deployment knob in the opposite direction of the arrows to recapture the bioprosthesis. A partially recaptured bioprosthesis can be repositioned or fully recaptured.
Warning: Use the deployment knob to deploy and recapture the bioprosthesis. Do not use the trigger for deploying or recapturing because it could cause inaccurate placement of the bioprosthesis.
26. To fully recapture the bioprosthesis, continue rotating the deployment knob until the gap between the capsule and catheter tip is closed.
Caution: Stop advancing the capsule once the gap between the capsule and the catheter tip is closed. Advancing the capsule farther could damage the capsule.
27. Reposition the recaptured bioprosthesis at the optimal depth relative to the valve annulus. For surgical bioprosthetic valves, consider the features of the valve when determining the optimal placement of the bioprosthesis.
28. Redeploy the bioprosthesis (Section 9.2, steps 22 and 23).
29. Either complete bioprosthesis redeployment or initiate bioprosthesis recapture. If the bioprosthesis has been recaptured 3 times, withdraw the recaptured bioprosthesis.
Note: Shortly after annular contact, the blood pressure will be reduced until approximately the 2/3 deployment point, when the bioprosthesis leaflets are exposed and are functioning.
Postdeployment
30. Perform an angiogram to assess the location of the bioprosthesis.
31. Under fluoroscopic guidance, confirm that the catheter tip is coaxial with the inflow portion of the bioprosthesis.
32. Withdraw the catheter to the aorta while maintaining guidewire position.
35
Note: For transfemoral access, withdraw the catheter until the catheter tip is positioned in the descending aorta. For direct aortic access and subclavian access, withdraw the catheter until the catheter tip is close to the distal tip of the introducer sheath.
33. Under fluoroscopic guidance, close the catheter capsule.
Caution: Close the capsule until it is aligned with the catheter tip. Do not overcapture the catheter tip, because it could interfere with catheter withdrawal through the introducer sheath or cause vessel trauma upon removal.
Caution: Ensure the capsule is closed before catheter removal.
Caution: When using a separate introducer sheath, if increased resistance is encountered when removing the catheter through the introducer sheath, do not force passage. Increased resistance may indicate a problem and forced passage may result in damage to the device and/or harm to the patient. If the cause of resistance cannot be determined or corrected, remove the catheter and introducer sheath as a single unit over the guidewire, and inspect the catheter and confirm that it is complete.
34. Withdraw the catheter until the capsule meets the distal end of the EnVeo R InLine™ sheath.
Note: For direct aortic access procedures, maintain the EnVeo R InLine™ sheath at the proximal end of the catheter.
35. Withdraw the catheter and EnVeo R InLine™ sheath together, and dispose of the device in accordance with local regulations and hospital procedures.
36. Advance a 6 Fr pigtail catheter over the guidewire into the LV.
37. Remove the guidewire and connect the pigtail catheter to the transducer.
38. Using both pigtail catheters, record aortic pressure gradient.
39. Remove the 6 Fr pigtail over a standard, J-tip guidewire.
40. Perform a postimplant aortogram with the reference pigtail to ensure coronary patency and assess aortic regurgitations.
Note: In the event that valve function or sealing is impaired due to excessive calcification or incomplete expansion, a postimplant balloon dilatation of the bioprosthesis may improve valve function and sealing. To ensure patient safety, valve size and patient anatomy must be considered when selecting the size of the balloon used for dilatation. The balloon size chosen for dilatation should not exceed the diameter of the native aortic annulus or, for surgical bioprosthetic valves, the manufacturer's labeled inner diameter. Refer to the specific balloon catheter manufacturer's compliance chart to ensure that the applied inflation pressure does not result in a balloon diameter that exceeds the indicated annulus range for the bioprosthesis. Refer to the specific balloon catheter manufacturer's labeling for proper instruction on the use of balloon catheter devices. Note: Bench testing has only been conducted to confirm compatibility with NuMED Z-MED™ and Z-MED II™ Balloon Aortic Valvuloplasty catheters where CoreValve™ Evolut™ PRO bioprosthesis device performance was maintained after dilatation. Data on file.

36
41. Remove the introducer sheath (if used) and complete the puncture site closure per standard practice.
42. Perform contrast angiography to verify the absence of any vascular complications.
43. Remove the reference pigtail catheter over a standard guidewire. Remove the 6 Fr introducer sheath and close the access site per standard practice.
44. Administer anticoagulation and/or antiplatelet therapy as required according to physician/clinical judgment.
37
10.0 Return of explanted bioprostheses
Medtronic is interested in obtaining recovered bioprostheses. Specific pathological studies of the explanted bioprosthesis will be conducted under the direction of a consulting pathologist. A written summary of the findings will be returned to the physician. To obtain a product return kit, contact a Medtronic distribution center or a Medtronic Representative. If a kit is not available, place the explanted bioprosthesis in a container of glutaraldehyde or 10% buffered formalin immediately after excision. For further instructions on the return of an explanted device, contact a Medtronic Representative.
38
11.0 Summary of clinical studies
The Medtronic CoreValve™ SURTAVI Trial was designed and executed to evaluate the safety and efficacy of transcatheter aortic valve implantation (TAVR) in subjects with severe, symptomatic aortic stenosis (AS) at intermediate surgical risk (heart team agreement of predicted risk of operative mortality is ≥3% and <15% at 30 days) by randomizing subjects to either surgical aortic valve replacement (SAVR) or TAVR. The CoreValve Evolut PRO system has been demonstrated to be equivalent to the CoreValve™ Evolut™ R system, with similar safety and performance outcomes. Therefore, the results of the SURTAVI Clinical Trial are applicable to the CoreValve™ Evolut™ PRO system.
Section 11.1 presents the results of the SURTAVI Trial.
The Medtronic CoreValve™ Evolut™ PRO US Clinical Study is a prospective, single-arm, multi-center study designed to evaluate the safety and efficacy of the Evolut™ PRO system (23 mm, 26 mm, and 29 mm valves) for the treatment of severe aortic stenosis in patients considered at high to extreme risk for surgical aortic valve replacement. Patients received the Evolut™ PRO bioprosthesis either through the transfemoral access route (97.8% [44/45]) or through the subclavian (2.2% [1/45]) or direct aortic (0.0% [0/45]) access routes.
Section 11.2 presents the results of the Medtronic CoreValve™ Evolut™ PRO US Clinical Study.
11.1 Intermediate Risk trial (SURTAVI) The Surgical Replacement and Transcatheter Aortic Valve Implantation (SURTAVI) trial is a prospective, randomized, unblinded, multi-center investigational study. The purpose of this trial is to investigate the safety and efficacy of transcatheter aortic valve implantation (TAVR) in subjects with severe, symptomatic aortic stenosis (AS) at intermediate surgical risk by randomizing subjects to either surgical aortic valve replacement (SAVR) or TAVR.
A total of 1746 subjects were randomized in this study (879 subjects were randomized to TAVR and 867 subjects were randomized to surgical aortic valve replacement [SAVR]) at 87 activated centers. Severe aortic stenosis was defined as an aortic valve area of ≤0.8 cm2 or aortic valve area index ≤0.5 cm2, a mean aortic valve gradient of >40 mmHg or jet velocity >4 m/sec. The primary objective of the study was to demonstrate that the safety and effectiveness of the Medtronic CoreValve™ system (TAVR), as measured by all-cause mortality or disabling stroke at 24 months, is non-inferior to surgical aortic valve replacement (SAVR) in the treatment of symptomatic severe aortic stenosis in subjects who have a predicted intermediate risk for aortic valve surgery.
Of the 879 subjects randomized to TAVR, 864 received an attempted implant and comprise the primary analysis cohort (the modified intention-to-treat [mITT] cohort) TAVR set, while 796 of the 867 randomized to SAVR received an attempted implant and comprise the mITT SAVR cohort. The implanted population (863 TAVR and 794 SAVR) consists of all subjects who were implanted with a valve. Of the 863 subjects in the Implanted TAVR group, 724 were attempted with the CoreValve™ system, 139 with the CoreValve™ Evolut™ R system. The following data summarize the results from the SURTAVI trial.
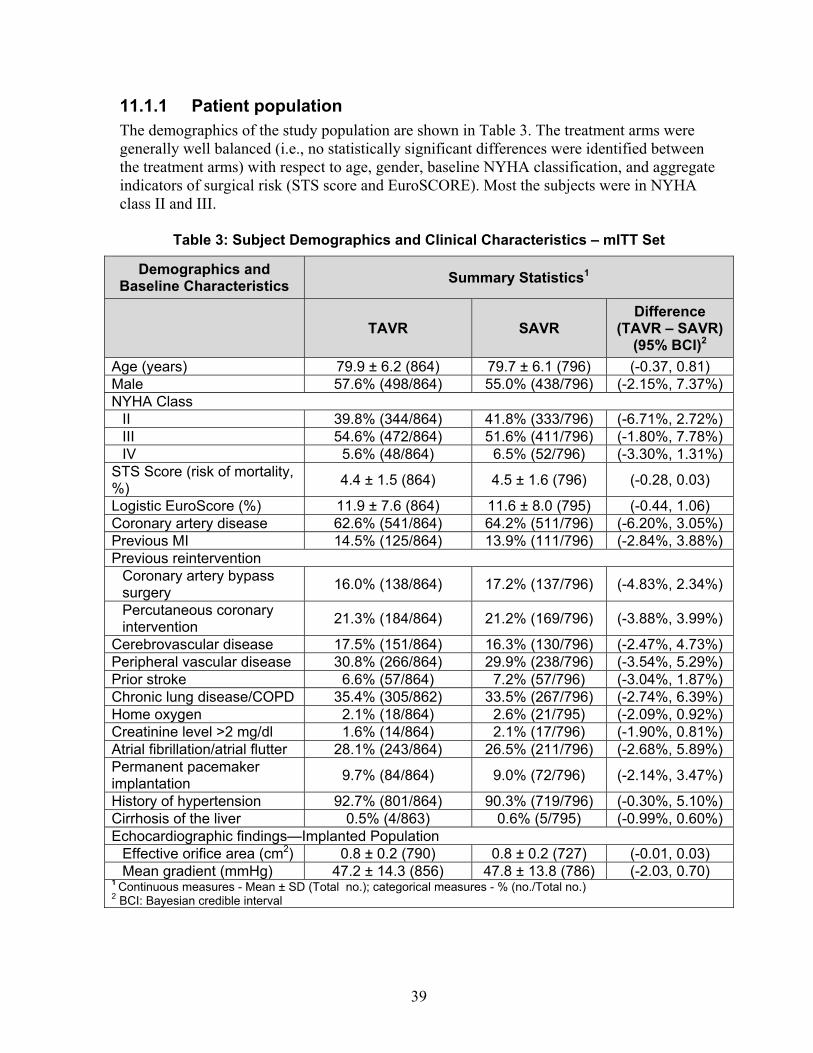
39
11.1.1 Patient population The demographics of the study population are shown in Table 3. The treatment arms were generally well balanced (i.e., no statistically significant differences were identified between the treatment arms) with respect to age, gender, baseline NYHA classification, and aggregate indicators of surgical risk (STS score and EuroSCORE). Most the subjects were in NYHA class II and III.
Table 3: Subject Demographics and Clinical Characteristics – mITT Set
Demographics and Baseline Characteristics
Summary Statistics1
TAVR SAVR
Difference (TAVR – SAVR)
(95% BCI)2
Age (years) 79.9 ± 6.2 (864) 79.7 ± 6.1 (796) (-0.37, 0.81)Male 57.6% (498/864) 55.0% (438/796) (-2.15%, 7.37%)NYHA Class
II 39.8% (344/864) 41.8% (333/796) (-6.71%, 2.72%)III 54.6% (472/864) 51.6% (411/796) (-1.80%, 7.78%)IV 5.6% (48/864) 6.5% (52/796) (-3.30%, 1.31%)
STS Score (risk of mortality, %)
4.4 ± 1.5 (864) 4.5 ± 1.6 (796) (-0.28, 0.03)
Logistic EuroScore (%) 11.9 ± 7.6 (864) 11.6 ± 8.0 (795) (-0.44, 1.06)Coronary artery disease 62.6% (541/864) 64.2% (511/796) (-6.20%, 3.05%)Previous MI 14.5% (125/864) 13.9% (111/796) (-2.84%, 3.88%)Previous reintervention
Coronary artery bypass surgery
16.0% (138/864) 17.2% (137/796) (-4.83%, 2.34%)
Percutaneous coronary intervention 21.3% (184/864) 21.2% (169/796) (-3.88%, 3.99%)
Cerebrovascular disease 17.5% (151/864) 16.3% (130/796) (-2.47%, 4.73%)Peripheral vascular disease 30.8% (266/864) 29.9% (238/796) (-3.54%, 5.29%)Prior stroke 6.6% (57/864) 7.2% (57/796) (-3.04%, 1.87%)Chronic lung disease/COPD 35.4% (305/862) 33.5% (267/796) (-2.74%, 6.39%)Home oxygen 2.1% (18/864) 2.6% (21/795) (-2.09%, 0.92%)Creatinine level >2 mg/dl 1.6% (14/864) 2.1% (17/796) (-1.90%, 0.81%)Atrial fibrillation/atrial flutter 28.1% (243/864) 26.5% (211/796) (-2.68%, 5.89%)Permanent pacemaker implantation
9.7% (84/864) 9.0% (72/796) (-2.14%, 3.47%)
History of hypertension 92.7% (801/864) 90.3% (719/796) (-0.30%, 5.10%)Cirrhosis of the liver 0.5% (4/863) 0.6% (5/795) (-0.99%, 0.60%)Echocardiographic findings—Implanted Population
Effective orifice area (cm2) 0.8 ± 0.2 (790) 0.8 ± 0.2 (727) (-0.01, 0.03)Mean gradient (mmHg) 47.2 ± 14.3 (856) 47.8 ± 13.8 (786) (-2.03, 0.70)
1 Continuous measures - Mean ± SD (Total no.); categorical measures - % (no./Total no.) 2 BCI: Bayesian credible interval
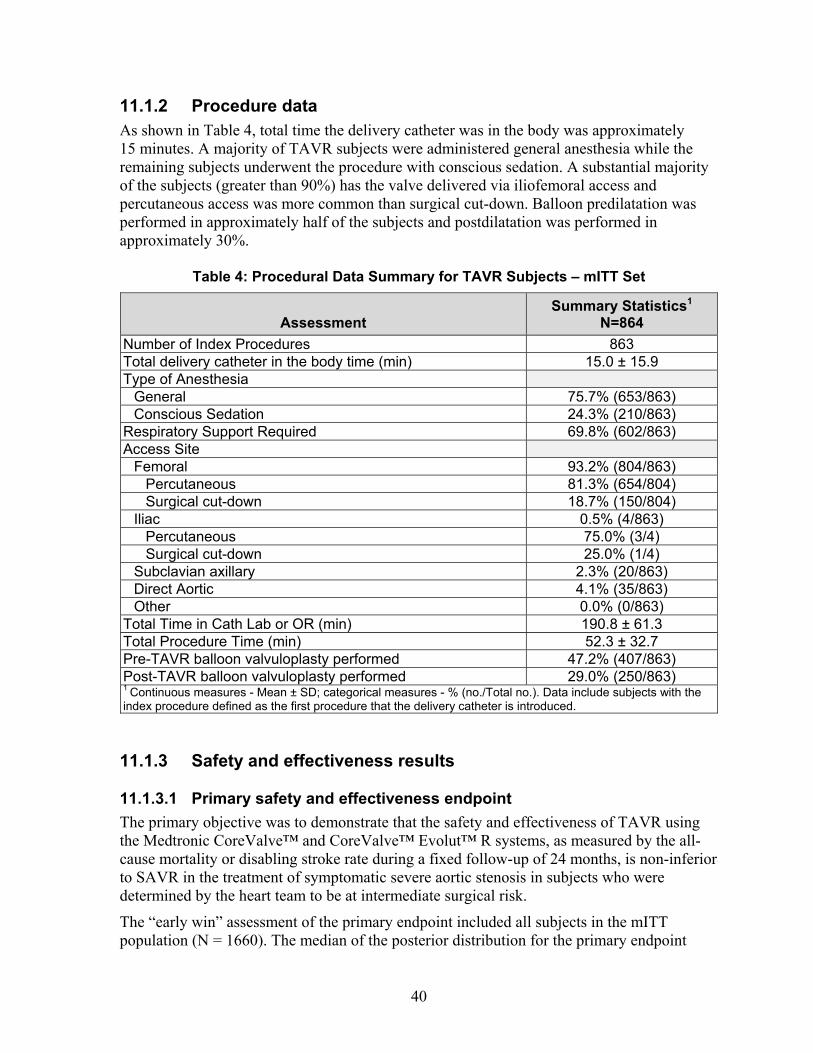
40
11.1.2 Procedure data As shown in Table 4, total time the delivery catheter was in the body was approximately 15 minutes. A majority of TAVR subjects were administered general anesthesia while the remaining subjects underwent the procedure with conscious sedation. A substantial majority of the subjects (greater than 90%) has the valve delivered via iliofemoral access and percutaneous access was more common than surgical cut-down. Balloon predilatation was performed in approximately half of the subjects and postdilatation was performed in approximately 30%.
Table 4: Procedural Data Summary for TAVR Subjects – mITT Set
Assessment Summary Statistics1
N=864
Number of Index Procedures 863 Total delivery catheter in the body time (min) 15.0 ± 15.9 Type of Anesthesia
General 75.7% (653/863) Conscious Sedation 24.3% (210/863)
Respiratory Support Required 69.8% (602/863) Access Site
Femoral 93.2% (804/863) Percutaneous 81.3% (654/804) Surgical cut-down 18.7% (150/804)
Iliac 0.5% (4/863) Percutaneous 75.0% (3/4) Surgical cut-down 25.0% (1/4)
Subclavian axillary 2.3% (20/863) Direct Aortic 4.1% (35/863) Other 0.0% (0/863)
Total Time in Cath Lab or OR (min) 190.8 ± 61.3 Total Procedure Time (min) 52.3 ± 32.7 Pre-TAVR balloon valvuloplasty performed 47.2% (407/863) Post-TAVR balloon valvuloplasty performed 29.0% (250/863) 1 Continuous measures - Mean ± SD; categorical measures - % (no./Total no.). Data include subjects with the index procedure defined as the first procedure that the delivery catheter is introduced.
11.1.3 Safety and effectiveness results
11.1.3.1 Primary safety and effectiveness endpoint
The primary objective was to demonstrate that the safety and effectiveness of TAVR using the Medtronic CoreValve™ and CoreValve™ Evolut™ R systems, as measured by the all-cause mortality or disabling stroke rate during a fixed follow-up of 24 months, is non-inferior to SAVR in the treatment of symptomatic severe aortic stenosis in subjects who were determined by the heart team to be at intermediate surgical risk.
The “early win” assessment of the primary endpoint included all subjects in the mITT population (N = 1660). The median of the posterior distribution for the primary endpoint
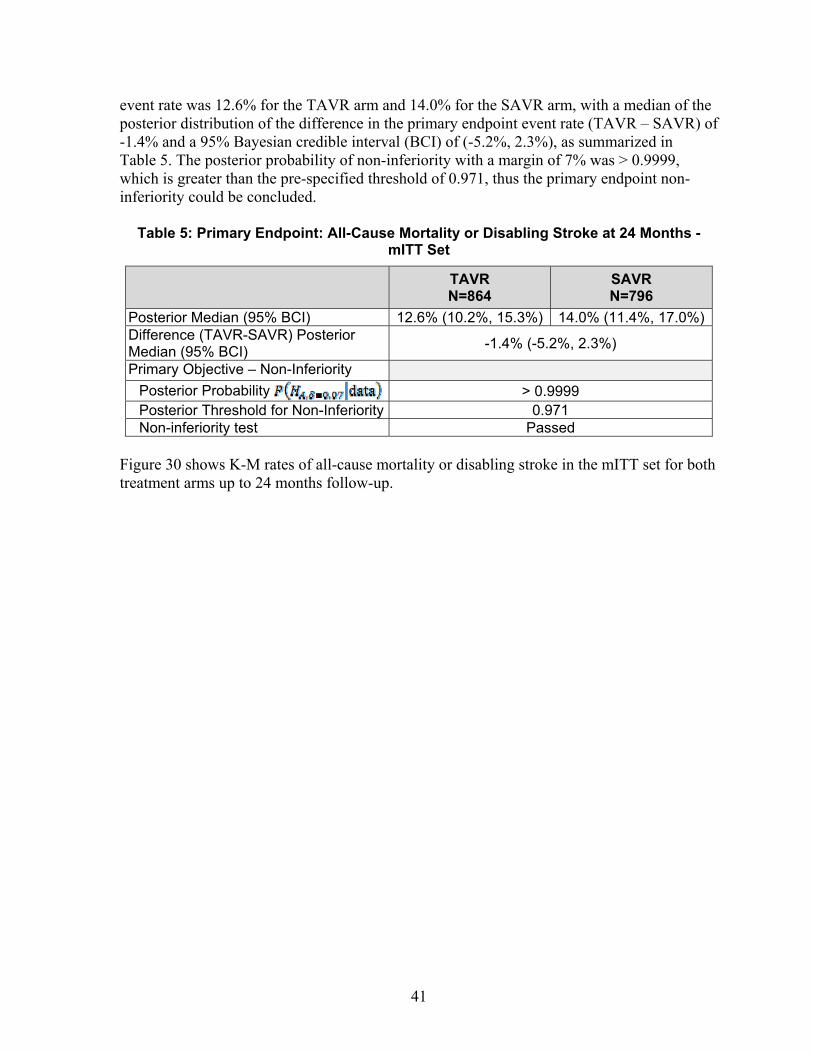
41
event rate was 12.6% for the TAVR arm and 14.0% for the SAVR arm, with a median of the posterior distribution of the difference in the primary endpoint event rate (TAVR – SAVR) of -1.4% and a 95% Bayesian credible interval (BCI) of (-5.2%, 2.3%), as summarized in Table 5. The posterior probability of non-inferiority with a margin of 7% was > 0.9999, which is greater than the pre-specified threshold of 0.971, thus the primary endpoint non-inferiority could be concluded.
Table 5: Primary Endpoint: All-Cause Mortality or Disabling Stroke at 24 Months - mITT Set
TAVR N=864
SAVR N=796
Posterior Median (95% BCI) 12.6% (10.2%, 15.3%) 14.0% (11.4%, 17.0%)Difference (TAVR-SAVR) Posterior Median (95% BCI)
-1.4% (-5.2%, 2.3%)
Primary Objective – Non-Inferiority
Posterior Probability > 0.9999 Posterior Threshold for Non-Inferiority 0.971 Non-inferiority test Passed
Figure 30 shows K-M rates of all-cause mortality or disabling stroke in the mITT set for both treatment arms up to 24 months follow-up.
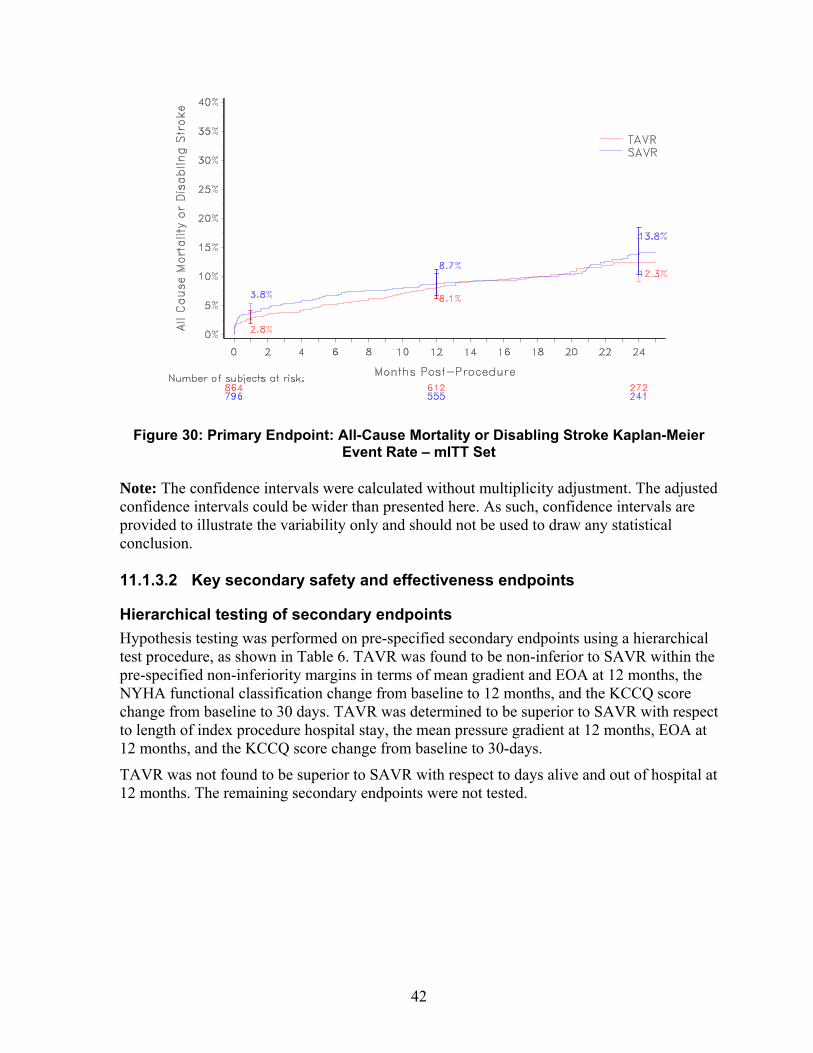
42
Figure 30: Primary Endpoint: All-Cause Mortality or Disabling Stroke Kaplan-Meier
Event Rate – mITT Set
Note: The confidence intervals were calculated without multiplicity adjustment. The adjusted confidence intervals could be wider than presented here. As such, confidence intervals are provided to illustrate the variability only and should not be used to draw any statistical conclusion.
11.1.3.2 Key secondary safety and effectiveness endpoints
Hierarchical testing of secondary endpoints
Hypothesis testing was performed on pre-specified secondary endpoints using a hierarchical test procedure, as shown in Table 6. TAVR was found to be non-inferior to SAVR within the pre-specified non-inferiority margins in terms of mean gradient and EOA at 12 months, the NYHA functional classification change from baseline to 12 months, and the KCCQ score change from baseline to 30 days. TAVR was determined to be superior to SAVR with respect to length of index procedure hospital stay, the mean pressure gradient at 12 months, EOA at 12 months, and the KCCQ score change from baseline to 30-days.
TAVR was not found to be superior to SAVR with respect to days alive and out of hospital at 12 months. The remaining secondary endpoints were not tested.
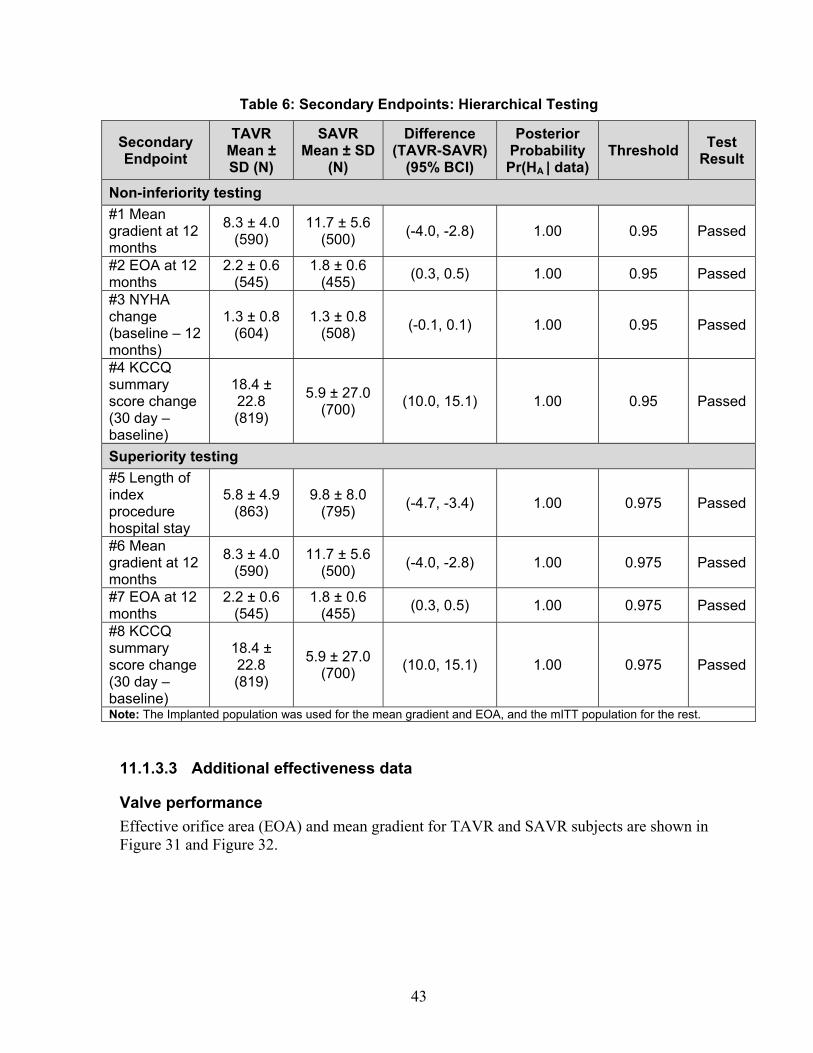
43
Table 6: Secondary Endpoints: Hierarchical Testing
Secondary Endpoint
TAVR Mean ± SD (N)
SAVR Mean ± SD
(N)
Difference (TAVR-SAVR)
(95% BCI)
Posterior Probability Pr(HA | data)
Threshold Test
Result
Non-inferiority testing
#1 Mean gradient at 12 months
8.3 ± 4.0 (590)
11.7 ± 5.6 (500)
(-4.0, -2.8) 1.00 0.95 Passed
#2 EOA at 12 months
2.2 ± 0.6 (545)
1.8 ± 0.6 (455)
(0.3, 0.5) 1.00 0.95 Passed
#3 NYHA change (baseline – 12 months)
1.3 ± 0.8 (604)
1.3 ± 0.8 (508)
(-0.1, 0.1) 1.00 0.95 Passed
#4 KCCQ summary score change (30 day – baseline)
18.4 ± 22.8 (819)
5.9 ± 27.0 (700)
(10.0, 15.1) 1.00 0.95 Passed
Superiority testing
#5 Length of index procedure hospital stay
5.8 ± 4.9 (863)
9.8 ± 8.0 (795)
(-4.7, -3.4) 1.00 0.975 Passed
#6 Mean gradient at 12 months
8.3 ± 4.0 (590)
11.7 ± 5.6 (500)
(-4.0, -2.8) 1.00 0.975 Passed
#7 EOA at 12 months
2.2 ± 0.6 (545)
1.8 ± 0.6 (455)
(0.3, 0.5) 1.00 0.975 Passed
#8 KCCQ summary score change (30 day – baseline)
18.4 ± 22.8 (819)
5.9 ± 27.0 (700)
(10.0, 15.1) 1.00 0.975 Passed
Note: The Implanted population was used for the mean gradient and EOA, and the mITT population for the rest.
11.1.3.3 Additional effectiveness data
Valve performance
Effective orifice area (EOA) and mean gradient for TAVR and SAVR subjects are shown in Figure 31 and Figure 32.
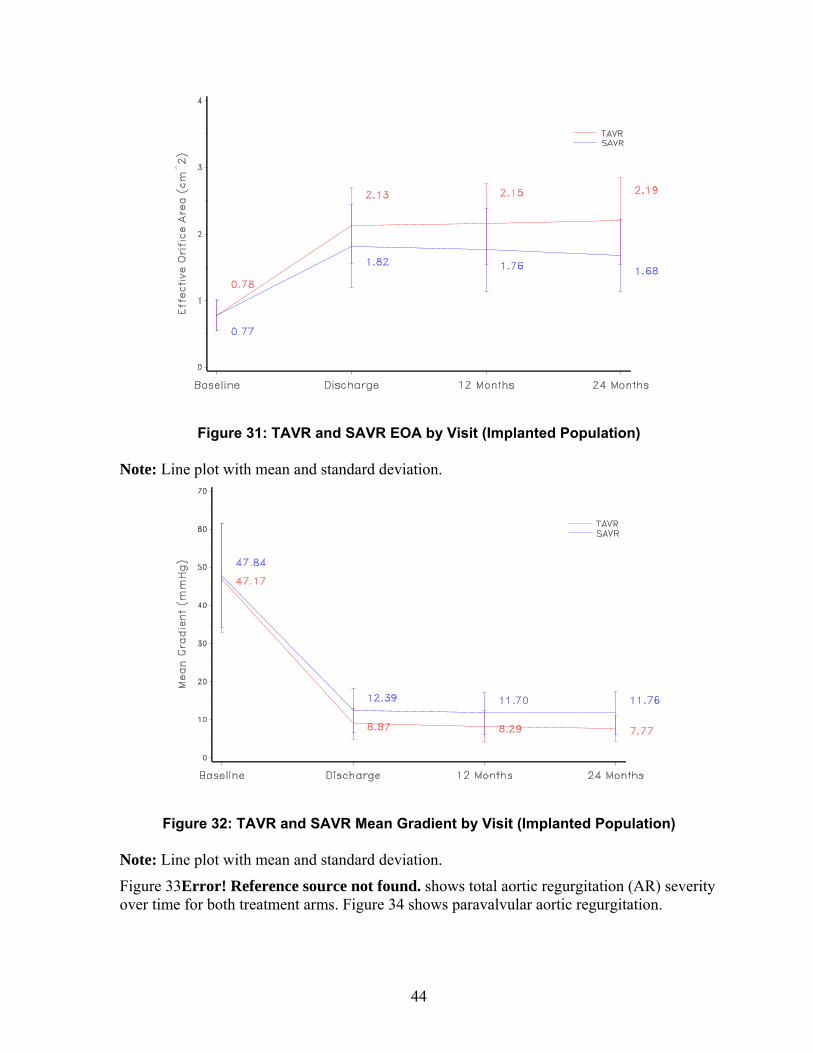
44
Figure 31: TAVR and SAVR EOA by Visit (Implanted Population)
Note: Line plot with mean and standard deviation.
Figure 32: TAVR and SAVR Mean Gradient by Visit (Implanted Population)
Note: Line plot with mean and standard deviation.
Figure 33Error! Reference source not found. shows total aortic regurgitation (AR) severity over time for both treatment arms. Figure 34 shows paravalvular aortic regurgitation.

45
Figure 33: TAVR and SAVR Total Aortic Regurgitation by Visit (Implanted Population)
Note: Values < 1.0% are not labeled.
Figure 34: Paravalvular Aortic Regurgitation by Visit (Implanted Population)
Note: Values < 1.0% are not labeled.
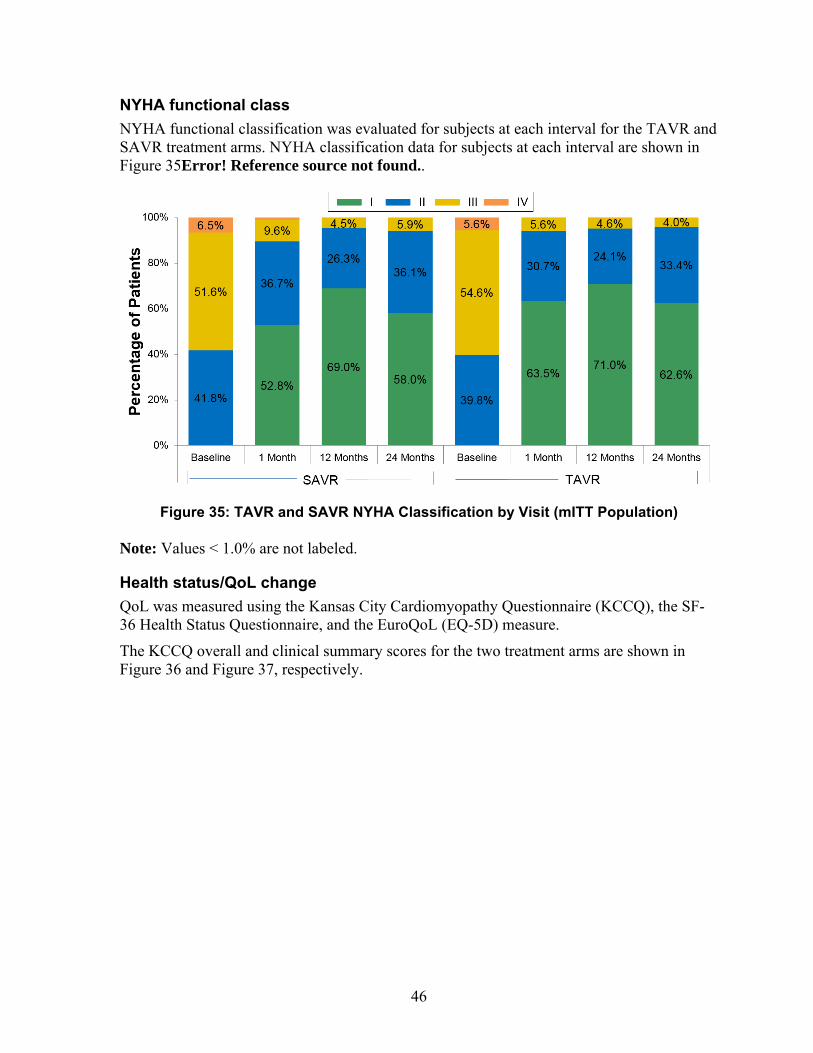
46
NYHA functional class
NYHA functional classification was evaluated for subjects at each interval for the TAVR and SAVR treatment arms. NYHA classification data for subjects at each interval are shown in Figure 35Error! Reference source not found..
Figure 35: TAVR and SAVR NYHA Classification by Visit (mITT Population)
Note: Values < 1.0% are not labeled.
Health status/QoL change
QoL was measured using the Kansas City Cardiomyopathy Questionnaire (KCCQ), the SF-36 Health Status Questionnaire, and the EuroQoL (EQ-5D) measure.
The KCCQ overall and clinical summary scores for the two treatment arms are shown in Figure 36 and Figure 37, respectively.
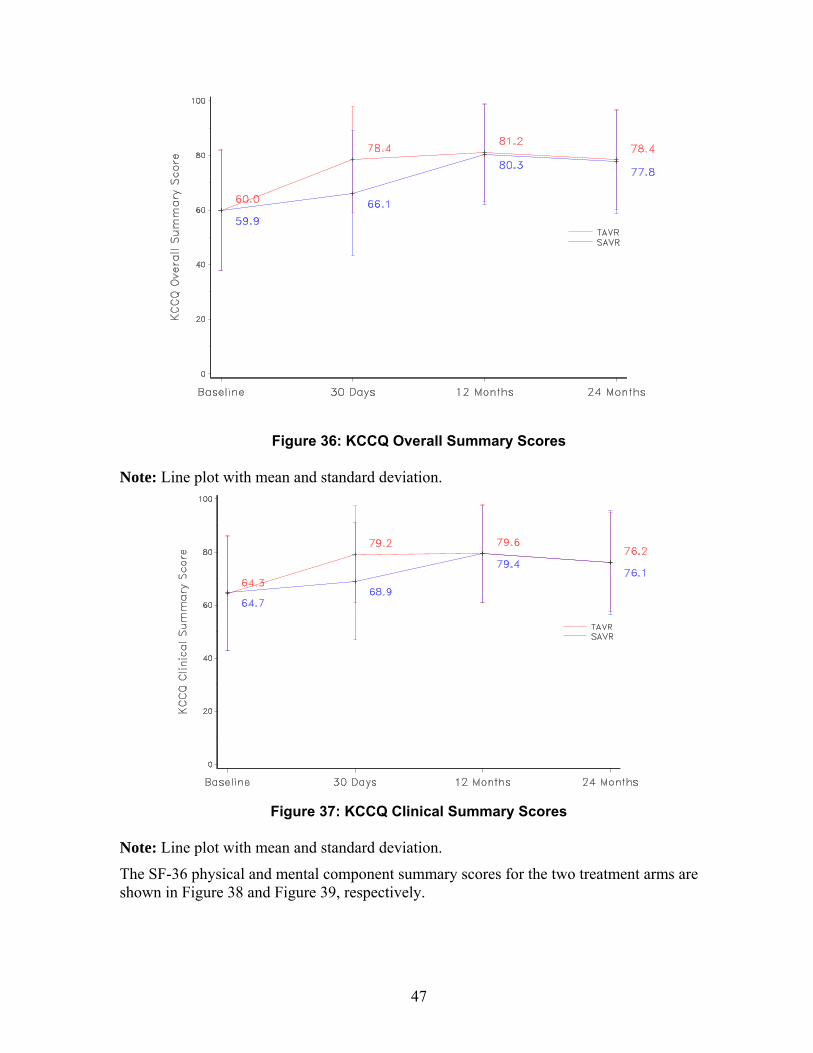
47
Figure 36: KCCQ Overall Summary Scores
Note: Line plot with mean and standard deviation.
Figure 37: KCCQ Clinical Summary Scores
Note: Line plot with mean and standard deviation.
The SF-36 physical and mental component summary scores for the two treatment arms are shown in Figure 38 and Figure 39, respectively.

48
Figure 38: SF-36 Physical Component Summary Scores
Note: Line plot with mean and standard deviation.
Figure 39: SF-36 Mental Component Summary Scores
Note: Line plot with mean and standard deviation.
The EQ-5D index scores for the two treatment arms are shown in Figure 40.

49
Figure 40: EQ5D Index Scores
Note: Line plot with mean and standard deviation.
11.1.3.4 Additional safety data
Adverse events that occurred in the PMA clinical study
Procedural safety and safety during follow-up were evaluated for both TAVR and SAVR within the SURTAVI trial. Kaplan-Meier (K-M) rates of some key CEC-adjudicated events are presented in Table 7.
Table 7: All Adverse Events (0-24 Months) -mITT Set
Events Summary Statistics1
0-30 Days 0-12 Months 0-24 Months
TAVR SAVR TAVR SAVR TAVR SAVR
All-cause mortality or disabling stroke
2.8% (24, 29)
3.8% (30, 33)
8.1% (66, 74)
8.7% (66, 79)
12.3% (87, 97)
13.8% (87, 101)
All-cause mortality 2.1% (18, 18)
1.6% (13, 13)
6.8% (55, 55)
6.9% (51, 51)
11.2% (77, 77)
11.5% (70, 70)
Cardiovascular 2.0% (17, 17)
1.6% (13, 13)
4.8% (39, 39)
5.5% (41, 41)
7.5% (52, 52)
7.8% (51, 51)
Valve-related2 0.0% (0, 0)
0.0% (0, 0)
0.0% (0, 0)
0.1% (1, 1)
0.0% (0, 0)
0.1% (1, 1)
Non-cardiovascular 0.1% 0.0% 2.1% 1.4% 4.0% 4.0%
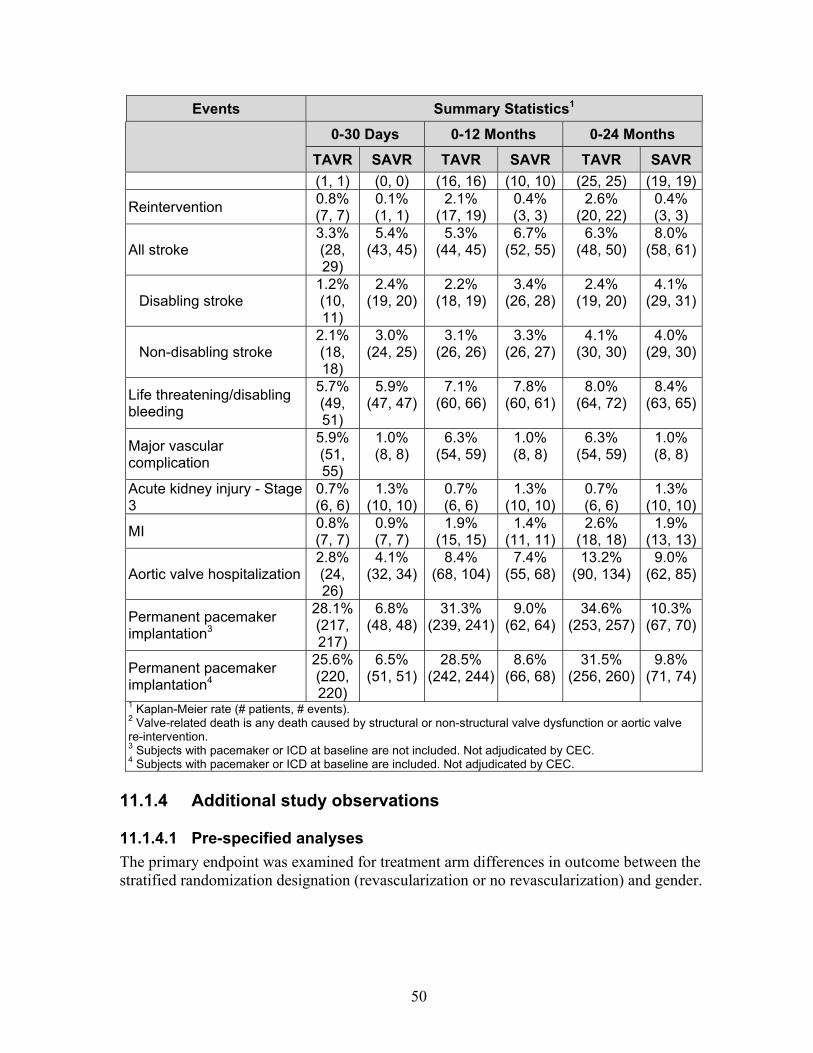
50
Events Summary Statistics1
0-30 Days 0-12 Months 0-24 Months
TAVR SAVR TAVR SAVR TAVR SAVR
(1, 1) (0, 0) (16, 16) (10, 10) (25, 25) (19, 19)
Reintervention 0.8% (7, 7)
0.1% (1, 1)
2.1% (17, 19)
0.4% (3, 3)
2.6% (20, 22)
0.4% (3, 3)
All stroke 3.3% (28, 29)
5.4% (43, 45)
5.3% (44, 45)
6.7% (52, 55)
6.3% (48, 50)
8.0% (58, 61)
Disabling stroke 1.2% (10, 11)
2.4% (19, 20)
2.2% (18, 19)
3.4% (26, 28)
2.4% (19, 20)
4.1% (29, 31)
Non-disabling stroke 2.1% (18, 18)
3.0% (24, 25)
3.1% (26, 26)
3.3% (26, 27)
4.1% (30, 30)
4.0% (29, 30)
Life threatening/disabling bleeding
5.7% (49, 51)
5.9% (47, 47)
7.1% (60, 66)
7.8% (60, 61)
8.0% (64, 72)
8.4% (63, 65)
Major vascular complication
5.9% (51, 55)
1.0% (8, 8)
6.3% (54, 59)
1.0% (8, 8)
6.3% (54, 59)
1.0% (8, 8)
Acute kidney injury - Stage 3
0.7% (6, 6)
1.3% (10, 10)
0.7% (6, 6)
1.3% (10, 10)
0.7% (6, 6)
1.3% (10, 10)
MI 0.8% (7, 7)
0.9% (7, 7)
1.9% (15, 15)
1.4% (11, 11)
2.6% (18, 18)
1.9% (13, 13)
Aortic valve hospitalization 2.8% (24, 26)
4.1% (32, 34)
8.4% (68, 104)
7.4% (55, 68)
13.2% (90, 134)
9.0% (62, 85)
Permanent pacemaker implantation3
28.1%(217, 217)
6.8% (48, 48)
31.3% (239, 241)
9.0% (62, 64)
34.6% (253, 257)
10.3% (67, 70)
Permanent pacemaker implantation4
25.6%(220, 220)
6.5% (51, 51)
28.5% (242, 244)
8.6% (66, 68)
31.5% (256, 260)
9.8% (71, 74)
1 Kaplan-Meier rate (# patients, # events). 2 Valve-related death is any death caused by structural or non-structural valve dysfunction or aortic valve re-intervention. 3 Subjects with pacemaker or ICD at baseline are not included. Not adjudicated by CEC. 4 Subjects with pacemaker or ICD at baseline are included. Not adjudicated by CEC.
11.1.4 Additional study observations
11.1.4.1 Pre-specified analyses
The primary endpoint was examined for treatment arm differences in outcome between the stratified randomization designation (revascularization or no revascularization) and gender.
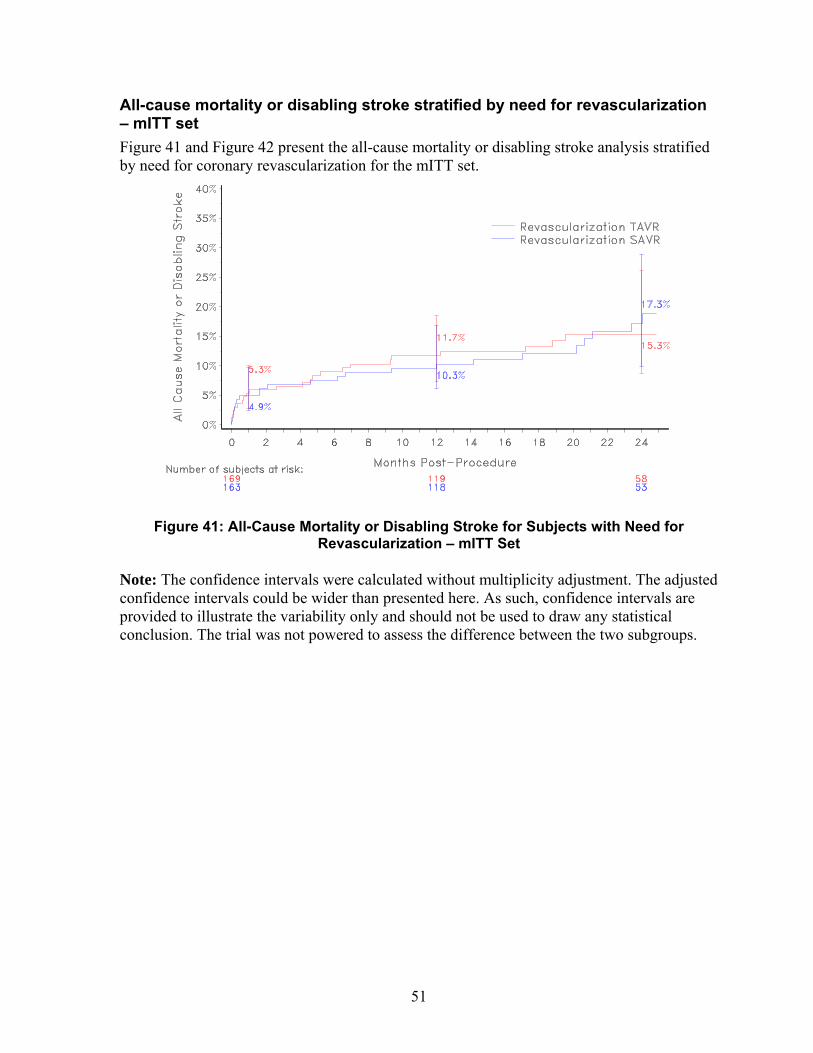
51
All-cause mortality or disabling stroke stratified by need for revascularization – mITT set
Figure 41 and Figure 42 present the all-cause mortality or disabling stroke analysis stratified by need for coronary revascularization for the mITT set.
Figure 41: All-Cause Mortality or Disabling Stroke for Subjects with Need for
Revascularization – mITT Set
Note: The confidence intervals were calculated without multiplicity adjustment. The adjusted confidence intervals could be wider than presented here. As such, confidence intervals are provided to illustrate the variability only and should not be used to draw any statistical conclusion. The trial was not powered to assess the difference between the two subgroups.
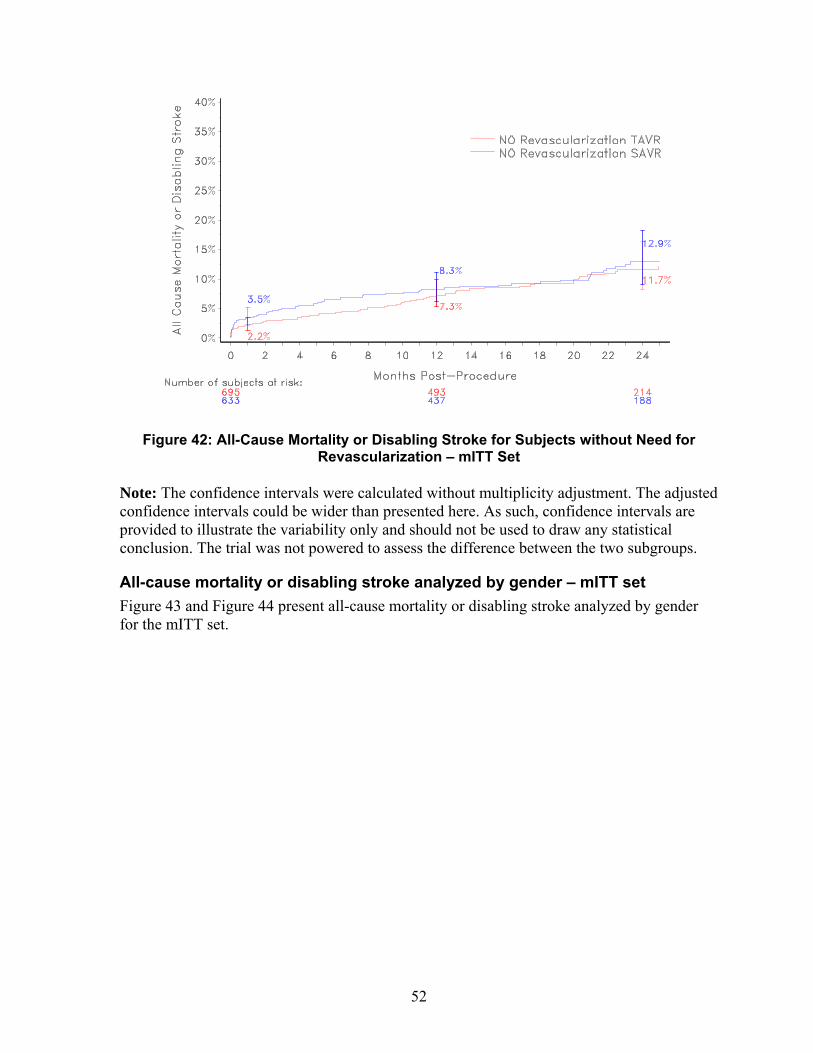
52
Figure 42: All-Cause Mortality or Disabling Stroke for Subjects without Need for
Revascularization – mITT Set
Note: The confidence intervals were calculated without multiplicity adjustment. The adjusted confidence intervals could be wider than presented here. As such, confidence intervals are provided to illustrate the variability only and should not be used to draw any statistical conclusion. The trial was not powered to assess the difference between the two subgroups.
All-cause mortality or disabling stroke analyzed by gender – mITT set
Figure 43 and Figure 44 present all-cause mortality or disabling stroke analyzed by gender for the mITT set.
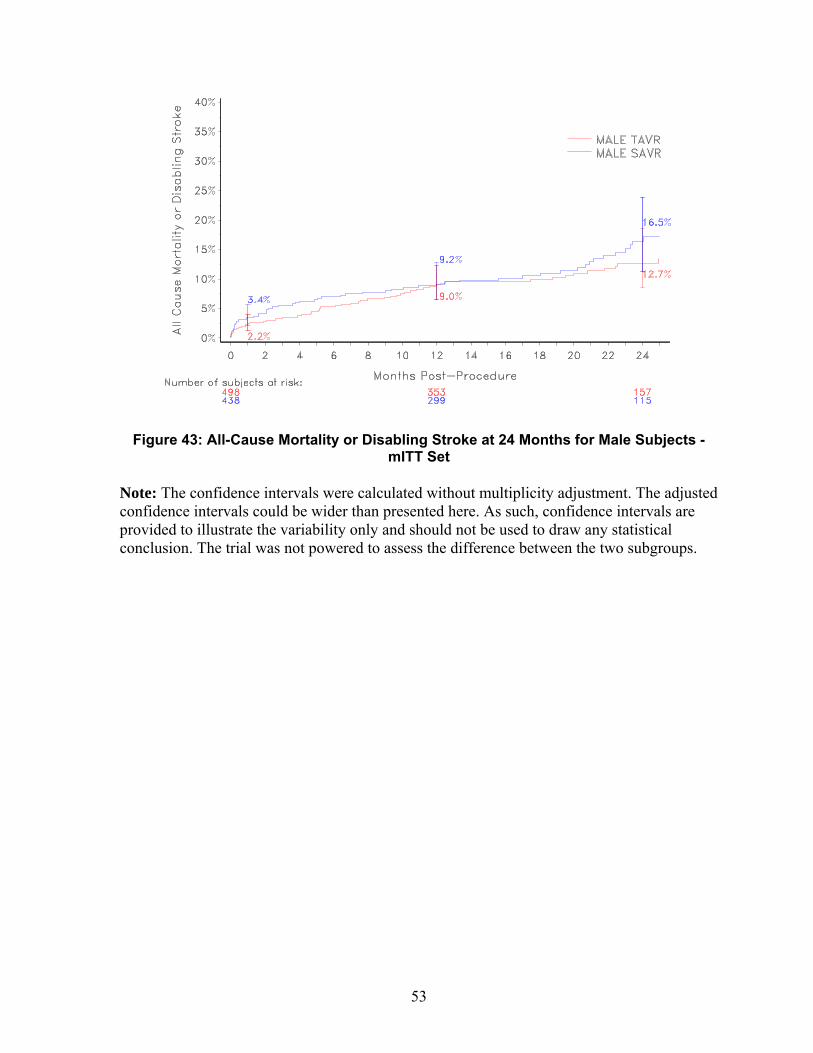
53
Figure 43: All-Cause Mortality or Disabling Stroke at 24 Months for Male Subjects -
mITT Set
Note: The confidence intervals were calculated without multiplicity adjustment. The adjusted confidence intervals could be wider than presented here. As such, confidence intervals are provided to illustrate the variability only and should not be used to draw any statistical conclusion. The trial was not powered to assess the difference between the two subgroups.
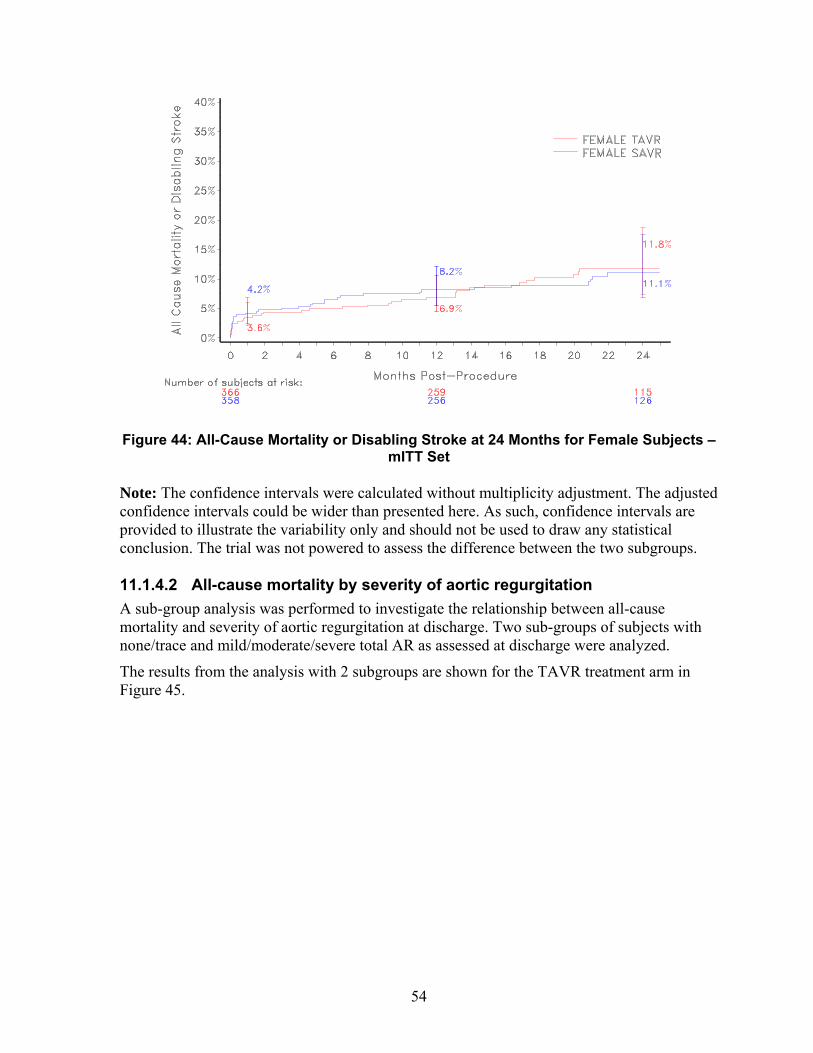
54
Figure 44: All-Cause Mortality or Disabling Stroke at 24 Months for Female Subjects –
mITT Set
Note: The confidence intervals were calculated without multiplicity adjustment. The adjusted confidence intervals could be wider than presented here. As such, confidence intervals are provided to illustrate the variability only and should not be used to draw any statistical conclusion. The trial was not powered to assess the difference between the two subgroups.
11.1.4.2 All-cause mortality by severity of aortic regurgitation
A sub-group analysis was performed to investigate the relationship between all-cause mortality and severity of aortic regurgitation at discharge. Two sub-groups of subjects with none/trace and mild/moderate/severe total AR as assessed at discharge were analyzed.
The results from the analysis with 2 subgroups are shown for the TAVR treatment arm in Figure 45.
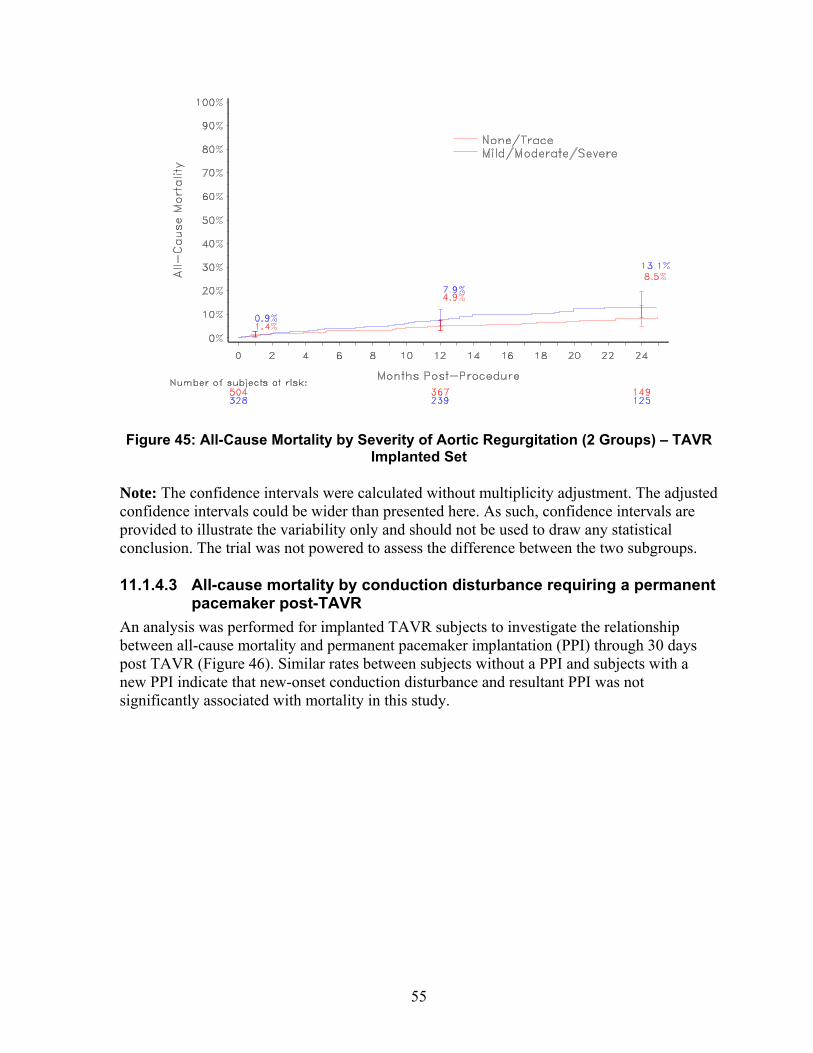
55
Figure 45: All-Cause Mortality by Severity of Aortic Regurgitation (2 Groups) – TAVR
Implanted Set
Note: The confidence intervals were calculated without multiplicity adjustment. The adjusted confidence intervals could be wider than presented here. As such, confidence intervals are provided to illustrate the variability only and should not be used to draw any statistical conclusion. The trial was not powered to assess the difference between the two subgroups.
11.1.4.3 All-cause mortality by conduction disturbance requiring a permanent pacemaker post-TAVR
An analysis was performed for implanted TAVR subjects to investigate the relationship between all-cause mortality and permanent pacemaker implantation (PPI) through 30 days post TAVR (Figure 46). Similar rates between subjects without a PPI and subjects with a new PPI indicate that new-onset conduction disturbance and resultant PPI was not significantly associated with mortality in this study.
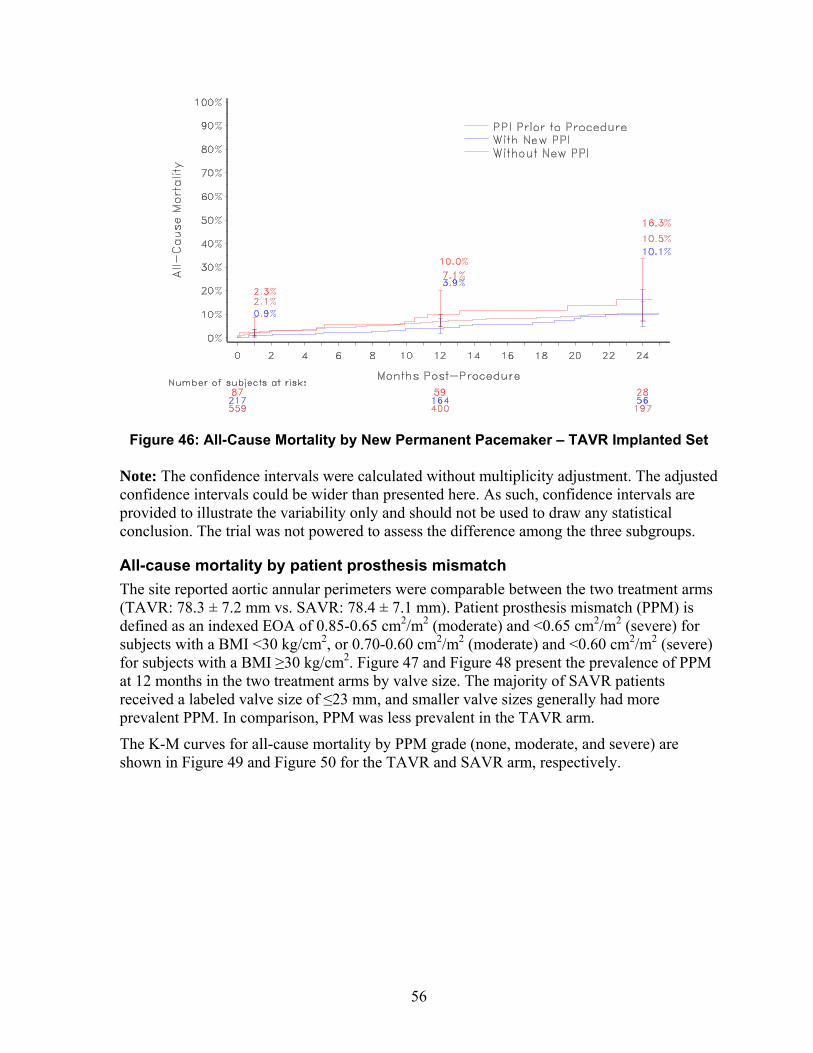
56
Figure 46: All-Cause Mortality by New Permanent Pacemaker – TAVR Implanted Set
Note: The confidence intervals were calculated without multiplicity adjustment. The adjusted confidence intervals could be wider than presented here. As such, confidence intervals are provided to illustrate the variability only and should not be used to draw any statistical conclusion. The trial was not powered to assess the difference among the three subgroups.
All-cause mortality by patient prosthesis mismatch
The site reported aortic annular perimeters were comparable between the two treatment arms (TAVR: 78.3 ± 7.2 mm vs. SAVR: 78.4 ± 7.1 mm). Patient prosthesis mismatch (PPM) is defined as an indexed EOA of 0.85-0.65 cm2/m2 (moderate) and <0.65 cm2/m2 (severe) for subjects with a BMI <30 kg/cm2, or 0.70-0.60 cm2/m2 (moderate) and <0.60 cm2/m2 (severe) for subjects with a BMI ≥30 kg/cm2. Figure 47 and Figure 48 present the prevalence of PPM at 12 months in the two treatment arms by valve size. The majority of SAVR patients received a labeled valve size of ≤23 mm, and smaller valve sizes generally had more prevalent PPM. In comparison, PPM was less prevalent in the TAVR arm.
The K-M curves for all-cause mortality by PPM grade (none, moderate, and severe) are shown in Figure 49 and Figure 50 for the TAVR and SAVR arm, respectively.

57
Figure 47: Prevalence of PPM at 12 Months in the TAVR Arm by Valve Size
Figure 48: Prevalence of PPM at 12 Months in the SAVR Arm by Valve Size

58
Figure 49: All-Cause Mortality by PPM - TAVR Implanted Population
Note: The confidence intervals were calculated without multiplicity adjustment. The adjusted confidence intervals could be wider than presented here. As such, confidence intervals are provided to illustrate the variability only and should not be used to draw any statistical conclusion. The trial was not powered to assess the difference among the three subgroups.
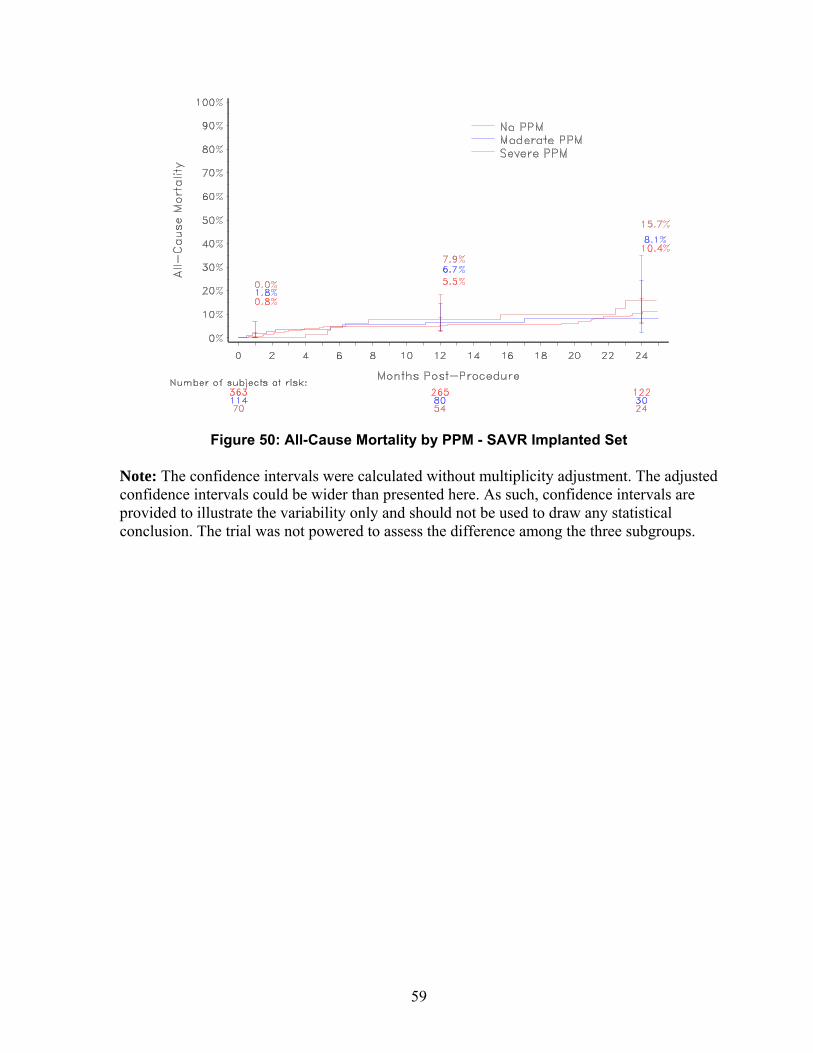
59
Figure 50: All-Cause Mortality by PPM - SAVR Implanted Set
Note: The confidence intervals were calculated without multiplicity adjustment. The adjusted confidence intervals could be wider than presented here. As such, confidence intervals are provided to illustrate the variability only and should not be used to draw any statistical conclusion. The trial was not powered to assess the difference among the three subgroups.
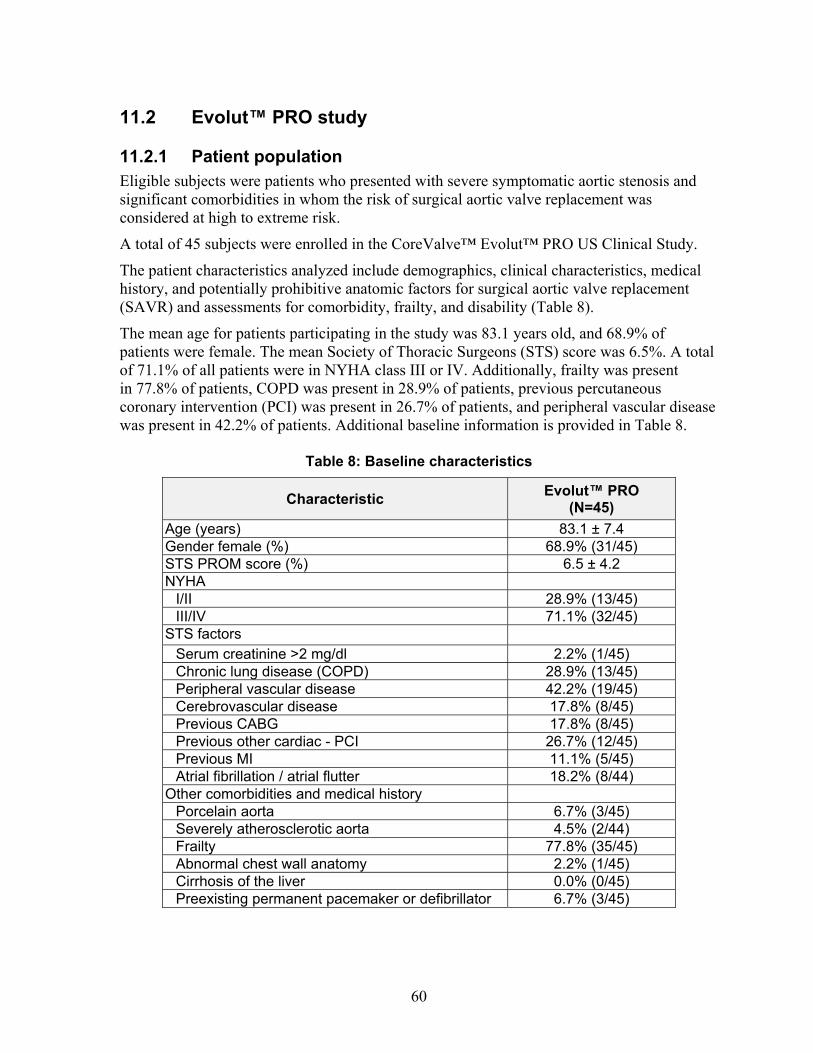
60
11.2 Evolut™ PRO study
11.2.1 Patient population Eligible subjects were patients who presented with severe symptomatic aortic stenosis and significant comorbidities in whom the risk of surgical aortic valve replacement was considered at high to extreme risk.
A total of 45 subjects were enrolled in the CoreValve™ Evolut™ PRO US Clinical Study.
The patient characteristics analyzed include demographics, clinical characteristics, medical history, and potentially prohibitive anatomic factors for surgical aortic valve replacement (SAVR) and assessments for comorbidity, frailty, and disability (Table 8).
The mean age for patients participating in the study was 83.1 years old, and 68.9% of patients were female. The mean Society of Thoracic Surgeons (STS) score was 6.5%. A total of 71.1% of all patients were in NYHA class III or IV. Additionally, frailty was present in 77.8% of patients, COPD was present in 28.9% of patients, previous percutaneous coronary intervention (PCI) was present in 26.7% of patients, and peripheral vascular disease was present in 42.2% of patients. Additional baseline information is provided in Table 8.
Table 8: Baseline characteristics
Characteristic Evolut™ PRO
(N=45)
Age (years) 83.1 ± 7.4 Gender female (%) 68.9% (31/45) STS PROM score (%) 6.5 ± 4.2 NYHA
I/II 28.9% (13/45) III/IV 71.1% (32/45)
STS factors Serum creatinine >2 mg/dl 2.2% (1/45) Chronic lung disease (COPD) 28.9% (13/45) Peripheral vascular disease 42.2% (19/45) Cerebrovascular disease 17.8% (8/45) Previous CABG 17.8% (8/45) Previous other cardiac - PCI 26.7% (12/45) Previous MI 11.1% (5/45) Atrial fibrillation / atrial flutter 18.2% (8/44)
Other comorbidities and medical history Porcelain aorta 6.7% (3/45) Severely atherosclerotic aorta 4.5% (2/44) Frailty 77.8% (35/45) Abnormal chest wall anatomy 2.2% (1/45) Cirrhosis of the liver 0.0% (0/45) Preexisting permanent pacemaker or defibrillator 6.7% (3/45)
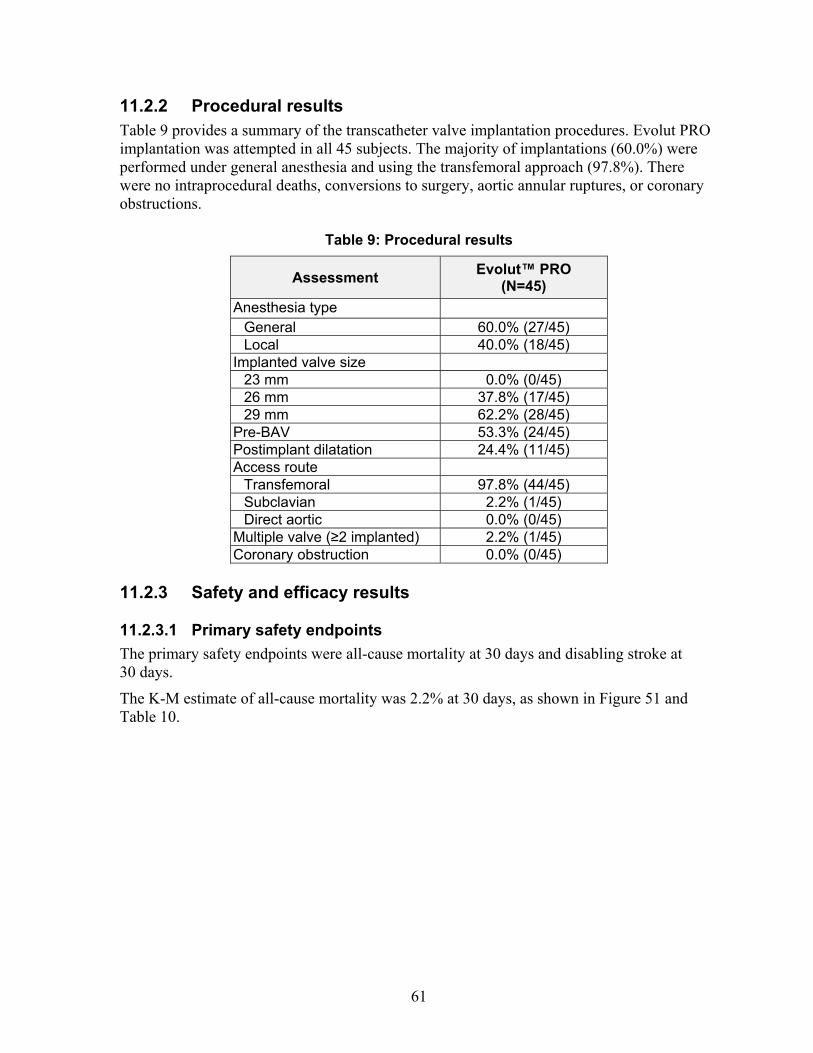
61
11.2.2 Procedural results Table 9 provides a summary of the transcatheter valve implantation procedures. Evolut PRO implantation was attempted in all 45 subjects. The majority of implantations (60.0%) were performed under general anesthesia and using the transfemoral approach (97.8%). There were no intraprocedural deaths, conversions to surgery, aortic annular ruptures, or coronary obstructions.
Table 9: Procedural results
Assessment Evolut™ PRO
(N=45)
Anesthesia type
General 60.0% (27/45) Local 40.0% (18/45)
Implanted valve size 23 mm 0.0% (0/45) 26 mm 37.8% (17/45) 29 mm 62.2% (28/45)
Pre-BAV 53.3% (24/45) Postimplant dilatation 24.4% (11/45) Access route
Transfemoral 97.8% (44/45) Subclavian 2.2% (1/45) Direct aortic 0.0% (0/45)
Multiple valve (≥2 implanted) 2.2% (1/45) Coronary obstruction 0.0% (0/45)
11.2.3 Safety and efficacy results
11.2.3.1 Primary safety endpoints
The primary safety endpoints were all-cause mortality at 30 days and disabling stroke at 30 days.
The K-M estimate of all-cause mortality was 2.2% at 30 days, as shown in Figure 51 and Table 10.
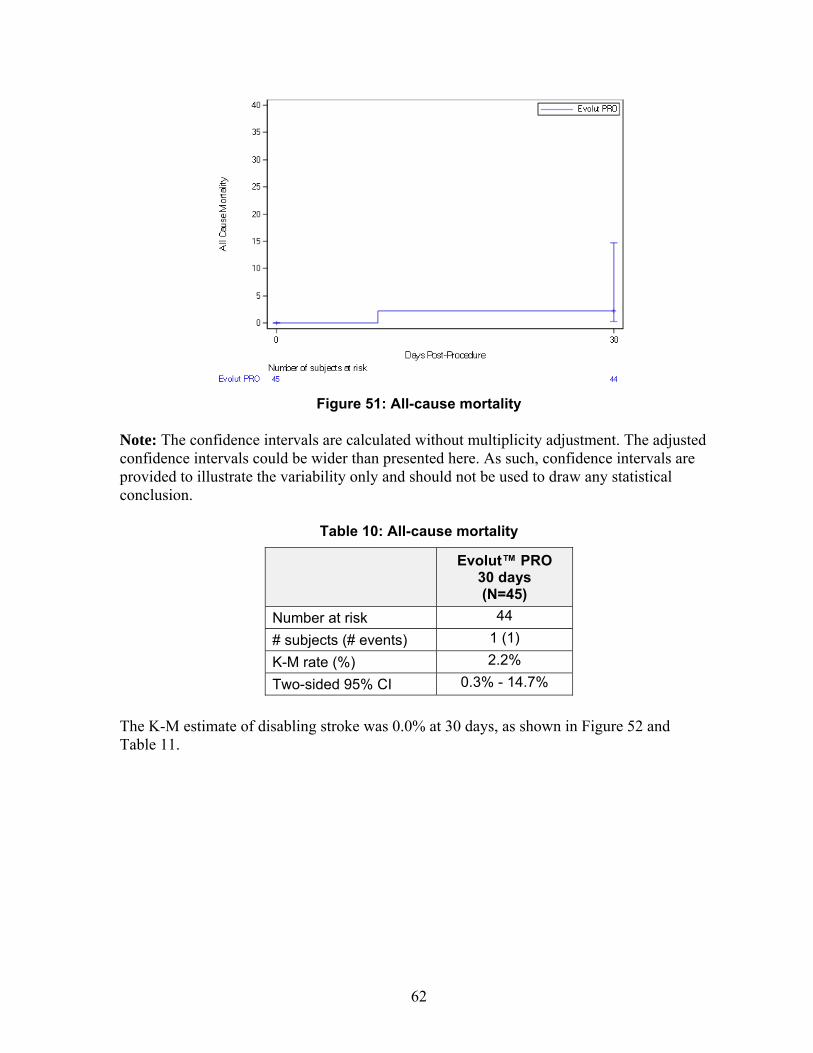
62
Figure 51: All-cause mortality
Note: The confidence intervals are calculated without multiplicity adjustment. The adjusted confidence intervals could be wider than presented here. As such, confidence intervals are provided to illustrate the variability only and should not be used to draw any statistical conclusion.
Table 10: All-cause mortality
Evolut™ PRO
30 days (N=45)
Number at risk 44
# subjects (# events) 1 (1)
K-M rate (%) 2.2%
Two-sided 95% CI 0.3% - 14.7%
The K-M estimate of disabling stroke was 0.0% at 30 days, as shown in Figure 52 and Table 11.
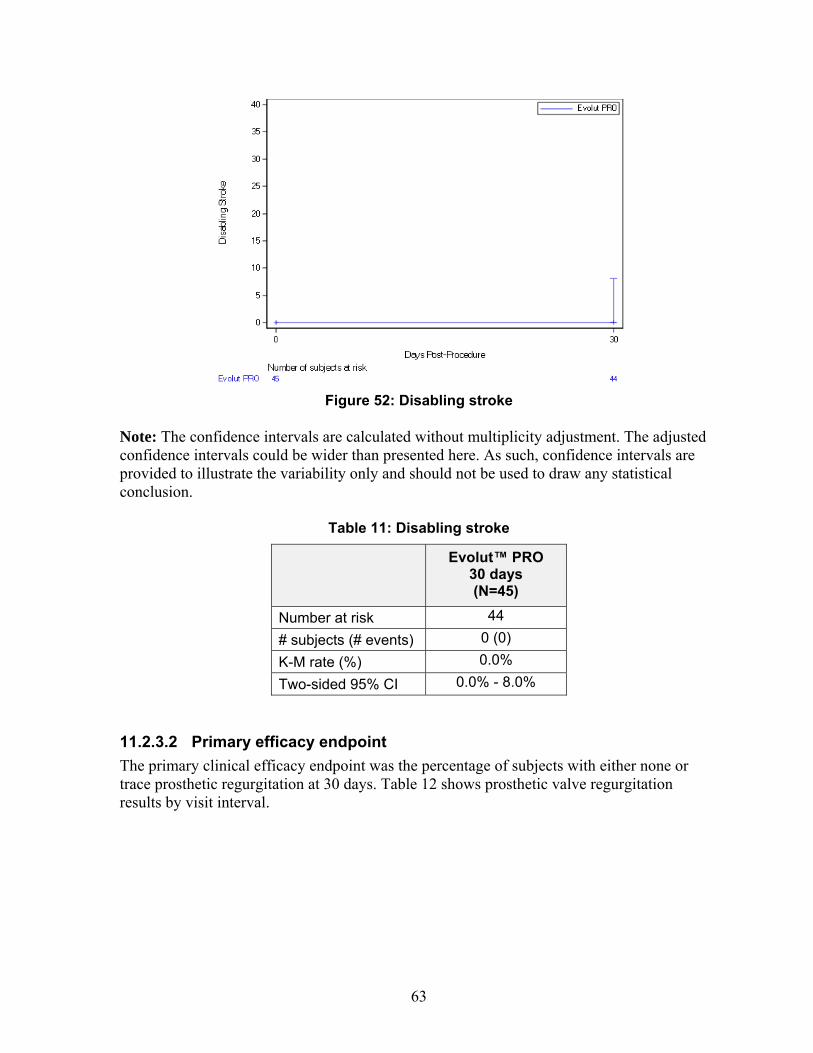
63
Figure 52: Disabling stroke
Note: The confidence intervals are calculated without multiplicity adjustment. The adjusted confidence intervals could be wider than presented here. As such, confidence intervals are provided to illustrate the variability only and should not be used to draw any statistical conclusion.
Table 11: Disabling stroke
Evolut™ PRO
30 days (N=45)
Number at risk 44
# subjects (# events) 0 (0)
K-M rate (%) 0.0%
Two-sided 95% CI 0.0% - 8.0%
11.2.3.2 Primary efficacy endpoint
The primary clinical efficacy endpoint was the percentage of subjects with either none or trace prosthetic regurgitation at 30 days. Table 12 shows prosthetic valve regurgitation results by visit interval.
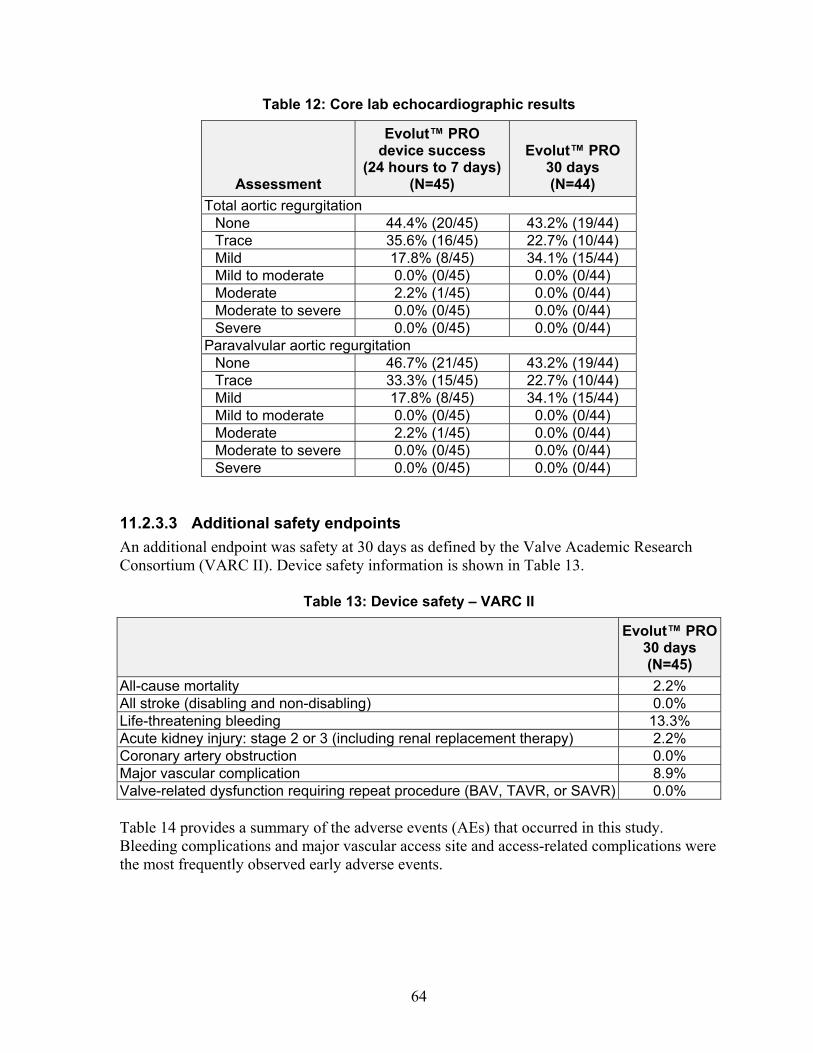
64
Table 12: Core lab echocardiographic results
Assessment
Evolut™ PRO device success
(24 hours to 7 days)(N=45)
Evolut™ PRO 30 days (N=44)
Total aortic regurgitation None 44.4% (20/45) 43.2% (19/44) Trace 35.6% (16/45) 22.7% (10/44) Mild 17.8% (8/45) 34.1% (15/44) Mild to moderate 0.0% (0/45) 0.0% (0/44) Moderate 2.2% (1/45) 0.0% (0/44) Moderate to severe 0.0% (0/45) 0.0% (0/44) Severe 0.0% (0/45) 0.0% (0/44)
Paravalvular aortic regurgitation None 46.7% (21/45) 43.2% (19/44) Trace 33.3% (15/45) 22.7% (10/44) Mild 17.8% (8/45) 34.1% (15/44) Mild to moderate 0.0% (0/45) 0.0% (0/44) Moderate 2.2% (1/45) 0.0% (0/44) Moderate to severe 0.0% (0/45) 0.0% (0/44) Severe 0.0% (0/45) 0.0% (0/44)
11.2.3.3 Additional safety endpoints
An additional endpoint was safety at 30 days as defined by the Valve Academic Research Consortium (VARC II). Device safety information is shown in Table 13.
Table 13: Device safety – VARC II
Evolut™ PRO30 days (N=45)
All-cause mortality 2.2% All stroke (disabling and non-disabling) 0.0% Life-threatening bleeding 13.3% Acute kidney injury: stage 2 or 3 (including renal replacement therapy) 2.2% Coronary artery obstruction 0.0% Major vascular complication 8.9% Valve-related dysfunction requiring repeat procedure (BAV, TAVR, or SAVR) 0.0% Table 14 provides a summary of the adverse events (AEs) that occurred in this study. Bleeding complications and major vascular access site and access-related complications were the most frequently observed early adverse events.
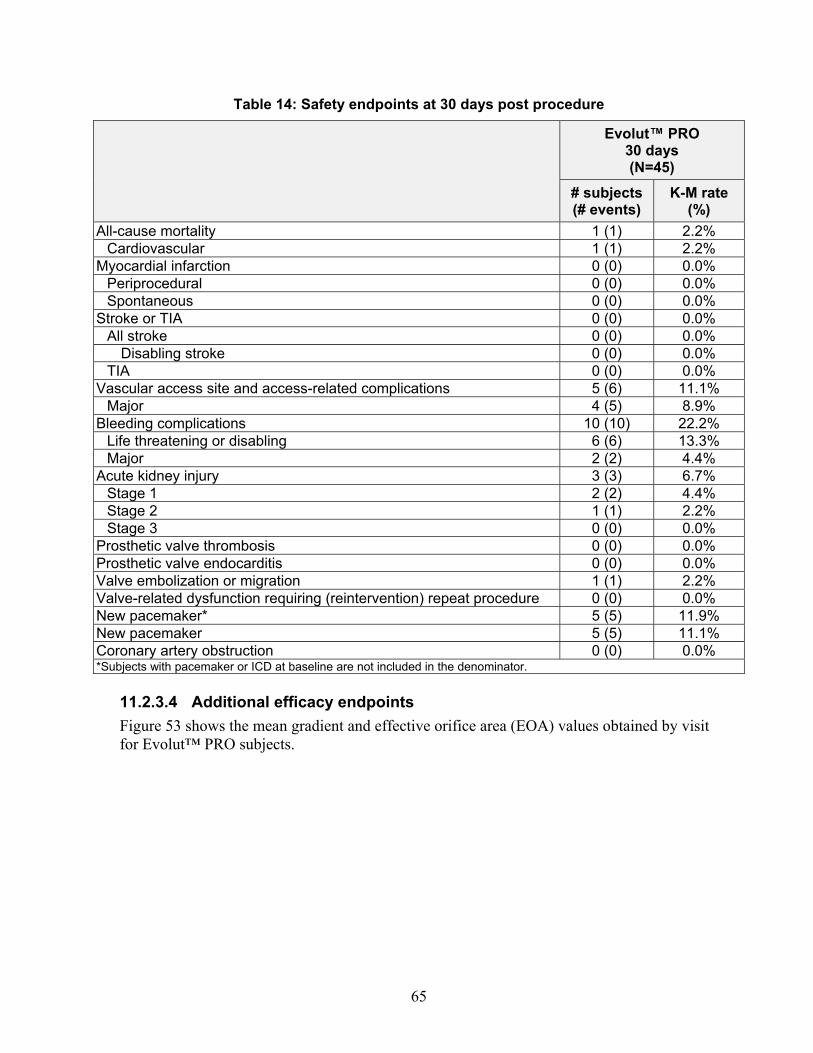
65
Table 14: Safety endpoints at 30 days post procedure
Evolut™ PRO 30 days (N=45)
# subjects (# events)
K-M rate (%)
All-cause mortality 1 (1) 2.2% Cardiovascular 1 (1) 2.2%
Myocardial infarction 0 (0) 0.0% Periprocedural 0 (0) 0.0% Spontaneous 0 (0) 0.0%
Stroke or TIA 0 (0) 0.0% All stroke 0 (0) 0.0%
Disabling stroke 0 (0) 0.0% TIA 0 (0) 0.0%
Vascular access site and access-related complications 5 (6) 11.1% Major 4 (5) 8.9%
Bleeding complications 10 (10) 22.2% Life threatening or disabling 6 (6) 13.3% Major 2 (2) 4.4%
Acute kidney injury 3 (3) 6.7% Stage 1 2 (2) 4.4% Stage 2 1 (1) 2.2% Stage 3 0 (0) 0.0%
Prosthetic valve thrombosis 0 (0) 0.0% Prosthetic valve endocarditis 0 (0) 0.0% Valve embolization or migration 1 (1) 2.2% Valve-related dysfunction requiring (reintervention) repeat procedure 0 (0) 0.0% New pacemaker* 5 (5) 11.9% New pacemaker 5 (5) 11.1% Coronary artery obstruction 0 (0) 0.0% *Subjects with pacemaker or ICD at baseline are not included in the denominator.
11.2.3.4 Additional efficacy endpoints
Figure 53 shows the mean gradient and effective orifice area (EOA) values obtained by visit for Evolut™ PRO subjects.
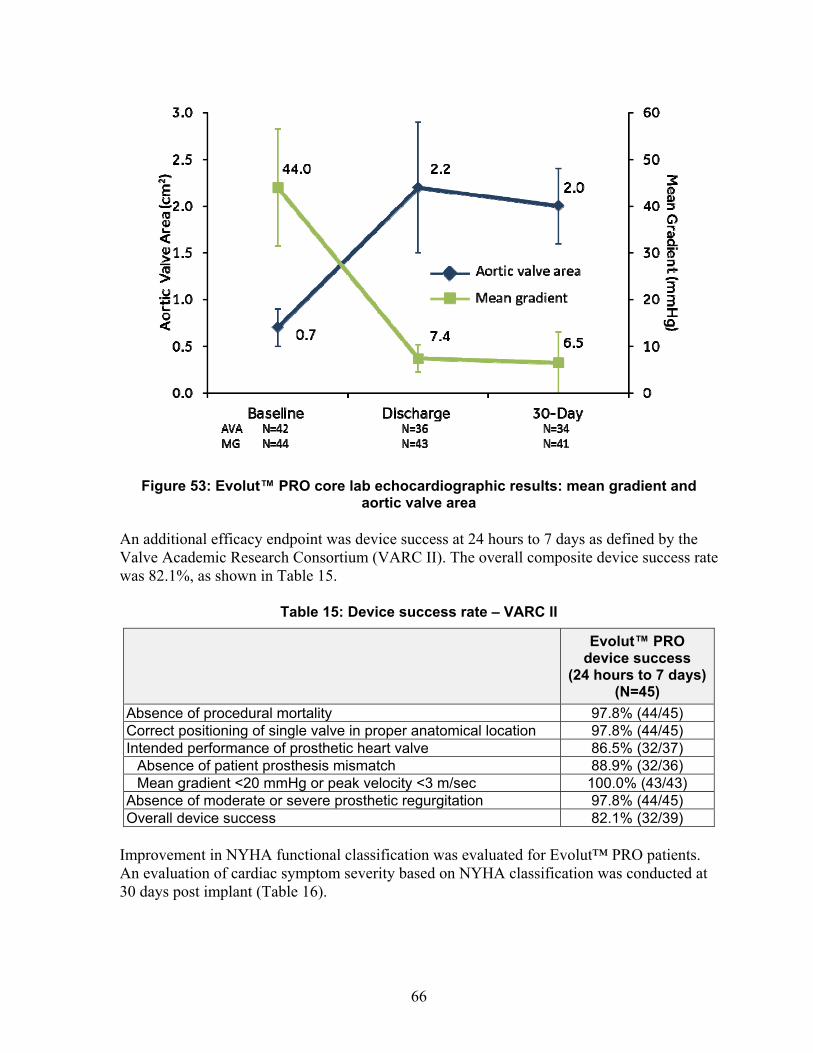
66
Figure 53: Evolut™ PRO core lab echocardiographic results: mean gradient and aortic valve area
An additional efficacy endpoint was device success at 24 hours to 7 days as defined by the Valve Academic Research Consortium (VARC II). The overall composite device success rate was 82.1%, as shown in Table 15.
Table 15: Device success rate – VARC II
Evolut™ PRO device success
(24 hours to 7 days)(N=45)
Absence of procedural mortality 97.8% (44/45) Correct positioning of single valve in proper anatomical location 97.8% (44/45) Intended performance of prosthetic heart valve 86.5% (32/37)
Absence of patient prosthesis mismatch 88.9% (32/36) Mean gradient <20 mmHg or peak velocity <3 m/sec 100.0% (43/43)
Absence of moderate or severe prosthetic regurgitation 97.8% (44/45) Overall device success 82.1% (32/39)
Improvement in NYHA functional classification was evaluated for Evolut™ PRO patients. An evaluation of cardiac symptom severity based on NYHA classification was conducted at 30 days post implant (Table 16).
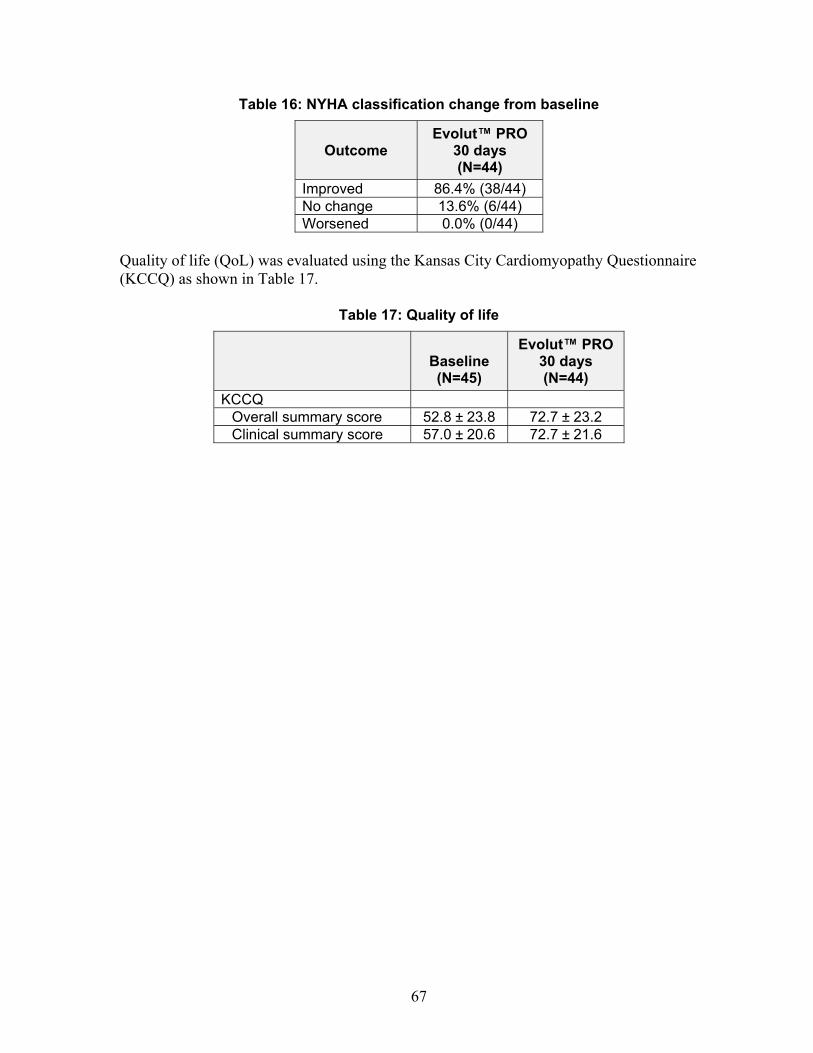
67
Table 16: NYHA classification change from baseline
Outcome Evolut™ PRO
30 days (N=44)
Improved 86.4% (38/44) No change 13.6% (6/44) Worsened 0.0% (0/44)
Quality of life (QoL) was evaluated using the Kansas City Cardiomyopathy Questionnaire (KCCQ) as shown in Table 17.
Table 17: Quality of life
Baseline (N=45)
Evolut™ PRO 30 days (N=44)
KCCQ Overall summary score 52.8 ± 23.8 72.7 ± 23.2 Clinical summary score 57.0 ± 20.6 72.7 ± 21.6
68
12.0 Disclaimer of warranty
The following disclaimer of warranty applies to United States customers only:
DISCLAIMER OF WARRANTY
ALTHOUGH THE MEDTRONIC COREVALVE™ EVOLUT™ PRO TRANSCATHETER AORTIC VALVE (MODELS EVOLUTPRO-23-US, EVOLUTPRO-26-US, AND EVOLUTPRO-29-US), ENVEO™ R DELIVERY CATHETER SYSTEM (MODEL ENVEOR-N-US) AND ENVEO™ R LOADING SYSTEM (MODELS LS-MDT2-23-US AND LS-MDT2-2629-US), HEREAFTER REFERRED TO AS “PRODUCT”, HAVE BEEN MANUFACTURED UNDER CAREFULLY CONTROLLED CONDITIONS, MEDTRONIC HAS NO CONTROL OVER THE CONDITIONS UNDER WHICH THIS PRODUCT IS USED. MEDTRONIC THEREFORE DISCLAIMS ALL WARRANTIES, BOTH EXPRESS AND IMPLIED, WITH RESPECT TO THE PRODUCT, INCLUDING, BUT NOT LIMITED TO, ANY IMPLIED WARRANTY OF MERCHANTABILITY OR FITNESS FOR A PARTICULAR PURPOSE. MEDTRONIC SHALL NOT BE LIABLE TO ANY PERSON OR ENTITY FOR ANY MEDICAL EXPENSES OR ANY DIRECT, INCIDENTAL OR CONSEQUENTIAL DAMAGES CAUSED BY ANY USE, DEFECT, FAILURE OR MALFUNCTION OF THE PRODUCT, WHETHER A CLAIM FOR SUCH DAMAGES IS BASED UPON WARRANTY, CONTRACT, TORT OR OTHERWISE. NO PERSON HAS ANY AUTHORITY TO BIND MEDTRONIC TO ANY REPRESENTATION OR WARRANTY WITH RESPECT TO THE PRODUCT.
The exclusions and limitations set out above are not intended to, and should not be construed so as to, contravene mandatory provisions of applicable law. If any part or term of this DISCLAIMER OF WARRANTY is held by any court of competent jurisdiction to be illegal, unenforceable or in conflict with applicable law, the validity of the remaining portion of the DISCLAIMER OF WARRANTY shall not be affected, and all rights and obligations shall be construed and enforced as if this DISCLAIMER OF WARRANTY did not contain the particular part or term held to be invalid.

Medtronic CoreValve LLC 1851 E Deere Avenue Santa Ana, CA 92705 USA www.medtronic.com +1 763 514 4000 LifeLine Technical Support, 24-hour consultation service: 1 877 526 7890
Protected by one or more of the following United States Patents: 8,226,710 and 7,914,569.
*
M9703
© 2017 Medtronic
M970312A001 Rev. 1C

12A001*