corescope: graph mining using k-core analysis - patterns ...kijungs/papers/kcoreicdm2016.pdf ·...
TRANSCRIPT

CoreScope: Graph Mining Using k-Core Analysis -Patterns, Anomalies and Algorithms
Kijung ShinCarnegie Mellon University
Pittsburgh, PA, [email protected]
Tina Eliassi-RadNortheastern University
Boston, MA, [email protected]
Christos FaloutsosCarnegie Mellon University
Pittsburgh, PA, [email protected]
Abstract—How do the k-core structures of real-world graphslook like? What are the common patterns and the anomalies?How can we use them for algorithm design and applications? Ak-core is the maximal subgraph where all vertices have degreeat least k. This concept has been applied to such diverse areasas hierarchical structure analysis, graph visualization, and graphclustering. Here, we explore pervasive patterns that are relatedto k-cores and emerging in graphs from several diverse domains.
Our discoveries are as follows: (1) MIRROR PATTERN: core-ness of vertices (i.e., maximum k such that each vertex belongsto the k-core) is strongly correlated to their degree. (2) CORE-TRIANGLE PATTERN: degeneracy of a graph (i.e., maximum ksuch that the k-core exists in the graph) obeys a 3-to-1 power lawwith respect to the count of triangles. (3) STRUCTURED COREPATTERN: degeneracy-cores are not cliques but have non-trivialstructures such as core-periphery and communities.
Our algorithmic contributions show the usefulness of thesepatterns. (1) CORE-A, which measures the deviation from MIR-ROR PATTERN, successfully finds anomalies in real-world graphscomplementing densest-subgraph based anomaly detection meth-ods. (2) CORE-D, a single-pass streaming algorithm based onCORE-TRIANGLE PATTERN, accurately estimates the degeneracyof billion-scale graphs up to 7× faster than a recent multi-pass algorithm. (3) CORE-S, inspired by STRUCTURED COREPATTERN, identifies influential spreaders up to 17× faster thantop competitors with comparable accuracy.
Index Terms—Graphs, k-cores, degeneracy, influential nodes,anomaly detection
I. INTRODUCTION
Given an undirected graph G, the k-core is the maximalsubgraph of G in which every vertex is adjacent to at least kvertices [1]. As discussed in Section VI, this concept has beenused extensively in diverse applications, including hierarchicalstructure analysis [2], graph visualization [3], protein functionprediction [4], and graph clustering [5]. An equally useful andclosely related concept is the degeneracy of G, that is, themaximum k such that the k-core exists in G. For example, aclique of 5 vertices itself is a 4-core and thus has degeneracy4; a ring of 10 vertices has degeneracy 2; a star of 100 verticeshas degeneracy 1. The simplest algorithm to compute k-cores,is the so-called “shaving” method: repeatedly deleting verticeswith degree less than k until no such node is left.
Despite the huge interest in k-cores and their applications,it is not known whether k-cores or degeneracy follow anypatterns in real graphs. Our motivating questions are: (1)what are common patterns regarding k-cores or degeneracy
occurring across graphs in diverse domains? (2) are thereanomalies deviating from these patterns? (3) how can thesepatterns and anomalies be used for better algorithm design?
To answer these questions, we present three empiricalpatterns that govern k-cores or degeneracy, across a widevariety of real-world graphs, including social networks, webgraphs, internet topologies, and citation networks. We alsoshow the practical use of these patterns.
Our first MIRROR PATTERN states that the coreness of avertex (i.e., the maximum k such that the vertex belongs tothe k-core) is strongly correlated to its degree, as seen inFigure 1(a). We also observe that anomalies (e.g., the CEO inFigure 1(a) and accounts using ‘follower-booster’ in Twitter)tend to deviate from this pattern. This observation leads toCORE-A, our anomaly detection method based on the degreeof deviation from MIRROR PATTERN. We show that CORE-Ais complementary to recent densest-subgraph based anomalydetection methods [6], [7], and their combination has the bestof the two approaches.
Our second discovery, CORE-TRIANGLE PATTERN, statesthat, in real-world graphs, the degeneracy and the triangle-count obey a power-law with slope 1/3, as seen in Figure 1(b).This relation is theoretically analyzed in very realistic Kro-necker graphs [8], and also utilized in CORE-D, our single-pass streaming algorithm for estimating degeneracy. CORE-Dis up to 7× faster than a recent multi-pass algorithm [9], whileproviding comparable accuracy (see Figure 1(c)).
Our last discovery, STRUCTURED CORE PATTERN, statesthat degeneracy-cores in real-world graphs are not cliques buthave non-trivial structures (core-periphery, communities, etc.),as seen in Figure 1(d). We also show that vertices centralwithin degeneracy-cores are particularly good spreaders up to2.6× more influential than the average vertices in degeneracy-cores, which are already known as good spreaders [10]. Thosespreaders are spotted by CORE-S, our influential spreaderidentification method, which is up to 17× faster than topcompetitors with similar accuracy.
In summary, the contributions of our work are as follows:• Patterns: We discover three empirical patterns that hold
across several real-world graphs from diverse domains.• Anomalies: We detect various interesting anomalies (e.g.,
accounts involved in a ‘follower-boosting’ service inTwitter) from vertices deviating from the patterns.

(a) P1: MIRROR PATTERNA1: Anomaly Detection
(b) P2: CORE-TRIANGLE PATTERN (c) A2: CORE-D Algorithm (d) P3: STRUCTUREDCORE PATTERN
Fig. 1: Three patterns (P1-P3) discovered in real-world graphs, and their applications (A1-A3). (a) P1: Coreness and degree arestrongly correlated. A1: Anomalies deviate from this pattern. (b) P2: Degeneracy and the number of triangles in graphs obey a 3-to-1 powerlaw, which is theoretically supported. (c) A2: Our CORE-D algorithm (with OVERALL MODEL) estimates the degeneracy in a graph stream6× faster and 2× more accurately than its state-of-the-art competitor. (d) P3: As seen in the sparsity pattern of the given degeneracy-core,degeneracy-cores have structure, such as core-periphery and communities, which can be exploited for identifying influential spreaders (A3).
• Algorithms: The patterns are practically used in ouralgorithms for detecting anomalies (CORE-A), estimatingdegeneracy (CORE-D), and identifying influential spread-ers (CORE-S). Our experiments show that our algorithmscomplement or outperform state-of-the-art algorithms.
Reproducibility: Our open-sourced code and the data weused are at http://www.cs.cmu.edu/∼kijungs/codes/kcore/.
In Section II, we give preliminaries on k-cores. In Sec-tion III, we present MIRROR PATTERN and its applicationto anomaly detection. In Section IV, we describe CORE-TRIANGLE PATTERN and CORE-D, a streaming algorithm forestimating degeneracy. STRUCTURED CORE PATTERN and itsapplication to influential spreader detection are presented inSection V. After discussing related work in Section VI, wemake a conclusion in Section VII.
II. PRELIMINARIES
In this section, we provide the definitions of k-core andrelated concepts. We also discuss algorithms for computingk-cores and degeneracy.
A. Definitions and Notations
Let G(V,E) be an undirected unweighted graph. We definen = |V | and m = |E|. We denote the neighbors of a vertexv ∈ V by N(v) = u ∈ V |(u, v) ∈ E and its degree byd(v) = |N(v)|. Likewise, for a subgraph G′(V ′, E′) of G, weuse NG′(v) = u ∈ V ′|(u, v) ∈ E′ and dG′(v) = |NG′(v)|.
The k-core or the core of order k [1] is the maximalsubgraph G′(V ′, E′) where ∀v ∈ V ′, dG′(v) ≥ k. Noticethat, for each k, there exists at most one k-core, and it isnot necessarily a connected subgraph. In addition, cores arenested. The k1-core is a subgraph of the k2-core if k1 ≥ k2.The coreness or core number of a vertex v [1], denoted byc(v), is the order of the highest-order core that v belongs to.A vertex v has coreness k iff v belongs to the k-core but notto the (k + 1)-core. By definition, coreness is upper boundedby degree, i.e., c(v) ≤ d(v). The degeneracy of a graph G,defined as kmax = maxv∈V c(v), is the maximum coreness.The kmax-core is also called degeneracy-core. If we let nmaxand mmax be the number of vertices and that of edges in thedegeneracy-core, the density of the degeneracy-core is definedas Dmax = mmax/
(nmax
2
).
TABLE I: Table of symbols.
Symbol Definition
G(V,E) undirected and unweighted graphA adjacency matrix of Gn number of vertices in Gm number of edges in G
kmax degeneracy of Gnmax number of vertices in the degeneracy-coremmax number of edges in the degeneracy-coreDmax density of the degeneracy-coredavg average degree of Gc(v) coreness of vertex vd(v) degree of vertex vr Pearson correlation coefficientρ Spearman’s rank correlation coefficient
dmp(v) vertex v’s degree of deviation from MIRROR PATTERNDSM densest-subgraph based anomaly detection methods
a-score(G′) anomaly score of subgraph G′#∆ number of triangles in Gλi i-th largest eigenvalue of Ai(v) in-core centrality of vertex vβ infection rate in the SIR Model
Additionally, we denote the number of triangles (i.e., com-plete subgraphs with three vertices) in a graph G by #∆. Theeigenvalues of the adjacency matrix A of G are denoted by(λ1, ..., λn) where λi ≥ λj if i < j. Table I lists the symbolsfrequently used in the paper.
B. Algorithm for k-Cores and Degeneracy
The k-core remains if we remove vertices with degree lessthan k and edges incident to them recursively from G untilno vertex has degree less than k. The (k + 1)-core can becomputed in the same way from the k-core since the (k+ 1)-core is a subgraph of the k-core. Likewise, by computing k-cores sequentially from k = 1 to k = kmax, we divide allvertices according to their coreness. This process, called coredecomposition, runs in O(n+m) [1] if a graph fits in memory.
However, if a graph does not fit in memory, the com-putational cost grows. For example, in a graph stream, arecent method LOGPASS [9] requires O(logα/2(n)) passes ofthe entire graph and n memory space for α-approximationof the degeneracy. In Section IV-C, however, we propose asingle-pass algorithm for estimating degeneracy. Other k-corealgorithms for large graphs are discussed in Section VI.

(a) Catster (ρ = 0.95) (b) Stanford (ρ = 0.86) (c) Skitter (ρ = 0.99) (d) Orkut (ρ = 0.91)
(e) Email (ρ = 0.99) (f) Twitter (ρ = 0.95) (g) Patent (ρ = 0.56) (h) LiveJournal (ρ = 0.93)
Fig. 2: Our MIRROR PATTERN is pervasive in real-world graphs; exceptions signal anomalies. ρ (∈ [−1, 1]) indicates Spearman’srank correlation coefficient; and colors are for heatmap of point density. Degree and coreness have strong positive correlation; exceptions(in red circles) are “strange”: the vertex ranked first in terms of degree but relatively lower in terms of coreness corresponds to an emailaccount of the company’s CEO in (e); vertices ranked first in terms of coreness but relatively lower in terms of degree indicate accountsinvolved in a ‘follower-boosting’ service in (f), ‘copy-and-paste’ bibliography in (g), and an isolated near-clique in (h).TABLE II: Summary of the datasets used in the paper. All graphsare considered undirected and unweighted.
Name n m #∆ kmax nmax Dmax
Social Network
Hamster 1.86K 12.6K 16.8K 20 130 0.24Email 36.7K 184K 727K 43 275 0.26Catster 150K 5.45M 185M 419 1.28K 0.48
YouTube 1.13M 2.99M 3.06M 51 845 0.10Flickr 1.72M 15.6M 548M 568 1.75K 0.49Orkut 3.07M 117M 628M 253 15.7K 0.03
LiveJournal 4.00M 34.7M 178M 360 377 0.99Twitter 41.7M 1.20B 34.8B 2.49K 3.19K 0.90
FriendSter 65.6M 1.81B 4.17B 304 24.5K 0.02
Web Graph
Stanford 282K 1.99M 11.3M 71 387 0.29NotreDame 326K 1.09M 8.91M 155 1.37K 0.12
Internet Topology
Caida 26.5K 53.4K 36.3K 22 64 0.53Skitter 1.70M 11.1M 28.8M 111 222 0.68
Citation Network
HepTh 27.8K 352K 1.48M 37 52 0.86Patent 3.77M 16.5M 7.52M 64 106 0.73
III. PATTERN 1: “MIRROR PATTERN”In this section, we describe MIRROR PATTERN and its
application to anomaly detection. Table II lists the datasets weuse in this work, with more details about them in Appendix A.
A. Observation: Pattern in Real-world GraphsWhat are the key factors determining the coreness of the
vertices in real graphs? We find out a strong positive correla-tion between coreness and degree, which is an upper boundof coreness. As seen in Figure 2, Spearman’s rank correlationcoefficient ρ is significantly higher than 0 (no correlation) inall the considered graphs and close to 1 (perfect correlation) inmany of them. Isolated vertices are ignored when computingρ. This empirical pattern is described in Observation 1.
Observation 1. (MIRROR PATTERN) In real-world graphs,coreness has a strong positive correlation with degree.
B. Application: Anomaly Detection in Real-World Graphs
MIRROR PATTERN implies that vertices with high corenesshave tendency to have high degree and vice versa. However,the degree-coreness plots in Figure 2 highlight some verticesdeviating from the pattern, i.e., vertices ranked first in terms ofdegree but relatively lower in terms of coreness, and vice versa.In this section, we take a close look at these vertices and showthat they indicate two different types of anomalies: ‘loner-stars’ (i.e., vertices mostly connected to ‘loners’) or ‘lockstepbehavior’ (i.e., a group of similarly behaving vertices).
1) Second Email Account of the CEO (Loner-Star): In theEmail dataset, the vertex marked in Figure 2(e) has the highestdegree 1,383 but relatively low coreness 12, deviating fromMIRROR PATTERN. This vertex corresponds to the secondemail account of the former CEO of the company. This accountwas used only to receive emails, and not a single email wassent from this account. The former CEO used the other emailaccount when sending emails. The 99.6% of the sources of thereceived emails are outside the company, while only 0.4% areinside. Since email accounts outside the company mostly havesmall coreness in the dataset (they are ‘loners’), this anomalousemail account has small coreness despite its high degree.
2) ‘Follower-Boosting’ Service in Twitter (Lockstep Behav-ior): In Twitter, the vertices with the highest coreness, markedin Figure 2(f), have relatively low degrees, deviating fromMIRROR PATTERN. We find out that at least 78% of thevertices with the highest coreness were directly involved ina ‘Follower-Boosting’ service (i.e., following ‘@TwitterFol-lower’ in Figure 4) when the Twitter dataset was crawled.Since the accounts involved in the service are densely con-nected with each other (Dmax = 0.90) to boost the followers,

(a) Orkut (b) Flickr (c) YouTube (d) Catster (e) Email
Fig. 3: CORE-A is complementary to DSM; their combination has the best of the two. In social networks, our CORE-A methodaccurately detects small dense subgraphs that cannot be detected accurately by DSM. The combination of CORE-A and DSM successfullydetects both small and large subgraphs. The combination detects up to 3.3× smaller subgraphs than DSM with near-perfect accuracy.
Fig. 4: Vertices deviating from MIRROR PATTERN are involvedin a ‘Follower-booster’ in Twitter. 78% of the vertices in thedegeneracy-core were following the above Twitter account when thedata were crawled. The account still exists without being suspended.
they have the highest coreness despite their relatively lowdegrees. Surprisingly, this misbehavior has been undetectedby Twitter, and ‘@TwitterFollower’ account has not beensuspended or removed since the data was crawled in 2009.
3) ‘Copy-and-Paste’ Bibliography (Lockstep Behavior):As in Twitter, the vertices with the highest coreness in thePatent dataset have relatively low degrees, deviating fromMIRROR PATTERN (see Figure 2(g)). We find out that 88% ofthese vertices are patents owned by the same pharmaceuticalcompany, and bibliography in previous patents of the companyhas been reused repeatedly in a ‘copy-and-paste’ manner inlater patents of the company. This results in a dense subgraphin the citation network, and the patents in the subgraph havethe highest coreness despite their relatively low degrees.
4) Isolated Near-Clique in Live Journal (Lockstep Behav-ior): Vertices with the highest coreness but relatively lowdegrees are also found in the LiveJournal dataset, as markedin Figure 2(h). Although we could not identify actual accountscorresponding to these 377 vertices, their abnormality wassupported by the following facts: (1) The vertices form a near-clique with density 99.7%, unlikely to occur naturally. (2)The group formed by the vertices is isolated as judged fromthe fact that 88% of the neighbors of the vertices are also inthe group, while only 12% are outside. (3) The vertices havesuspicious uniformity. Specifically, 127 vertices (one third ofthe considered vertices) have degrees between 387 and 391.
C. CORE-A: Algorithm for Anomaly Detection
Inspired by the observations in the previous section, wepropose CORE-A, an anomaly detection method based on thedeviation from MIRROR PATTERN. We show that CORE-A iscomplementary to densest-subgraph based anomaly detection,and their combination has the best of the two methods.
1) Algorithm: In the previous section, we show that verticesdeviating from MIRROR PATTERN are worth noticing, as theyindicate the two types of anomalies: ‘loner-stars’ (e.g. the CEOin Figure 2(e)) and ‘lockstep behavior’ (e.g., an isolated near-clique in Figure 2(g)). What scoring function gives a highscore, to both types of anomalies? Deviation from MIRRORPATTERN (dmp) in Definition 1 gives an answer. CORE-A,our proposed anomaly detection method, ranks vertices indecreasing order of dmp. The main idea behind our proposeddmp measure, is to use the rank of each vertex, and since weexpect power-laws, the log of the rank. Specifically, we userankd(v), the fractional rank of vertex v in decreasing degreeorder, and similarly, rankc(v), in decreasing coreness order(in case of the same coreness, in decreasing degree order).
Definition 1 (Deviation from MIRROR PATTERN). A vertexv’s degree of deviation from MIRROR PATTERN in graph G is
dmp(v) ≡ | log(rankd(v))− log(rankc(v))|.
CORE-A has time complexity O(n + m) since the dmpscores of all vertices can be computed in O(n) using ‘countingsort’ once we compute core decomposition in O(n+m) [1].
2) Complementarity of CORE-A: Anomaly detection ingraphs (especially in social networks) has been extensivelyresearched (see Section VI), and many of them detect densesubgraphs since anomalies tend to form dense subgraphs, aswe also show in Section III-B. Especially, the latest methods[6], [7] are based on densest subgraphs (i.e., subgraphs withmaximum average degree). We show that CORE-A and thesedensest-subgraph based methods (DSM) are complementaryas they are good at detecting different-size dense subgraphs.
To demonstrate that CORE-A and DSM (specifically M-ZOOM [6], which includes FRAUDAR [7] as a special case)are complementary, we compare their performances whendifferent-size subgraphs are injected into social networks. Werandomly choose k vertices and inject
(k2
)edges among them
into each network. Then, we compare how precisely andexhaustively each method detects the k chosen vertices usingArea Under the Precision-Recall Curve (AUCPR) [11].
As seen in Figure 3, DSM cannot detect small densesubgraphs accurately, while it detects large ones with near-perfect accuracy. In contrast, CORE-A is more accurate forsmaller subgraphs that cannot be detected by DSM. This isexplained by the fact that the k chosen vertices have degree

and coreness at least k − 1. If k ≈ cmax but k dmax,the vertices tend to have high dmp scores since they havesmall rankc but are likely to have large rankd. However, ifk ≈ dmax, the vertices have low dmp scores since they havesmall rankd as well as small rankc.
3) Combination with DSM: We can have the best ofCORE-A and DSM by combining them. Specifically, wepropose to define the anomaly score (a-score) of a subgraphG′(V ′, E′) in a graph G based on dmp scores in G as follows:
a-score(G′) = |E′|/|V ′|+ w∑
v∈V ′dmp(v)/|V ′| (1)
where w > 0 is a parameter for balancing the two factors:|E′|/|V ′| and
∑v∈V ′ dmp(v)/|V ′|. We set w to the ratio
of the maximum values of the factors in the given graphG(V,E). The maximum value of |E′|/|V ′| is close (withina factor of 2) to |E∗|/|V ∗|, where G∗(V ∗, E∗) is the densestsubgraph detected by DSM; and the maximum value of∑v∈V ′ dmp(v)/|V ′| is maxv∈V dmp(v). We set w to their
ratio, i.e., w = (|E∗|/|V ∗|)/maxv∈V dmp(v). Once we setw, we use [6] to identify the subgraph maximizing a-score (Eq(1)). The vertices in the subgraph are classified as anomalies.This entire process takes O(m log n), as DSM does [6], [7].
Figure 3 illustrates the success of our proposal to combinethe scores (Eq (1)): our combination successfully detectsboth small and large subgraphs injected into social networks,outperforming both its component methods (CORE-A andDSM), and it detects up to 3.3× smaller subgraphs thanDSM, with near-perfect accuracy.
IV. PATTERN 2: “CORE-TRIANGLE PATTERN”
In this section, we present CORE-TRIANGLE PATTERN (C-T PATTERN) in real-world graphs and provide mathematicalanalysis of the pattern. Then, we propose a single-pass stream-ing algorithm for estimating degeneracy, based on the pattern.
A. Observation: Pattern in Real-world Graphs
What are the major factors determining degeneracy, themaximum coreness, in real-world graphs? We investigate therelation between degeneracy and various graph measures inreal-world graphs. As seen in Figure 5, the number of triangleshas a particularly strong correlation (r = 0.94) with degen-eracy in log scale, compared with the node-count (r = 0.75)and the edge-count (r = 0.83). Moreover, the slope is 0.32,which is very close to 1/3. This leads to Observation 2.
Observation 2. (CORE-TRIANGLE PATTERN) (C-T PATTERNin short). In real-world graphs, the triangle count and thedegeneracy obey a 3-to-1 power law. That is,
kmax ∝ (#∆)13 .
B. Analysis in Kronecker Model
Why do real graphs obey C-T PATTERN? Here we showthat C-T PATTERN holds for the so-called ‘Kronecker Model’(Definition 2), which is considered as a very realistic graphmodel obeying common patterns in real-world networks [8].
Fig. 5: CORE-TRIANGLE PATTERN: triangle count and degen-eracy obey a 3-to-1 power law. Each point corresponds to a graphdataset in Table II. The count of triangles has a strong correlation(r = 0.94) with degeneracy in log scale. Moreover, the slope is veryclose to the theoretical slope 1/3 (dashed line).
Definition 2 (Kronecker Graph [8]). Let Gq be the q-thpower Kronecker graph of a seed graph G1. If we denotethe adjacency matrix of Gq by Aq , Aq is defined as:
Aq = Aq−1 ⊗A1 = A1 ⊗A1 ⊗ ...⊗A1,︸ ︷︷ ︸q times
where ⊗ denotes Kronecker Product.
C-T PATTERN in the model is defined formally in Defini-tion 3, where we ignore constant factors for ease of analysis.
Definition 3. (C-T PATTERN in Kronecker Model). A Kro-necker model with seed graph G1 follows C-T PATTERN if(2) holds in Gqq≥1, graphs generated by the model.
kmax = Θ(#∆13 ) or equivalently #∆ = Θ(k3max). (2)
Lemmas 1 and 2 state how rapidly degeneracy and trianglecount increase in Kronecker Model. Both of them increaseexponentially with q, the power of Kronecker products, andthe base numbers depend on seed graphs.
Lemma 1. (Degeneracy in Kronecker Model). Degeneracyin Gqq≥1 increases exponentially with q. Let davg be theaverage degree and λ1 be the largest eigenvalue of theadjacency matrix. Then,1) kmax(Gq) = Ω(max(davg(G1))q, (kmax(G1))q).2) kmax(Gq) = O((λ1(G1))q).
Proof. See the supplementary document [12].
Lemma 2. (Triangles of Kronecker Model). The numberof triangles in Gqq≥1 increases exponentially with q. Letλ(G1) = (λ1, ..., λn) be the eigenvalues of the adjacency ma-trix of the seed graph G1. Then, #∆(Gq) = Θ((
∑ni=1 λ
3i )q).
Proof. See the supplementary document [12].
Based on the speed of increase in degeneracy and trianglecount given in Lemmas 1 and 2, Theorem 1 states a sufficientand a necessary condition for C-T PATTERN to hold in Kro-necker Model. Note that
∑ni=1 λ
3i=λ
31 in (3) and
∑ni=1 λ
3i≤λ31
in (4) can hold since the eigenvalues can be negative.
Theorem 1. (C-T PATTERN in Kronecker Model). In Kro-necker graphs with a seed graph G,1) A sufficient condition for C-T PATTERN to hold is
max(d3avg, k3max) =
n∑i=1
λ3i = λ31. (3)

TABLE III: Sample seed graphs for Kronecker Model. All graphssatisfy the necessary condition for C-T PATTERN, and Mediatorsatisfies also the sufficient condition. When computing kmax anddavg , we add one to the degree for each self-loop if self-loops exist.
Core-Periphery Mediator Triangle Star
Shape
k3max 1 8 8 1d3avg 3.38 8 18.96 5.36∑ni=1 λ
3i 4 8 20 10
λ31 4.24 8 20.39 12.21
Fig. 6: CORE-TRIANGLE PATTERN holds in Kronecker Model.Points represent graphs generated by Kronecker Model with differentseed graphs. The slopes between the triangle count and degeneracyare close to 1/3 (dashed line) in log scale regardless of seed graphs.
2) A seed graph satisfying the sufficient condition exists.3) A necessary condition for C-T PATTERN to hold is
max(d3avg, k3max) ≤
n∑i=1
λ3i ≤ λ31. (4)
Proof. Assume that the sufficient condition holds, and c =max(d3avg, k
3max) =
∑ni=1 λ
3i = λ31. Then, (kmax(Gq))
3 =Θ(cq) by Lemma 1, and #∆(Gq) = Θ(cq) by Lemma 2.Therefore, #∆(Gq) = Θ((kmax(Gq))
3), and C-T PATTERNholds. The Mediator seed graph in Table III satisfies thissufficient condition.
Assume that the necessary condition is not met. By Lem-mas 1 and 2, (kmax(Gq))
3 increases faster than #∆(Gq)if∑ni=1 λ
3i < max(d3avg, k
3max). Instead, #∆(Gq) increases
faster than (kmax(Gq))3 if λ31 <
∑ni=1 λ
3i . Hence, #∆(Gq) 6=
Θ((kmax(Gq))3), and C-T PATTERN does not hold.
Many realistic seed graphs satisfy the necessary conditionfor C-T PATTERN, as listed in Table III. Especially, Mediatorsatisfies also the sufficient condition. Even seed graphs thatdo not satisfy the sufficient condition empirically follow C-TPATTERN, as seen in Figure 6. The slope of regression linebetween the number of triangles and degeneracy is very closeto 1/3 in log scale with all the seed graphs considered.
In addition to Kronecker Model, C-T PATTERN is provedalso in Erdos-renyi (ER) Model (Theorem 2), another math-ematically tractable graph generation model where each ofpossible
(n2
)edges occurs independently with probability p.
Theorem 2. (C-T PATTERN in ER Model). Graphs generatedby ER Model with probability p follow C-T PATTERN in termsof expected values if p = Ω(log n/n). That is,
E[#∆] = Θ(E[kmax]3).
Proof. See the supplementary document [12].
TABLE IV: Models of CORE-D. OVERALL MODEL fits the databest (i.e., has the highest adjusted R2), and the log triangle-countis statistically significant with p-value < 0.001.
Model Variable CoefficientEstimate Std.Err. p-value
Basic(R2
adj = 0.72)
1 -0.03 0.43 0.94log(n) -0.35 0.28 0.24log(m) 0.62 0.24 0.02 *
Triangle 1 -0.20 0.23 0.40(R2
adj = 0.89) log(#∆) 0.32 0.03 1.3e-07 ****
1 0.03 0.20 0.88Overall log(n) 0.18 0.15 0.26
(R2adj = 0.95) log(m) -0.50 0.20 0.03 *
log(#∆) 0.59 0.09 3.3e-05 ****
C. CORE-D: Streaming Algorithm for Degeneracy
Based on C-T PATTERN, we propose CORE-D, a single-pass streaming algorithm for estimating degeneracy. We empir-ically show that CORE-D gives a significantly better trade-offbetween speed and accuracy than a state-of-the-art method.
1) Algorithm: Computing degeneracy in a graph stream notfitting in memory remains as a challenge. As explained inSection II-B, a recent approximate method, LOGPASS, needsO(logα/2(n)) passes and n memory space for given α (≥ 2).However, multiple passes of graph streams are time-consumingand not even available in many real-world settings.
In contrast, the number of triangles can be estimated accu-rately even in a single pass [13], [14]. Simply sampling eachedge with probability p from a graph stream and estimatingthe number of triangles in the whole graph from that inthe sampled graph [13] also can be thought as a single-passstreaming algorithm if the sampled graph fits in memory andneeds not be streamed again. This sampling method, whichour CORE-D method uses, estimates triangle-count accuratelyeven with less than n sampled edges.
CORE-TRIANGLE PATTERN (Observation 2), a high cor-relation between degeneracy and the number of triangles,enables using the accurately estimated triangle-count for es-timating degeneracy. Specifically, we consider the followingmodels relating the number of triangles and degeneracy:
• BASIC MODEL (Baseline):ˆlog(kmax) = w0,0 + w0,1 log(n) + w0,2 log(m)
• TRIANGLE MODEL: ˆlog(kmax) = w1,0 +w1,1 log(#∆)
• OVERALL MODEL: ˆlog(kmax) = w2,0 + w2,1 log(n) +w2,2 log(m) + w2,3 log(#∆)
Table IV summarizes the estimates of the coefficients obtainedby linear regression on the real-world graphs in Table II. TheOVERALL MODEL has the highest adjusted R-squared (0.95)among all possible linear models, and the log triangle-countis statistically significant with p-value < 0.001, proving theeffectiveness of using triangle-count for estimating degeneracy.
Given a new graph stream, we estimate the vertex-count, theedge-count, and the triangle-count in the graph in a single pass.Then, by plugging these statistics into one of the models, weobtain an estimate of degeneracy. Algorithm 1 describes thedetails of CORE-D with TRIANGLE MODEL. For estimatingthe triangle-count, CORE-D requires O(mp) memory space

(a) Friendster (b) Orkut (c) Flickr (d) YouTube (e) Catster
(f) Skitter (g) Email (h) Twitter* (i) LiveJournal* (j) Patent*
* Graphs whose degeneracies are known to be affected by anomalies (see Section III-B)Fig. 7: CORE-D achieves both speed and accuracy. Points in each plot represent the performances of different methods with differentparameters. Lower-left region indicates better performance. Our proposed CORE-D algorithm provided a better trade-off between speed andaccuracy than LOGPASS. Specifically, CORE-D (with OVERALL MODEL) was up to 7× faster than LOGPASS (α = 2), while still providingcomparable accuracy. Among the models of CORE-D, OVERALL MODEL yielded the best performance in most datasets.
Algorithm 1: CORE-D with TRIANGLE MODEL 1Input: Graph stream: G, Sampling probability : pOutput: Estimated degeneracy: kmax
1: GSample = ∅2: for each edge e in G do3: add e to GSample with probability p4: end for5: #∆Sample ← InMemoryTriangleCounting(GSample) [13]6: #∆← #∆Sample ∗ (1/p)3
7: kmax ← exp(w1,0 + w1,1 log(#∆))8: return kmax
on average to store sampled edges. The memory requirementbecomes O(n) if we set sampling probability p = n/m.
We also need n and m for BASIC MODEL and OVERALLMODEL. We obtain m by simply counting edges in thegraph stream. In many real-world settings, n is available oris easily computed from the difference between maximumand minimum vertex ids. Otherwise, we obtain n by countingdistinct vertex ids with O(n) space. Even when n and m areneeded, CORE-D still requires only one pass because bothgraph sampling (in Algorithm 1) and computing n and m canbe conducted at the same time within one pass.
2) Experiments: We compare the performances of CORE-D and LOGPASS. We used a desktop with a 3.6GHz cpu and16GB memory space, and graphs (see Table II) were streamedfrom disk whose speed is 192MB/sec for sequential read. Weassumed that n is known or is computed easily from vertexids in all methods. We set p = n/m so that on average nmemory space is required in CORE-D1, as in LOGPASS. Wecompared accuracy using relative error defined as:
relative error(kmax, kmax) ≡ |kmax − kmax|/kmax.1Figure 1 in the supplementary documenet [12] shows that CORE-D works
reliably even with smaller number of samples.
Note that, in order to fairly evaluate accuracy in a new graph,we excluded the graph being tested from training sets whenestimating coefficients of the models.
Experimental results in the largest datasets are presented inFigure 7, where CORE-D provided a significantly better trade-off between accuracy and speed than LOGPASS. Specifically,CORE-D (with OVERALL MODEL) was up to 7× faster thanLOGPASS (α = 2) with similar accuracy. Noteworthy, CORE-D with OVERALL MODEL was more accurate than LOGPASSin all the datasets except the ones whose degeneracies areknown to be affected by anomalies (see Section III-B).
Among the models of CORE-D, OVERALL MODEL con-sistently yielded the best performance in all the datasetsexcept the Email dataset. BASIC MODEL, solely based on thenumbers of vertices and edges, showed the lowest accuracyespecially in the Friendster dataset and the Patent dataset. Thissupports the effectiveness of using the number of triangles forestimating degeneracy, based on CORE-TRIANGLE PATTERN.
V. PATTERN 3: “STRUCTURED CORE PATTERN”In this section, we describe STRUCTURED CORE PATTERN
and discuss its application to influential spreader identification.
A. Observation: Pattern in Real-world GraphsHow do the degeneracy-cores in real-world graphs look
like? Are they cliques? Our observation indicates thatdegeneracy-cores in real-world graphs are not cliques buthave structural patterns such as core-periphery [15] (i.e.,have a cohesive core and a loosely connected periphery) andcommunities [16] (i.e., consist of groups of vertices withdense connections internally and sparser connections betweengroups). This leads to Observation 3, which is supported bythe following facts:• As shown in Table II, degeneracy-cores have density
much less than one in all datasets (e.g., 0.02 in Friendster
(a) Structural Property of Real-world Graphs
(b) Core-Periphery(Hamster)
(c) Communities(Email)
(d) Core-Periphery withCommunities (Caida)
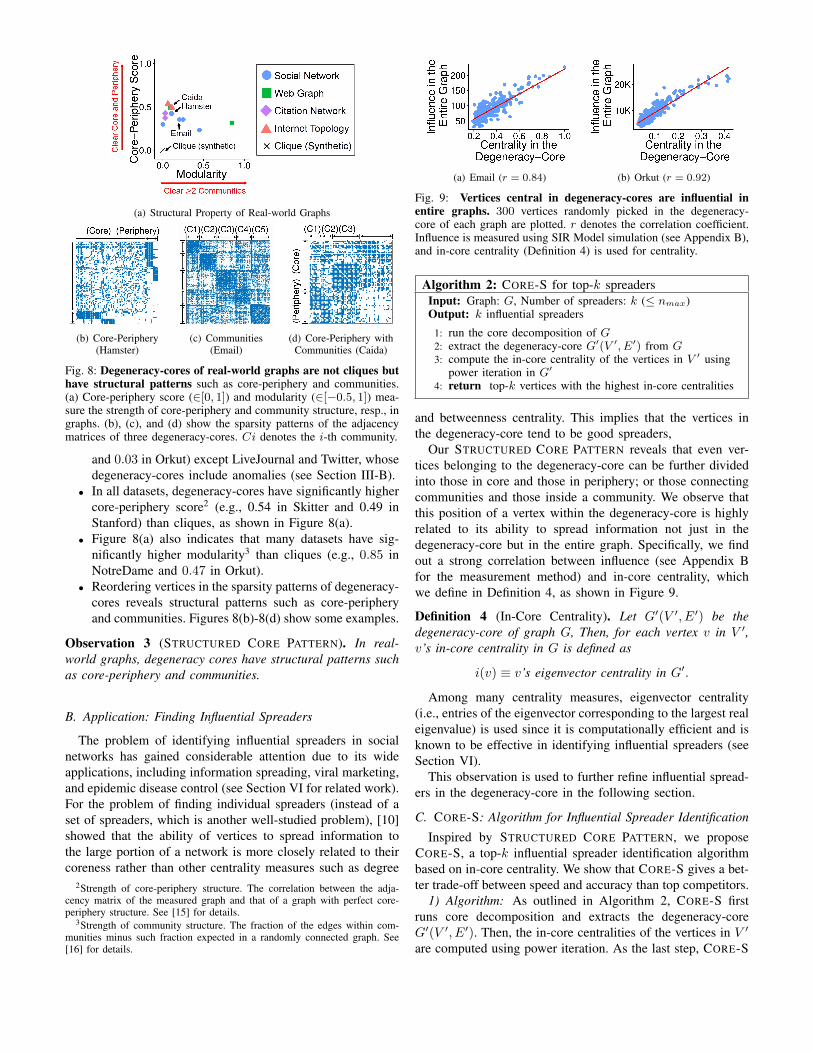
Fig. 8: Degeneracy-cores of real-world graphs are not cliques buthave structural patterns such as core-periphery and communities.(a) Core-periphery score (∈[0, 1]) and modularity (∈[−0.5, 1]) mea-sure the strength of core-periphery and community structure, resp., ingraphs. (b), (c), and (d) show the sparsity patterns of the adjacencymatrices of three degeneracy-cores. Ci denotes the i-th community.
and 0.03 in Orkut) except LiveJournal and Twitter, whosedegeneracy-cores include anomalies (see Section III-B).
• In all datasets, degeneracy-cores have significantly highercore-periphery score2 (e.g., 0.54 in Skitter and 0.49 inStanford) than cliques, as shown in Figure 8(a).
• Figure 8(a) also indicates that many datasets have sig-nificantly higher modularity3 than cliques (e.g., 0.85 inNotreDame and 0.47 in Orkut).
• Reordering vertices in the sparsity patterns of degeneracy-cores reveals structural patterns such as core-peripheryand communities. Figures 8(b)-8(d) show some examples.
Observation 3 (STRUCTURED CORE PATTERN). In real-world graphs, degeneracy cores have structural patterns suchas core-periphery and communities.
B. Application: Finding Influential Spreaders
The problem of identifying influential spreaders in socialnetworks has gained considerable attention due to its wideapplications, including information spreading, viral marketing,and epidemic disease control (see Section VI for related work).For the problem of finding individual spreaders (instead of aset of spreaders, which is another well-studied problem), [10]showed that the ability of vertices to spread information tothe large portion of a network is more closely related to theircoreness rather than other centrality measures such as degree
2Strength of core-periphery structure. The correlation between the adja-cency matrix of the measured graph and that of a graph with perfect core-periphery structure. See [15] for details.
3Strength of community structure. The fraction of the edges within com-munities minus such fraction expected in a randomly connected graph. See[16] for details.
(a) Email (r = 0.84) (b) Orkut (r = 0.92)
Fig. 9: Vertices central in degeneracy-cores are influential inentire graphs. 300 vertices randomly picked in the degeneracy-core of each graph are plotted. r denotes the correlation coefficient.Influence is measured using SIR Model simulation (see Appendix B),and in-core centrality (Definition 4) is used for centrality.
Algorithm 2: CORE-S for top-k spreaders 1Input: Graph: G, Number of spreaders: k (≤ nmax)Output: k influential spreaders
1: run the core decomposition of G2: extract the degeneracy-core G′(V ′, E′) from G3: compute the in-core centrality of the vertices in V ′ using
power iteration in G′
4: return top-k vertices with the highest in-core centralities
and betweenness centrality. This implies that the vertices inthe degeneracy-core tend to be good spreaders,
Our STRUCTURED CORE PATTERN reveals that even ver-tices belonging to the degeneracy-core can be further dividedinto those in core and those in periphery; or those connectingcommunities and those inside a community. We observe thatthis position of a vertex within the degeneracy-core is highlyrelated to its ability to spread information not just in thedegeneracy-core but in the entire graph. Specifically, we findout a strong correlation between influence (see Appendix Bfor the measurement method) and in-core centrality, whichwe define in Definition 4, as shown in Figure 9.
Definition 4 (In-Core Centrality). Let G′(V ′, E′) be thedegeneracy-core of graph G, Then, for each vertex v in V ′,v’s in-core centrality in G is defined as
i(v) ≡ v’s eigenvector centrality in G′.
Among many centrality measures, eigenvector centrality(i.e., entries of the eigenvector corresponding to the largest realeigenvalue) is used since it is computationally efficient and isknown to be effective in identifying influential spreaders (seeSection VI).
This observation is used to further refine influential spread-ers in the degeneracy-core in the following section.
C. CORE-S: Algorithm for Influential Spreader Identification
Inspired by STRUCTURED CORE PATTERN, we proposeCORE-S, a top-k influential spreader identification algorithmbased on in-core centrality. We show that CORE-S gives a bet-ter trade-off between speed and accuracy than top competitors.
1) Algorithm: As outlined in Algorithm 2, CORE-S firstruns core decomposition and extracts the degeneracy-coreG′(V ′, E′). Then, the in-core centralities of the vertices in V ′
are computed using power iteration. As the last step, CORE-S

(a) Orkut (β = 0.002) (b) Flickr (β = 0.001) (c) Catster (β = 0.002) (d) YouTube (β = 0.01) (e) Email (β = 0.01)
Fig. 10: CORE-S achieves both speed and accuracy. β denotes the infection rate in SIR Model. Points in each plot represent theperformances of different methods. Upper-left region indicates better performance. CORE-S provided the best trade-off between speed andaccuracy. Specifically, it found up to 2.6× more influential vertices than K-CORE with similar speed. Compared with EC, CORE-S wasup to 17× faster, while still finding vertices with comparable (98-104%) influence.
returns the top-k vertices with the highest in-core centralities.The time complexity of CORE-S is O(n + m + Tmmax +nmax log k), where (n+m) is for core decomposition, Tmmax
is for power iteration, and nmax log k is for top-k selection.T denotes the number of iterations in the power iteration.
2) Experiments: The experimental settings were the samewith those in Section IV-C2. We compared the average influ-ence of ten vertices (see the supplementary document [12] forresults with different numbers of spreaders) chosen by CORE-S with that of the vertices chosen by the following methods:
• K-CORE [10]: all vertices with the highest coreness.• K-TRUSS [17]: all vertices with the highest truss number.• Eigenvector Centrality (EC) [18]: top-ten vertices with
the highest eigenvector centralities in the entire graph.
The influence of each vertex was measured using SIR simula-tion (see Appendix B for details). We also compared the timetaken for choosing influential vertices in each method.
As seen in Figure 10, CORE-S provided the best trade-offbetween speed and accuracy in social networks. Specifically,the average influence of the vertices chosen by CORE-S was upto 2.6× higher than that of all the vertices in the degeneracy-core (K-CORE). However, additional time taken in CORE-A for further refining vertices in degeneracy-cores was atmost 12% of the time taken for the core decomposition ofentire graphs. Besides, CORE-S was up to 17× faster, thanEC, which has to compute the eigenvector centrality in entiregraphs (instead of only in degeneracy-cores). However, theaverage influence of the vertices chosen by CORE-S wascomparable (98-104%) with that of the vertices found by EC.
VI. RELATED WORK
Related work forms the following groups: applications ofk-core analysis, algorithms for k-core analysis, graph-basedanomaly detection, and influential spreader identification.
Applications of k-core Analysis. The concept of k-corehas been applied to hierarchical structure analysis [2], graphvisualization [3], densest subgraph detection [19] (a specialcase of DSM in Section III-C2), important protein identifica-tion [4], influential spreader detection [10] (K-CORE methodin Section V-C2), and graph clustering [5]. Degeneracy alsohas been used as a graph-sparsity measure in many domainssuch as AI [20] and Bioinformatics [21].
Algorithms for k-core Analysis. Core decomposition canbe computed in O(n + m) by repeatedly removing verticeswith the smallest degree [1]. [22] proposed an incrementalalgorithm, while [23] proposed an external memory algorithm,which requires O(kmax) scans of graphs. For degeneracy, [9]proposed a streaming algorithm requiring O(logα/2(n)) passesof a graph and n memory space for α(> 2)-approximation.Our CORE-D, however, requires only one pass of a graph andn memory space for accurately estimating degeneracy.
Graph-based Anomaly Detection. There have been diverseapproaches (belief propagation [24], egonet features [25],spectral methods [26], etc.) for anomaly detection in graphs(see [27] for a survey). Recently, many methods focus on densesubgraphs, which anomalies tend to form [6], [7], [28], [29].Especially, the latest methods [6], [7] are based on densestsubgraphs (i.e., subgraphs with maximum average degree). Weshow that our CORE-A, which detects smaller dense subgraphsconsisting of low-degree vertices, is complementary to thesedensest-subgraph based methods, and their combination hasthe best of both approaches.
Influential Spreader Identification. The problem of iden-tifying influential spreader is sub-categorized into (1) findinga group of spreaders (see [30]) and (2) finding individualinfluential spreaders. For the second problem, which we focus,vertices with high coreness [10], truss number [17], andeigenvector centrality [18] are known as good spreaders. OurCORE-S combines these measures so that only the advantagesof each measure (i.e., low computational cost of coreness andhigh accuracy of eigenvector centrality) are taken.
VII. CONCLUSION
We discover three empirical patterns in real-world graphsrelated to k-cores, and utilize them for several applications.
MIRROR PATTERN and CORE-A (Section III): We ob-serve a strong correlation between the coreness and the degreeof vertices. CORE-A, which measures the deviation from thistrend, successfully detects anomalies in real-world graphs andcomplements a state-of-the-art anomaly detection method.
CORE-TRIANGLE PATTERN and CORE-D (Section IV):We discover a 3-to-1 power law between degeneracy andtriangle count. Our CORE-D method uses this pattern foraccurately estimating degeneracy in only one pass of a graphstream and up to 7× faster than a recent multi-pass method.

STRUCTURED CORE PATTERN and CORE-S (Section V):We observe that degeneracy-cores have non-trivial structures(core-periphery, communities, etc). CORE-S, which finds ver-tices central within degeneracy-cores, identifies influentialspreaders up to 17× faster than methods with similar accuracy.
Reproducibility. Our source code and data are publiclyavailable at http://www.cs.cmu.edu/∼kijungs/codes/kcore/.
Acknowledgments4. This material is based upon work sup-ported by the National Science Foundation under Grant No.CNS-1314632 and IIS-1408924. Research was sponsored bythe Army Research Laboratory and was accomplished underCooperative Agreement Number W911NF-09-2-0053. Eliassi-Rad was supported by NSF CNS-1314603 and by DTRAHDTRA1-10-1-0120.
REFERENCES
[1] V. Batagelj and M. Zaversnik, “An o(m) algorithm for cores decompo-sition of networks,” arXiv preprint cs/0310049, 2003.
[2] J. I. Alvarez-Hamelin, L. Dall’Asta, A. Barrat, and A. Vespignani, “K-core decomposition of internet graphs: hierarchies, self-similarity andmeasurement biases,” NHM, vol. 3, no. 2, pp. 371–393, 2008.
[3] ——, “Large scale networks fingerprinting and visualization using thek-core decomposition,” in NIPS, 2005.
[4] S. Wuchty and E. Almaas, “Peeling the yeast protein network,” Pro-teomics, vol. 5, no. 2, pp. 444–449, 2005.
[5] C. Giatsidis, F. Malliaros, D. M. Thilikos, and M. Vazirgiannis,“Corecluster: A degeneracy based graph clustering framework,” in AAAI,2014.
[6] K. Shin, B. Hooi, and C. Faloutsos, “M-zoom: Fast dense-block detec-tion in tensors with quality guarantees,” in ECML/PKDD, 2016.
[7] B. Hooi, H. A. Song, A. Beutel, N. Shah, K. Shin, and C. Faloutsos,“Fraudar: Bounding graph fraud in the face of camouflage,” in KDD,2016.
[8] J. Leskovec, D. Chakrabarti, J. Kleinberg, and C. Faloutsos, “Real-istic, mathematically tractable graph generation and evolution, usingkronecker multiplication,” in PKDD, 2005, pp. 133–145.
[9] M. Farach-Colton and M.-T. Tsai, “Computing the degeneracy of largegraphs,” in LATIN, 2014, pp. 250–260.
[10] M. Kitsak, L. K. Gallos, S. Havlin, F. Liljeros, L. Muchnik, H. E.Stanley, and H. A. Makse, “Identification of influential spreaders incomplex networks,” Nature Physics, vol. 6, no. 11, pp. 888–893, 2010.
[11] J. Davis and M. Goadrich, “The relationship between precision-recalland roc curves,” in ICML, 2006, pp. 233–240.
[12] “Supplementary material (proofs and additional experiments).” [Online].Available: http://www.cs.cmu.edu/∼kijungs/codes/kcore/supple.pdf
[13] C. E. Tsourakakis, U. Kang, G. L. Miller, and C. Faloutsos, “Doulion:counting triangles in massive graphs with a coin,” in KDD, 2009.
[14] Y. Lim and U. Kang, “Mascot: Memory-efficient and accurate samplingfor counting local triangles in graph streams,” in KDD, 2015.
[15] S. P. Borgatti and M. G. Everett, “Models of core/periphery structures,”Social networks, vol. 21, no. 4, pp. 375–395, 2000.
[16] M. E. Newman, “Modularity and community structure in networks,”PNAS, vol. 103, no. 23, pp. 8577–8582, 2006.
[17] M.-E. G. Rossi, F. D. Malliaros, and M. Vazirgiannis, “Spread it good,spread it fast: Identification of influential nodes in social networks,” inWorld Wide Web Companion, 2015.
[18] B. Macdonald, P. Shakarian, N. Howard, and G. Moores, “Spread-ers in the network sir model: An empirical study,” arXiv preprintarXiv:1208.4269, 2012.
[19] M. Charikar, “Greedy approximation algorithms for finding dense com-ponents in a graph,” in APPROX, 2000.
4Any opinions, findings, and conclusions or recommendations expressedin this material are those of the author(s) and do not necessarily reflect theviews of the National Science Foundation, or other funding parties. The U.S.Government is authorized to reproduce and distribute reprints for Governmentpurposes notwithstanding any copyright notation here on.
[20] E. C. Freuder, “A sufficient condition for backtrack-free search,” JACM,vol. 29, no. 1, pp. 24–32, 1982.
[21] G. D. Bader and C. W. Hogue, “An automated method for findingmolecular complexes in large protein interaction networks,” BMC bioin-formatics, vol. 4, p. 2, 2003.
[22] A. E. Sariyuce, B. Gedik, G. Jacques-Silva, K.-L. Wu, and U. V.Catalyurek, “Streaming algorithms for k-core decomposition,” PVLDB,vol. 6, no. 6, pp. 433–444, 2013.
[23] J. Cheng, Y. Ke, S. Chu, and M. T. Ozsu, “Efficient core decompositionin massive networks,” in ICDE, 2011.
[24] S. Pandit, D. H. Chau, S. Wang, and C. Faloutsos, “Netprobe: a fastand scalable system for fraud detection in online auction networks,” inWWW, 2007.
[25] L. Akoglu, M. McGlohon, and C. Faloutsos, “Oddball: Spotting anoma-lies in weighted graphs,” in PAKDD, 2010.
[26] B. A. Prakash, A. Sridharan, M. Seshadri, S. Machiraju, and C. Falout-sos, “Eigenspokes: Surprising patterns and scalable community chippingin large graphs,” in PAKDD, 2010.
[27] L. Akoglu, H. Tong, and D. Koutra, “Graph based anomaly detectionand description: a survey,” Data Min. Knowl. Discov., vol. 29, no. 3, pp.626–688, 2015.
[28] A. Beutel, W. Xu, V. Guruswami, C. Palow, and C. Faloutsos, “Copy-catch: stopping group attacks by spotting lockstep behavior in socialnetworks,” in WWW, 2013.
[29] M. Jiang, A. Beutel, P. Cui, B. Hooi, S. Yang, and C. Faloutsos, “Ageneral suspiciousness metric for dense blocks in multimodal data,” inICDM, 2015.
[30] D. Kempe, J. Kleinberg, and E. Tardos, “Maximizing the spread ofinfluence through a social network,” in KDD, 2003.
APPENDIX ADESCRIPTION OF REAL-WORLD GRAPH DATASETS
Social Networks. Hamster, Catster, YouTube, Flickr, Orkut,LiveJournal, and Friendster are friendship networks of users inthe corresponding online communities. Twitter is a subscrip-tion network among users in a microblogging service. Emailis an email network among employees of Enron Corp. andbetween the employees and people outside the company.
Web Graphs. NotreDame and Stanford are hyperlink net-works of web pages from each university.
Internet Topologies. Caida and Skitter are internet topolo-gies obtained from routing tables and traceroute data.
Citation Networks. Patent is a citation network among U.S.patents. HepTh is a citation network of papers submitted tothe HepTh section in arXiv.
All datasets are available at http://www.cs.cmu.edu/∼kijungs/codes/kcore/.
APPENDIX BMEASURING INFLUENCE USING SIR MODEL SIMULATION
To evaluate influence as a spreader, we simulate spreadingprocesses using SIR Model [10], a widely-used epidemicmodel. Initially, a vertex chosen as the seed is in the infectiousstate (I-state), while the others are in the susceptible state (S-state). Each vertex in the I-state infects each of its neighbors inthe S-state with probability β (infection rate) and then entersthe recovered state (R-state). This is repeated until no vertexis in the I-state. The influence of a seed, the initially infectedvertex, can be quantified by the number of vertices infectedat any time during the process. To reduce random effects,we repeat the whole process 100 times, and use the averagenumber of infected vertices as the measure of influence. β isset close to the epidemic threshold λ−11 , as in [17].