core values - fatima groupfatima-group.com/updata/files/files/79_20140509180712.pdfhe is also...
TRANSCRIPT

01 Core Values02 Our Vision and Mission03 Code of Conduct04 Company Information05 Company Profile06 Profile of the Directors08 Board Structure and Committees10 Profile of the Key Management13 Organization Chart14 Notice of 41ST Annual General Meeting15 Financial Highlights16 Horizontal Analysis - Balance Sheet17 Vertical Analysis - Balance Sheet18 Horizontal Analysis - Profit and Loss18 Vertical Analysis - Profit and Loss19 Entity Ratings20 Directors’ Report to the Members26 Statement of Compliance with the Code of Corporate Governance
Financial Statements 28 Review Report to the Members on Statement of Compliance29 Auditors’ Report to the Members30 Balance Sheet32 Profit and Loss Account33 Statement of Comprehensive Income34 Statement of Changes in Equity35 Cash Flow Statement36 Notes to and forming part of the Financial Statements
Consolidated Financial Statements 83 Auditors’ Report to the Members84 Consolidated Balance Sheet86 Consolidated Profit and Loss Account87 Consolidated Statement of Comprehensive Income88 Consolidated Statement of Changes in Equity89 Consolidated Cash Flow Statement90 Notes to and forming part of the Consolidated Financial Statements144 Pattern of Shareholding146 Financial Calendar Form of Proxy

Core Values
IntegrityOur actions are driven by honesty, ethics, fairness and transparency
InnovationWe encourage creativity and recognize new ideas
TeamworkWe work collectively towards a common goal
Safety, Health, Environment & CSRWe care for our people and the communities around us
Customer FocusWe believe in listening to our customers and delivering value in our products and services
ExcellenceWe strive to excel in everything we do
Valuing PeopleWe value our people as our greatest resource
1Annual Report
for the year ended December 31, 2013

• To be the preferred fertilizer company for farmers, business associates and suppliers through quality and service.
• To provide employees an exciting, enabling and supportive environment to excel in, be innovative, entrepreneurial in an ethical and safe working place based on meritocracy and equal opportunity.
• To be a responsible corporate citizen with a concern for the environment and the communities we deal with.
To be a world class manufacturer of fertilizers and ancillary products, with a focus on safety, quality and contribution to national economic growth and development. We will care for the environment and the communities we work in while continuing to create shareholders’ value.
Vision Mission
Our Vision and Mission
2 Pakarab Fertilizers Limited

A commitment to honesty, ethical conduct and integrity is the supreme objective of the Company. To assist employees in achieving this objective and implement its commitment, the Company has developed a comprehensive Code of Conduct which guides the behaviour of directors, officers and employees of the Company and is reproduced in the form of a Policy Statement of Ethics and Business Practices
Pakarab Fertilizers Limited conducts its business with the highest ethical standards in full compliance with all applicable laws. Honesty and integrity take precedence in all relationships including those with customers, suppliers, employees and other stakeholders.
Ethics and Business PracticesWE believe in conducting the Company’s business in a manner that respects, protects and improves the environment and provides employees with a safe and healthy workplace. We conduct our business in an environmentally responsible and sustainable manner. Employees must be completely familiar with the permits, Health Safety and Environment Policy, local laws and regulations that apply to their work.
All employees are expected to understand the laws and business regulations related to their work and comply fully so that our
shareholders, employees, customers, suppliers, stakeholders and the Government have complete faith in the way we operate and that our business decisions are made ethically and in the best interests of the Company.
Employees are obligated to act in accordance with the Company’s code of Ethics and Business Conduct and are restricted to using only legitimate practices in commercial operations and in promoting the Company’s position on issues before governmental authorities. Inducements intended to reward favorable decisions and governmental actions are unacceptable and prohibited.
Employees are prohibited from using their positions, Company property or information for personal gain, and from competing with the Company. Employees are also prohibited from taking advantage from opportunities that become available through the use of Company information, property or their position.
Assets and Proprietary informationWE consider our Company’s assets, both physical and intellectual, very valuable. We have, therefore an obligation to protect these assets in the interest of the Company and its shareholders.
Protection of the Company’s information is important for our business. All employees are expected to know what information is proprietary and which must
not be disclosed to unauthorized sources. Employees are responsible for applying all available tools to manage the Company’s information resources and records.
Relations with Business partnersWE seek to do business with suppliers, vendors, contractors and other independent businesses who demonstrate high standards of ethical business behavior. Our Company will not knowingly do business with any persons or businesses that operate in violation of applicable laws and regulations, including employment, health, safety and environmental laws. We shall take steps to assure that our suppliers, vendors and contractors understand the standards we apply to ourselves, and expect the same from them.
Our EmployeesWE believe that highly engaged employees are the key ingredient in professional development and business success. Therefore, we invite our employees to contribute their best and to avail the opportunities for improvement and growth. We are an equal opportunity employer and promote gender diversity, self-development and innovation. We provide employees with tools, techniques, and training to master their current jobs, broaden their skills, and advance their career goals.
The Audit Committee of the Board ensures the compliance of above principles.
Code of Conduct
3Annual Report
for the year ended December 31, 2013

Board of Directors
Mr. Arif Habib Chairman
Mr. Fawad Ahmed MukhtarChief Executive Officer
Mr. Fazal Ahmed SheikhMr. Nasim BegMr. Faisal Ahmed Mukhtar Mr. Rehman NaseemMr. Abdus SamadMr. Muhammad Kashif Habib
Audit Committee
Mr. Nasim BegChairman
Mr. Fazal Ahmed SheikhMember
Mr. Rehman NaseemMember
Mr. Muhammad Kashif HabibMember
Human Resource and Remuneration Committee
Mr. Nasim BegChairman
Mr. Abdus SamadMember
Mr. Faisal Ahmed MukhtarMember
Mr. Rehman NaseemMember
Chief Financial Officer
Mr. Arif Hamid Dar
Company Secretary
Mr. Ausaf Ali Qureshi
Key Management
Mr. M. Abad KhanAdvisor to CEO
Mr. Qadeer Ahmed KhanDirector Special Projects
Mr. Muhammad ZahirDirector Marketing
Mr. Haroon WaheedGroup Head of Human Resource
Mr. Farrukh Iqbal QureshiGeneral Manager Manufacturing
Mr. Iftikhar Mahmood BaigGeneral Manager Business Development
Mr. Fuad Imran KhanChief Information Officer
Mr. Javed AkbarHead of Procurement
Brig (R) Muhammad Ali Asif SirhindiGeneral Manager Administrative Services
Legal Advisors
M/s. Chima & IbrahimAdvocates
1-A/245, Tufail Road,Lahore Cantt.
Auditors
A. F. Ferguson & Co., Chartered Accountants
23-C, Aziz Avenue, Canal Bank, Gulberg V, Lahore-54660.Tel: 042 35715864-71Fax: 042 35715872
Bankers
Allied Bank LimitedAl–Baraka Bank (Pakistan)LimitedAskari Bank LimitedBankIslami Pakistan LimitedBank Alfalah LimitedBurj Bank LimitedCitibank, N.A.Dubai Islamic Bank Pakistan LimitedDeutsche Bank LimitedFaysal Bank LimitedHabib Bank LimitedHabib Metropolitan Bank LimitedMCB Bank LimitedMeezan Bank LimitedNational Bank of PakistanPakoman Investment Company LimitedPakistan Kuwait Investment Company (Private) LimitedPAIR Investment Company LimitedSindh Bank LimitedStandard Chartered Bank (Pakistan) LimitedSummit Bank LimitedSoneri Bank LimitedUnited Bank LimitedZarai Taraqiati Bank Limited
Registered / Head Office
E-110, Khayaban-e-Jinnah, Lahore Cantt., Pakistan.UAN: 111-FATIMA (111-328-462)Fax: 042-36621389E-mail: [email protected]: www.fatima-group.com
Karachi Office
21-Oil Installation Area, Keamari, Karachi.Tel: 021 32855444-5Fax: 021 32855446
Plant Site
Khanewal Road, Multan.Tel: 061 9220022Fax: 061 9220021
Company Information
4 Pakarab Fertilizers Limited

Company Profile
Pakarab Fertilizers Limited was established as a result of protocol concluded and signed on November 15, 1972 by the Government of Pakistan to further strengthen and develop fraternal ties between Islamic Republic of Pakistan and State of Abu Dhabi.
A Memorandum of Understanding was concluded between Pakistan Industrial Development Corporation (PIDC) and Abu Dhabi National Oil Company Limited (ADNOC) on March 7, 1973. A participation agreement emerged on November 1, 1973 to establish a joint venture for the expansion and modernization of the old Natural Gas Fertilizer Factory (NGFF) at Multan.
The Company was incorporated on November 12, 1973. Subsequently, PIDC assigned 52% of its shares to National Fertilizer Corporation
(NFC) of Pakistan and ADNOC assigned 48% of its shares to International Petroleum Investment Company, with a paid-up capital of Rs. 743.061 million. Under the privatization policy of Government of Pakistan, Pakarab Fertilizers Limited was privatized on July 14, 2005 at a cost of Rs.14.125 billion. It was acquired by the consortium of Fatima Group and Arif Habib Group.
Under the new management, Pakarab Fertilizers Limited has undergone extensive modernization and new improved processes have been introduced to maximize the output while minimizing the negative impacts on the environment. For this a Clean Development Mechanism (CDM) plant was installed, which is the first project of its kind in Pakistan. Basic aim of this project is the abatement
of N2O and NOX emissions from the stack gases of Nitric Acid plant. The reduction of green house effect of these gases shows the new management’s commitment towards a cleaner environment.
Pakarab Fertilizers Limited is located at Khanewal Road, Multan. The site area comprises 302 acres, which includes area for the factory and the housing colony with all amenities including medical centre, school, management and staff clubs for recreation of employees and their families, etc.
5Annual Report
for the year ended December 31, 2013

Profile of the Directors
Mr. Rehman Naseem is director of the Company. He obtained a Bachelor of Economics Degree from Columbia University, New York. He is the Chief Executive of Ahmed Fine Textile Mills Limited and Rehman Amir Fabrics Limited. He is also director of Fazal Cloth Mills Limited, Ahmed Fine Textile Mills Limited, Amir Fine Exports (Pvt) Limited, Fazal Rehman Fabrics Limited, Hussain Ginneries Limited, Zafar Nasir Oil Extraction Limited, Rehman Amir Fabrics Limited, Fazal Farms (Pvt) Limited, Fazal Weaving Mills Limited and Fatima Energy Limited.
Mr. Rehman Naseem Non-Executive Director
Mr. Arif Habib is the Chairman of Pakarab Fertilizers Limited. He is also the Chairman of Arif Habib Corporation Limited, Fatima Fertilizer Company Limited, Javedan Corporation Limited and Arif Habib DMCC Dubai.
Mr. Arif Habib has remained the President / Chairman of Karachi Stock Exchange six times in the past. He is the Founding Member and Former Chairman of the Central Depository Company of Pakistan Limited. He has served as Member of the Privatization Commission, Board of Investment, Tariff Reforms Commission and Securities and Exchange Ordinance Review Committee.
On the social services front, Mr. Arif Habib is the Chairman of Arif Habib Foundation, Memon Health and Education Foundation, Trustee of Fatimid Foundation and Director of Pakistan Centre for Philanthropy and Karachi Education Initiative (Karachi Business School).
Mr. Fawad Ahmed Mukhtar is the Chief Executive Officer and Director of the Company. He has rich experience of manufacturing and industrial management. Following his graduation he has spent 30 years in developing his family business into a sizeable conglomerate. Mr. Fawad Mukhtar leads several community service initiatives of his group including the Fatima Fertilizer Trust and Welfare Hospital, Fatima Fertilizer Education Society and School, Mukhtar A. Sheikh Welfare Trust etc. He also holds the following portfolios:
Chairman• Reliance Weaving Mills Limited• Fatima Energy Limited• Reliance Commodities (Private) Limited• Fatima Sugar Mills Limited• Air One (Private) Limited
CEO• Fatima Fertilizer Company Limited
Member• Board of Governor “National Management Fund” - Parent body of LUMS
Mr. Arif HabibChairman
Mr. Fawad Ahmed MukhtarChief Executive Officer / Director
Mr. Fazal Ahmed SheikhExecutive Director
Mr. Fazal Ahmed Sheikh is a Director of the Company. He holds a degree in Economics from the University of Michigan, Ann Arbor, USA. He has played a strategic role in Fatima Group’s expansion and success. He also holds the following portfolios:
CEO• Reliance Weaving Mills Limited• Fatima Energy Limited• Air One (Private) Limited
Director• Fatima Fertilizer Company Limited• Reliance Commodities (Private) Limited• Fatima Sugar Mills Limited• Fazal Cloth Mills Limited
6 Pakarab Fertilizers Limited
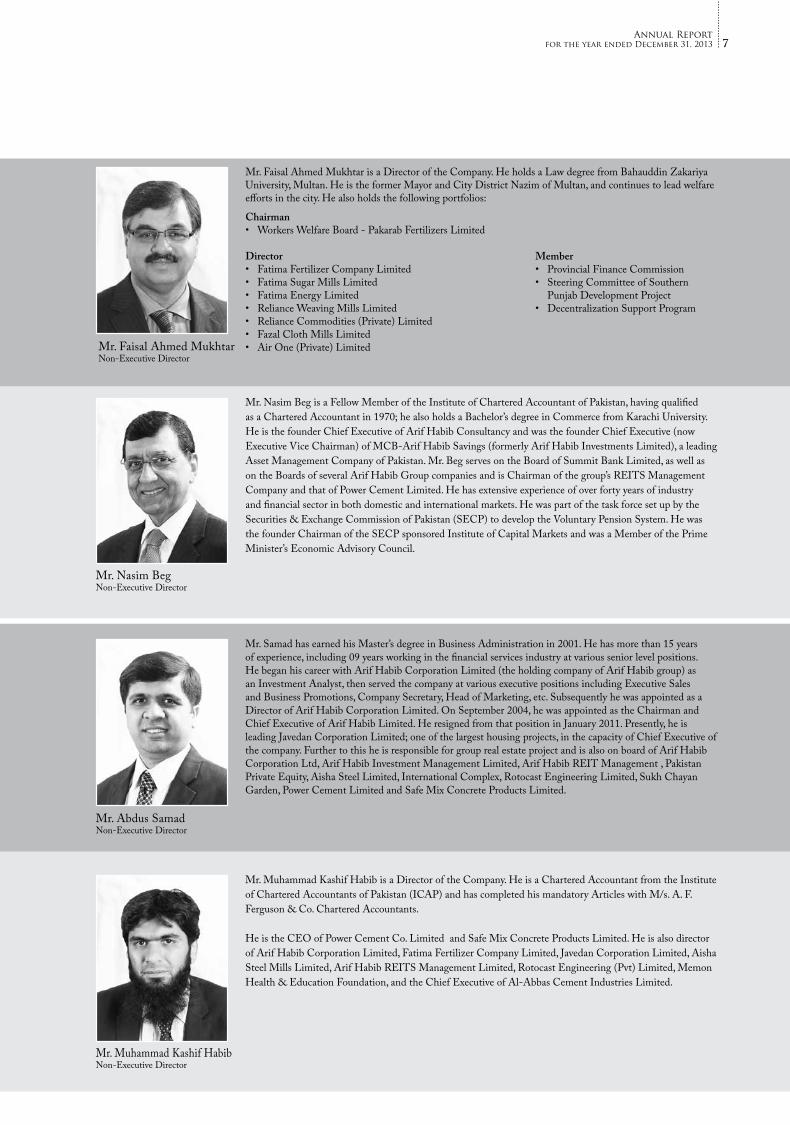
Mr. Samad has earned his Master’s degree in Business Administration in 2001. He has more than 15 years of experience, including 09 years working in the financial services industry at various senior level positions. He began his career with Arif Habib Corporation Limited (the holding company of Arif Habib group) as an Investment Analyst, then served the company at various executive positions including Executive Sales and Business Promotions, Company Secretary, Head of Marketing, etc. Subsequently he was appointed as a Director of Arif Habib Corporation Limited. On September 2004, he was appointed as the Chairman and Chief Executive of Arif Habib Limited. He resigned from that position in January 2011. Presently, he is leading Javedan Corporation Limited; one of the largest housing projects, in the capacity of Chief Executive of the company. Further to this he is responsible for group real estate project and is also on board of Arif Habib Corporation Ltd, Arif Habib Investment Management Limited, Arif Habib REIT Management , Pakistan Private Equity, Aisha Steel Limited, International Complex, Rotocast Engineering Limited, Sukh Chayan Garden, Power Cement Limited and Safe Mix Concrete Products Limited.
Mr. Muhammad Kashif Habib is a Director of the Company. He is a Chartered Accountant from the Institute of Chartered Accountants of Pakistan (ICAP) and has completed his mandatory Articles with M/s. A. F. Ferguson & Co. Chartered Accountants.
He is the CEO of Power Cement Co. Limited and Safe Mix Concrete Products Limited. He is also director of Arif Habib Corporation Limited, Fatima Fertilizer Company Limited, Javedan Corporation Limited, Aisha Steel Mills Limited, Arif Habib REITS Management Limited, Rotocast Engineering (Pvt) Limited, Memon Health & Education Foundation, and the Chief Executive of Al-Abbas Cement Industries Limited.
Mr. Abdus SamadNon-Executive Director
Mr. Muhammad Kashif HabibNon-Executive Director
Mr. Nasim Beg is a Fellow Member of the Institute of Chartered Accountant of Pakistan, having qualified as a Chartered Accountant in 1970; he also holds a Bachelor’s degree in Commerce from Karachi University. He is the founder Chief Executive of Arif Habib Consultancy and was the founder Chief Executive (now Executive Vice Chairman) of MCB-Arif Habib Savings (formerly Arif Habib Investments Limited), a leading Asset Management Company of Pakistan. Mr. Beg serves on the Board of Summit Bank Limited, as well as on the Boards of several Arif Habib Group companies and is Chairman of the group’s REITS Management Company and that of Power Cement Limited. He has extensive experience of over forty years of industry and financial sector in both domestic and international markets. He was part of the task force set up by the Securities & Exchange Commission of Pakistan (SECP) to develop the Voluntary Pension System. He was the founder Chairman of the SECP sponsored Institute of Capital Markets and was a Member of the Prime Minister’s Economic Advisory Council.
Mr. Nasim BegNon-Executive Director
Mr. Faisal Ahmed Mukhtar is a Director of the Company. He holds a Law degree from Bahauddin Zakariya University, Multan. He is the former Mayor and City District Nazim of Multan, and continues to lead welfare efforts in the city. He also holds the following portfolios:
Chairman• Workers Welfare Board - Pakarab Fertilizers Limited
Director• Fatima Fertilizer Company Limited• Fatima Sugar Mills Limited• Fatima Energy Limited• Reliance Weaving Mills Limited• Reliance Commodities (Private) Limited• Fazal Cloth Mills Limited• Air One (Private) LimitedMr. Faisal Ahmed Mukhtar
Non-Executive Director
Member• Provincial Finance Commission• Steering Committee of Southern Punjab Development Project• Decentralization Support Program
7Annual Report
for the year ended December 31, 2013

Board Structure
PFL’s Board is comprised of eight directors who have been elected by the shareholders for a term of three years expiring on December 31, 2015. Other than the Chief Executive Officer (CEO), there is one executive director and six non-executive directors on the Board. The Chairman of the Board is a non-executive director.
The Board provides leadership and strategic guidance to the Company, oversees the conduct of business and promotes the interests of all stakeholders. It reviews corporate policies, overall performance, accounting and reporting standards and other significant areas of management, corporate governance and regulatory compliance.
The Board is headed by the Chairman who manages the Board’s business and acts as its facilitator and guide. The Board is assisted by an Audit Committee and a Human Resource and Remuneration Committee while the CEO carries responsibility for day-to-day operations of the Company and execution of Board policies.
Board Committees
The standing committees of the Board are:
Audit Committee
Composition
The Audit Committee consists of four members of the Board. Majority of the members of the Audit Committee are non-executive including the Chairman. The members are:
1. Mr. Nasim Beg Chairman
2. Mr. Fazal Ahmed Sheikh Member
3. Mr. Rehman Naseem Member
4. Mr. Muhammad Kashif HabibMember
Terms of Reference
In addition to any other responsibilities which may be assigned from time to time by the Board, the main purpose of the Audit Committee is to assist the Board by performing the following main functions:
• to monitor the quality and integrity of the Company’s accounting and reporting practices;
• to oversee the performance of Company’s internal audit function;
• to review the external auditor’s qualification; independence, performance and competence; and
• to comply with the legal and regulatory requirements, Company’s by-laws and internal regulations.
The Terms of Reference of the Audit Committee have been drawn up and approved by the Board of Directors in compliance with the Code of Corporate Governance. In addition to compliance with Code of Corporate Governance, the Audit Committee carries out the following duties and responsibilities for the Company as per its Terms of Reference:
a) determination of appropriate measures to safeguard the Company’s assets;
b) review of preliminary announcements of results prior to publication;
c) review of quarterly, half-yearly and annual financial statements of the Company, prior to their approval by the Board of Directors, focusing on:
`• major judgmental areas;
• significant adjustments resulting from the audit;
• the going-concern assumption;
• any changes in accounting policies and practices;
• compliance with applicable accounting standards; and
• compliance with listing regulations and other statutory and regulatory requirements.
d) facilitating the external audit and discussion with external auditors of major observations arising from interim and final audits and any matter that the auditors may wish to highlight (in the absence of management, where necessary);
e) review of management letter issued by external auditors and management’s response thereto;
f ) ensuring coordination between the internal and external auditors of the Company;
g) review of the scope and extent of internal audit and ensuring that the internal audit function has adequate resources and is appropriately placed within the Company;
h) consideration of major findings of internal investigations and management’s response thereto;
Board Structure and Committees
8 Pakarab Fertilizers Limited
i) ascertaining that the internal control system including financial and operational controls, accounting system and reporting structure are adequate and effective;
j) review of the Company’s statement on internal control systems prior to endorsement by the Board of Directors;
k) instituting special projects, value for money studies or other investigations on any matter specified by the Board of Directors, in consultation with the Chief Executive and to consider remittance of any matter to the external auditors or to any other external body;
l) determination of compliance with relevant statutory requirements;
m) monitoring compliance with the best practices of corporate governance and identification of significant violations thereof; and
n) consideration of any other issue or matter as may be assigned by the Board of Directors.
Human Resource and Remuneration Committee
Composition
The Human Resource and Remuneration Committee consists of four members of the Board. All the members of the Committee are non-executive directors including the Chairman. The members are:
1. Mr. Nasim Beg Chairman
2. Mr. Abdus Samad Member
3. Mr. Faisal Ahmed Mukhtar Member
4. Mr. Rehman Naseem Member
Terms of Reference
The Human Resource Committee is a means by which the Board provides guidance on human resources excellence. The specific responsibilities, authorities and powers that the Committee carries out on behalf of the Board are as follows:
1. Duties and Responsibilities
The Committee shall carry out the duties below for the Company:
1.1 to review and recommend the annual Compensation strategy with focus on the annual budget for Head count and Salaries and wages;
1.2 to review and recommend the annual Bonus and Incentive plan;
1.3 to review and recommend the compensation of the Chief Executive and Executive Directors;
1.4 to assist the Board in reviewing d monitoring the succession plans of key positions in the company;
1.5 to review and monitor processes and initiatives related to work environment and culture;
1.6 to perform such other duties and responsibilities as may be assigned time to time by the Board of Directors.
2. Reporting Responsibilities
2.1 The Committee Chairman shall report formally to the Board on its proceedings after each meeting on all matters within its duties and responsibilities;
2.2 The Committee shall make whatever recommendations to the Board it deems appropriate on any area within its remit where action or improvement is needed;
2.3 The Committee shall, if requested by the Board, compile a report to shareholders on its activities to be included in the Company’s Annual Report.
3. Authorities and Powers
The Committee is authorised and empowered:
3.1 To seek any information it requires from any employee of the Company in order to perform its duties;
3.2 To obtain, at the Company’s expense, outside legal or other professional advice on any matter within its terms of reference; and
3.3 To call any employee to be questioned at a meeting of the Committee as and when required.
9Annual Report
for the year ended December 31, 2013

Mr. M. Abad KhanAdvisor to CEO
Mr. M. Abad Khan graduated in Mechanical Engineering from UET Lahore and received extensive training in Fertilizer operations from abroad. Over the last 55 years, he has been part of most of growth of fertilizer industry in Pakistan.He was part of the team that commissioned Pakistan’s first Urea Plant under the aegis of PIDC. He served with Exxon Chemical Pakistan Ltd. for 15 years mostly at senior management positions in manufacturing. He led Fauji Fertilizer Co. manufacturing for 14 years as General Manager Plant. Here he organized and established systems and procedures to lead the Plant to world standards. Plant capacity increased more than double by the time of his retirement. In 2001, when Fauji Fertilizer Bin Qasim Company faced serious challenges, he was called in to head the manufacturing. Under his leadership for 4 years, production and reliability improved to design level and a major revamp of 25% over design capacity was conceived, planned and ordered which was later implemented with great success. He has been with Fatima Group for 8 years and played significant role in establishment of Fatima Fertilizer plant.During the course of a long career, he had extensive international exposures through seminars, symposiums and trainings including the one at Harvard Business School.
Mr. Qadeer Ahmed KhanDirector Special Projects
Mr. Qadeer Ahmed Khan has
done his MS in Petrochemicals
and Hydrocarbons from
the Institute of Science and
Technology, University of
Manchester, England. He has
a vast experience of working
in chemicals and fertilizer
industries. He has over 32
years of experience from Engro
Chemicals and Engro Polymers,
where he held various senior
management positions.
Mr. Farrukh Iqbal Qureshi
GM Manufacturing
Mr. Qureshi has done his B.E.
Chemical Engineering from
Dawood College of Engineering
and Technology, Karachi. Mr.
Queshi has over 20 years of
professional experience. He
was previously engaged with
Engro Polymer & Chemicals
Limited, Karachi as the Safety,
Environment & Training
Manager.
Mr. Muhammad ZahirDirector Marketing
Mr. Muhammad Zahir
holds a Master’s degree in
Business Administration
from the Institute of
Business Administration,
University of Karachi.
He spent 29 years
with ICI Pakistan working
in its various businesses
and the Human Resource
Function. He was VP Paints
Business, VP Life Sciences
Business and VP HR. He served
as an Executive Director on
the Board of ICI Pakistan and
on the Board of CIC Paints,
Sri Lanka. He has diverse
experience in businesses
including Paints, Polyester fiber,
Chemicals, Agrochemicals,
Pharmaceuticals, seeds and
Animal health.
Profile of the Key Management
10 Pakarab Fertilizers Limited

Mr. Haroon WaheedGroup Head of HR
Mr. Haroon Waheed has
done his LLM from Monash
University, Melbourne, Australia.
He has over 21 years of national
and international broad based
functional business experience
with Unilever and has been
associated with Pakistan
Society of HR Management
as President. Haroon also
represents in the HR,
management and leadership
development conferences at
national level. He won the
International HR Leadership
Award in London and Talent
Management Award in
Singapore in 2010.
Mr. Ausaf Ali QureshiCompany Secretary
Mr. Ausaf Ali Qureshi is a
Fellow Member of Institute
of Chartered Accountants of
Pakistan. He joined the Group
in May 2010 as Company
Secretary with additional
responsibility for investor
relations. He has over 29 years of
experience with Fauji Fertilizer,
Pakistan International Airlines
(Holdings) and Bristol-Myers
Squibb (BMS). In his over 20
years’ career at BMS, he held
various senior management
positions in Pakistan, South
Korea, Egypt and Singapore in
the areas of finance, corporate
compliance and strategic project
planning.
Mr. Iftikhar Mahmood BaigGM Business Development
Mr. Iftikhar Mahmood
Baig is serving as GM
Business Development at
Fatima Group. He is also
director of Reliance Sacks
Limited, Pakistan Mining
Company Limited and
member of the Workers
Welfare Board- Pakarab
Fertilizers Limited. He is a
Fellow member of Institute
of Chartered Secretaries
and Managers of Pakistan.
Mr. Baig is associated
with Fatima Group since
1996 and has held various
senior level management
positions. He has over
30 years of experience in
new venture development,
Corporate, Finance,
Government Relations and
Strategic Planning.
Mr. Arif Hamid DarChief Financial Officer
Mr. Arif Hamid Dar is a fellow
member of the Institute of
Chartered Accountants of
Pakistan and got training with
A.F. Ferguson & Co. Chartered
Accountants. He has 14 years
of diversified experience of
handling finance, business
planning, after sales services
functions with Honda Atlas
Cars (Pakistan) Ltd, a subsidiary
of Honda Motor Company,
Japan. He has joined the
Company in early 2010.
11Annual Report
for the year ended December 31, 2013
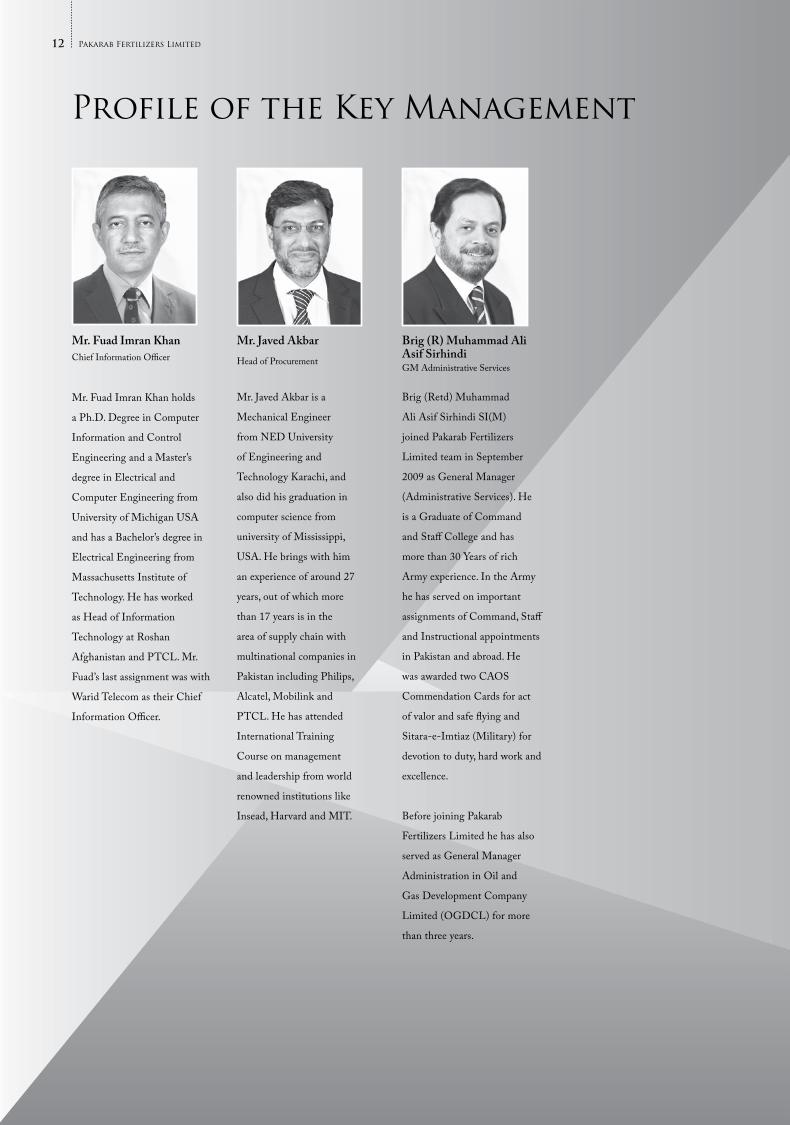
Brig (R) Muhammad Ali Asif SirhindiGM Administrative Services
Brig (Retd) Muhammad
Ali Asif Sirhindi SI(M)
joined Pakarab Fertilizers
Limited team in September
2009 as General Manager
(Administrative Services). He
is a Graduate of Command
and Staff College and has
more than 30 Years of rich
Army experience. In the Army
he has served on important
assignments of Command, Staff
and Instructional appointments
in Pakistan and abroad. He
was awarded two CAOS
Commendation Cards for act
of valor and safe flying and
Sitara-e-Imtiaz (Military) for
devotion to duty, hard work and
excellence.
Before joining Pakarab
Fertilizers Limited he has also
served as General Manager
Administration in Oil and
Gas Development Company
Limited (OGDCL) for more
than three years.
Mr. Javed AkbarHead of Procurement
Mr. Javed Akbar is a
Mechanical Engineer
from NED University
of Engineering and
Technology Karachi, and
also did his graduation in
computer science from
university of Mississippi,
USA. He brings with him
an experience of around 27
years, out of which more
than 17 years is in the
area of supply chain with
multinational companies in
Pakistan including Philips,
Alcatel, Mobilink and
PTCL. He has attended
International Training
Course on management
and leadership from world
renowned institutions like
Insead, Harvard and MIT.
Mr. Fuad Imran KhanChief Information Officer
Mr. Fuad Imran Khan holds
a Ph.D. Degree in Computer
Information and Control
Engineering and a Master’s
degree in Electrical and
Computer Engineering from
University of Michigan USA
and has a Bachelor’s degree in
Electrical Engineering from
Massachusetts Institute of
Technology. He has worked
as Head of Information
Technology at Roshan
Afghanistan and PTCL. Mr.
Fuad’s last assignment was with
Warid Telecom as their Chief
Information Officer.
Profile of the Key Management
12 Pakarab Fertilizers Limited

Organization Chart
Board of Directors
Audit Committee
HR & Remuneration
Committee
Chief Executive Officer
GMManufacturing
Head of Internal Audit
GM Business Development
Chief Information
Officer
Head ofProcurement
GMAdministrative
Services
GMProjects
Chief FinancialOfficer
CompanySecretary
Group Head of Human Resource
DirectorMarketing
DirectorSpecial Projects
Advisor toCEO
13Annual Report
for the year ended December 31, 2013

Notice is hereby given that the 41st Annual General Meeting of the shareholders of PAKARAB FERTILIZERS LIMITED (the ‘Company’ or ‘PFL’) will be held on Wednesday, April 30, 2014 at 09:30 a.m. at E-110, Khayaban-e-Jinnah, Lahore Cantt., to transact the following business:
Ordinary Business
1. To confirm minutes of the Annual General Meeting held on April 30, 2013.
2. To receive, consider and adopt the audited financial statements of the Company together with the Directors’ and Auditors’ Reports thereon for the year ended December 31, 2013 together with the audited consolidated financial statements of Pakarab Fertilizers Limited and subsidiary Reliance Sacks Limited for the year ended December 31, 2013 and the Auditors’ Reports thereon.
3. To appoint Auditors for the year ending December 31, 2014 and to fix their remuneration. The Audit Committee and the Board of Directors have recommended for reappointment of M/s A. F. Ferguson & Co., Chartered Accountants as external auditors.
Other Business
4. To transact any other business with the permission of the Chair.
By order of the Board
Ausaf Ali QureshiLahore: April 09, 2014. Company Secretary
Notes:
1. The share transfer books of the Company will remain closed from April 24, 2014 to April 30, 2014 (both days inclusive). Transfers received in order at the registered office of the Company by the close of business on April 23, 2014 will be treated in time.
2. A member entitled to attend and vote at the meeting may appoint another member as his/her proxy who shall have such rights as respects attending, speaking and voting at the meeting as are available to a member.
3. Proxies in order to be effective must be received by the Company at the Registered Office not later than 48 hours before the time for holding meeting, duly signed and stamped and witnessed by two persons with their names, address, NIC number and signatures.
4. Shareholders are requested to immediately notify the change of their address, if any.
NOTICE OF THE 41ST ANNUAL GENERAL MEETING
14 Pakarab Fertilizers Limited

Dec 31, Dec 31, Dec 31, Dec 31, Dec 31, Dec 31, 2008 2009 2010 2011 2012 2013 Income Statement Turnover Rs. 18,887 16,706 18,248 16,701 8,136 7,428 Cost of Goods Sold Rs. (6,378) (9,796) (9,051) (7,188) (6,221) (7,143)Gross Profit Rs. 12,509 6,910 9,197 9,513 1,915 286 Admin Cost Rs. (590) (610) (780) (969) (1,165) (888)Distribution Cost Rs. (583) (898) (994) (829) (299) (495)Financial Cost Rs. (2,296) (3,159) (3,589) (3,472) (2,610) (1,579)Other Expenses Rs. (1,019) (244) (386) (510) (218) (382)Interest Income Rs. 37 146 543 736 685 63 Other Income Rs. 34 196 866 1,119 843 198 Re-measurement gain / (loss) Rs. - 2,866 (121) 741 (47) - Share gain/(loss) of associated company Rs. (57) (25) (39) (18) - - Profit before Tax Rs. 8,035 5,183 4,697 6,311 (896) (2,798)Profit after Tax Rs. 7,090 4,738 3,232 4,590 (240) (1,825)EBITDA Rs. 10,815 8,342 8,943 10,665 2,929 (745)
Balance Sheet Paid up Capital Rs. 3,000 4,500 4,500 4,500 4,500 4,500 Shareholder’s Equity including revaluation reserve Rs. 11,452 12,823 10,224 17,856 15,396 13,584 Long term borrowings Rs. 13,805 16,191 13,372 8,484 4,559 1,466 Capital employed Rs. 33,713 39,426 33,989 43,880 37,077 30,756 Deferred liabilities Rs. 4,656 5,021 5,631 11,058 11,038 10,059 Property, plant & equipment Rs. 20,279 21,285 21,916 37,937 37,290 37,114 Long term assets Rs. 32,047 35,039 33,178 46,336 41,188 40,945 Net current assets / Working capital Rs. 1,666 4,387 811 (2,456) (4,111) (10,188)Total Assets Rs. 45,523 52,126 50,637 65,341 54,636 48,148
Cash Flows: Operating activities Rs. 2,780 6,712 4,109 4,023 (1,179) (682)Investing activities Rs. (10,278) (10,353) (2,989) (710) 5,870 2,790 Financing activities Rs. 3,100 3,467 (316) (2,643) (5,665) (1,864)Changes in cash & cash equivalents Rs. (4,398) (174) 804 669 (973) 244 Cash & cash equivalents - Year end Rs. (5,146) (5,321) (4,517) (3,847) (4,820) (4,576)
Key Indicators: Operating: Gross Profit Margin % 66.23 41.36 50.40 56.96 23.54 3.84Pre tax margin % 42.54 31.03 25.74 37.79 (11.01) (37.67)Net profit margin % 37.54 28.36 17.71 27.48 (2.95) (24.57)EBITDA %age to sales % 57.26 49.93 49.01 63.86 36.00 (10.03)Earning per share (Rs.) Basic Rs. 23.63 10.53 7.18 10.20 (0.53) (4.06)
Performance: Book Value per share (Excluding revaluation surplus) Rs. 39.92 32.99 27.22 23.14 17.63 13.78Book Value per share (Including revaluation surplus) Rs. 48.17 38.50 32.72 49.68 44.21 40.19Return on assets % 15.57 9.09 6.38 7.02 (0.44) (3.79)Total Assets Turnover Times 0.41 0.32 0.36 0.26 0.15 0.15Fixed Assets Turnover Times 0.93 0.77 0.82 0.44 0.22 0.20Debtors turnover Times 19.18 11.80 11.13 12.19 11.14 20.52Debtors turnover Days 19 31 33 29.95 33 18 Inventory turnover Times 1.43 1.80 1.82 1.45 1.32 1.40Inventory turnover Days 255 203 200 251 276 261 Return on Share Capital % 236.33 105.29 71.82 102.00 (5.33) (40.56)Return on Equity (excluding revaluation surplus) % 59.20 31.91 26.39 44.08 (3.03) (29.44)
Leverage: Long Term Debt : Equity 54:46 54:46 59:41 59:41 54:46 43:57Interest cover 4.06 1.64 1.31 1.82 (0.66) (0.77)
Liquidity: Current Ratio 1.14 1.35 1.05 0.89 0.77 0.41 Quick ratio 0.62 0.98 0.73 0.67 0.49 0.20
Valuation Earnings per share (before tax) Rs. 26.78 11.52 10.44 14.02 (1.99) (6.22)Earnings per share (after tax) Rs. 23.63 10.53 7.18 10.20 (0.53) (4.06)Earnings Growth % 430.29 (55.45) (31.79) 42.02 (105.23) (660.45) Cash dividend % - - - - - - Bonus dividend % 50.00 - - - - - Specie dividend % 50.00 100.00 130 148 49 -
Financial HighlightsSix years at a glance (Rs. in millions except per share data and ratios)
15Annual Report
for the year ended December 31, 2013

Horizontal AnalysisBalance Sheet
Rupees (‘million’) % Change
Dec 31 Dec 31, Dec 31, Dec 31, Dec 31, 2009 vs 2010 vs 2011 vs 2012 vs 2013 vs 2009 2010 2011 2012 2013 2008 2009 2010 2011 2012 (Restated)
Issued, subscribed and paid up capital 4,500 4,500 4,500 4,500 4,500 50.00 - - - - Reserves 10,147 7,548 5,714 3,432 1,700 16.15 (25.61) (24.30) (39.94) (50.47)Share deposit money 200 200 200 - - (16.67) - - (100.00) - Revaluation reserve 2,476 2,476 11,942 11,964 11,884 - - 382.31 0.18 (0.67) 17,323 14,724 22,356 19,896 18,084 19.87 (15.00) 51.83 (11.00) (9.11) Non-Current Liabilities Long term finances 16,191 13,372 8,484 4,559 1,466 17.28 (17.41) (36.55) (46.26) (67.84)Supplier’s credit - secured - - 1,796 1,488 1,100 100 (17.15) (26.08)Liabilities against assets subject to finance lease 107 218 138 50 - 42.67 103.74 (36.70) (63.77) (100.00)Payable against mining rights 52 - - - - - (100.00) - - - Long term deposits 732 44 48 46 47 1.10 (93.99) 9.09 (4.17) 2.49 Deferred liabilities 46 57 91 115 126 8.95 24.57 59.65 26.37 9.98 Deferred taxation 4,975 5,574 10,967 10,923 9,933 7.82 12.04 96.75 (0.40) (9.07) 22,103 19,265 21,524 17,181 12,672 14.76 (12.84) 11.73 (20.18) (26.24)Current Liabilities Current portion of long term liabilities 1,339 4,009 6,335 4,878 3,132 4,141.50 199.40 58.02 (23.00) (35.79)Finances under mark up arrangements - secured 5,556 4,702 4,644 5,814 4,736 6.20 (15.37) (1.23) 25.19 (18.54)Derivative financial instruments - - - - - - - - - - Payable to Privatization Commission of Pakistan 2,198 2,198 2,198 2,198 2,198 - - - - (0.00)Short term loan from related party - secured - - - - 3,000 - - - - - Trade and other payables 2,491 4,458 3,121 3,225 3,989 (18.19) 78.96 (29.99) 3.33 23.68 Accrued finance cost 989 650 677 366 337 23.73 (34.28) 4.15 (45.94) (8.04)Dividend payable - - 3,755 1,078 - - (100.00)Provision for taxation 127 631 731 - - (72.01) 396.85 15.85 (100.00) - 12,700 16,648 21,461 17,559 17,391 7.53 31.09 28.91 (18.18) (0.95) 52,126 50,637 65,341 54,636 48,148 14.50 (2.86) 29.04 (16.38) (11.88)
Rupees (‘million’) % Change
Dec 31 Dec 31, Dec 31, Dec 31, Dec 31, 2009 vs 2010 vs 2011 vs 2012 vs 2013 vs 2009 2010 2011 2012 2013 2008 2009 2010 2011 2012 (Restated)
Non-Current Assets Property, plant and equipment 21,285 21,916 37,937 37,290 37,114 4.96 2.96 73.10 (1.71) (0.47)Assets subject to finance lease 148 283 230 121 51 26.65 91.22 (18.73) (47.39) (58.16)Intangibles 206 183 161 149 144 - (11.17) (12.02) (7.45) (3.08)Goodwill 3,305 3,305 3,305 3,305 3,305 - - - - 0.00 Investments - related party 7,882 2,930 130 262 295 (5.42) (62.83) (95.56) 101.54 12.42 Loan to subsidiary 2,196 4,516 4,516 - - 105.65 - (100.00) - Security deposits 17 45 57 61 36.22 109.67 164.71 26.67 7.02 (40.63) 35,039 33,178 46,336 41,188 40,945 9.34 (5.31) 39.66 (11.11) (0.59)
Current Assets Stores and spare parts 1,880 2,310 2,583 3,023 2,904 5.80 22.87 11.82 17.03 (3.92)Stock-in-trade 2,793 2,947 2,058 1,734 812 (36.95) 5.51 (30.17) (15.74) (53.19)Trade debts 1,427 1,851 890 571 153 1.57 29.71 (51.92) (35.84) (73.18)other receivables 6,814 3,583 5,300 6,042 3,174 17.91 (47.42) 47.92 14.00 (47.47)Derivative 8 69 19 - - - 762.50 (72.46) (100.00) - Investments 3,930 6,513 7,359 1,084 - - 65.73 12.99 (85.27) (100.00)Cash and bank balances 235 186 796 994 160 176.47 (20.85) 327.96 24.87 (83.92) 17,087 17,459 19,005 13,448 7,203 26.80 2.18 8.86 (29.24) (46.44) 52,126 50,637 65,341 54,636 48,148 14.50 (2.86) 29.04 (16.38) (11.88)
16 Pakarab Fertilizers Limited

Vertical AnalysisBalance Sheet
Rupees (‘million’) % Change
Dec 31 Dec 31, Dec 31, Dec 31, Dec 31, 2009 vs 2010 vs 2011 vs 2012 vs 2013 vs 2009 2010 2011 2012 2013 2008 2009 2010 2011 2012 (Restated)
Issued, subscribed and paid up capital 4,500 4,500 4,500 4,500 4,500 8.63 8.89 6.89 8.24 9.35 Reserves 10,147 7,548 5,714 3,432 1,700 19.47 14.91 8.74 6.28 3.53 Share deposit money 200 200 200 - - 0.38 0.39 0.31 - - Revaluation reserve 2,476 2,476 11,942 11,964 11,884 4.75 4.89 18.28 21.90 24.68 17,323 14,724 22,356 19,896 18,084 33.23 29.08 34.21 36.42 37.56 Non-Current Liabilities Long term finances 16,191 13,372 8,484 4,559 1,466 31.06 26.41 12.98 8.34 3.04 Supplier’s credit - secured - - 1,796 1,488 1,100 - - 2.75 2.72 2.28 Liabilities against assets subject to finance lease 107 218 138 50 - 0.21 0.43 0.21 0.09 - Payable against mining rights 52 - - - - 0.10 - - - - Long term deposits 732 44 48 46 47 1.40 0.09 0.07 0.08 0.10 Deferred liabilities 46 57 91 115 126 0.09 0.11 0.14 0.21 0.26 Deferred taxation 4,975 5,574 10,967 10,923 9,933 9.54 11.01 16.78 19.99 20.63 22,103 19,265 21,524 17,181 12,672 42.40 38.05 32.94 31.45 26.32 Current Liabilities Current portion of long term liabilities 1,339 4,009 6,335 4,878 3,132 2.57 7.92 9.70 8.93 6.51 Finances under mark up arrangements - secured 5,556 4,702 4,644 5,814 4,736 10.66 9.29 7.11 10.64 9.84 Derivative financial instruments - - - - - - - - - - Payable to Privatization Commission of Pakistan 2,198 2,198 2,198 2,198 2,198 4.22 4.34 3.36 4.02 4.56 Short term loan from related party - secured - - - - 3,000 - - - - 6.23 Trade and other payables 2,491 4,458 3,121 3,225 3,989 4.78 8.80 4.78 5.90 8.28 Accrued finance cost 989 650 677 366 337 1.90 1.28 1.04 0.67 0.70 Dividend payable - - 3,755 1,078 - - - 5.75 1.97 - Provision for taxation 127 631 731 - - 0.24 1.25 1.12 - - 12,700 16,648 21,461 17,559 17,391 24.36 32.88 32.84 32.14 36.12 52,126 50,637 65,341 54,636 48,148 100.00 100.00 100.00 100.00 100.00
Rupees (‘million’) % Change
Dec 31 Dec 31, Dec 31, Dec 31, Dec 31, 2009 vs 2010 vs 2011 vs 2012 vs 2013 vs 2009 2010 2011 2012 2013 2008 2009 2010 2011 2012 (Restated)
Non-Current Assets Property, plant and equipment 21,285 21,916 37,937 37,290 37,114 40.83 43.28 58.06 68.25 77.08 Assets subject to finance lease 148 283 230 121 51 0.28 0.56 0.35 0.22 0.11 Intangibles 206 183 161 149 144 0.40 0.36 0.25 0.27 0.30 Goodwill 3,305 3,305 3,305 3,305 3,305 6.34 6.53 5.06 6.05 6.86 Investments - related party 7,882 2,930 130 262 295 15.12 5.79 0.20 0.48 0.61 Loan to subsidiary 2,196 4,516 4,516 - - 4.21 8.92 6.91 - - Security deposits 17 45 57 61 36 0.03 0.09 0.09 0.11 0.08 35,039 33,178 46,336 41,188 40,945 67.22 65.52 70.91 75.39 85.04
Current Assets Stores and spare parts 1,880 2,310 2,583 3,023 2,904 3.61 4.56 3.95 5.53 6.03 Stock-in-trade 2,793 2,947 2,058 1,734 812 5.36 5.82 3.15 3.17 1.69 Trade debts 1,427 1,851 890 571 153 2.74 3.66 1.36 1.05 0.32 Other receivables 6,814 3,583 5,300 6,042 3,174 13.07 7.08 8.11 11.06 6.59 Derivative financial instruments 8 69 19 - - 0.02 0.14 0.03 - - Investments 3,930 6,513 7,359 1,084 - 7.54 12.86 11.26 1.98 - Cash and bank balances 235 186 796 994 160 0.45 0.37 1.22 1.82 0.33 17,087 17,459 19,005 13,448 7,203 32.78 34.48 29.09 24.61 14.96 52,126 50,637 65,341 54,636 48,148 100.00 100.00 100.00 100.00 100.00
17Annual Report
for the year ended December 31, 2013

Rupees in Million % Change Dec 31, Dec 31, Dec 31, Dec 31, Dec 31, 2009 vs 2010 Vs 2011 Vs 2012 Vs 2013 Vs 2009 2010 2011 2012 2013 2008 2009 2010 2011 2012 (Restated)
Sales 16,706 18,248 16,701 8,136 7,428 (11.55) 9.23 (8.48) (51.28) (8.70)Cost of sales (9,796) (9,051) (7,188) (6,221) (7,143) 53.59 (7.61) (20.58) (13.45) 14.82 Gross profit 6,910 9,197 9,513 1,915 286 (44.76) 33.10 3.44 (79.87) (85.09)Administrative expenses (610) (780) (969) (1,165) (888) 3.39 27.87 24.23 20.23 (23.82)Selling & distribution expenses (898) (994) (829) (299) (495) 54.03 10.69 (16.60) (63.93) 65.69 Finance cost (3,159) (3,589) (3,472) (2,610) (1,579) 37.59 13.61 (3.26) (24.83) (39.49)Other operating expenses (244) (387) (510) (218) (382) (76.05) 58.61 31.78 (57.25) 75.08 Other operating income 342 1,409 1,855 1,528 261 381.69 311.99 31.65 (17.63) (82.95)Operating profit 2,341 4,856 5,588 (849) (2,798) (71.07) 107.43 15.07 (115.19) 229.55 Share of profit / ( loss) of associated co. (25) (39) (18) - - (55.78) 54.72 (53.85) (100.00) - Re-measurement gain / (loss) 2,866 (121) 741 (47) - - (104.22) (712.40) (106.34) (100.00)Profit before taxation 5,182 4,696 6,311 (896) (2,798) (35.50) (9.38) 34.39 (114.20) 212.26 Taxation (444) (1,464) (1,721) 656 973 (53.02) 229.73 17.55 (138.12) 48.29 Profit after taxation 4,738 3,232 4,590 (240) (1,825) (33.17) (31.79) 42.02 (105.23) 660.45
Rupees in Million % Change Dec 31, Dec 31, Dec 31, Dec 31, Dec 31, 2009 vs 2010 Vs 2011 Vs 2012 Vs 2013 Vs 2009 2010 2011 2012 2013 2008 2009 2010 2011 2012 (Restated)
Sales 16,706 18,248 16,701 8,136 7,428 100.00 100.00 100.00 100.00 100.00 Cost of sales (9,796) (9,051) (7,188) (6,221) (7,143) (58.64) (49.60) (43.04) (76.46) (96.16)Gross profit 6,910 9,197 9,513 1,915 286 41.36 50.40 56.96 23.54 3.84 Administrative expenses (610) (780) (969) (1,165) (888) (3.65) (4.27) (5.80) (14.32) (11.95)Selling & distribution expenses (898) (994) (829) (299) (495) (5.38) (5.45) (4.96) (3.68) (6.67)Finance cost (3,159) (3,589) (3,472) (2,610) (1,579) (18.91) (19.67) (20.79) (32.08) (21.26)Other operating expenses (244) (387) (510) (218) (382) (1.46) (2.12) (3.05) (2.68) (5.14)Other operating income 342 1,409 1,855 1,528 261 2.05 7.72 11.11 18.78 3.51 Operating profit 2,341 4,856 5,588 (849) (2,798) 14.01 26.61 33.46 (10.44) (37.67)Share of profit / (loss) of associated co. (25) (39) (18) - - (0.15) (0.21) (0.11) - - Re-measurement gain / (loss) 2,866 (121) 741 (47) - 17.16 (0.66) 4.44 (0.58) - Profit before taxation 5,182 4,696 6,311 (896) (2,798) 31.02 25.73 37.79 (11.01) (37.67)Taxation (444) (1,464) (1,721) 656 973 (2.66) (8.02) (10.30) 8.06 13.10 Profit after taxation 4,738 3,232 4,590 (240) (1,825) 28.36 17.71 27.48 (2.95) (24.57)
Vertical AnalysisProfit and Loss
Horizontal AnalysisProfit and Loss
18 Pakarab Fertilizers Limited

Rs. 5.0 billion TFCs (Fully paid in February 2013)Rating AA (Long Term)
Rs. 6.5 billion PPTFCsAA (Long Term)
AA- (Long Term)A-1 (short term)
Definitions:
AA-High credit quality. Protection factors are strong. Risk is modest but may vary slightly from time to time because of economic conditions.
A-1High certainty of timely payment. Liquidity factors are excellent and supported by good fundamental protection factors. Risk factors are minor.
AAHigh credit quality. Protection factors are strong. Risk is modest but may vary slightly from time to time because of economic conditions.
Entity Ratings by JCR-VISEntity Ratings by JCR-VIS
19Annual Report
for the year ended December 31, 2013

Directors’ Report to the members
On behalf of the Board of Directors of Pakarab Fertilizers Limited, I present herewith the Annual Report of your Company and the audited financial statements for the year ended December 31, 2013 together with auditors’ report thereon and a brief overview of financial and operational performance of the Company.
Company OverviewRegretablly, the Company has had another poor year due to gas supply curtailment. During the year the Company was operational for merely 43 days and thus suffered a radical decline in production and in sales.
NP sales in 2013 were at 51kt, down by 58% as compared to last year. CAN sales in 2013 were at 56kt, down by a significant 44% compared to last year. The Company imported and sold 52kt DAP in an attempt to remain in the market and compensated the loss suffered due to severe gas curtailment.
Financial Performance ReviewDuring the year 2013, the gas supply situation for the Company worsended as compared to other plants on SNGPL network. Gas supply remained continuously suspended since December 06, 2012 till August 30, 2013. PFL received gas for only 43 days during the September 2013 and October 2013. Consequently, the production capacity could not be achieved and the Company suffered a loss after tax of Rs. 1,825 million for the year 2013. The production of NP, CAN and Urea as a percentage of annual design capacity remained 15.89%, 12.32% and 2.45% respectively.
Management has implemented various measures to minimize expenses including financial cost by managing the loans. Management successfully managed to save Rs. 1,031 million on account of financial cost that reduced as compared to last year from Rs. 2,610 million to Rs. 1,579 million. Besides the cost control measures, the sale of imported DAP also contributed to reduce the losses.
Reliance Sack Limited (RSL) is a wholly owned subsidiary of Pakarab Fertilizers Limited (PFL). It is principally engaged in the manufacturing and sale of polypropylene sacks, polypropylene cloth and liners.
Overall annual capacity of the plant in terms of number of bags is 52 million. The company achieved 94% of the standard capacity in terms of number of bags during the year. It produced 49.190 million polypropylene (PP) bags. The company also started production and sales of liners to fertilizer industry from June 2013. Total capacity of liners is 120 MT (almost 3.6 million liners) per month and company achieved 93% production capacity and produced 814 MT (21.5 million liners).
This has been the first year of commercial production for the company and it has been able to achieve after tax profit of Rs. 28.56 million for the year.
Rupees in million
Jan-Dec Jan-Dec 2013 2012
Sales 7,428 8,136 Gross Profit 285 1,915 Finance Cost (1,579) (2,610)Other Operating Income 261 1,529 Loss after tax (1,825) (240)
A summary of consolidated financial results for the year 2013 is as under:Rupees in million
Jan - Dec Jan - Dec 2013 2012
Sales 8,699 8,136 Gross Profit 416 1,915 Finance Cost (1,640) (2,611)Other Income 261 1,529Loss after tax (1,801) (245)
AppropriationsAppropriations during the year were as follows:
Rupees in million
Fair General Un - Value Reserve Reserve Appropriated Profit / (Accumulated Loss) Balance as at December 31, 2012 - 2,098 1,334Other comprehensive income for the year 2013 20 - 72Loss for the year 2013 - - (1,825) 20 2,098 (419)
A summary of financial results for the year 2013 compared with year 2012 is as under.
20 Pakarab Fertilizers Limited

Post Balance Sheet EventsThere have been no material post balance sheet events that would require
Plant Preservation and OperationsPakarab Fertilizers faced gas outage and natural gas curtailment throughout the year. There was no gas supply till end August 2013. This forced proper preservation of equipment and machines, which was done successfully. Upon gas availability the plant was restarted without any problems and service factor thereafter remained 100%.
Dec 2007(4.06)
FY 2008 FY 2009 FY 2010 FY 2011 FY 2012 FY 2013
Earnings Per Share(Rupees)
4.46
15.76
10.53
7.18
10.20
(0.53)
Dec 2007 FY 2008 FY 2009 FY 2010 FY 2011 FY 2012 FY 2013
Net Pro t & EBITDA Margin(Percentage)
49%57%
50% 49%
64%
36%
-10%
26%
38%
28%
18%27%
-2.95%
-25%
disclosure or adjustment to these financial statements.
Statement as to the Value of Investments of Provident and Gratuity FundsThe funded retirement benefits of the employees of the Company are audited at regular intervals and are adequately covered by appropriate investments. The value of the investments of the two provident funds and gratuity fund aggregated to Rs. 295.90 millions. According to actuarial valuation, fair value of the assets of the funded defined benefit gratuity plan for both management & non-management staff is Rs. 89.81 million as on 31st December 2013.
Urea plant was started in September, 2013 after a shutdown of 2 years safely and smoothly after reverting all preservation arrangements.
The plant has been maintained in good shape during outages and operated safely during availability of precious gas. The plant was operated with a bare-minimum manpower of 160 employees in management cadre.
Installation and Commissioning of Natural Gas Cracking UnitIn order to sustain business during gas outage/limitation period and to fulfill customer demands for liquefied carbon dioxide (LCO2), a new dual train natural gas cracking unit was installed at a capital cost of Rs. 80 millions. Lot of engineering work for this plant was done by PFL team in house due to which it attained about 90% capacity factor finally. Piping and all the smaller equipment are designed and manufactured at site. This facility enabled us to continue LCO2 supply almost all-round the year.
Study of Different Business OptionsA number of studies were taken up to explore various possibilities of revenue generation by PFL team. These included:
1. Calcium Nitrate Fertilizers – Successfully produced this liquid fertilizer. Now under farm testing.
2. NP/CAN operations by using Ammonia from other sources
3. SSP fertilizer production and sales
– Work still in progress on various
options.
21Annual Report
for the year ended December 31, 2013

Safety Performance:
Period 2009 2010 2011 2012 2013
Loss Time Injury - 1 - - -
First Aid Cases 7 2 7 13 7
Fire Incident-Minor 2 2 5 6 2
Total Recordable Injury Rate 0.22 0.33 0.10 0.305 0.26
Celebration of Environment Day To raise awareness among PFL employees and their families, Environmental Day was celebrated. Tree plantation was also done on this occasion.
Human Resource Management Town Hall MeetingThe first town hall meeting was held at Pakarab Fertilizers Limited on December 24, 2013 and all the management employees at PFL were invited. The main objective of the town hall was to enable the senior leadership to keep people informed, engaged and in sync with business challenges and goals.
Training and DevelopmentIn its commitment to investing in human capital, a number of trainings were conducted by the Company this year. Major focus has been launching and training of process safety management and operational excellence. All the management employees have undergone this training.
Taking advantage from availability of resource for training, the training hours per employee per year soared to a record 57hr/employee/year in 2013. Formal training sessions comprised of 178 formal sessions translating to 9,342 man hours of management employees alone. All the training sessions were designed and executed in house to curtail costs.
4. DAP import and marketing
- 51,162 MeT of DAP was
imported and successfully
marketed by marketing team.
Health Safety, Environment and Quality Management SystemsThe organization continued its pursuit
for manufacturing excellence in this
area as well.
Milestones:
• Completed 10 million man hours
without LTI in November 2013.
• Pakarab again won the
International Safety Award from
British Safety Council in 2013,
3rd time in a row. This
International Safety Award
recognizes and rewards
organizations that show a real
commitment to improving
corporate health and safety.
• IMS certification third party
audit conducted and certification
obtained for ISO 9001:2008;
ISO 14001:2004 & OHSAS
18001:2007
• Process Safety Management
System (PSM) internal audit
carried out for the second time.
• PSM training of all management
employees was completed.
Directors’ Report to the members
22 Pakarab Fertilizers Limited

Values and Behaviors
“Culturing the Business DNA”
The Company defined its 7 core
business values and their relevant
behaviors in 2012. This was followed
by the embedding phase. The year
2013 was dedicated to measuring the
level of understanding and awareness
among the employees. A formal survey
was conducted to gauge the same at
the staff as well as management level.
The results were compiled and you
would be happy to know that the level
of understanding and awareness of
these core values measured up to be
85%.
A new Business Strategy Review
Committee was formed (with
representation from all departments)
to work out a way forward to
effectively incorporate these values
into your Business DNA.
Corporate Social ResponsibilityDespite the losses being suffered due
to gas curtailment, your Company
feels responsible towards the
communities and aims to contribute
for their betterment in every way
possible. Your Company’s corporate
social responsibility is more than just
a statement. It strives to contribute
towards the wellbeing of the local
communities. Your Company’s
initiatives in health, environment and
other social sectors are the living proof
of your Company’s concern. Your
Company believes that the growth of
its business depends on the growth of
the communities around it.
LUMS-National Outreach Program (NOP)Further to last year’s commitment to
the institution, LUMS, your Company
enhanced the number of NOP
scholarships from 8 to 12 in 2013. The
objective of the LUMS NOP program
which was launched in 2001 is to
provide free of cost education to the
deserving youth of Pakistan.
IBA Support in line with its
commitment to give back to the
society, your Company has initiated
an Endowment Fund at Institution
of Business Administration, Karachi
(IBA). Furthermore, Marketing
Director of your Company,
Mr. Muhammad Zahir, has been
selected as a Board member of Friends
of IBA Trust (FIBAT). FIBAT was
established by the IBA Board of
Governors with an aim to provide
better material, financial help and
facilities to students, faculties and staff
of IBA in order to further the purposes
of education and to allocate amounts
in achieving the said purposes.
Other Initiatives
The Company has further donated Rs.
152 million towards the following
charitable institutions/causes:
• Tree Plantation
• Multan Diabetic Foundation
• Punjab Workers Welfare Board
Hospital (PWWBH)
Engaged Employees
Your Company believes that it is
absolutely imperative to form a
mutually beneficial relationship with
its communities and support them
through economic development and
corporate social investment initiatives.
Your Company is of the opinion
that it is the duty of every employee
to give back to the community by
contributing to various social and
developmental causes both on an
individual and collective basis.
The Employee Volunteer Program
(EVP) provides employees with an
opportunity to contribute to various
social causes that they support under
Company sponsorship. By means
of this initiative, your Company is
not just addressing various social
concerns but facilitating employee
interest in helping their communities
through their work place. EVPs
lead to healthier, more developed
communities whereby people are more
aware of the multitude of social issues
that the nation faces and are provided
with a platform to mitigate these
problems.
23Annual Report
for the year ended December 31, 2013
Code of Corporate GovernanceThe Board and management are
committed to ensure that the
requirements of the Code of
Corporate Governance are fully
met. Though it is not applicable
being a non listed company but the
Company is voluntarily complying
the Code. The Company has adopted
good Corporate Governance
practices with an aim to enhance
the accuracy, comprehensiveness and
transparency of financial and non-
financial information. Pursuant to
and in voluntarily compliance with
clause (xvi) of the Code of Corporate
Governance, the Directors are pleased
to report that:
a) The financial statements, prepared
by the management of the
Company, present its state of affairs
fairly, the result of its operations,
cash flows and changes in equity;
b) Proper books of account of the
Company have been maintained;
c) Appropriate accounting policies
have been consistently applied in
preparation of financial statements
and accounting estimates are
based on reasonable and prudent
judgment;
d) International Financial Reporting
Standards, as applicable in
Pakistan, have been followed in the
preparation of financial statements;
e) The system of internal control
is sound in design and has been
effectively implemented and
monitored; and
f ) There are no significant doubts
upon the Company’s ability to
continue as a going concern.
Board and Committees’ Meetings and Attendance
During the year under review, five
meetings of the Board of Directors
and four meetings of the Audit
Committee were held from January
01, 2013 to December 31, 2013.
The attendance of the Board and
Committee members was as follows:
Name of Board AuditDirector Meetings Committee Meetings
Mr. Arif Habib 5 N/A
Mr. Fawad Ahmed Mukhtar 5 N/A
Mr. Fazal Ahmed Sheikh 4 2
Mr. Faisal Ahmed Mukhtar 2 N/A
Mr. Rehman Naseem 3 2
Mr. Abdus Samad 4 N/A
Mr. Muhammad Kashif Habib 4 3
Mr. Nasim Beg 5 4
The leave of absence was granted to
the members not attending the Board
and Committee meetings.
Pattern of ShareholdingThe detailed pattern of the
shareholding and categories of
shareholders of the Company as
at December 31, 2013 have been
appended to the Annual Report on
page 144.
Trading in Share of the Company by Directors and ExecutivesThe shares of the Company are not
listed on any stock exchange so the
Directors, CEO, CFO, Company
Secretary and their spouses and minor
children did not carry out any trade in
the shares of the Company.
Financial HighlightsKey operating and financial data of
previous years has been summarized
on page 15.
Audit CommitteeThe Audit Committee of the Board
continued to perform its duties and
responsibilities effectively as per its
terms of reference duly approved by
the Board. The committee composition
and its terms of reference have also
been attached to this report.
Directors’ Report to the members
24 Pakarab Fertilizers Limited

Corporate and Secretarial ComplianceThe Company Secretary has furnished
a Secretarial Compliance Certificate
as part of the annual return filed with
the registrar of Companies to certify
that the secretarial and corporate
requirements of the Companies
Ordinance, 1984, Memorandum
and Articles of Association of the
Company and the listing regulations
have been duly complied with.
Code of ConductAs per the Corporate Governance
guidelines, the Company has prepared
a Code of Conduct and communicated
throughout the Company apart from
placing it on the Company’s website.
AuditorsM/s A.F. Ferguson & Company
Chartered Accountants Lahore,
retiring auditors of the Company,
being eligible offer themselves for
re-appointment. The Board Audit
Committee and the Board of
Directors have recommended their
re-appointment by the shareholders at
the 41st Annual General Meeting, as
auditors of the Company for the year
ending December 31, 2014 at a fee to
be mutually agreed.
Future OutlookThe newly elected Government has
shown positive intentions to resolve
the economic turmoil and they took
various serious measures to resolve
the problems of fertilizer industry.
Shifting of Engro and Agritech over
other fields is one of the initiatives
taken by the Government.
Management is continuously engaged
with the GoP on short term as well
as long term solution of the gas issue.
We are also working towards the
development of infrastructure for
installation of new gas pipeline form
dedicated fields. Management is also
exploring other domains to utilize its
skilled resources like manufacturing of
SSP considering the market position
of this type of fertilizer in the country.
Your Company has also planned to
import significant quantity of DAP
during coming year to maintain its
phosphatic market.
The Management is taking all
possible measures within its reach
to ensure that it gets fair treatment
from SNGPL in receipt of gas
under the priority policy set by the
Government. However, the future of
the Company is totally dependant of
the Government putting the long-
term gas supply arrangements on fast
track and the various State Enterprise
involved with the issue lending
complete co-operation and support.
The Government had to spend foreign
exchange of USD 308 million and
subsidy of around Rs. 22 billion on
import of Urea which can be saved
if it provides gas to local fertilizer
manufacturing plants.
AcknowledgementsThe Board places on record its
gratitude for the hard work and
dedication of every employee of the
Company. The Board also appreciates
and acknowledges the financial
institutions, commercial banks,
business associates, customers and all
others whose efforts and contributions
strengthened the Company and in
particular, support of the Government
of Pakistan in its recent decision to
recommencing gas supplies to the
Company.
For and on behalf of Board
Lahore Arif HabibMarch 27, 2014 Chairman
25Annual Report
for the year ended December 31, 2013

This statement is being presented to voluntarily comply with the Code of Corporate Governance (CCG) for the purpose of establishing a framework of good governance, whereby a listed company is managed in compliance with the best practices of corporate governance.
The Company has applied the principles contained in the CCG in the following manner:
1. The Company encourages the representation of independent non-executive directors and directors representing minority interests on its board of directors. At present the board includes:
Category Names
Executive 1. Mr. Fawad Ahmed MukhtarDirectors 2. Mr. Fazal Ahmed Sheikh
Non-Executive 1. Mr. Arif HabibDirectors 2. Mr. Nasim Beg 3. Mr. Faisal Ahmed Mukhtar 4. Mr. Rehman Naseem 5. Mr. Muhammad Kashif Habib 6. Mr. Abdus Samad
2. The directors have confirmed that none of them is serving as a director on more than seven listed companies.
3. All the resident directors of the Company are registered as taxpayers and none of them has defaulted in payment of any loan to a banking Company, a DFI or an NBFI or, being a member of a stock exchange, has been declared as a defaulter by that stock exchange.
4. No casual vacancy occurred on the Board during the year.
5. The Company has prepared a “Code
of Conduct” and has ensured that appropriate steps have been taken to disseminate it throughout the Company along with its supporting policies and procedures.
6. The board has developed a vision/mission statement, overall corporate strategy and significant policies of the Company. A complete record of particulars of significant policies along with the dates on which they were approved or amended has been maintained.
7. All the powers of the board have been duly exercised and decisions on material transactions, including appointment and determination of remuneration and terms and conditions of employment of the CEO, other executive and non-executive directors, have been taken by the board.
8. The meetings of the board were presided over by the Chairman and the board met at least once in every quarter. Written notices of the board meetings, along with agenda and working papers, were circulated at least seven days before the meetings. The minutes of the meetings were appropriately recorded and circulated.
9. The board arranged in-house one training program for its directors during the year to acquaint them with the Code.
10. No new appointment of CFO, Company Secretary and Head of Internal Audit were made after the revised CCG has taken effect.
11. The directors’ report for this year has been prepared in compliance with the requirements of the CCG and fully describes the salient matters required to be disclosed.
12. The financial statements of the Company were duly endorsed by CEO and CFO before approval of the board.
13. The directors, CEO and executives do not hold any interest in the shares of the Company other than that disclosed in the pattern of shareholding.
14. The Company has complied with all the corporate and financial reporting requirements of the CCG.
15. The board has formed an Audit Committee. It comprises four members, of whom three are non-executive directors and the chairman of the committee is a non-executive director.
16. The meetings of the audit committee were held at least once every quarter prior to approval of interim and
final results of the Company and as required by the CCG. The terms of reference of the committee have been formed and advised to the committee for compliance.
17. The board has formed an HR and Remuneration Committee. It comprises four members, all of whom are non-executive directors and the chairman of the committee is a non-executive director.
18. The board has set up an effective internal audit function which is considered suitably qualified and experienced for the purpose and are conversant with the policies and procedures of the Company.
19. The statutory auditors of the Company have confirmed that they have been given a satisfactory rating under the quality control review program of the ICAP, that they or any of the partners of the firm, their spouses and minor children do not hold shares of the Company and that the firm and all its partners are in compliance with International Federation of Accountants (IFAC) guidelines on code of ethics as adopted by the ICAP.
20. The statutory auditors or the persons associated with them have not been appointed to provide other services except in accordance with the listing regulations and the auditors have confirmed that they have observed IFAC guidelines in this regard.
21. We confirm that all other material principles enshrined in the CCG have been complied with.
Fawad Ahmed Mukhtar
Chief Executive Officer
Date: March 27, 2014 Place: Lahore
Statement of Compliancewith the Code of Corporate Governance
26 Pakarab Fertilizers Limited

27Annual Report
for the year ended December 31, 2013
Financial Statements ofPakarab Fertilizers Limited for the year ended December 31, 2013

28 Pakarab Fertilizers Limited
Review Report to the Members on Statement of Compliance with Best Practices of Code of Corporate Governance
The Board of Director of Pakarab Fertilizers Limited (the
‘Company’) have voluntarily adopted the Code of Corporate
Governance (the ‘Code’) contained in the Listing Regulations
of the Karachi Stock Exchange Limited and prepared a
Statement of Compliance with the best practices contained
therein.
As requested, we have reviewed the Statement of Compliance
with the best practices contained in the Code prepared by the
Board of Directors of the Company.
The responsibility for voluntary compliance with the Code
is that of the Board of Directors of the Company. Our
responsibility is to review, to the extent where such compliance
can be objectively verified, whether the Statement of
Compliance reflects the status of the Company’s compliance
with the provisions of the Code and report if it does not
and to highlight any non-compliance with the requirements
of the Code. A review is limited primarily to inquiries of
the Company’s personnel and review of various documents
prepared by the Company to comply with the Code.
As a part of our audit of the financial statements we are
required to obtain an understanding of the accounting and
internal control systems sufficient to plan the audit and
develop an effective audit approach. We are not required to
consider whether the Board of Directors’ statement on internal
control covers all risks and controls or to form an opinion on
the effectiveness of such internal controls, the Company’s
corporate governance procedures and risks.
The Code requires the Company to place before the Audit
Committee, and upon recommendation of the Audit
Committee, place before the Board of Directors for their
review and approval its related party transactions distinguishing
between transactions carried out on terms equivalent to those
that prevail in arm’s length transactions and transactions which
are not executed at arm’s length price and recording proper
justification for using such alternate pricing mechanism.
We are only required and have ensured compliance of this
requirement to the extent of the approval of the related party
transactions by the Board of Directors upon recommendation
of the Audit Committee. We have not carried out any
procedures to determine whether the related party transactions
were undertaken at arm’s length price or not.
Based on our review, nothing has come to our attention
which causes us to believe that the Statement of Compliance
does not appropriately reflect the Company’s compliance,
in all material respects, with the best practices contained in
the Code as applicable to the Company for the year ended
December 31, 2013.
A.F. Ferguson & Co.Chartered AccountantsLahore: March 27, 2014
Engagement Partner: Muhammad Masood

29Annual Report
for the year ended December 31, 2013
We have audited the annexed balance sheet of Pakarab Fertilizers Limited (‘the company’) as at December 31, 2013 and the related profit and loss account, statement of comprehensive income, statement of changes in equity and cash flow statement together with the notes forming part thereof, for the year then ended and we state that we have obtained all the information and explanations which, to the best of our knowledge and belief, were necessary for the purposes of our audit.
It is the responsibility of the company’s management to establish and maintain a system of internal control, and prepare and present the above said statements in conformity with the approved accounting standards and the requirements of the Companies Ordinance, 1984. Our responsibility is to express an opinion on these statements based on our audit.
We conducted our audit in accordance with the auditing standards as applicable in Pakistan. These standards require that we plan and perform the audit to obtain reasonable assurance about whether the above said statements are free of any material misstatement. An audit includes examining, on a test basis, evidence supporting the amounts and disclosures in the above said statements. An audit also includes assessing the accounting policies and significant estimates made by management, as well as, evaluating the overall presentation of the above said statements. We believe that our audit provides a reasonable basis for our opinion and, after due verification, we report that:
(a) in our opinion, proper books of account have been kept by the company as required by the Companies Ordinance, 1984;
(b) in our opinion:
(i) the balance sheet and profit and loss account together with the notes thereon have been drawn up in conformity with the Companies Ordinance, 1984, and are in agreement with the books of account and are further in accordance with accounting policies consistently applied;
Except for the change as styled in not to the annual Financial Statement with which we concur.
(ii) the expenditure incurred during the year was for the purpose of the company’s business; and
(iii) the business conducted, investments made and the expenditure incurred during the year were in accordance with the objects of the company;
(c) in our opinion and to the best of our information
and according to the explanations given to us the balance sheet, profit and loss account, statement of comprehensive income, statement of changes in equity and cash flow statement together with the notes forming part thereof conform with approved accounting standards as applicable in Pakistan, and, give the information required by the Companies Ordinance, 1984, in the manner so required and respectively give a true and fair view of the state of the company’s affairs as at December 31, 2013 and of the loss, total comprehensive loss, changes in equity and its cash flows for the year then ended; and
(d) in our opinion, Zakat deductible at source under the Zakat and Ushr Ordinance, 1980 (XVIII of 1980), was deducted by the company and deposited in the Central Zakat Fund established under Section 7 of that Ordinance.
A.F. Ferguson & Co.Chartered AccountantsLahore: March 27, 2014
Engagement Partner: Muhammad Masood
Auditors’ Report to the Members

30 Pakarab Fertilizers Limited
Balance Sheetas at December 31, 2013
2013 2012 Note (Rupees in thousand)
EQUITY AND LIABILITIES SHARE CAPITAL AND RESERVES
Authorised share capital 1,000,000,000 (2012: 1,000,000,000) ordinary shares of Rs 10 each 10,000,000 10,000,000 Issued, subscribed and paid up share capital 450,000,000 (2012: 450,000,000) ordinary shares of Rs 10 each 5 4,500,000 4,500,000 Reserves 6 1,699,858 3,432,253
6,199,858 7,932,253 SURPLUS ON REVALUATION OF OPERATING FIXED ASSETS 7 11,884,336 11,964,238 NON-CURRENT LIABILITIES
Long term finances - secured 8 1,466,071 4,559,279 Import bill payable - secured 9 1,100,000 1,488,400 Liabilities against assets subject to finance lease 10 - 49,678 Long term deposits 11 47,145 46,180 Deferred liabilities 12 126,472 114,840 Deferred taxation 13 9,932,611 10,922,741
12,672,299 17,181,118 CURRENT LIABILITIES Current portion of long term liabilities 14 3,132,017 4,877,123 Short term loan from related party - secured 15 3,000,000 - Short term borrowings - secured 16 4,736,195 5,814,085 Payable to Privatization Commission of Pakistan 17 2,197,901 2,197,901 Derivative financial instruments 18 - 714 Trade and other payables 19 3,988,621 3,224,946 Accrued finance cost 20 336,585 365,673 Dividend payable - 1,078,200
17,391,319 17,558,642 CONTINGENCIES AND COMMITMENTS 21
48,147,812 54,636,251 The annexed notes 1 to 49 form an integral part of these financial statements.
Chief Executive

31Annual Report
for the year ended December 31, 2013
2013 2012 Note (Rupees in thousand)
ASSETS NON-CURRENT ASSETS Property, plant and equipment 22 37,113,856 37,290,256 Assets subject to finance lease 23 50,631 121,126 Intangible assets 24 144,407 149,073 Goodwill 25 3,305,163 3,305,163 Long term investments 26 294,550 261,910 Security deposits 36,218 60,409
40,944,825 41,187,937 CURRENT ASSETS Stores and spare parts 27 2,904,350 3,023,106 Stock-in-trade 28 811,659 1,733,871 Trade debts 29 153,163 570,992 Advances, deposits, prepayments and other receivables 30 3,173,980 6,042,228 Short term investments 31 - 1,084,160 Cash and bank balances 32 159,835 993,957
7,202,987 13,448,314
48,147,812 54,636,251
Director

32 Pakarab Fertilizers Limited
Profit and Loss Accountfor the year ended December 31, 2013
2013 2012 Note (Rupees in thousand)
Sales 33 7,428,247 8,136,158 Cost of sales 34 (7,142,667) (6,221,309)
Gross profit 285,580 1,914,849 Administrative expenses 35 (887,527) (1,164,607)Selling and distribution expenses 36 (495,405) (299,050)
(1,097,352) 451,192 Finance cost 37 (1,579,439) (2,610,043)Other expenses 38 (381,668) (218,131)
(3,058,459) (2,376,982) Other income 39 260,581 1,528,566 Loss on remeasurement of financial assets at fair value through profit or loss - (47,120)
Loss before taxation (2,797,878) (895,536)
Taxation 40 972,795 655,748
Loss for the year (1,825,083) (239,788)
The annexed notes 1 to 49 form an integral part of these financial statements.
Chief Executive Director

33Annual Report
for the year ended December 31, 2013
Statement of Comprehensive Incomefor the year ended December 31, 2013
2013 2012 (Rupees in thousand)
Loss for the year (1,825,083) (239,788) Other comprehensive income: Items that may be reclassified subsequently to profit or loss: Surplus on remeasurement of fair value of available-for-sale investment 27,504 - Deferred tax charge relating to remeasurement of available-for-sale investment to fair value (7,220) -
20,284 - Items that will not be reclassified subsequently to profit or loss: Surplus on revaluation of operating fixed assets realised through incremental depreciation charged on related assets for the year 79,902 163,901
Remeasurement of post retirement benefit obligation (7,498) -
72,404 163,901 Other comprehensive income - net of tax 92,688 163,901 Total comprehensive loss for the year - net of tax (1,732,395) (75,887)
The annexed notes 1 to 49 form an integral part of these financial statements.
Chief Executive Director

34 Pakarab Fertilizers Limited
Statement of Changes in Equityfor the year ended December 31, 2013
Chief Executive Director
(Rupees in thousand)
Capital reserve Revenue reserves
Share Share deposit Fair value General Unappropriated capital money reserve reserve profit / Total (accumulated loss) Balance as on January 1, 2012 4,500,000 200,000 - 2,098,313 3,615,727 10,414,040
Loss for the year - - - - (239,788) (239,788)
Other comprehensive income for the year - net of tax - - - - 163,901 163,901 Total comprehensive loss for the year - - - - (75,887) (75,887)
Share deposit money refunded - (200,000) - - - (200,000)
Specie dividend to equity holders of the company - - - - (2,205,900) (2,205,900) Total contributions by and distributions to owners of the company recognised directly in equity - (200,000) - - (2,205,900) (2,405,900)
Balance as on December 31, 2012 4,500,000 - - 2,098,313 1,333,940 7,932,253
Loss for the year - - - - (1,825,083) (1,825,083)
Other comprehensive income for the year - net of tax - - 20,284 - 72,404 92,688 Total comprehensive income/(loss) for the year - - 20,284 - (1,752,679) (1,732,395)
Balance as on December 31, 2013 4,500,000 - 20,284 2,098,313 (418,739) 6,199,858
The annexed notes 1 to 49 form an integral part of these financial statements.
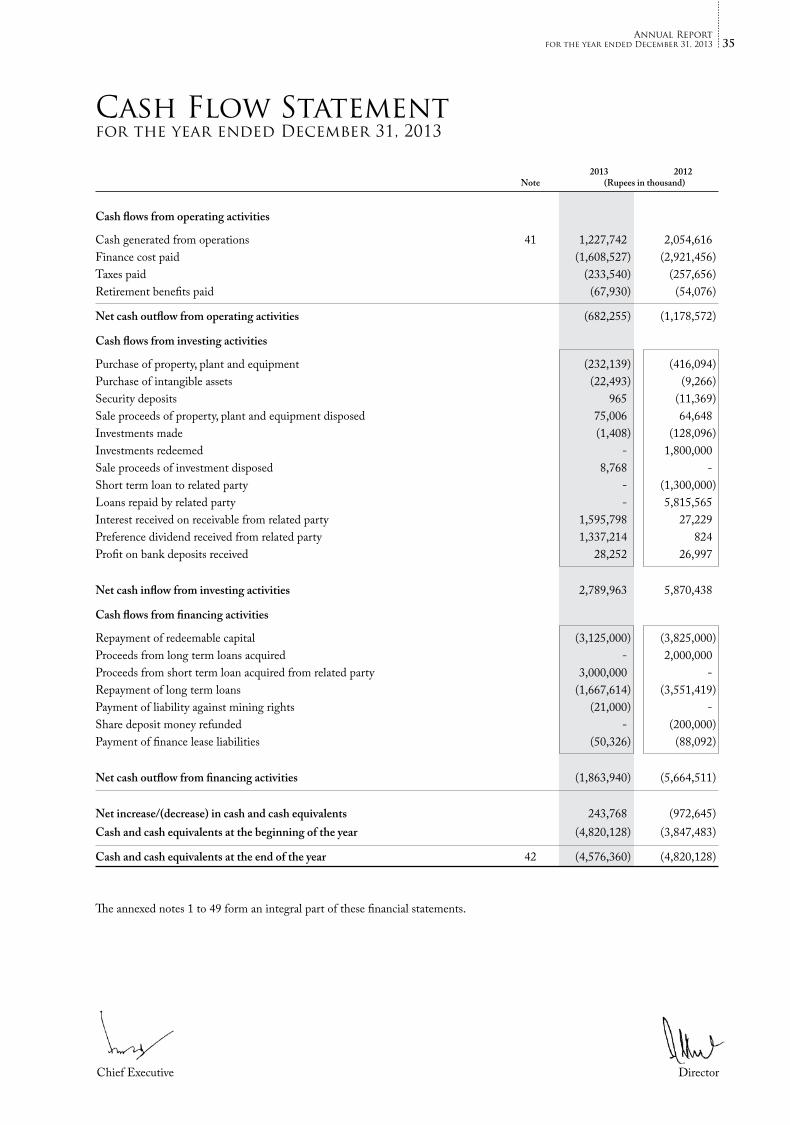
35Annual Report
for the year ended December 31, 2013
2013 2012 Note (Rupees in thousand)
Cash flows from operating activities
Cash generated from operations 41 1,227,742 2,054,616 Finance cost paid (1,608,527) (2,921,456)Taxes paid (233,540) (257,656)Retirement benefits paid (67,930) (54,076)
Net cash outflow from operating activities (682,255) (1,178,572)
Cash flows from investing activities
Purchase of property, plant and equipment (232,139) (416,094)Purchase of intangible assets (22,493) (9,266)Security deposits 965 (11,369)Sale proceeds of property, plant and equipment disposed 75,006 64,648 Investments made (1,408) (128,096)Investments redeemed - 1,800,000 Sale proceeds of investment disposed 8,768 - Short term loan to related party - (1,300,000)Loans repaid by related party - 5,815,565 Interest received on receivable from related party 1,595,798 27,229 Preference dividend received from related party 1,337,214 824 Profit on bank deposits received 28,252 26,997 Net cash inflow from investing activities 2,789,963 5,870,438
Cash flows from financing activities
Repayment of redeemable capital (3,125,000) (3,825,000)Proceeds from long term loans acquired - 2,000,000 Proceeds from short term loan acquired from related party 3,000,000 - Repayment of long term loans (1,667,614) (3,551,419)Payment of liability against mining rights (21,000) - Share deposit money refunded - (200,000)Payment of finance lease liabilities (50,326) (88,092) Net cash outflow from financing activities (1,863,940) (5,664,511) Net increase/(decrease) in cash and cash equivalents 243,768 (972,645)Cash and cash equivalents at the beginning of the year (4,820,128) (3,847,483)
Cash and cash equivalents at the end of the year 42 (4,576,360) (4,820,128)
The annexed notes 1 to 49 form an integral part of these financial statements.
Cash Flow Statementfor the year ended December 31, 2013
Chief Executive Director

36 Pakarab Fertilizers Limited
Notes to and forming part of the Financial Statementsfor the year ended December 31, 2013
1. The company and its activities
Pakarab Fertilizers Limited (‘company’) was incorporated as a private limited company in Pakistan under the Companies Act, 1913, (now Companies Ordinance, 1984). The company’s status changed to a non-listed public company from June 7, 2007. The company’s Term Finance Certificates were listed at the Karachi Stock Exchange Limited (KSE) during the period from March 2008 to March 2013. As of December 31, 2013, the company is a non-listed public company. It is principally engaged in the manufacturing and sale of chemical fertilizers and generation and sale of Certified Emission Reductions (CERs). The address of the registered office of the company is E-110, Khayaban-e-Jinnah, Lahore Cantt while its manufacturing facility is located in Multan.
These financial statements are the separate financial statements of the company. Consolidated financial statements are
prepared separately. 2. Basis of preparation
2.1 These financial statements have been prepared in accordance with approved accounting standards as applicable in Pakistan. Approved accounting standards comprise of such International Financial Reporting Standards (IFRS) issued by the International Accounting Standards Board and Islamic Financial Accounting Standards (IFAS) issued by Institute of Chartered Accountants of Pakistan as are notified under the Companies Ordinance, 1984, provisions of and directives issued under the Companies Ordinance, 1984. Wherever the requirements of the Companies Ordinance, 1984 or directives issued by Securities and Exchange Commission of Pakistan differ with the requirements of IFRS or IFAS, the requirements of the Companies Ordinance, 1984 or the requirements of the said directives prevail.
2.2 Initial application of standards, amendments or an interpretation to existing standards
The following amendments to existing standards have been published that are applicable to the company’s financial statements covering annual periods, beginning on or after the following dates:
2.2.1 Standards, amendments and interpretations to approved accounting standards that are effective in current year
Certain standards, amendments and interpretations to approved accounting standards are effective for accounting periods beginning on January 1, 2013 but are considered not to be relevant or to have any significant effect on the company’s operations and are, therefore, not detailed in these financial statements except for the amendments as given below which have been fully explained in note 4.1 to these financial statements:
- Amendments to IAS 1, ‘Financial statement presentation’ regarding other comprehensive income, emphasizes
on the requirement for entities to group items presented in other comprehensive income (OCI) on the basis of whether they are potentially reclassifiable to profit or loss subsequently (reclassification adjustments). The application of the amendment has not affected the results or net assets of the company as it is only concerned with presentation and disclosures.
- IAS 19 (revised) ‘Employee Benefits’ has eliminated the corridor approach and requires to calculate finance
cost on net funding bases. The company has applied this change in accounting policy in accordance with IAS 8 ‘Accounting Policies, Changes in Accounting Estimates and Errors’ and recorded unrecognised actuarial losses net of taxes associated with retirement benefit plan.
2.2.2 Standards, amendments and interpretations to existing standards that are not yet effective and have not been early
adopted by the company
There are certain standards, amendments to the approved accounting standards and interpretations that are mandatory for the companies having accounting periods beginning on or after January 1, 2014 but are considered not to be relevant or to have any significant effect on the company’s operations and are, therefore, not detailed in these financial statements.
3. Basis of measurement
3.1 These financial statements have been prepared under the historical cost convention as modified by the revaluation of operating fixed assets and certain financial instruments at fair value and recognition of certain employee retirement benefits at present value.

37Annual Report
for the year ended December 31, 2013
3.2 Critical accounting estimates and judgments
The company’s significant accounting policies are stated in note 4. Not all of these significant policies require the management to make difficult, subjective or complex judgment or estimates. The following is intended to provide an understanding of the policies the management considers critical because of their complexity, judgment of estimation involved in their application and their impact on these financial statements. Estimates and judgments are continually evaluated and are based on historical experience, including expectations of future events that are believed to be reasonable under the circumstances. These judgments involve assumptions or estimates in respect of future events and the actual results may differ from these estimates.
a) Employee retirement benefits
The company uses the valuation performed by an independent actuary as the present value of its retirement benefit obligations. The valuation is based on assumptions as mentioned in note 4.3.
b) Provision for taxation
The company takes into account the current income tax law and the decisions taken by appellate authorities. Instances where the company’s view differs from the view taken by the income tax department at the assessment stage and where the company considers that its views on items of material nature is in accordance with law, the amounts are shown as contingent liabilities.
c) Useful lives and residual values of property, plant and equipment
The company reviews the useful lives and residual values of property, plant and equipment on regular basis. Any change in estimates in future years might affect the carrying amounts of the respective items of property, plant and equipment with a corresponding effect on the depreciation charge and impairment.
d) Estimated impairment of goodwill
The company tests annually whether goodwill has suffered any impairment, in accordance with the accounting policy stated in note 4.8. The recoverable amounts of cash-generating units have been determined based on value-in-use calculations. These calculations require the use of estimates (note 25).
e) Revaluation surplus on operating fixed assets
Certain operating fixed assets are carried under the revaluation model as per International Accounting Standard (‘IAS’) 16 ‘Property, Plant and Equipment’ as stated in note 4.4.1. Revaluation is carried out with sufficient regularity to ensure that the carrying amount of assets does not differ materially from their fair value. Revalued amount has been determined by an independent professional valuer on the basis of present market value (note 7).
f ) Fair value of investment in subsidiary
The fair value of investment in subsidiary is determined by using valuation techniques. The company uses its judgment to select a variety of methods and make assumptions that are mainly based on market conditions existing at the end of each reporting period. The company has used discounted cash flow analysis for this purpose (note 26.1).
3.3 Change in accounting estimate
During the year, the company’s management has carried out a comprehensive review of the expected pattern of consumption of the future economic benefits embodied in certain assets and as a result of this review, has revised its depreciation method for such assets. Previously, the company depreciated its plant and machinery, factory equipment (included in tools and other equipment) and catalysts on the straight line method over their estimated useful lives. Now the company charges depreciation on these assets based on the units of production method over their estimated remaining useful lives. Such a change has been accounted for as a change in an accounting estimate in accordance with IAS 8 ‘Accounting Policies, Changes in Accounting Estimates and Errors’. Had there been no change in the accounting estimate, the loss before tax for the year ended December 31, 2013 would have been higher by Rs 656.331 million and carrying value of operating fixed assets as at that date would have been lower by the same amount. Consequently, due to the above change in accounting estimate, future profits before tax would reduce by Rs 656.331 million.

38 Pakarab Fertilizers Limited
4. Significant accounting policies
The significant accounting policies adopted in the preparation of these financial statements are set out below. These policies have been consistently applied to all years presented, except for the change in accounting policy as explained in note 4.1.
4.1 Changes in accounting policies and disclosures
4.1.1 Amendment to IAS 1 ‘Presentation of Financial Statements’
The primary change resulting from this amendment is that the company has grouped items presented in ‘other comprehensive income’ on the basis of whether they are potentially reclassifiable to profit or loss subsequently (reclassification adjustments). Had there been no change in the aforementioned accounting, there would not have been any bifurcation of items appearing in the ‘other comprehensive income’.
4.1.2 Amendments in IAS 19, (Revised) ‘Employee Benefits’
IAS 19 (Revised) ‘Employee Benefits’ amends the accounting for the company’s defined benefit plan. The revised standard has been applied retrospectively in accordance with the transition provisions of the standard, however, comparative figures have not been restated as company’s management considers that the net impact of the adoption for periods upto December 31, 2012 is immaterial in the context of these financial statement. Consequently, the net impact has been accounted for in the current year ended December 31, 2013 as follow:
Rupees in thousand Income recognized in profit and loss account 676 Loss recognized in other comprehensive income (3,111)
Decrease/(increase) in total comprehensive loss for the year (2,435)
4.2 Taxation
Current
Provision of current tax is based on the taxable income for the year determined in accordance with the prevailing law for taxation of income. The charge for current tax is calculated using prevailing tax rates or tax rates expected to apply to the profit for the year if enacted. The charge for current tax also includes adjustments, where considered necessary, to provision for tax made in previous years arising from assessments framed during the year for such years.
Deferred
Deferred tax is accounted for using the balance sheet liability method in respect of all temporary differences arising from differences between the carrying amount of assets and liabilities in the financial statements and the corresponding tax bases used in the computation of the taxable profit. However, the deferred tax is not accounted for if it arises from initial recognition of an asset or liability in a transaction other than a business combination that at the time of transaction neither affects accounting nor taxable profit or loss. Deferred tax liabilities are generally recognized for all taxable temporary differences and deferred tax assets are recognized to the extent that it is probable that taxable profits will be available against which the deductible temporary differences, unused tax losses and tax credits can be utilised.
Deferred tax liabilities are provided on taxable temporary differences arising from investments in subsidiaries, except
for deferred tax liability where the timing of the reversal of the temporary difference is controlled by the company and it is probable that the temporary difference will not reverse in the foreseeable future. Deferred tax assets are recognised on deductible temporary differences arising from investments in subsidiaries only to the extent that it is probable the temporary difference will reverse in the future and there is sufficient taxable profit available against which the temporary difference can be utilised.
Deferred tax is calculated at the rates that are expected to apply to the period when the differences reverse based
on tax rates that have been enacted or substantively enacted by the balance sheet date. Deferred tax is charged or credited in the profit and loss account, except in the case of items credited or charged to other comprehensive income or equity in which case it is included in other comprehensive income or equity.
Notes to and forming part of the Financial Statementsfor the year ended December 31, 2013
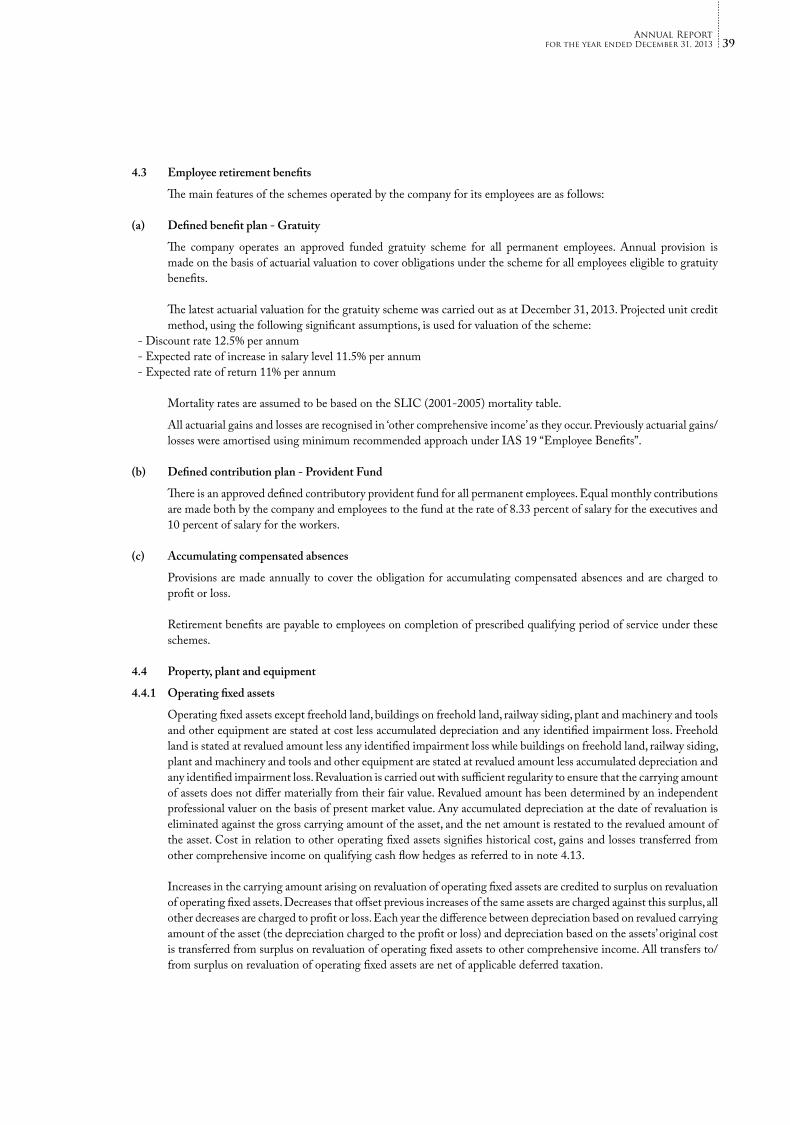
39Annual Report
for the year ended December 31, 2013
4.3 Employee retirement benefits
The main features of the schemes operated by the company for its employees are as follows: (a) Defined benefit plan - Gratuity
The company operates an approved funded gratuity scheme for all permanent employees. Annual provision is made on the basis of actuarial valuation to cover obligations under the scheme for all employees eligible to gratuity benefits.
The latest actuarial valuation for the gratuity scheme was carried out as at December 31, 2013. Projected unit credit
method, using the following significant assumptions, is used for valuation of the scheme: - Discount rate 12.5% per annum - Expected rate of increase in salary level 11.5% per annum - Expected rate of return 11% per annum Mortality rates are assumed to be based on the SLIC (2001-2005) mortality table.
All actuarial gains and losses are recognised in ‘other comprehensive income’ as they occur. Previously actuarial gains/losses were amortised using minimum recommended approach under IAS 19 “Employee Benefits”.
(b) Defined contribution plan - Provident Fund
There is an approved defined contributory provident fund for all permanent employees. Equal monthly contributions are made both by the company and employees to the fund at the rate of 8.33 percent of salary for the executives and 10 percent of salary for the workers.
(c) Accumulating compensated absences
Provisions are made annually to cover the obligation for accumulating compensated absences and are charged to profit or loss.
Retirement benefits are payable to employees on completion of prescribed qualifying period of service under these
schemes. 4.4 Property, plant and equipment
4.4.1 Operating fixed assets
Operating fixed assets except freehold land, buildings on freehold land, railway siding, plant and machinery and tools and other equipment are stated at cost less accumulated depreciation and any identified impairment loss. Freehold land is stated at revalued amount less any identified impairment loss while buildings on freehold land, railway siding, plant and machinery and tools and other equipment are stated at revalued amount less accumulated depreciation and any identified impairment loss. Revaluation is carried out with sufficient regularity to ensure that the carrying amount of assets does not differ materially from their fair value. Revalued amount has been determined by an independent professional valuer on the basis of present market value. Any accumulated depreciation at the date of revaluation is eliminated against the gross carrying amount of the asset, and the net amount is restated to the revalued amount of the asset. Cost in relation to other operating fixed assets signifies historical cost, gains and losses transferred from other comprehensive income on qualifying cash flow hedges as referred to in note 4.13.
Increases in the carrying amount arising on revaluation of operating fixed assets are credited to surplus on revaluation
of operating fixed assets. Decreases that offset previous increases of the same assets are charged against this surplus, all other decreases are charged to profit or loss. Each year the difference between depreciation based on revalued carrying amount of the asset (the depreciation charged to the profit or loss) and depreciation based on the assets’ original cost is transferred from surplus on revaluation of operating fixed assets to other comprehensive income. All transfers to/from surplus on revaluation of operating fixed assets are net of applicable deferred taxation.
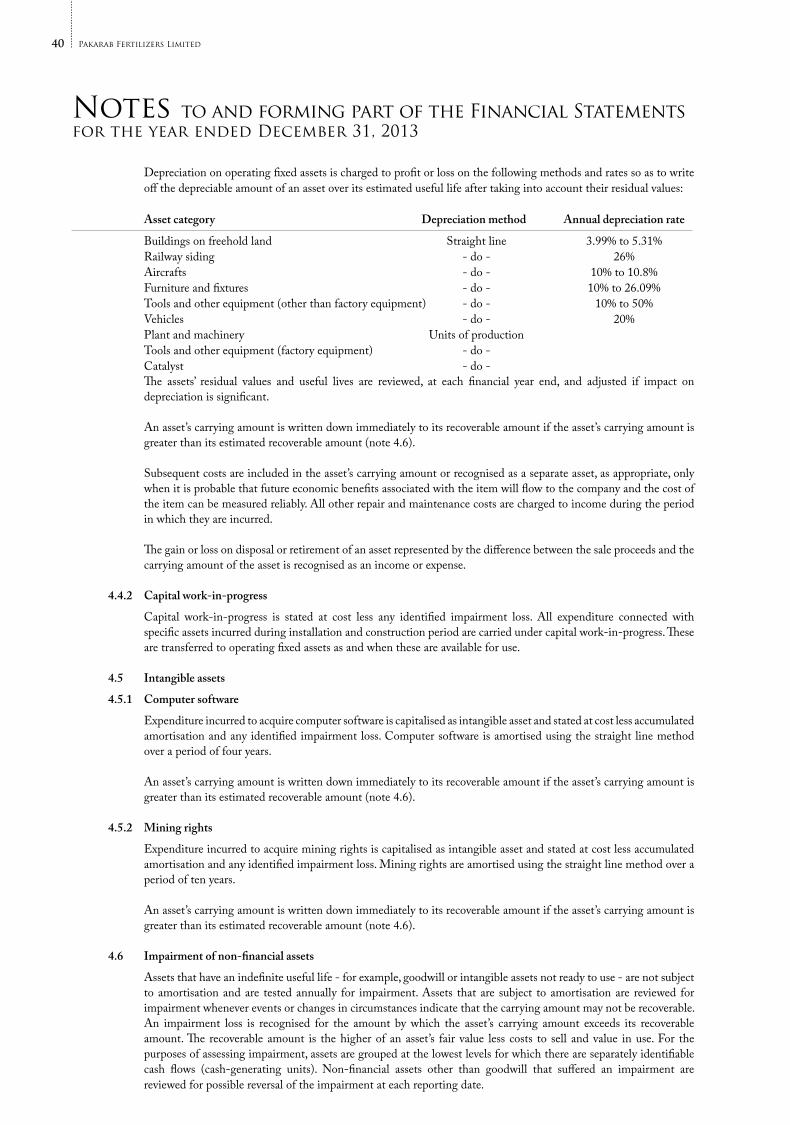
40 Pakarab Fertilizers Limited
Depreciation on operating fixed assets is charged to profit or loss on the following methods and rates so as to write off the depreciable amount of an asset over its estimated useful life after taking into account their residual values:
Asset category Depreciation method Annual depreciation rate
Buildings on freehold land Straight line 3.99% to 5.31% Railway siding - do - 26% Aircrafts - do - 10% to 10.8% Furniture and fixtures - do - 10% to 26.09% Tools and other equipment (other than factory equipment) - do - 10% to 50% Vehicles - do - 20% Plant and machinery Units of production Tools and other equipment (factory equipment) - do - Catalyst - do - The assets’ residual values and useful lives are reviewed, at each financial year end, and adjusted if impact on
depreciation is significant. An asset’s carrying amount is written down immediately to its recoverable amount if the asset’s carrying amount is
greater than its estimated recoverable amount (note 4.6). Subsequent costs are included in the asset’s carrying amount or recognised as a separate asset, as appropriate, only
when it is probable that future economic benefits associated with the item will flow to the company and the cost of the item can be measured reliably. All other repair and maintenance costs are charged to income during the period in which they are incurred.
The gain or loss on disposal or retirement of an asset represented by the difference between the sale proceeds and the
carrying amount of the asset is recognised as an income or expense. 4.4.2 Capital work-in-progress
Capital work-in-progress is stated at cost less any identified impairment loss. All expenditure connected with specific assets incurred during installation and construction period are carried under capital work-in-progress. These are transferred to operating fixed assets as and when these are available for use.
4.5 Intangible assets
4.5.1 Computer software
Expenditure incurred to acquire computer software is capitalised as intangible asset and stated at cost less accumulated amortisation and any identified impairment loss. Computer software is amortised using the straight line method over a period of four years.
An asset’s carrying amount is written down immediately to its recoverable amount if the asset’s carrying amount is
greater than its estimated recoverable amount (note 4.6). 4.5.2 Mining rights
Expenditure incurred to acquire mining rights is capitalised as intangible asset and stated at cost less accumulated amortisation and any identified impairment loss. Mining rights are amortised using the straight line method over a period of ten years.
An asset’s carrying amount is written down immediately to its recoverable amount if the asset’s carrying amount is
greater than its estimated recoverable amount (note 4.6). 4.6 Impairment of non-financial assets
Assets that have an indefinite useful life - for example, goodwill or intangible assets not ready to use - are not subject to amortisation and are tested annually for impairment. Assets that are subject to amortisation are reviewed for impairment whenever events or changes in circumstances indicate that the carrying amount may not be recoverable. An impairment loss is recognised for the amount by which the asset’s carrying amount exceeds its recoverable amount. The recoverable amount is the higher of an asset’s fair value less costs to sell and value in use. For the purposes of assessing impairment, assets are grouped at the lowest levels for which there are separately identifiable cash flows (cash-generating units). Non-financial assets other than goodwill that suffered an impairment are reviewed for possible reversal of the impairment at each reporting date.
Notes to and forming part of the Financial Statementsfor the year ended December 31, 2013

41Annual Report
for the year ended December 31, 2013
4.7 Leases
The company is the lessee. 4.7.1 Finance leases
Leases where the company has substantially all the risks and rewards of ownership are classified as finance leases. At inception finance leases are capitalised at the lower of present value of minimum lease payments under the lease agreements and the fair value of the assets.
The related rental obligations, net of finance charges, are included in liabilities against assets subject to finance lease as referred to in note 10. The liabilities are classified as current and long term depending upon the timing of the payment.
Each lease payment is allocated between the liability and finance charges so as to achieve a constant rate on the balance outstanding. The interest element of the rental is charged to profit or loss over the lease term.
Assets acquired under a finance lease are depreciated over the useful life of the asset on a straight-line method at the
rates given in note 23. Depreciation of leased assets is charged to profit or loss. 4.7.2 Operating leases
Leases where a significant portion of the risks and rewards of ownership are retained by the lessor are classified as operating leases. Payments made under operating leases (net of any incentives received from the lessor) are charged to profit or loss on a straight-line basis over the lease term.
4.8 Goodwill
Goodwill represents the excess of the cost of acquisition over the fair value of the identifiable assets and liabilities of the company, by Reliance Exports (Private) Limited at the date of acquisition i.e. July 14, 2005.
Goodwill is tested annually for impairment and carried at its carrying value as at June 30, 2007 less any identified
impairment losses. Impairment losses on goodwill are not reversed. 4.9 Investments
Investments intended to be held for less than twelve months from the balance sheet date or to be sold to raise operating capital, are included in current assets, all other investments are classified as non-current. Management determines the appropriate classification of its investments at the time of the purchase and re-evaluates such designation on a regular basis.
4.9.1 Investment in equity instruments of subsidiary
Investments in equity instruments of subsidiary are designated upon initial recognition as ‘financial assets at fair value through profit or loss’ or ‘available-for-sale financial assets’. In case of financial assets at fair value through profit or loss, these are initially recognized at fair value while in case of available-for-sale financial assets, these are initially recognized at fair value and associated directly attributable acquisition costs. Subsequently, these are measured at fair value unless in case of available-for-sale financial assets whose fair value cannot be measured reliably, these are carried at cost. For investments having quoted price in active market, the quoted price represents the fair value. In other cases, fair value is measured using appropriate valuation methodology.
Gains and losses on subsequent re-measurements of financial assets at fair value through profit or loss are included
in the profit and loss while those on re-measurement of available-for-sale financial assets are included in other comprehensive income. When investments classified as available-for-sale are sold or impaired, the accumulated fair value adjustments recognized in equity are included in the profit and loss.
The company is required to issue consolidated financial statements along with its separate financial statements in accordance with the requirements of IAS 27 ‘Consolidated and Separate Financial Statements’.
At each balance sheet date, the company reviews the carrying amounts of the investments in subsidiaries to assess
whether there is any indication that such investments have suffered an impairment loss. If any such indication exists, the recoverable amount is estimated in order to determine the extent of the impairment loss, if any. In making an estimate of recoverable amount of these investments, the management considers future dividend stream and an estimate of the terminal value of these investments. Impairment losses are recognised as expense in the profit and loss account.

42 Pakarab Fertilizers Limited
Investments in subsidiaries, that suffered an impairment, are reviewed for possible reversal of impairment at each reporting date. Impairment losses recognised in the profit and loss account on investments in subsidiaries and associates are reversed through the profit and loss account.
4.10 Financial assets
4.10.1 Classification
The company classifies its financial assets in the following categories: at fair value through profit or loss, loans and receivables, available for sale and held to maturity. The classification depends on the purpose for which the financial assets were acquired. Management determines the classification of its financial assets at the time of initial recognition.
a) Financial assets at fair value through profit or loss
Financial assets at fair value through profit or loss are financial assets held for trading and financial assets designated upon initial recognition as at fair value through profit or loss. Derivatives are also categorised as held for trading unless they are designated as hedges. A financial asset is classified as held for trading if acquired principally for the purpose of selling in the short term. Assets in this category are classified as current assets if expected to be settled within twelve months, otherwise, they are classified as non-current.
b) Loans and receivables
Loans and receivables are non-derivative financial assets with fixed or determinable payments that are not quoted in an active market. They are included in current assets, except for maturities greater than twelve months after the balance sheet date, which are classified as non-current assets. Loans and receivables comprise loans, advances, deposits and other receivables and cash and cash equivalents in the balance sheet.
c) Available-for-sale financial assets
Available-for-sale financial assets are non-derivatives that are either designated in this category or not classified in any of the other categories. They are included in non-current assets unless management intends to dispose of the investments within twelve months from the balance sheet date.
d) Held to maturity
Financial assets with fixed or determinable payments and fixed maturity, where management has the intention and ability to hold till maturity are classified as held to maturity and are stated at amortised cost.
4.10.2 Recognition and measurement
All financial assets are recognised at the time when the company becomes a party to the contractual provisions of the instrument. Regular purchases and sales of investments are recognised on trade-date – the date on which the company commits to purchase or sell the asset. Financial assets are initially recognised at fair value plus transaction costs for all financial assets not carried at fair value through profit or loss. Financial assets carried at fair value through profit or loss are initially recognised at fair value and transaction costs are expensed in the profit and loss account. Financial assets are derecognised when the rights to receive cash flows from the assets have expired or have been transferred and the company has transferred substantially all the risks and rewards of ownership. Available-for-sale financial assets and financial assets at fair value through profit or loss are subsequently carried at fair value. Available-for-sale financial assets are carried at cost in case fair value cannot be measured reliably. Loans and receivables and held-to-maturity investments are carried at amortised cost using the effective interest rate method.
Gains or losses arising from changes in the fair value of the ‘financial assets at fair value through profit or loss’
category are presented in the profit and loss account in the period in which they arise. Dividend income from financial assets at fair value through profit or loss is recognised in the profit and loss account as part of other income when the company’s right to receive payments is established.
Changes in the fair value of securities classified as available-for-sale are recognised in other comprehensive income.
When securities classified as available-for-sale are sold or impaired, the accumulated fair value adjustments recognised in equity are included in the profit and loss account as gains and losses from investment securities.
Notes to and forming part of the Financial Statementsfor the year ended December 31, 2013

43Annual Report
for the year ended December 31, 2013
Interest on available-for-sale securities calculated using the effective interest method is recognised in the profit and loss account. Dividends on available-for-sale equity instruments are recognised in the profit and loss account when the company’s right to receive payments is established.
The fair values of quoted investments are based on current prices. If the market for a financial asset is not active (and for
unlisted securities), the company measures the investments at cost less impairment in value, if any. The company assesses at each balance sheet date whether there is objective evidence that a financial asset or a group
of financial assets is impaired. If any such evidence exists for available-for-sale financial assets, the cumulative loss is removed from equity and recognised in the profit and loss account. Impairment losses recognised in the profit and loss account on equity instruments are not reversed through the profit and loss account. Impairment testing of trade debts and other receivables is described in note 4.16.
4.11 Financial liabilities
All financial liabilities are recognised at the time when the company becomes a party to the contractual provisions of the instrument.
A financial liability is derecognised when the obligation under the liability is discharged or cancelled or expired.
Where an existing financial liability is replaced by another from the same lender on substantially different terms, or the terms of an existing liability are substantially modified, such an exchange or modification is treated as a derecognition of the original liability and the recognition of a new liability, and the difference in respective carrying amounts is recognised in the profit and loss account.
4.12 Offsetting of financial assets and financial liabilities
Financial assets and financial liabilities are offset and the net amount is reported in the financial statements only when there is a legally enforceable right to set off the recognized amount and the company intends either to settle on a net basis or to realize the assets and to settle the liabilities simultaneously.
4.13 Derivative financial instruments
These are initially recorded at cost on the date a derivative contract is entered into and are remeasured to fair value at subsequent reporting dates. The method of recognizing the resulting gain or loss depends on whether the derivative is designated as a hedging instrument, and if so, the nature of the item being hedged. The company designates certain derivatives as cash flow hedges.
The company documents at the inception of the transaction the relationship between the hedging instruments and
hedged items, as well as its risk management objective and strategy for undertaking various hedge transactions. The company also documents its assessment, both at hedge inception and on an ongoing basis, of whether the derivatives that are used in hedging transactions are highly effective in offsetting changes in cash flow of hedged items.
The effective portion of changes in the fair value of derivatives that are designated and qualify as cash flow hedges
is recognized in other comprehensive income. The gain or loss relating to the ineffective portion is recognized immediately in the profit and loss account.
Amounts accumulated in other comprehensive income are recognised in profit and loss account in the periods when
the hedged item will affect profit or loss. However, when the forecast hedged transaction results in the recognition of a non-financial asset or a liability, the gains and losses previously deferred in other comprehensive income are transferred from other comprehensive income and included in the initial measurement of the cost of the asset or liability. The changes in fair value re-measurement of derivatives which the company has not designated as a hedging instrument are recognised in the profit and loss account. Trading derivatives are classified as a current asset or liability.

44 Pakarab Fertilizers Limited
4.14 Stores and spare parts
These are valued at weighted average cost except for items in transit which are stated at invoice value plus other charges paid thereon till the balance sheet date. For items which are slow moving and/or identified as obsolete, adequate provision is made for any excess book value over estimated realisable value. The company reviews the carrying amount of stores and spares on a regular basis and provision is made for obsolescence.
4.15 Stock-in-trade
All stocks are valued at the lower of cost and net realizable value. Cost in relation to raw and packing materials, except for those in transit, signifies weighted average cost and that relating to mid products and finished goods, annual average cost comprising cost of direct materials, labour and appropriate manufacturing overheads.
Materials in transit are stated at cost comprising invoice value plus other charges incurred thereon. Net realizable value signifies the estimated selling price in the ordinary course of business less costs necessarily to
be incurred in order to make the sale. Provision is made in the financial statements for obsolete and slow moving stock-in-trade based on management estimate.
4.16 Trade debts and other receivables
Trade debts and other receivables are recognised initially at invoice value, which approximates fair value, and subsequently measured at amortised cost using the effective interest method, less provision for doubtful debts. A provision for doubtful debts is established when there is objective evidence that the company will not be able to collect all the amount due according to the original terms of the receivable. Significant financial difficulties of the debtors, probability that the debtor will enter bankruptcy or financial reorganisation, and default or delinquency in payments are considered indicators that the trade debt is impaired. The provision is recognised in the profit and loss account. When a trade debt is uncollectible, it is written off against the provision. Subsequent recoveries of amounts previously written off are credited to the profit and loss account.
4.17 Cash and cash equivalents
Cash and cash equivalents includes cash in hand, deposits held at call with banks, other short-term highly liquid investments with original maturities of three months or less, and bank overdrafts/short term borrowings. Bank overdrafts are shown within short term borrowings in current liabilities on the balance sheet.
4.18 Borrowings
Borrowings are recognised initially at fair value, net of transaction costs incurred. Borrowings are subsequently stated at amortised cost, any difference between the proceeds (net of transaction costs) and the redemption value is recognised in the profit and loss account over the period of the borrowings using the effective interest method. Finance costs are accounted for on an accrual basis and are reported under accrued finance costs to the extent of the amount remaining unpaid.
Borrowings are classified as current liabilities unless the company has an unconditional right to defer settlement of
the liability for at least twelve months after the balance sheet date. 4.19 Trade and other payables
Trade and other payables are recognised initially at fair value and subsequently measured at amortised cost using the effective interest method. Exchange gains and losses arising on translation in respect of liabilities in foreign currency are added to the carrying amount of the respective liabilities.
4.20 Provisions
Provisions are recognized when the company has a present legal or constructive obligation as a result of past events, it is probable that an outflow of resources embodying economic benefits will be required to settle the obligation and a reliable estimate of the amount can be made. Provisions are reviewed at each balance sheet date and adjusted to reflect the current best estimate.
Notes to and forming part of the Financial Statementsfor the year ended December 31, 2013

45Annual Report
for the year ended December 31, 2013
4.21 Foreign currency transactions and translation
a) Functional and presentation currency
Items included in the financial statements of the company are measured using the currency of the primary economic environment in which the company operates (the functional currency). The financial statements are presented in Pak Rupees, which is the company’s functional and presentation currency.
b) Transactions and balances
Foreign currency transactions are translated into Pak Rupees using the exchange rates prevailing at the dates of the transactions. Foreign exchange gains and losses resulting from the settlement of such transactions and from the translation at year-end exchange rates of monetary assets and liabilities denominated in foreign currencies are recognized in the profit and loss account.
4.22 Borrowing costs
General and specific borrowing costs directly attributable to the acquisition, construction or production of qualifying assets, which are assets that necessarily take a substantial period of time to get ready for their intended use or sale, are added to the cost of those assets, until such time as the assets are substantially ready for their intended use or sale. Investment income earned on the temporary investment of specific borrowings pending their expenditure on qualifying assets is deducted from the borrowing costs eligible for capitalisation. All other borrowing costs are recognised in profit or loss in the period in which they are incurred.
4.23 Revenue recognition
Revenue is recognised when it is probable that the economic benefits will flow to the company and the revenue can be measured reliably. Revenue is measured at the fair value of the consideration received or receivable on the following basis:
Revenue from sale of fertilizer products is recognized on dispatch to customers. Revenue from sale of Certified Emission Reductions (CERs) is recognised on the generation of the Emission
Reductions when a firm commitment for sale of CERs exists with a buyer. Return on deposits is accrued on a time proportion basis by reference to the principal outstanding and the applicable
rate of return. Dividend income and entitlement of bonus shares are recognised when the right to receive such dividend and bonus
shares is established. 4.24 Share capital
Ordinary shares are classified as equity and recognised at their face value. Incremental costs directly attributable to the issue of new shares are shown in equity as a deduction, net of tax.
4.25 Dividend
Dividend distribution to the company’s members is recognised as a liability in the period in which the dividends are approved.

46 Pakarab Fertilizers Limited
5. Issued, subscribed and paid up capital
2013 2012 2013 2012 (Number of shares) (Rupees in thousand) 2,791,260 2,791,260 Ordinary shares of Rs 10 each fully paid in cash 27,913 27,913 Ordinary shares of Rs 10 each issued 447,208,740 447,208,740 as fully paid bonus shares 4,472,087 4,472,087
450,000,000 450,000,000 4,500,000 4,500,000 2013 2012 (Number of shares)
Ordinary shares of the company held by associated undertakings as at year end are as follows: Reliance Commodities (Private) Limited 7,136,613 7,136,613 Fatima Sugar Mills Limited 71,250,558 71,250,558 Fazal Cloth Mills Limited 25,790,610 25,790,610 Arif Habib Corporation Limited 135,000,000 135,000,000
239,177,781 239,177,781
2013 2012 (Rupees in thousand)
6. Reserves Capital: - Fair value reserve 20,284 - Revenue: - General reserve 2,098,313 2,098,313 - (Accumulated loss)/un-appropriated profit (418,739) 1,333,940 1,679,574 3,432,253
1,699,858 3,432,253
7. Surplus on revaluation of operating fixed assets
This represents surplus over book value resulting from the revaluation of freehold land, buildings on freehold land, plant and machinery, railway siding and tools and other equipment, adjusted by incremental depreciation arising out of revaluation of abovementioned assets except freehold land. The valuation was carried out by independent valuers, M/s Pirsons Chemical Engineering (Private) Limited, on September 30, 2011 under current market price/appraisal methods wherever applicable for the respective assets. Surplus on revaluation of operating fixed assets can be utilized by the company only for the purposes specified in section 235 of the Companies Ordinance, 1984.
The revaluation surplus relating to abovementioned operating fixed assets excluding freehold land is net of applicable deferred income taxes. Incremental depreciation represents the difference between the actual depreciation on the abovementioned assets excluding freehold land and the equivalent depreciation based on the historical cost of these assets. The movement in revaluation surplus is as follows:
2013 2012 (Rupees in thousand)
Opening balance - net of tax 11,964,238 11,942,294 Deferred tax on revaluation surplus - note 13 - 185,845 Surplus transferred to other comprehensive income for the year on account of incremental depreciation - net of tax (79,902) (163,901)
Closing balance - net of tax - note 7.1 11,884,336 11,964,238
7.1 Includes surplus on revaluation of freehold land amounting to Rs 3,855.69 million (2012: Rs 3,855.69 million).
Notes to and forming part of the Financial Statementsfor the year ended December 31, 2013

47Annual Report
for the year ended December 31, 2013
2013 2012 (Rupees in thousand)
8. Long term finances - secured
Redeemable capital - note 8.1 - 1,625,000 Long term loans - note 8.2 1,466,071 2,656,946 Syndicated term finance - note 8.3 - 277,333
1,466,071 4,559,279
8.1 Redeemable capital
This is composed of: Listed Term Finance Certificates - note 8.1.1 - 1,500,000 Privately Placed Term Finance Certificates - note 8.1.2 1,625,000 3,250,000
1,625,000 4,750,000 Less: Current portion shown under current liabilities - note 14 1,625,000 3,125,000
- 1,625,000
8.1.1 Listed Term Finance Certificates
Opening balance 1,500,000 3,700,000 Less: Redeemed during the year 1,500,000 2,200,000
- 1,500,000 Less: Current portion shown under current liabilities - 1,500,000
- -
The effective markup rate charged during the year on the outstanding balance was 12.03% per annum.
2013 2012 (Rupees in thousand)
8.1.2 Privately Placed Term Finance Certificates (PPTFCs)
Opening balance 3,250,000 4,875,000 Less: Redeemed during the year 1,625,000 1,625,000
1,625,000 3,250,000 Less: Current portion shown under current liabilities 1,625,000 1,625,000
- 1,625,000
On December 15, 2009, the company converted the bridge finance of Rs 6,500 million from Habib Bank Limited (HBL) and National Bank of Pakistan (NBP) to Term Finance Certificates having unit value of Rs 5,000 each by way of private placement. As of December 31, 2013, HBL and NBP hold 400,000 units and 757,070 units respectively while the remaining 142,930 units are held by other private investors.
Terms of redemption The tenure of the PPTFCs is from December 16, 2009 to September 1, 2014. The PPTFCs are redeemable in six
semi-annual installments of Rs 812.5 million ending on September 1, 2014. The company has an option to redeem in full (Call Option) or part (Partial Call Option) of the outstanding amount without any premium by giving written notice to the Trustee at least thirty days prior to the option date. The Call Option is exercisable only on mark up payment dates.
Rate of return The return on PPTFCs is payable semi-annually and is calculated on the outstanding balance at the rate of six
months Karachi Inter Bank Offered Rate (KIBOR) plus 2.5% per annum. The effective mark up rate charged during the year on the outstanding balance ranges from 11.97% to 12.32% per annum.
Trustee In order to protect the interests of the PPTFC holders, HBL was appointed as Trustee under a trust deed dated
September 01, 2009. The Trustee is paid a fee of Rs 0.75 million per annum.

48 Pakarab Fertilizers Limited
2013 2012 (Rupees in thousand)
8.2 Long term loans
These have been obtained from the following financial institutions:
MCB Bank Limited - note 8.2.1 344,444 688,890 Standard Chartered Bank (Pakistan) Limited - Loan 1 - note 8.2.2 100,000 500,000 Standard Chartered Bank (Pakistan) Limited - Loan 2 - note 8.2.3 500,000 833,334 Faysal Bank Limited - note 8.2.4 500,000 500,000 National Bank of Pakistan - note 8.2.5 - 187,500 Pakistan Kuwait Investment Company (Private) Limited - note 8.2.6 312,500 437,500 PAIR Investment Company Limited - note 8.2.7 500,000 500,000 Soneri Bank Limited - note 8.2.8 400,000 400,000
2,656,944 4,047,224 Less: Current portion shown under current liabilities - note 14 1,190,873 1,390,278
1,466,071 2,656,946
8.2.1 This represents a term loan facility and the balance is repayable in two semi annual installments of Rs 172.222 million each ending on October 23, 2014. Markup is payable semi-annually at the rate of six months KIBOR plus 0.65% per annum on Rs 266.667 million, while on the remaining Rs 77.777 million, it is payable at the rate of six months KIBOR plus 3% per annum. The effective mark up rate charged during the year on the outstanding balance of Rs 266.667 million ranges from 10.23% to 10.44% per annum, while on the outstanding balance of Rs 77.777 million, the effective markup rate charged during the year ranges from 12.58% to 12.79% per annum. It is secured by a registered first pari passu charge on all present and future fixed assets of the company excluding the assets comprising the Clean Development Mechanism (CDM) project, the Cessna aircraft and the Lamont boiler for nitric acid.
8.2.2 This represents a term loan facility on musharika basis for capital expenditure. The balance is repayable in a single
installment of Rs 100 million on March 15, 2014. Mark up is payable quarterly at the rate of one month KIBOR plus 1.90% per annum. The effective markup rate charged during the year on the outstanding balance ranges from 10.70% to 11.70% per annum. The loan is secured by a registered charge over fixed assets comprising the Clean Development Mechanism (CDM).
8.2.3 This represents a term loan facility on musharika basis for capital expenditure. The balance is repayable in six quarterly
installments of Rs 83.333 million each ending on May 17, 2015. Mark up is payable monthly at the rate of one month KIBOR plus 1.75% per annum. The effective markup rate charged during the year on the outstanding balance ranges from 10.54% to 11.42% per annum. The loan is secured by a registered first pari passu charge over the fixed assets of the company including land, building, plant and machinery.
8.2.4 This represents a term finance facility of Rs 500 million obtained to finance the company’s capacity expansion. It
is repayable in six equal semi-annual installments of Rs 83.333 million each commencing December 14, 2014 and carries mark up at the rate of six months KIBOR plus 1.70% per annum, payable semi-annually. The effective markup rate charged during the year on the outstanding balance ranges from 11.17% to 11.53% per annum. It is secured by a pari passu charge on all present and future movable fixed assets excluding the assets comprising of Ammonia Converter Basket, the Lamont Boiler for Nitric Acid, the Cessna and Bombardier Challenger aircrafts, the assets comprising of the Clean Development Mechanism (CDM) project, the complete carbon dioxide recovery plant/liquefaction plant and the land and buildings of the excluded assets.
In case the company defaults on any of its obligations, the Trustee may enforce the company’s obligations in accordance with the terms of the trust deed. The proceeds of any such enforcements shall be distributed to the PPTFC holders at the time on a pari passu basis in proportion to the amounts owed to them pursuant to the PPTFCs.
Security
The PPTFCs are secured by a registered first ranking pari passu charge over all present and future fixed assets of the company excluding land and buildings and lamont boiler for nitric acid, the Cessna aircraft, Clean Development Mechanism (CDM) project and carbon dioxide recovery plant/liquefaction plant.
Notes to and forming part of the Financial Statementsfor the year ended December 31, 2013

49Annual Report
for the year ended December 31, 2013
8.2.5 This has been repaid during the year. The effective markup rate charged during the year on the outstanding balance ranges from 11.87% to 12.03% per annum.
8.2.6 This represents term finance facility to finance the company’s capacity expansion. The balance is repayable in five
equal semi-annual installments of Rs 62.5 million each ending on June 29, 2016 and carries mark up at the rate of six months KIBOR plus 2.25% per annum, payable semi-annually. The effective markup rate charged during the year on the outstanding balance ranges from 11.34% to 11.87% per annum. It is secured by a pari passu charge on all present and future movable fixed assets excluding the assets comprising of Ammonia Converter Basket, the Lamont Boiler for Nitric Acid, the Cessna aircraft, the assets comprising of the Clean Development Mechanism (CDM) project, the complete carbon dioxide recovery plant/liquefaction plant along with carbon dioxide static storage tank, tools and its spares, tools and accessories.
8.2.7 This represents term finance facility of Rs 500 million for balance sheet restructuring and company’s capital expenditure
requirements. It is repayable in seven equal semi-annual installments of Rs 71.428 million each commencing August 28, 2014 and carries mark up at the rate of six months KIBOR plus 2.25% per annum, payable semi-annually. The effective markup rate charged during the year on the outstanding balance ranges from 11.32% to 12.77% per annum. It is secured by a first pari passu charge on the company’s present and future fixed assets.
8.2.8 This represents term finance facility of Rs 400 million to meet the company’s capital expenditure/repayment of
expensive debt. It is repayable in six equal semi-annual installments of Rs 66.667 million each commencing May 2, 2014 and carries mark up at the rate of six months KIBOR plus 1.75% per annum, payable semi-annually. The effective markup rate charged during the year on the outstanding balance ranges from 10.81% to 11.11% per annum. It is secured by a first pari passu charge on the company’s present and future fixed assets including land and building and machinery excluding the assets comprising of Ammonia Converter Basket, the Lamont Boiler for Nitric Acid, the Cessna aircraft, the assets comprising of the Clean Development Mechanism (CDM) project, the complete carbon dioxide recovery plant/liquefaction plant along with carbon dioxide static storage tank, tools and its spares, tools and accessories and the land and buildings related to these assets.
2013 2012 (Rupees in thousand)
8.3 Syndicated term finance
This has been obtained from a consortium of the following financial institutions: National Bank of Pakistan 133,167 266,333 United Bank Limited 119,047 238,095 Faysal Bank Limited 25,119 50,239
277,333 554,667 Less: Current portion shown under current liabilities - note 14 277,333 277,334
- 277,333
It represents a syndicated term finance facility (STFF) to finance equity investment/debt financing in Fatima Fertilizer Company Limited (‘FATIMA’), a related party. The balance is repayable in two equal semi annual installments of Rs 138.667 million each ending on August 26, 2014. Mark up is payable semi-annually at the rate of six months KIBOR plus 2.5% per annum with no floor and no cap. The effective markup rate charged during the year on the outstanding balance ranges from 11.57% to 13.03% per annum. The facility is secured by a registered first pari passu charge on all present and future fixed assets of the company including plant and machinery, fixtures, fittings, vehicles, tools and equipment but excluding immovable property, land and buildings, Lamont Boiler for nitric acid, Cessna aircraft, the assets comprising of the Clean Development Mechanism (CDM) project and the complete carbon dioxide recovery plant/liquefaction plant along with carbon dioxide static storage tank, its spares, tools and accessories.
9. Import bill payable - secured
This represents deferred payment letter of credit established with Allied Bank Limited for import of an aircraft from Bombardier Inc., Canada. It is interest free and is secured through an exclusive hypothecation charge over the aircraft with all accessories, spares and parts installed or which may be installed in future.

50 Pakarab Fertilizers Limited
2013 2012 (Rupees in thousand)
Import bill payable [USD 24 million (2012: USD 24 million)] 2,524,800 2,330,400 Less: Current portion included in trade and other payables 1,424,800 842,000
1,100,000 1,488,400 10. Liabilities against assets subject to finance lease
Present value of minimum lease payments - note 10.1 38,811 113,189 Less: Current portion shown under current liabilities - note 14 38,811 63,511
- 49,678 The minimum lease payments have been discounted at an implicit interest rate of KIBOR plus 2% to 2.5% reset at the
beginning of every three or six months depending upon the terms of the lease agreement. The implicit interest rate used during the period to arrive at the present value of minimum lease payments ranges from 5.96% to 15.99%. Since the implicit interest rate is linked with KIBOR so the amount of minimum lease payments and finance charge may vary from period to period. The lessee has the option to purchase the assets after expiry of the lease term.
Taxes, repairs and insurance costs are to be borne by the company. In case of early termination of lease, the lessee shall pay
entire amount of rentals for unexpired period of lease agreement. The amount of future payments of the lease and the period in which these payments will become due are as follows:
Minimum Future Present value of lease lease finance liability payments cost 2013 2012 (Rupees in thousand)
Not later than one year 39,812 1,001 38,811 63,511
Later than one year and not later than five years - - - 49,678
39,812 1,001 38,811 113,189
10.1 These include a balance of Rs 0.028 million (2012: Rs 0.08 million) of a related party, Summit Bank Limited.
11. Long term deposits
These represent interest free security deposits from customers and carriage contractors and are repayable on cancellation/withdrawal of the dealership or on cessation of the business with the company respectively.
2013 2012 (Rupees in thousand)
12. Deferred liabilities
Accumulating compensated absences - note 12.1 86,320 84,150 Retirement benefits - gratuity fund - note 12.2 40,152 30,690
126,472 114,840
Notes to and forming part of the Financial Statementsfor the year ended December 31, 2013

51Annual Report
for the year ended December 31, 2013
2013 2012 (Rupees in thousand)
12.1 Accumulating compensated absences
Opening balance 84,150 66,001 Provision for the year 20,100 26,568
104,250 92,569 Less: Payments made during the year 17,930 8,419
Closing balance 86,320 84,150
12.2 Gratuity fund
The amounts recognised in the balance sheet are as follows: Present value of defined benefit obligation 129,962 115,230 Fair value of plan assets (89,810) (82,105) Unrecognised actuarial losses - (2,435)
Liability as at year end 40,152 30,690 Opening net liability 30,690 24,683 Charge to profit and loss account 23,163 21,746 Charge to related party 9,491 8,944 Net remeasurements for the year 7,498 - Contribution by the company (30,690) (24,683)
Liability as at year end 40,152 30,690 The movement in the present value of defined benefit obligation is as follows: Opening present value of defined benefit obligation 115,230 88,126 Service cost 29,685 27,102 Interest cost 12,675 11,016 Benefits paid to out-going members during the year (30,719) (14,727) Experience loss (3,110) 3,713 Remeasurements on obligation 6,201 -
Present value of defined benefit obligation as at year end 129,962 115,230 The movement in fair value of plan assets is as follows: Opening fair value 82,105 64,824 Expected return on plan assets 9,031 8,104 Company contributions 30,690 24,683 Benefits paid to out-going members during the year (30,719) (14,727) Experience loss - (779) Remeasurements on fair value of plan assets (1,297) -
Fair value as at year end 89,810 82,105 Plan assets are comprised as follows: Mixed funds 74,400 56,520 Cash 15,410 25,585
89,810 82,105

52 Pakarab Fertilizers Limited
The sensitivity of the defined benefit obligation to changes in the weighted principal assumptions is:
Impact on defined benefit obligation
Change in Increase in Decrease in assumptions assumption assumption (Rupees in thousand)
Discount rate 1% 118,995 142,813 Salary growth rate 1% 142,813 118,811
2013 2012 (Rupees in thousand)
13. Deferred taxation
The liability for deferred taxation comprises temporary differences relating to: Accelerated tax depreciation 10,001,487 9,912,589 Accumulating compensated absences (30,212) (29,453) Provision for doubtful receivable (3,119) (3,119) Post retirement medical benefits and other allowances payable (4,030) (4,030) Assets subject to finance lease 4,137 2,778 Interest receivable 5,433 553,828 Preference dividend receivable - 468,025 Unrealised recovery of chemical catalyst 56,957 50,799 Investment in subsidiary 7,220 - Goodwill 964,416 836,155 Unused tax losses (951,783) (793,934) Minimum tax available for carry forward (117,895) (70,897)
9,932,611 10,922,741 Deferred tax asset on tax losses available for carry forward and those representing minimum tax paid available for carry
forward under section 113 of the Income Tax Ordinance, 2001 are recognized to the extent that the realisation of related tax benefits through future taxable profits is probable.
Notes to and forming part of the Financial Statementsfor the year ended December 31, 2013
The present value of defined benefit obligation, the fair value of plan assets and the surplus or deficit of gratuity fund is as follows:
2013 2012 2011 2010 2009 (Rupees in thousand)
Present value of defined benefit obligation 129,962 115,230 88,126 53,709 38,481 Fair value of plan assets 89,810 82,105 64,824 45,505 29,959
Loss (40,152) (33,125) (23,302) (8,204) (8,522) Experience adjustment on obligation 5% 3% 6% 2% -21% Experience adjustment on plan assets -1.44% -0.95% 0.89% 0.21% 2%

53Annual Report
for the year ended December 31, 2013
15. This represents a short term loan facility of Rs 3 billion obtained during the year from FATIMA, a related party, to meet the company’s working capital requirements and repayment of long term liabilities. It carries mark up at the rate of six months KIBOR plus 2.12% per annum or average borrowing cost of FATIMA which ever is higher, payable semi-annually. The effective markup rate charged during the year on the outstanding balance was 11.21% per annum. It has been secured by providing a cash cheque of Rs 3 billion renewable after every six months accompanied with ranking charge on the company’s present and future fixed assets including plant and machinery, fixtures, fittings, vehicles, tools and equipment, but excluding immovable property and land and building and lamont boiler for nitric acid, cessna aircraft and the assets comprising of the Clean Development Mechanism (CDM) project, the complete carbon dioxide recovery plant/liquefaction plant along with carbon dioxide static storage tank, tools and its spares, tools and accessories, wherever situated together with all documents of title thereto and sale proceeds thereof and with the benefit of all contracts entered by the company with the suppliers of such fixed assets to be imported or purchased by the company.
2013 2012 (Rupees in thousand)
16. Short term borrowings - secured
Running finances - note 16.1 2,767,195 3,815,060 Term finances - note 16.2 1,969,000 1,999,025
4,736,195 5,814,085
16.1 Running finances
Short term running finance facilities available from commercial banks under mark-up arrangements amount to Rs 5,797 million (2012: Rs 8,100 million). The rates of mark-up range from 10.27% to 13.95% on the outstanding balance or part thereof. The aggregate running finances are secured against pledge of stock-in-trade as referred to in note 28.1 and registered hypothecation charge on current assets of the company. Included in the above is a running finance of Rs 400 million (2012: Rs 400 million) from a related party, Summit Bank Limited.
16.2 Term finances
Term finance facilities available from various commercial banks under profit arrangements amount to Rs 2,099 million (2012: Rs 2,804 million). The rates of profit range from 10.44% to 12.27% on the outstanding balance or part thereof. The aggregate term finances are secured against first pari passu charge over all current assets of the company.
2013 2012 (Rupees in thousand)
The gross movement in deferred tax liability during the year is as follows: Opening balance 10,922,741 10,967,290 Deferred tax on revaluation surplus - note 7 - (185,845) Charged to other comprehensive income 7,220 - (Credited)/charged to profit and loss account - note 40 (997,350) 141,296
Closing balance 9,932,611 10,922,741
14. Current portion of long term liabilities
Long term finances - secured: - Redeemable capital - note 8.1 1,625,000 3,125,000 - Long term loans - note 8.2 1,190,873 1,390,278 - Syndicated term finance - note 8.3 277,333 277,334 Liabilities against assets subject to finance lease - note 10 38,811 63,511 Payable against mining rights - note 14.1 - 21,000
3,132,017 4,877,123
14.1 This represents interest free amount payable to Director General, Mines and Minerals, Government of Khyber Pakhtunkhwa (‘GOKP’) in respect of mining rights acquired for extraction of rock phosphate from a block of area in District Abbottabad for a ten years period ending on August 11, 2019. This has been paid during the current year.

54 Pakarab Fertilizers Limited
Notes to and forming part of the Financial Statementsfor the year ended December 31, 2013
16.3 Letters of credit and guarantees
Of the aggregate facility of Rs 7,650 million (2012: Rs 8,214 million) for opening letters of credit and Rs 100 million (2012: Rs 2,350 million) for guarantees, the amount utilised at December 31, 2013 was Nil (2012: Nil) and Nil (2012: Rs 17 million) respectively. The facility for opening letters of credit is secured against import documents and registered joint pari passu charge over current assets whereas facility for guarantees is secured against pledge of stock-in-trade as referred to in note 28.1.
17. Reliance Exports (Private) Limited (‘REL’), under the terms and conditions stated in the ‘Share Purchase Agreement’ (the
Agreement), acquired 100% shares in the company on July 14, 2005 through the process of privatization. Under the terms of the Agreement, the purchase consideration, in addition to lump sum cash payment, included a further payment equivalent to 90% of the company’s claim of tax refund aggregating to Rs 2,814.511 million for the assessment years 1993-94, 1995-96 through 2002-2003 and tax years 2003 and 2004. The amount is payable to the Privatization Commission in the event of and at the time of cash receipt of the refund from the concerned tax authorities.
The amount recognized in these financial statements as payable to Privatization Commission is net off Rs 240.119 million
which, according to the management of the company, has already been withdrawn by the Previous Members as part of the dividend distribution for the year ended June 30, 2005. The management of the company feels that the Agreement as presently worded, if executed, would result into double payment of the same amount to the Privatization Commission/Previous Members, firstly, as part of the profits for the year ended June 30, 2005 (computed without recognition of the tax expense for the years for which when the refund is issued, an amount equivalent to 90% would be the right of the Privatization Commission/Previous Members) and secondly, at the time the refund is received from the tax authorities when an amount equivalent to 90% of such refund is paid off to the Privatization Commission, as agreed. The management of the company feels that such double payment is neither the intention nor warranted under the specific provisions of the Agreement.
Upon dissolution of REL and its amalgamation with the company on July 14, 2005, this liability was recognised in the books
of the company being the surviving entity upon REL’s amalgamation with the company in accordance with the Scheme of Arrangement for Amalgamation.
18. This represents the derivative cross currency swaps the company had entered into with various banks. These have matured
during the year resulting in a gain of Rs 2.217 million that has been recognised in the profit and loss account.
2013 2012 (Rupees in thousand)
19. Trade and other payables
Trade creditors - note 19.1 1,602,941 1,345,804 Sui gas bill payable - note 19.2 6,093 112,228 Security deposits 21,969 30,160 Accrued liabilities 857,798 375,682 Workers’ profit participation fund - note 19.3 727,628 753,108 Workers’ welfare fund 244,046 244,046 Customers’ balances 343,352 126,282 Bank guarantees discounted - 66,348 Due to related party - 133,000 Due to employees’ provident fund trust 6,055 6,084 Withholding tax payable 7,569 13,999 Excise duty payable 1,724 1,724 Sales tax payable - note 19.4 149,940 - Electricity duty payable 19,506 16,481
3,988,621 3,224,946
19.1 Includes an amount of Rs 0.05 million (2012: Rs 0.05 million) payable to FATIMA, a related party. 19.2 This amount is payable to Sui Northern Gas Pipelines Limited (‘SNGPL’), a related party against purchase of gas.

55Annual Report
for the year ended December 31, 2013
2013 2012 (Rupees in thousand)
20. Accrued finance cost
Accrued mark-up on: - redeemable capital - secured 9,011 79,805 - long term loans - secured 39,945 61,202 - syndicated term finance - secured 12,204 26,051 - short term borrowings - secured - note 20.1 128,277 155,451 - short term loan from related party - secured - note 20.2 147,148 - Acceptance commission on letter of credit - 43,164
336,585 365,673
20.1 Includes an amount of Rs 10.906 million (2012: Rs 11.629 million) payable to Summit Bank Limited, a related party. 20.2 This amount is payable to FATIMA.
21. Contingencies and commitments
21.1 Contingencies
(i) The company has netted off an amount of Rs 240.119 million from the amount payable to the Privatization Commission, as part of purchase consideration, at the time and in the event the refund is received from the tax authorities. In case, the company’s contention relating to possible double payment is not acceded to by the other party to the Share Purchase Agreement, the company is contingently liable to the aforesaid amount of Rs 240.119 million. In case, the amount becomes payable, the corresponding effect would be reflected in the computation of goodwill.
2013 2012 (Rupees in thousand)
19.3 Workers’ profit participation fund
Opening balance 753,108 803,274 Less: Payments made during the year 25,480 50,166
Closing balance 727,628 753,108
The company has an agreement with the Workers Welfare Fund (‘WWF’), Ministry of Labour and Manpower, Government of Pakistan whereby the balance amount of Workers’ Profit Participation Fund (‘WPPF’) remaining after deducting the workers’ portion of WPPF that is required to be deposited in the WWF, would be used for establishing a hospital for the workers as per the mechanism defined in that agreement.
19.4 Includes Rs 134.022 million which primarily represents the input sales tax paid by the company in respect of raw materials acquired before June 11, 2008 on which date fertilizer products manufactured by the company were exempted from levy of sales tax through notification SRO 535(I)/2008. The amount stood refundable to the company there being no output sales tax liability remaining payable on fertilizer products manufactured by the company against which such input sales tax was adjustable. The company’s claim of refund on this account was not entertained by Federal Board of Revenue (‘FBR’) on the premise that since subject raw materials were subsequently consumed in manufacture of a product exempt from levy of sales tax, claim was not in accordance with the relevant provisions of the Sales Tax Act, 1990.
Company’s management being aggrieved with the interpretation advanced by FBR on the issue has preferred a writ petition before the Lahore High Court, which has not yet been disposed off. Since company’s management considers that claim of refund is completely in accordance with relevant statutory framework and expects relief from appellate authorities on this account, it considers that the receivable amount was unimpaired at the balance sheet date.

56 Pakarab Fertilizers Limited
Notes to and forming part of the Financial Statementsfor the year ended December 31, 2013
(ii) The company has issued following guarantees in favour of: - Sui Northern Gas Pipelines Limited against gas sale amounting to Rs 10 million (2012: Rs 10 million). - Pakistan State Oil Company Limited against fuel for aircraft amounting to Rs 7 million (2012: Rs 7 million). - Meezan Bank Limited as security against finance obtained by its subsidiary, Reliance Sacks Limited. (iii) Indemnity bonds amounting to Nil (2012: Rs 152.7 million) issued to the Customs authorities in favour of The
President of Islamic Republic of Pakistan under SRO 489(I)/2000 for the value of goods exported and to be re-imported.
(iv) As at June 30, 2004, the company had investment of 140,000 ordinary shares of Rs 10 each valuing Rs 100,000 in
National Fertilizer Marketing Limited, being the associated company on that date. On May 20, 2005, this investment was transferred to National Fertilizer Corporation of Pakistan (Private) Limited by the management of the company. However, the new buyer, Reliance Exports (Private) Limited filed an application before Privatization Commission challenging this transfer on the grounds that such transfer had been carried out against the terms and conditions of the bid documents. In case of a positive outcome to the application, this investment would be re-instated.
(v) An amount of Rs 129.169 million was withdrawn by the previous members of the company as part of dividend for
the year ended June 30, 2005 under the Share Purchase Agreement. Out of the aggregate amount, Rs 89.39 million represents the value of certain catalysts recovered in consequence of clean down operations of the plant prior to undertaking the process of privatization, which was accounted for as income in the financial statements for the year ended June 30, 2005 in the light of applicable financial reporting framework.
The management of the company feels that notwithstanding the applicability of the financial reporting framework,
on the financial statements for the year ended June 30, 2005, the amount was not distributable as part of dividend for that year in view of the clear understanding behind the execution of the Agreement as categorically confirmed, in writing, by the Privatization Commission prior to signing of the Agreement. Similarly, the balance amount of Rs 39.779 million is considered to be dividend distribution out of the then available reserves which was also not distributable to the previous members in terms of other covenants of the Agreement.
The company has filed a claim for the recovery of the aforesaid aggregate amount on the grounds that in the present
form, the distribution has been made out of the accumulated reserves, for the years up to June 30, 2004, which, under the specific provisions of the Agreement were not distributable to the previous members of the company. In case of a positive outcome to the company’s claim, the excess dividend withdrawn by the previous members of the company would be recovered.
(vi) Through a show cause notice, the department raised the issue of short payment of output sales tax on supplies of the
company’s fertilizer product, Calcium Ammonium Nitrate (‘CAN’) for the period from April 18, 2011 to December 31, 2011 involving a principal sales tax demand of Rs 500 million. Such issue has been raised on the grounds that notification SRO 15(I)/2006, providing for levy of sales tax on the basis of ‘notified price’ of CAN, was withdrawn through notification SRO 313(I)/ 2011 dated April 18, 2011 and hence, company was legally required to recover output sales tax on supplies of CAN on the basis of actual consideration received there against. The company has impugned the vires of such notice through institution of a constitutional petition before the Lahore High Court, inter alia, on the grounds that (i) pending the disposal of application earlier filed with the Federal Board of Revenue by the company under section 65B of the Sales Tax Act, 1990, on this matter, instant proceedings initiated by department lack the legal sanctity; and (ii) that inadvertence of charging the sales tax on the basis of notified price was not attributable to any mala fide on company’s part. In view of the fact that management considers company’s stance to be based on meritorious grounds and hence expects a favourable decision on the matter by Lahore High Court, no provision on this account has been made in these financial statements.

57Annual Report
for the year ended December 31, 2013
(vii) For assessment years 1993-94 and 1995-96 through 2002-2003 and for tax years 2003 through 2005, the company, in view of the position taken by the tax authorities that the income of the company is chargeable to tax on the basis of ‘net income’, had provided for in the financial statements the tax liability on net income basis which aggregated to Rs 5,223.343 million. Tax liabilities admitted in respective returns of total income in respect of these assessment/tax years, however, aggregated to Rs 1,947.671 million being the liabilities leviable under the Presumptive Tax Regime (‘PTR’), considered by the management to be applicable in respect of company’s income from sale of own manufactured fertilizer products.
The Appellate Tribunal Inland Revenue (‘ATIR’) through its separate orders for the assessment years 1993-94, 1995-
96 through 2002-03 upheld the company’s position as taken in respective returns of total income and consequently, management reversed the excess provisions aggregating to Rs 3,275.673 million on the strength of such judgments. ATIR’s decisions in respect of certain assessment years have also been upheld by the Lahore High Court while disposing departmental appeals against respective orders of ATIR. Income tax department has statedly agitated the issue further before Supreme Court of Pakistan, which is pending adjudication.
In view of the favourable disposal of the matter up to the level of High Court, management of the company feels that
the decision of the apex court would also be in the favour of the company and hence in these financial statements, tax liabilities in respect of above referred assessment/tax years have been provided on the basis that company’s income during such years was taxable under PTR. In case, the apex court decides the matter otherwise, amount aggregating to Rs 3,275.673 million will have to be recognized as tax expense in respect of such assessment/tax years.
(viii) Included in trade debts is an amount of Rs 18.877 million (2012: Rs 18.877 million) which has not been acknowledged
as debts by its customers due to a dispute regarding the discount on the product’s price. The company’s customers had collectively filed an appeal regarding the price dispute before the Civil Court, Multan, which decided the case in favour of the company’s customers. The company preferred an appeal before the District and Sessions Court, Multan which set aside the order of the Civil Court. The company’s customers filed a revised petition before the Lahore High Court against the order of the District and Sessions Court, which is pending for adjudication. Based on the advice of the company’s legal counsel, the company’s management considers that there are meritorious grounds to defend the company’s stance and hence, no provision has been made in these financial statements on this account.
(ix) Claims against the company not acknowledged as debts Rs 23.051 million (2012: Rs 23.051 million). Provision has not been made in these financial statements as management is confident that it will not materialize.
21.2 Commitments in respect of
(i) Contracts for capital expenditure Nil (2012: Rs 39.717 million).
(ii) Letters of credit other than for capital expenditure Rs 48.870 million (2012: Rs 128.189 million).
(iii) Purchase orders aggregating to Nil (2012: Rs 5.656 million) were placed and letters of credit were established subsequently.
(iv) The amount of future payments under operating leases and the period in which these payments will become due are as follows:
2013 2012 (Rupees in thousand)
Not later than one year 51,821 57,019 Later than one year and not later than five years 52,389 109,669
104,210 166,688
22. Property, plant and equipment
Operating fixed assets - note 22.1 37,052,138 36,841,325 Capital work-in-progress - note 22.2 61,718 448,931
37,113,856 37,290,256

58 Pakarab Fertilizers Limited
22.1 Operating fixed assets (Rupees in thousand) Building on Furniture Tools and Freehold freehold Railway Plant and Aircrafts and other Vehicles Catalyst Total land land siding machinery fixtures equipment COST
Balance as at January 01, 2012 4,767,634 1,928,551 36,800 28,066,369 2,778,905 64,622 622,372 243,508 102,102 38,610,863 Additions during the year - 124,652 - 23,432 4,304 4,923 54,121 2,578 115,210 329,220 Transfers in from assets subject to finance lease - - - - - - - 117,858 - 117,858 Disposals during the year - - - (6,759) - - - (123,909) - (130,668)
Balance as at December 31, 2012 4,767,634 2,053,203 36,800 28,083,042 2,783,209 69,545 676,493 240,035 217,312 38,927,273 Balance as at January 01, 2013 4,767,634 2,053,203 36,800 28,083,042 2,783,209 69,545 676,493 240,035 217,312 38,927,273
Additions during the year - 4,061 - 569,750 - 914 44,627 - - 619,352 Transfers in from assets subject to finance lease - - - - - - - 91,715 - 91,715 Disposals during the year - - - - - - (10) (125,380) - (125,390)
Balance as at December 31, 2013 4,767,634 2,057,264 36,800 28,652,792 2,783,209 70,459 721,110 206,370 217,312 39,512,950 DEPRECIATION
Balance as at January 01, 2012 - 34,080 3,201 217,319 425,163 2,294 59,494 177,149 48,561 967,261 Charge for the year - note 22.1.3 - 101,661 9,600 698,441 215,368 7,859 43,363 28,126 23,610 1,128,028 Transfers in from assets subject to finance lease - - - - - - - 74,917 - 74,917 Charge on disposals - - - (91) - - - (84,167) - (84,258)
Balance as at December 31, 2012 - 135,741 12,801 915,669 640,531 10,153 102,857 196,025 72,171 2,085,948 Balance as at January 01, 2013 - 135,741 12,801 915,669 640,531 10,153 102,857 196,025 72,171 2,085,948 Charge for the year - note 22.1.3 - 106,396 9,600 80,698 128,026 8,216 45,577 23,304 2,523 404,340 Transfers in from assets subject to finance lease - - - - - - - 63,280 - 63,280 Charge on disposals - - - - - - - (92,756) - (92,756)
Balance as at December 31, 2013 - 242,137 22,401 996,367 768,557 18,369 148,434 189,853 74,694 2,460,812 Book value as at December 31, 2012 4,767,634 1,917,462 23,999 27,167,373 2,142,678 59,392 573,636 44,010 145,141 36,841,325 Book value as at December 31, 2013 4,767,634 1,815,127 14,399 27,656,425 2,014,652 52,090 572,676 16,517 142,618 37,052,138
22.1.1 Freehold land, buildings on freehold land, railway siding, plant and machinery and tools and other equipment were revalued by an independent valuer M/s Pirsons Chemical Engineering (Private) Limited on September 30, 2011 on current market value basis. The revaluation surplus net of deferred tax was credited to surplus on revaluation of operating fixed assets. Had there been no revaluation, the carrying amounts of the following classes of assets would have been as follows:
2013 2012 (Rupees in thousand)
Freehold land 3,387,787 3,387,787 Buildings on freehold land 1,421,839 1,509,190 Railway siding 1,223 6,312 Plant and machinery 16,188,081 15,653,706 Tools and other equipment 354,512 340,641
21,353,442 20,897,636
22.1.2 Included in plant and machinery are assets costing Rs 34.613 million which are installed at the manufacturing facilities of the company’s customers namely Iceberg Gas Company, Coca-Cola Beverages Pakistan Limited and Shamim & Company (Private) Limited as these assets are used for sales to these customers.
2013 2012 (Rupees in thousand)
22.1.3 The depreciation charge for the year has been allocated as follows:
Cost of sales - note 34 185,022 829,836 Administrative expenses - note 35 215,192 296,217 Selling and distribution expenses - note 36 4,126 1,975
404,340 1,128,028
Notes to and forming part of the Financial Statementsfor the year ended December 31, 2013

59Annual Report
for the year ended December 31, 2013
2013 2012 (Rupees in thousand)
22.2 Capital work-in-progress
Plant and machinery 51,795 365,163 Civil works 4,775 2,478 Advances against purchase of plant and machinery - considered good 3,835 80,158 Others 1,313 1,132
61,718 448,931
23. Assets subject to finance lease
These represent vehicles leased by the company. COST
Opening balance 253,594 371,452 Transfer to operating fixed assets during the year (91,715) (117,858)
Closing balance 161,879 253,594 DEPRECIATION
Opening balance 132,468 142,070 Charge for the year - note 23.1 42,060 65,315 Transfer to operating fixed assets during the year (63,280) (74,917)
Closing balance 111,248 132,468
Closing book value 50,631 121,126
Annual depreciation rate% 20 20 23.1 The depreciation charge for the year has been allocated as follows:
Cost of sales - note 34 9,009 15,299 Administrative expenses - note 35 19,870 32,891 Selling and distribution expenses - note 36 13,181 17,125
42,060 65,315 23.2 Vehicles of Rs 13.987 million (2012: Rs 42.902 million) are in possession and use of FATIMA, a related party on
rental basis as referred to in note 39.2 to these financial statements.
(Rupees in thousand)
Computer Mining Total software rights
24. Intangible assets
COST
Balance as at January 01, 2012 1,827 210,000 211,827 Additions during the year 9,266 - 9,266
Balance as at December 31, 2012 11,093 210,000 221,093 Balance as at January 01, 2013 11,093 210,000 221,093 Additions during the year 22,493 - 22,493
Balance as at December 31, 2013 33,586 210,000 243,586

60 Pakarab Fertilizers Limited
(Rupees in thousand)
Computer Mining Total software rights
AMORTIZATION
Balance as at January 01, 2012 1,827 49,000 50,827 Charge for the year - note 24.2 193 21,000 21,193
Balance as at December 31, 2012 2,020 70,000 72,020 Balance as at January 01, 2013 2,020 70,000 72,020 Charge for the year - note 24.2 6,159 21,000 27,159
Balance as at December 31, 2013 8,179 91,000 99,179 Book value as at December 31, 2012 9,073 140,000 149,073
Book value as at December 31, 2013 25,407 119,000 144,407
Annual amortization rate% 25 10
24.1 Mining rights represent rights acquired for extraction of rock phosphate from a block of area in District Abbottabad for a ten years period ending on August 11, 2019. The aforesaid area is in the possession and control of Pakistan Mining Company Limited (‘PMCL’), a related party, which provides rock phosphate extraction services to the company as per the Services Agreement.
2013 2012 (Rupees in thousand)
24.2 The amortization charge for the year has been allocated as follows:
Cost of sales (included in raw materials consumed) 21,000 21,000 Administrative expenses - note 35 6,159 193
27,159 21,193
25. Goodwill
This represents goodwill on amalgamation of REL and the company.
Impairment testing of goodwill has been carried out at the overall business unit level. The recoverable amount of the Cash Generating Unit has been determined based on a value in use calculation. This calculation uses cash flow projections based on financial budgets approved by management covering a five-year period. The cash flows beyond the five year period are extrapolated using estimated growth rates stated below. The growth rate does not exceed the long term average growth rate for the fertiliser industry. The recoverable amount calculated based on value in use exceeded carrying value by Rs 1,884.826 million. A long term/terminal growth rate of 0.06% or a rise in discount rate to 22.03% would remove the remaining headroom.
The key assumptions used in value-in-use calculations are as follows:
Budgeted annual operating days (average of next five years) 246 Long term/terminal growth rate 3% Discount rate 20.53%
Carrying amount of the Cash Generating Unit Rupees in thousand 40,614,057
Recoverable amount Rupees in thousand 42,498,883
The above cash flow projections are principally based on the assumption that gas supply would resume to the company. During the previous and current year, the company has faced excessive gas shortages due to which the operations have remained suspended for major part of the years resulting into losses for the years. However, during the current year, the Government of Pakistan (‘GOP’) has approved long term gas supply arrangements from dedicated sources for fertilizer plants and subsequent to year end, GOP has announced to resume gas supply to the fertilizer sector from the existing gas supply network, based on which management feels that the current gas shortage is of a temporary nature and the gas supply will resume in the near future which would result in increased production as compared to previous and current years thereby leading to future profits.
Notes to and forming part of the Financial Statementsfor the year ended December 31, 2013

61Annual Report
for the year ended December 31, 2013
2013 2012 (Rupees in thousand)
26. Long term investments
Available for sale: Subsidiary - unquoted Reliance Sacks Limited (incorporated in Pakistan) 16,863,273 (2012: 2,350,000) fully paid ordinary shares of Rs 10 each Equity held 100% (2012: 100%) Book value per share Rs 11.163 (2012: Rs 9.469) - note 26.1 196,137 23,500 Held to maturity: - Other - note 26.2 34,409 30,681 Advance against purchase of shares in: - Subsidiary, Reliance Sacks Limited - 145,133 - Related party, Multan Real Estate Company (Private) Limited 64,004 62,596
294,550 261,910
26.1 Investment in Reliance Sacks Limited - at fair value
At cost 168,633 23,500 Add: Cumulative fair value gain recognised 27,504 -
196,137 23,500 This represents investment in the equity of Reliance Sacks Limited (‘RSL’) which was incorporated for the purpose
of implementing a project comprising the establishment and operation of production facility of polypropylene sacks to be used in packing of fertilizers. Since RSL’s ordinary shares are not listed, an external investment advisor engaged by the company has estimated a fair value of Rs 11.63 per ordinary share as at December 31, 2013 through a valuation technique based on discounted cash flow analysis of RSL. The significant assumptions used in this valuation technique are as follows:
- Discount rate used for first three years 20.53% per annum and for fourth year onwards 22.43% per annum - Terminal growth rate 4% per annum Sensitivity analysis
Sensitivity analysis of the significant assumptions used in the valuation technique are as follows: If the discount rate increases by 1% with all other variables held constant, the impact on total equity as at December
31, 2013 would be Rs 31.522 million lower. If the terminal growth rate decreases by 1% with all other variables held constant, the impact on total equity as at
December 31, 2013 would be Rs 16.507 million lower.
26.2 Investment - Other
This represents Defence Saving Certificates issued for a period of ten years, which will mature on September 11, 2019. Yield to maturity on these certificates is 12.15%. These certificates have been pledged as security with the Director General, Mines & Minerals, Government of Khyber Pakhtunkhwa as per the terms of the mining agreement as referred to in note 14.1.

62 Pakarab Fertilizers Limited
Notes to and forming part of the Financial Statementsfor the year ended December 31, 2013
2013 2012 (Rupees in thousand)
27. Stores and spare parts
Chemicals and catalysts - note 27.1 1,103,254 1,158,793 Stores 130,562 141,384 Spare parts [including in transit Rs 8.609 million [(2012: Rs 86.915 million)] 1,746,758 1,799,153
2,980,574 3,099,330 Less: Provision for obsolete items 76,224 76,224
- note 27.2 2,904,350 3,023,106
27.1 Included in chemicals and catalysts is platinum, rhodium and palladium of Rs 69.337 million (2012: Rs 69.337 million) which is in the possession of Johnson Matthey Public Limited Company, United Kingdom on behalf of the company for refining purposes.
27.2 Stores and spares include items which may result in fixed capital expenditure but are not distinguishable.
2013 2012 (Rupees in thousand)
28. Stock-in-trade
Raw materials - note 28.2 709,267 1,630,244 Packing materials 41,464 51,962 Mid products 40,519 38,080 Finished goods: - Own manufactured: Fertilizers 9,074 8,521 Emission reductions - note 28.3 11,317 5,064
20,391 13,585 - Fertilizer purchased for resale 18 -
811,659 1,733,871
28.1 Raw materials and finished goods amounting to Rs 366.350 million (2012: Rs 981.903 million) are pledged with lenders as security against short term borrowings as referred to in note 16.
28.2 Includes rock phosphate amounting to Rs 42.068 million (2012: 10.567 million) and Rs 103.389 million (2012: Rs
279.863 million) which is in the possession of related parties, PMCL and FATIMA respectively. The rock phophate in possession of PMCL is due to the reason explained in note 24.1 to these financial statements and the rock phosphate in possession of FATIMA is due to the reason that it has been provided on loan basis.
28.3 This represents emission reductions costing Rs 34.169 million carried at their Net Realizable Value (‘NRV’)
amounting to Rs 11.317 million. The NRV write down expense of Rs 22.852 million has been charged to cost of sales.
2013 2012 (Rupees in thousand)
29. Trade debts
Considered good: - Secured (by way of bank guarantees and security deposits) 27,031 103,121 - Unsecured - note 29.2 126,132 467,871
153,163 570,992
29.1 These are in the normal course of business and certain debts carry interest ranging from 1% to 9% (2012: 1% to 9%) per annum.
29.2 Includes an amount of Nil (2012: Rs 12.525 million - neither past due nor impaired) receivable from Fatima Sugar
Mills Limited, a related party.

63Annual Report
for the year ended December 31, 2013
2013 2012 (Rupees in thousand)
30. Advances, deposits, prepayments and other receivables
Advances - considered good: - To employees - note 30.1 4,797 16,687 - To suppliers - note 30.2 36,439 71,372 Trade deposits 100 100 Prepayments 49,067 94,222 Due from related party: - Interest receivable on long term loans - 1,477,634 - Interest receivable on preference dividend receivable - 94,017 - Preference dividend receivable - 1,337,214 Interest receivable on bank deposits 2,114 1,035 Balances with statutory authorities: - Sales tax - considered good - 80,593 - considered doubtful 8,911 8,911
8,911 89,504 - Income tax recoverable 2,916,119 2,830,258 - Custom duty recoverable 9,811 9,811 Letters of credit - margins, deposits, opening charges etc. 1,419 1,531 Security deposits - note 30.3 125,711 17,884 Other receivables - considered good 28,403 9,870
3,182,891 6,051,139 Less: Provision for doubtful receivable 8,911 8,911
3,173,980 6,042,228
30.1 Included in advances to employees are amounts due from executives of Rs 1.138 million (2012: Rs 6.90 million). 30.2 Includes an amount of Rs 4.097 million (2012: Rs 2.984 million) advance to Reliance Sacks Limited, subsidiary,
against supply of polypropylene sacks. 30.3 Includes an amount of Rs 100 million (2012: Nil) deposited with Sindh High Court, in respect of suit filed by the
company in relation to proposed acquisition of DH Fertilizers Limited. 2013 2012 (Rupees in thousand)
31. Short term investments
Assets at fair value through profit or loss:
Wateen Telecom Limited Nil (2012: 2,000,000) fully paid ordinary shares of Rs 10 each - 5,960
- 5,960 Investment held for distribution to members - 1,078,200
- 1,084,160
32. Cash and bank balances
At banks on: - Saving accounts - note 32.1 & 32.2 64,125 698,633 - Current accounts - note 32.2 91,147 290,226
155,272 988,859 In hand 4,563 5,098
159,835 993,957
32.1 Profit on balances in saving accounts ranges from 5% to 10% (2012: 5% to 10%) per annum.

64 Pakarab Fertilizers Limited
Notes to and forming part of the Financial Statementsfor the year ended December 31, 2013
32.2 Included in saving accounts is an amount of Rs 0.256 million (2012: Rs 17.637 million) which bears mark up at the rate of 9% (2012: 9%) per annum and included in current accounts is an amount of Rs 3.614 million (2012: Rs 4.049 million), both placed with Summit Bank Limited, a related party.
2013 2012 (Rupees in thousand)
33. Sales Fertilizer products: - Own manufactured 5,064,733 8,772,572 - Purchased for resale 3,522,521 21,497 8,587,254 8,794,069 Certified Emission Reductions (CERs) 2,009 223,310 Mid products 241,684 520,500 Rock phosphate 153,373 122,560 Processing income - note 33.1 - 12,551 397,066 878,921 8,984,320 9,672,990 Less: Sales tax 1,253,943 1,255,351 Sales incentive 302,130 259,836 Discount - 21,645 1,556,073 1,536,832
7,428,247 8,136,158 33.1 This represents income from processing services rendered for a related party, FATIMA.
34. Cost of sales Raw material consumed - note 34.1 & 34.2 1,674,353 2,194,693 Packing material consumed 58,862 98,669 1,733,215 2,293,362 Salaries, wages and other benefits - note 34.3 563,514 691,704 Fuel and power - note 34.4 643,876 770,201 Chemicals and catalysts consumed 107,778 42,431 Spare parts consumed 111,676 183,705 Stores consumed 36,558 66,489 Repairs and maintenance 296,077 170,391 Insurance 272,892 282,609 Depreciation on operating fixed assets - note 22.1.3 185,022 829,836 Depreciation on assets subject to finance lease - note 23.1 9,009 15,299 Toll manufacturing charges and freight - note 34.5 706,520 - Others - note 34.6 39,457 90,449 4,705,594 5,436,476 Opening stock of mid products 38,080 16,964 Closing stock of mid products (40,519) (38,080) (2,439) (21,116) Cost of goods manufactured 4,703,155 5,415,360 Opening stock of finished goods 13,585 803,235 Closing stock of finished goods (20,391) (13,585) (6,806) 789,650 Cost of goods sold - own manufactured 4,696,349 6,205,010 Cost of goods sold - purchased for resale - note 34.7 2,446,318 16,299 7,142,667 6,221,309

65Annual Report
for the year ended December 31, 2013
34.1 Includes feed gas consumed of Rs 576.356 million (2012: Rs 1,065.407 million) purchased from SNGPL, a related party.
34.2 Includes expenses of Rs 103.144 million (2012: Rs 113.503 million) for extraction of rock phosphate by Pakistan
Mining Company Limited, a related party, as explained in note 24.1 to these financial statements.
2013 2012 (Rupees in thousand)
34.3 Salaries, wages and other benefits
Salaries, wages and other benefits include following in respect of gratuity: Current service cost 15,618 14,840 Interest cost for the year 6,668 6,031 Expected return on plan assets (4,751) (4,435) Past service cost - 369
17,535 16,805 In addition to the above, salaries, wages and other benefits include Rs 14.176 million (2012: Rs 16.221 million)
and Rs 8.447 million (2012: Rs 17.607 million) in respect of provident fund contribution by the company and accumulating compensated absences respectively.
34.4 Includes fuel gas consumed of Rs 571.3 million (2012: Rs 715.540 million) purchased from SNGPL, a related
party. 34.5 This includes processing services of Rs 679.291 million (2012: Nil) availed from FATIMA, a related party. 34.6 Includes operating lease rentals amounting to Rs 15.192 million (2012: Rs 14.234 million). 34.7 This includes fertilizer purchased from FATIMA, a related party amounting to Nil (2012: Rs 16.299 million).
2013 2012 (Rupees in thousand)
35. Administrative expenses Salaries, wages and other benefits - note 35.1 320,827 375,062 Travelling and conveyance 17,361 70,623 Telephone, telex and postage 17,815 15,462 Stationery, printing and periodicals 8,484 6,016 Rent, rates and taxes - note 35.2 32,648 22,356 Repairs and maintenance 34,949 46,496 Aircraft operating expenses - note 35.3 75,830 89,281 Insurance 14,364 12,926 Legal and professional charges 44,610 47,197 Vehicle running expenses 6,455 8,659 Entertainment 3,404 5,401 Advertisement 1,003 2,986 Depreciation on operating fixed assets - note 22.1.3 215,192 296,217 Depreciation on assets subject to finance lease - note 23.1 19,870 32,891 Amortization on intangible assets - note 24.2 6,159 193 CDM administrative expenses 2,151 7,202 Others - note 35.4 66,405 125,639 - note 35.5 887,527 1,164,607

66 Pakarab Fertilizers Limited
Notes to and forming part of the Financial Statementsfor the year ended December 31, 2013
2013 2012 (Rupees in thousand)
35.1 Salaries, wages and other benefits
Salaries, wages and other benefits include following in respect of gratuity: Current service cost 5,602 5,623 Interest cost for the year 2,392 2,286 Expected return on plan assets (1,849) (1,681) Actuarial loss - 140 Less: amount charged to related party (1,694) (1,595)
4,451 4,773 In addition to the above, salaries, wages and other benefits include Rs 9.091 million (2012: Rs 7.181 million) and Rs
6.913 million (2012: Rs 5.509 million) in respect of provident fund contribution by the company and accumulating compensated absences respectively.
35.2 Includes operating lease rentals amounting to Rs 14.967 million (2012: Rs 8 million). 35.3 Includes expenses of Rs 28.253 million (2012: Rs 34.152 million) for flying and maintenance services of the
company’s aircrafts by Air One (Private) Limited, a related party as per the Services Agreement. 35.4 Includes expenses of Rs 9.416 million (2012: Rs 38.532 million) for research and development activities of the
extracted rock phosphate, which has been carried out by a foreign consultant. 35.5 Includes amount of Rs 172.913 million (2012: Rs 114.929 million) which represents common costs charged to the
company by FATIMA, a related party as per the Expense Sharing Agreement. Also included is an amount of Rs 114.603 million (2012: Rs 133.771 million) which represents common costs charged by the company to FATIMA, a related party as per the Expense Sharing Agreement.
2013 2012 (Rupees in thousand)
36. Selling and distribution expenses
Salaries, wages and other benefits - note 36.1 18,811 33,970 Travelling and conveyance 1,408 4,167 Telephone, telex and postage 1,437 3,120 Stationery, printing and periodicals 284 976 Rent, rates and taxes - note 36.2 7,157 12,723 Repairs and maintenance 793 2,635 Insurance 706 955 Vehicle running expenses 1,760 4,237 Entertainment 293 1,507 Advertisement and sale promotion 78,738 67,138 Depreciation on operating fixed assets - note 22.1.3 4,126 1,975 Depreciation on assets subject to finance lease - note 23.1 13,181 17,125 Transportation and freight 319,387 120,060 Utilities 171 455 Technical services 92 1,005 CERs share of Mitsubishi Corporation, Japan 44,988 25,026 Others 2,073 1,976
- note 36.3 495,405 299,050

67Annual Report
for the year ended December 31, 2013
2013 2012 (Rupees in thousand)
36.1 Salaries, wages and other benefits
Salaries, wages and other benefits include following in respect of gratuity: Current service cost 7,992 6,637 Interest cost for the year 3,413 2,698 Expected return on plan assets (2,432) (1,984) Past service cost - 165 Less: amount charged to related party (7,796) (7,348)
1,177 168 In addition to the above, salaries, wages and other benefits include Rs 8.234 million (2012: Rs 7.742 million) and Rs
4.739 million (2012: Rs 3.999 million) in respect of provident fund contribution by the company and accumulating compensated absences respectively.
36.2 Includes operating lease rentals amounting to Rs 17.502 million (2012: Rs 12.523 million). 36.3 Includes amount of Rs 27.045 million (2012: Rs 36.781 million) which represents common costs charged to the
company by its related party, FATIMA as per the Expense Sharing Agreement. Also included is an amount of Rs 345.887 million (2012: Rs 425.150 million) which represents common costs charged by the company to its related party, FATIMA as per the Expense Sharing Agreement.
2013 2012 (Rupees in thousand)
37. Finance cost
Interest/mark up on: - Listed TFCs - secured 28,686 329,864 - PPTFCs - secured 331,551 633,526 - Finance leases 3,845 12,478 - Share deposit money from related party - note 37.1 - 14,583 - Short term borrowings - secured - note 37.2 578,432 712,789 - Short term borrowing from related party - note 37.3 - 17,429 - Long term loans - secured 383,436 589,664 - Syndicated term finance - secured 47,203 230,502 - Short term loan from related party - secured - note 37.3 147,148 - Loan arrangement fees and other charges 6,072 22,385 Acceptance commission on letter of credit 44,369 37,378 Bank charges 8,697 9,445
1,579,439 2,610,043
37.1 This relates to Fazal Cloth Mills Limited. 37.2 Includes interest expense of Rs 42.860 million (2012: Rs 51.835 million) on account of running finance facility
availed from Summit Bank Limited, a related party. 37.3 This relates to FATIMA.
2013 2012 (Rupees in thousand)
38. Other expenses
Workers’ welfare fund - 68,084 Donations - note 38.1 152,900 10,290 Exchange loss 228,768 139,757
381,668 218,131
38.1 Includes Rs 150 million (2012: 5.640 million) donated to Mukhtar A. Sheikh Trust, a related party.

68 Pakarab Fertilizers Limited
Notes to and forming part of the Financial Statementsfor the year ended December 31, 2013
2013 2012 (Rupees in thousand)
39. Other income
Income from financial assets:
Income on bank deposits - note 39.1 29,331 28,032 Income from FATIMA, a related party: - Interest income on long term loan (from STFF) - 221,792 - Interest income on long term loan - 313,515 - Interest income on short term loan - 27,229 - Interest income on preference dividend receivable 24,147 94,017 - Accrued dividend on preference shares - 194,067 Gain on conversion of preference shares - 455,400 Unrealised gain on investment held to maturity 3,728 3,332 Mark-up on credit sale of fertilizers 388 5,956 Gain on disposal of short-term investment 2,808 - Gain on derivative financial instruments 2,217 2,929
62,619 1,346,269 Income from non-financial assets:
Rental income - note 39.2 45,517 46,587 Profit on disposal of operating fixed assets 42,372 18,238 Scrap sales and sundry income 57,300 24,387 Gain on recovery of chemical catalysts - 9,468 Provisions and unclaimed balances written back 3,861 81,444 Income from biological laboratory 3,481 2,173 Excess insurance premium refunded 45,431 -
197,962 182,297
260,581 1,528,566
39.1 Includes interest income of Rs 13.282 million (2012: Rs 14.520 million) on account of saving account with Summit Bank Limited, a related party.
39.2 Includes rental income of Rs 31.511 million (2012: Rs 31.741 million) for vehicles in use of FATIMA, a related party
as referred to in note 23.2 to these financial statements.
2013 2012 (Rupees in thousand)
40. Taxation
Current - For the year 24,555 73,828 - Prior years - (870,872)
24,555 (797,044) Deferred - note 13 (997,350) 141,296
(972,795) (655,748) The provision for current taxation represents minimum tax under section 113 of the Income Tax Ordinance, 2001 on
turnover from local sales. In addition to this, it includes tax on rental income which is full and final discharge of company’s tax liability in respect of income arising from such source.
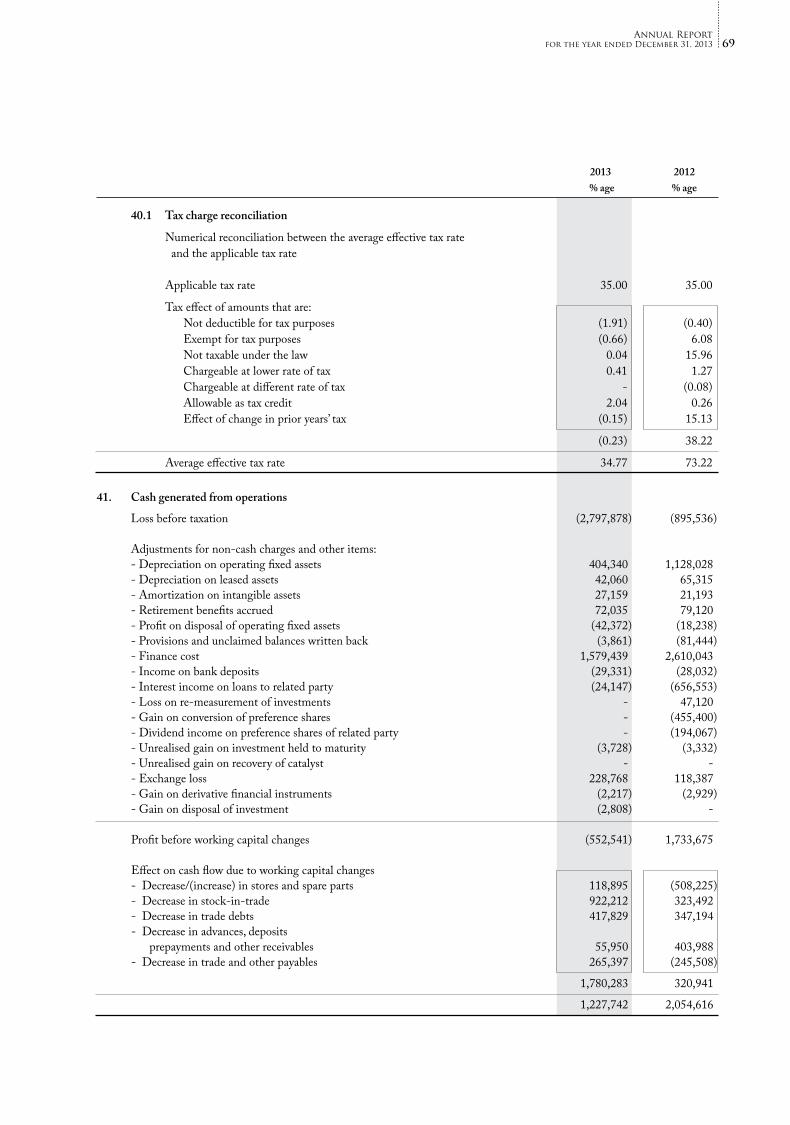
69Annual Report
for the year ended December 31, 2013
2013 2012 % age % age
40.1 Tax charge reconciliation
Numerical reconciliation between the average effective tax rate and the applicable tax rate Applicable tax rate 35.00 35.00
Tax effect of amounts that are: Not deductible for tax purposes (1.91) (0.40) Exempt for tax purposes (0.66) 6.08 Not taxable under the law 0.04 15.96 Chargeable at lower rate of tax 0.41 1.27 Chargeable at different rate of tax - (0.08) Allowable as tax credit 2.04 0.26 Effect of change in prior years’ tax (0.15) 15.13
(0.23) 38.22
Average effective tax rate 34.77 73.22
41. Cash generated from operations
Loss before taxation (2,797,878) (895,536) Adjustments for non-cash charges and other items: - Depreciation on operating fixed assets 404,340 1,128,028 - Depreciation on leased assets 42,060 65,315 - Amortization on intangible assets 27,159 21,193 - Retirement benefits accrued 72,035 79,120 - Profit on disposal of operating fixed assets (42,372) (18,238) - Provisions and unclaimed balances written back (3,861) (81,444) - Finance cost 1,579,439 2,610,043 - Income on bank deposits (29,331) (28,032) - Interest income on loans to related party (24,147) (656,553) - Loss on re-measurement of investments - 47,120 - Gain on conversion of preference shares - (455,400) - Dividend income on preference shares of related party - (194,067) - Unrealised gain on investment held to maturity (3,728) (3,332) - Unrealised gain on recovery of catalyst - - - Exchange loss 228,768 118,387 - Gain on derivative financial instruments (2,217) (2,929) - Gain on disposal of investment (2,808) - Profit before working capital changes (552,541) 1,733,675 Effect on cash flow due to working capital changes - Decrease/(increase) in stores and spare parts 118,895 (508,225) - Decrease in stock-in-trade 922,212 323,492 - Decrease in trade debts 417,829 347,194 - Decrease in advances, deposits prepayments and other receivables 55,950 403,988 - Decrease in trade and other payables 265,397 (245,508)
1,780,283 320,941
1,227,742 2,054,616

70 Pakarab Fertilizers Limited
Notes to and forming part of the Financial Statementsfor the year ended December 31, 2013
2013 2012 (Rupees in thousand)
42. Cash and cash equivalents
Short term borrowings - note 16 (4,736,195) (5,814,085) Cash and bank balances - note 32 159,835 993,957
(4,576,360) (4,820,128)
43. Remuneration of Chief Executive, Directors and Executives
43.1 The aggregate amount charged in the financial statements for the year for remuneration, including certain benefits, to the Chief Executive, Directors and Executives of the company is as follows:
Chief Executive Directors Executives
2013 2012 2013 2012 2013 2012
(Rupees in thousand)
Short term employee benefits
Managerial remuneration - 11,909 6,000 17,672 248,811 229,725 Housing rent - 5,311 - 5,307 96,937 105,459 Utilities - 4,164 - 2,637 21,542 23,434 Conveyance - - 240 - 21,542 23,456 Medical expenses - 21 - 8 10,074 12,425 Leave passage - - 1,000 - 34,901 36,536 Club expenses - 3,804 - 535 - - Others - - - - 6,650 6,921
- 25,209 7,240 26,159 440,457 437,956 Post employment benefits
Contribution to provident and gratuity funds - - - - 36,862 40,666
Other long term benefits
Accumulating compensated absences - - - - 35,334 33,222
- 25,209 7,240 26,159 512,653 511,844 Number of persons 1 1 2 2 202 199
43.2 The company also provides the chief executive, directors and some of its executives with company maintained cars, travel facilities and club membership.
44. Transactions with related parties
The related parties comprise subsidiary, associated undertakings, other related parties, key management personnel and post employment benefit plans. The company in the normal course of business carries out transactions with various related parties. Amounts due from and due to related parties are shown under receivables and payables and remuneration of the key management personnel is disclosed in note 43. Significant related party transactions have been disclosed in respective notes in these financial statements except for the following:

71Annual Report
for the year ended December 31, 2013
2013 2012 (Rupees in thousand)
Relationship with the company Nature of transactions
i. Subsidiary Purchase of goods 92,169 54,201 ii. Associated undertakings Sale of goods and services 178,758 339,224 Purchase of goods 51,780 - iii. Post employment benefit plans Expense charged in respect of 65,707 61,834 retirement benefit plans
2013 2012
45. Capacity and production
Urea
Rated production capacity M. Tons 92,400 92,400 Actual urea produced M. Tons 2,262 - The low production of urea is due to shortage of natural gas and periodical maintenance.
Nitro Phosphate (NP)
Rated production capacity M. Tons 304,500 304,500 Actual NP produced M. Tons 48,382 75,732 The low production of NP is due to shortage of natural gas and periodical maintenance.
Calcium Ammonium Nitrate (CAN)
Rated production capacity M. Tons 450,000 450,000 Actual CAN produced M. Tons 55,419 100,302 The low production of CAN is due to shortage of natural gas and periodical maintenance.
46. Disclosures relating to Provident Fund
The company operates two provident funds: (i) Employees’ Provident Fund Trust Lahore (ii) Employees’ Provident Fund Trust Multan The following information is based on the audited financial statements of the Funds as at June 30, 2013 and 2012:
2013 2012 (Rupees in thousand)
Size of the Fund - total assets 297,775 236,914 Cost of investments made 220,290 197,964 Percentage of investments made 79% 88% Fair value of investments 235,980 207,910
Break up of investments
Special accounts in a scheduled bank 202,290 173,964 Mutual funds - listed 33,690 33,946

72 Pakarab Fertilizers Limited
Notes to and forming part of the Financial Statementsfor the year ended December 31, 2013
2013 2012 % age of size of the Fund
Break up of investments
Special accounts in a scheduled bank 68% 73% Mutual funds - listed 11% 14% Investments out of Provident Funds have been made in accordance with the provisions of section 227 of the Companies
Ordinance, 1984 and the rules formulated for this purpose.
47. Financial risk management
47.1 Financial risk factors
The company is exposed to a variety of financial risks: market risk (including currency risk, other price risk and interest rate risk), credit risk and liquidity risk. The company’s overall risk management programme focuses on the unpredictability of financial markets and seeks to minimise potential adverse effects on the financial performance.
Risk management is carried out by the company’s Board of Directors (the Board). The company’s finance department
evaluates and hedges financial risks. The Board provides written principles for overall risk management, as well as written policies covering specific areas, such as foreign exchange risk, interest rate risk, credit risk, use of derivative financial instruments and non-derivative financial instruments, and investment of excess liquidity.
a) Market risk
i) Currency risk
Currency risk is the risk that the fair value or future cash flows of a financial instrument will fluctuate because of changes in foreign exchange rates. Currency risk arises mainly from future commercial transactions or receivables and payables that exist due to transactions in foreign currencies.
The company is exposed to currency risk arising from various currency exposures, primarily with respect to the
United States Dollar (USD) and Euro. Currently, the company’s foreign exchange risk exposure is restricted to bank balances and amounts receivable from/payable to the foreign entities.
At December 31, 2013 if the Rupee had weakened/strengthened by 5% against the USD with all other
variables held constant, the impact on pre tax loss for the year would have been Rs 120.402 million (2012: Rs 103.504 million) higher/lower, mainly as a result of exchange losses/gains on translation of USD denominated financial instruments.
At December 31, 2013 if the Rupee had weakened/strengthened by 5% against the Euro with all other
variables held constant, the impact on pre tax loss for the year would have been Rs 2.591 million (2012: Rs 19.795 million) lower/higher, mainly as a result of exchange gains/losses on translation of Euro denominated financial instruments.
ii) Other price risk
Other price risk represents the risk that the fair value or future cash flows of a financial instrument will fluctuate because of changes in market prices (other than those arising from interest rate risk or currency risk), whether those changes are caused by factors specific to the individual financial instrument or its issuer, or factors affecting all similar financial instruments traded in the market. The company is not materially exposed to equity price risk since there are no significant investments in equity instruments traded in the market either classified as available-for-sale or at fair value through profit or loss at the reporting date. The company is also not exposed to commodity price risk since it does not hold any financial instrument based on commodity prices.

73Annual Report
for the year ended December 31, 2013
iii) Interest rate risk
Interest rate risk represents the risk that the fair value or future cash flows of a financial instrument will fluctuate because of changes in market interest rates.
The company’s interest rate risk arises from long term finances, lease liabilities, short term borrowings,
derivative financial instruments and dividend receivable on preference shares. Borrowings obtained and loans provided at variable rates expose the company to cash flow interest rate risk.
At the balance sheet date, the interest rate profile of the company’s significant interest bearing financial
instruments was:
2013 2012 (Rupees in thousand)
Fixed rate instruments:
Financial assets
Investment 34,409 30,681 Trade debts 26,140 101,503 Bank balances - saving accounts 64,125 698,633
124,674 830,817
Financial liabilities - -
Net exposure 124,674 830,817
Floating rate instruments:
Financial assets
Dividend receivable on preference shares - 1,337,214 Financial liabilities
Long term finances 4,559,277 9,351,891 Liabilities against assets subject to finance lease 38,811 113,189 Short term loan from related party 3,000,000 - Short term borrowings 4,736,195 5,814,085 Derivative financial instruments - 714
12,334,283 15,279,879
Net exposure (12,334,283) (13,942,665)
Fair value sensitivity analysis for fixed rate instruments
The company does not account for any fixed rate financial assets and liabilities at fair value through profit or loss. Therefore, a change in interest rate at the balance sheet date would not affect profit or loss of the company.
Cash flow sensitivity analysis for variable rate instruments
If interest rates on variable rate financial instruments, at the year end date, fluctuates by 1% higher/lower with all other variables held constant, pre tax loss for the year would have been Rs 123.345 million (2012: Rs 152.687 million) higher/lower, mainly as a result of higher/lower interest expense on floating rate instruments.

74 Pakarab Fertilizers Limited
Notes to and forming part of the Financial Statementsfor the year ended December 31, 2013
b) Credit risk
Credit risk represents the risk of financial loss being caused if counter party fails to discharge an obligation. Credit risk of the company arises from cash and cash equivalents and deposits with banks and financial institutions, as
well as credit exposures to customers, including outstanding receivables and committed transactions. The management assesses the credit quality of the customers, taking into account their financial position, past experience and other factors. Individual risk limits are set based on internal or external ratings in accordance with limits set by the Board. The utilisation of credit limits is regularly monitored and major sales to customers are settled in cash. For banks and financial institutions, only independently rated parties with a strong credit rating are accepted.
The company monitors the credit quality of its financial assets with reference to historical performance of such assets
and available external credit ratings. The carrying values of financial assets which are neither past due nor impaired are as under:
2013 2012 (Rupees in thousand)
Long term investments 294,550 261,910 Security deposits 36,218 60,409 Trade debts 98,992 104,097 Advances, deposits and other receivables 157,647 124,337 Short term investments - 1,084,160 Cash and bank balances 159,835 993,957
747,242 2,628,870 The company’s exposure to credit risk is limited to the carrying amount of unsecured trade receivables and bank
balances. The ageing analysis of trade receivable balances is as follows:
2013 2012 (Rupees in thousand)
Neither past due nor impaired (upto 90 days) 98,992 104,097 Past due but not impaired: 91 to 180 days 19,737 19,985 181 to 270 days 8,349 166,823 271 to 360 days 5,281 97,943 above 360 days 20,804 182,144
54,171 466,895
153,163 570,992
The management estimates the recoverability of trade receivables on the basis of financial position and past history of its customers based on the objective evidence that it will not receive the amount due from the particular customer. A provision for doubtful debts is established when there is objective evidence that the company will not be able to collect all the amount due according to the original terms of the receivable. Significant financial difficulties of the debtors, probability that the debtor will enter bankruptcy or financial reorganisation, and default or delinquency in payments are considered indicators that the trade debt is impaired. The provision is recognised in the profit and loss account. The provision is written off by the company when it expects that it cannot recover the balance due. Any subsequent repayments in relation to amount written off, are credited directly to profit and loss account.

75Annual Report
for the year ended December 31, 2013
The credit quality of company’s bank balances can be assessed with reference to external credit ratings as follows:
2013 2012 Rating Rating (Rupees in thousand) Short term Long term Agency
Al Baraka Islamic Bank Limited A1 A PACRA 235 10,892 Allied Bank Limited A1+ AA+ PACRA 37 604,087 Summit Bank Limited A-3 A- JCR-VIS 3,869 21,686 Askari Bank Limited A1+ AA PACRA 3 3 Bank Alfalah Limited A1+ AA PACRA 5 62 Dubai Islamic Bank Limited A-1 A JCR-VIS 73 73 Faysal Bank Limited A1+ AA PACRA 3,345 11,799 Habib Bank Limited A-1+ AAA JCR-VIS 75,537 250,549 Habib Metropolitan Bank Limited A1+ AA+ PACRA 28 100 MCB Bank Limited A1+ AAA PACRA 9,284 - Meezan Bank Limited A-1+ AA JCR-VIS 4,125 5,472 National Bank of Pakistan A-1+ AAA JCR-VIS 468 3,827 Silkbank Limited A-2 A- JCR-VIS - 1 Standard Chartered Bank (Pakistan) Limited A1+ AAA PACRA 4,673 11,248 United Bank Limited A-1+ AA+ JCR-VIS 46,123 44,978 Zarai Taraqiati Bank Limited A-2 A JCR-VIS 56 55 Bank Islami Pakistan Limited A1 A PACRA 421 19,141 Sindh Bank Limited A-1+ AA- JCR-VIS 5,635 3,827 Burj Bank Limited A-1 A JCR-VIS 1,355 1,059
155,272 988,859 Due to the company’s long standing business relationships with these counterparties and after giving due consideration
to their strong financial standing, management does not expect non-performance by these counter parties on their obligations to the company. Accordingly, the credit risk is minimal.
c) Liquidity risk
Liquidity risk is the risk that an entity will encounter difficulty in meeting obligations associated with financial liabilities.
The company’s approach to managing liquidity is to ensure that, as far as possible, it always has sufficient liquidity
to meet its liabilities when due, under both normal and stressed conditions, without incurring unacceptable loss or risking damage to the company’s reputation.

76 Pakarab Fertilizers Limited
Notes to and forming part of the Financial Statementsfor the year ended December 31, 2013
The following are the contractual maturities of financial liabilities as at December 31, 2013 and December 31, 2012:
At December 31, 2013 Carrying Less than One to More than
amount one year five years five years (Rupees in thousand)
Long term finances 4,559,277 3,093,206 1,466,071 - Import bill payable 2,524,800 1,424,800 1,100,000 - Liabilities against assets subject to finance lease 38,811 38,811 - - Long term deposits 47,145 - - 47,145 Short term loan from related party 3,000,000 3,000,000 - - Short term borrowings 4,736,195 4,736,195 - - Trade and other payables 2,658,247 2,658,247 - - Accrued finance cost 336,585 336,585 - -
17,901,060 15,287,844 2,566,071 47,145
At December 31, 2012 Carrying Less than One to More than
amount one year five years five years (Rupees in thousand) Long term finances 9,351,891 4,792,612 4,559,279 - Import bill payable 2,330,400 842,000 1,488,400 - Liabilities against assets subject to finance lease 113,189 63,511 49,678 - Payable against mining rights 21,000 21,000 - - Long term deposits 46,180 - - 46,180 Short term borrowings 5,814,085 5,814,085 - - Derivative financial instruments 714 714 Trade and other payables 1,996,874 1,996,874 - - Accrued finance cost 365,673 365,673 - - Dividend payable 1,078,200 1,078,200 - -
21,118,206 14,974,669 6,097,357 46,180 47.2 Fair value estimation
The table below analyses financial instruments carried at fair value, by valuation method. The different levels have been defined as follows:
- Quoted prices (unadjusted) in active markets for identical assets or liabilities (level 1) - Inputs other than quoted prices included within level 1 that are observable for the asset or liability, either directly
(that is, as prices) or indirectly (that is, derived from prices) (level 2). - Inputs for the asset or liability that are not based on observable market data (that is, unobservable inputs) (level 3).

77Annual Report
for the year ended December 31, 2013
The following table presents the company’s assets and liabilities that are measured at fair value at December 31, 2013.
Level 1 Level 2 Level 3 Total (Rupees in thousand)
Available-for-sale
Ordinary shares of RSL - - 196,137 196,137 Total assets - - 196,137 196,137 Total liabilities - - - - The following table presents the company’s assets and liabilities that are measured at fair value at December 31, 2012.
Level 1 Level 2 Level 3 Total (Rupees in thousand)
At fair value through profit or loss
Ordinary shares of Wateen Telecom Limited 5,960 - - 5,960 Available-for-sale Ordinary shares of RSL - - 23,500 23,500 Total assets 5,960 - 23,500 29,460
At fair value through profit or loss Derivative financial instruments - 714 - 714 Total liabilities - 714 - 714
The fair value of financial instruments traded in active markets is based on quoted market prices at the balance sheet date. A market is regarded as active if quoted prices are readily and regularly available from an exchange, dealer, broker, industry group, pricing service, or regulatory agency, and those prices represent actual and regularly occurring market transactions on an arm’s length basis. The quoted market price used for financial assets held by the company is the current bid price. These instruments are included in Level 1.
The fair value of financial instruments that are not traded in an active market is determined by using valuation
techniques. These valuation techniques maximise the use of observable market data where it is available and rely as little as possible on entity specific estimates. If all significant inputs required to fair value an instrument are observable, the instrument is included in Level 2.
If one or more of the significant inputs is not based on observable market data, the instrument is included in Level 3.
Specific valuation techniques used to value financial instruments include: - Quoted market prices or dealer quotes for similar instruments. - The fair value of interest rate swaps is calculated as the present value of the estimated future cash flows based on
observable yield curves. - Other techniques, such as discounted cash flow analysis, are used to determine fair value for the remaining financial
instruments.

78 Pakarab Fertilizers Limited
Notes to and forming part of the Financial Statementsfor the year ended December 31, 2013
The carrying value less impairment provision of trade and other receivables, and payables are assumed to approximate their fair values. The fair value of financial liabilities for disclosure purposes is estimated by discounting the future contractual cash flows at the current market interest rate that is available to the company for similar financial instruments. The carrying values of all financial assets and liabilities reflected in the financial statements approximate their fair values.
47.3 Financial instruments by categories
Available for Assets at Held to Loans and Total sale fair value maturity receivables through profit or loss
As at December 31, 2013 (Rupees in thousand)
Assets as per balance sheet
Security deposits - - - 36,218 36,218 Trade debts - - - 153,163 153,163 Advances, deposits and other receivables - - - 156,228 156,228 Investments 196,137 - 34,409 64,004 294,550 Cash and bank balances - - - 159,835 159,835
196,137 - 34,409 569,448 799,994
Financial liabilities at amortized cost (Rupees in As at December 31, 2013 thousand)
Liabilities as per balance sheet
Long term finances 4,559,277 Import bill payable 2,524,800 Liabilities against assets subject to finance lease 38,811 Long term deposits 47,145 Short term loan from related party 3,000,000 Short term borrowings 4,736,195 Trade and other payables 2,658,247 Accrued finance cost 336,585
17,901,060

79Annual Report
for the year ended December 31, 2013
Available for Assets at Held to Loans and Total sale fair value maturity receivables through profit or loss
As at December 31, 2012 (Rupees in thousand)
Assets as per balance sheet
Security deposits - - - 60,409 60,409 Trade debts - - - 570,992 570,992 Advances, deposits and other receivables - - - 3,199,564 3,199,564 Investments 23,500 5,960 30,681 207,729 267,870 Cash and bank balances - - - 993,957 993,957
23,500 5,960 30,681 5,032,651 5,092,792
Financial Financial liabilities at liabilities at fair value amortized through profit cost or loss Total At December 31, 2012 (Rupees in thousand)
Liabilities as per balance sheet
Long term finances - 9,351,891 9,351,891 Import bill payable - 2,330,400 2,330,400 Liabilities against assets subject to finance lease - 113,189 113,189 Payable against mining rights - 21,000 21,000 Long term deposits - 46,180 46,180 Short term borrowings - 5,814,085 5,814,085 Derivative financial instruments 714 - 714 Trade and other payables - 1,996,874 1,996,874 Accrued finance cost - 365,673 365,673 Dividend payable - 1,078,200 1,078,200
714 21,117,492 21,118,206
47.4 Capital management
The company’s objectives when managing capital are to safeguard the company’s ability to continue as a going concern in order to provide returns for shareholders and benefits for other stakeholders and to maintain an optimal capital structure to reduce the cost of capital. In order to maintain or adjust the capital structure, the company may adjust the amount of dividends paid to shareholders, return capital to shareholders through repurchase of shares, issue new shares or sell assets to reduce debt. Consistent with others in the industry and the requirements of the lenders, the company monitors the capital structure on the basis of gearing ratio. This ratio is calculated as net debt divided by total capital employed. Net debt is calculated as total borrowings (including current and non-current borrowings) less cash and cash equivalents. Total capital includes equity as shown in the balance sheet plus net debt. The gearing ratios as at December 31, 2013 and 2012 were as follows:

80 Pakarab Fertilizers Limited
Notes to and forming part of the Financial Statementsfor the year ended December 31, 2013
2013 2012 (Rupees in thousand)
Borrowings - note 8, 14 & 15 7,559,277 9,351,891 Less: Cash and cash equivalents - note 42 (4,576,360) (4,820,128)
Net debt 12,135,637 14,172,019 Total equity (includes surplus on revaluation of operating fixed assets) 18,084,193 19,896,491 Gearing ratio Percentage 40% 42%
2013 2012
48. Number of employees
Total number of employees as at December 31 766 873
Average number of employees during the year 825 913 49. Date of authorization for issue
These financial statements were authorized for issue on March 27, 2014 by the Board of Directors of the company.
Chief Executive Director

81Pakarab Group | Consolidated Annual Report
for the year ended December 31, 2013
Consolidated Financial Statements ofPakarab Fertilizers Limited for the year ended December 31, 2013

82 Pakarab Fertilizers Limited

83Pakarab Group | Consolidated Annual Report
for the year ended December 31, 2013
Auditors’ Report to the Members
We have audited the annexed consolidated financial statements comprising consolidated balance sheet of Pakarab Fertilizers Limited (the holding company) and its subsidiary company (hereinafter referred to as ‘the Group’) as at December 31, 2013 and the related consolidated profit and loss account, consolidated statement of comprehensive income, consolidated statement of changes in equity and consolidated cash flow statement together with the notes forming part thereof, for the year then ended. We have also expressed separate opinions on the financial statements of Pakarab Fertilizers Limited and its subsidiary company. These financial statements are the responsibility of the holding company’s management. Our responsibility is to express an opinion on these financial statements based on our audit.
Our audit was conducted in accordance with the International Standards on Auditing and accordingly included such tests of accounting records and such other auditing procedures as we considered necessary in the circumstances.
As stated in note 4.1 to the annexed consolidated financial statements, the group has changed its accounting policies on initial application of standards, amendments or interpretations to existing standards.
In our opinion, the consolidated financial statements present fairly the financial position of Pakarab Fertilizers Limited and its subsidiary company (the Group) as at December 31, 2013 and the results of their operations for the year then ended.
A.F. Ferguson & Co.Chartered AccountantsLahore: March 27, 2014
Engagement Partner: Muhammad Masood

84 Pakarab Fertilizers Limited
2013 2012 Note (Rupees in thousand)
EQUITY AND LIABILITIES SHARE CAPITAL AND RESERVES
Authorised share capital 1,000,000,000 (2012: 1,000,000,000) ordinary shares of Rs 10 each 10,000,000 10,000,000 Issued, subscribed and paid up share capital 450,000,000 (2012: 450,000,000) ordinary shares of Rs 10 each 5 4,500,000 4,500,000 Reserves 6 1,695,066 3,423,729
6,195,066 7,923,729 SURPLUS ON REVALUATION OF OPERATING FIXED ASSETS 7 11,884,336 11,964,238 NON-CURRENT LIABILITIES
Long term finances - secured 8 1,608,500 4,772,924 Import bill payable - secured 9 1,100,000 1,488,400 Liabilities against assets subject to finance lease 10 - 49,678 Long term deposits 11 47,145 46,180 Deferred liabilities 12 126,472 114,840 Deferred taxation 13 9,927,247 10,915,238
12,809,364 17,387,260 CURRENT LIABILITIES
Current portion of long term liabilities 14 3,203,231 4,912,729 Short term loan from related party - secured 15 3,000,000 - Short term borrowings - secured 16 5,096,459 6,006,224 Payable to Privatization Commission of Pakistan 17 2,197,901 2,197,901 Derivative financial instruments 18 - 714 Trade and other payables 19 4,043,199 3,373,049 Accrued finance cost 20 346,031 371,016 Dividend payable - 1,078,200 Bank overdraft 21 126 -
17,886,947 17,939,833 CONTINGENCIES AND COMMITMENTS
22 48,775,713 55,215,060
The annexed notes 1 to 51 form an integral part of these financial statements.
Chief Executive
Consolidated Balance Sheetas at December 31, 2013

85Pakarab Group | Consolidated Annual Report
for the year ended December 31, 2013
2013 2012 Note (Rupees in thousand)
ASSETS NON-CURRENT ASSETS Property, plant and equipment 23 37,555,023 37,710,362 Assets subject to finance lease 24 50,631 121,126 Intangible assets 25 144,407 149,073 Goodwill 26 3,305,163 3,305,163 Long term investments 27 98,413 93,277 Security deposits 36,218 60,409
41,189,855 41,439,410 CURRENT ASSETS Stores and spare parts 28 2,910,523 3,026,075 Stock-in-trade 29 957,883 1,906,583 Trade debts 30 334,526 674,446 Advances, deposits, prepayments and other receivables 31 3,217,525 6,089,944 Short term investments 32 - 1,084,160 Cash and bank balances 33 165,401 994,442
7,585,858 13,775,650
48,775,713 55,215,060
Director
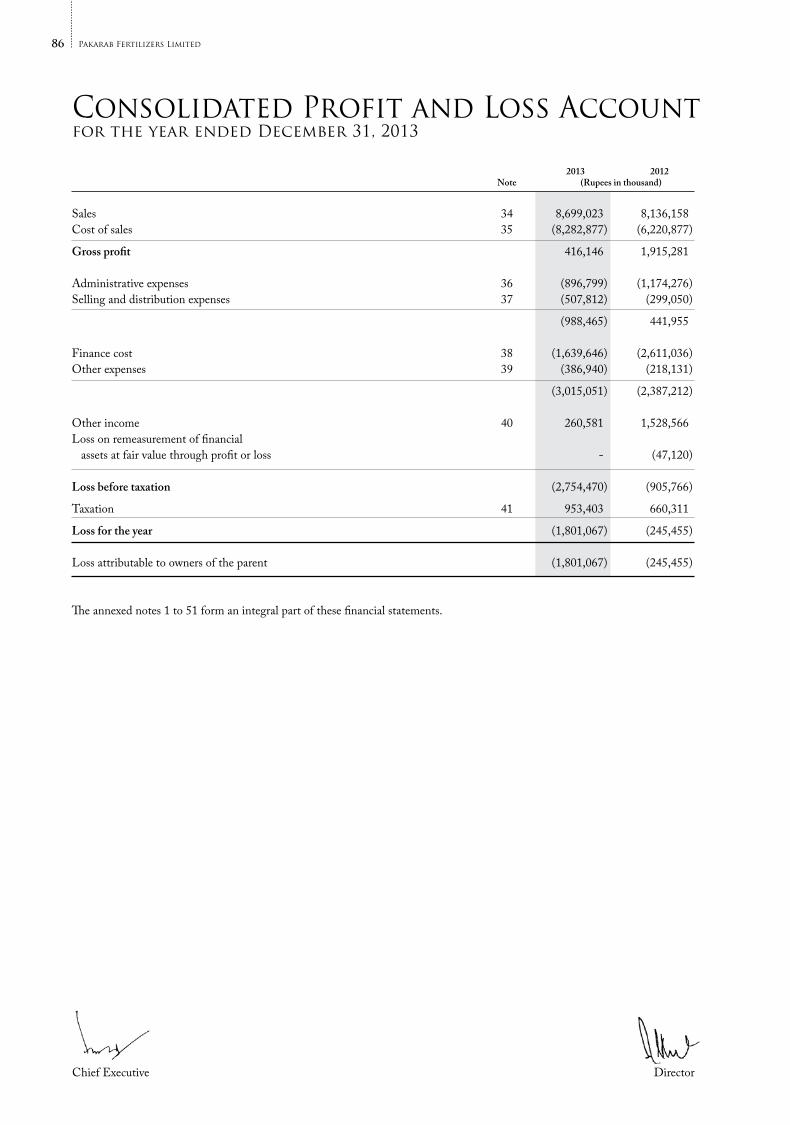
86 Pakarab Fertilizers Limited
Chief Executive Director
Consolidated Profit and Loss Accountfor the year ended December 31, 2013
2013 2012 Note (Rupees in thousand)
Sales 34 8,699,023 8,136,158 Cost of sales 35 (8,282,877) (6,220,877)
Gross profit 416,146 1,915,281 Administrative expenses 36 (896,799) (1,174,276)Selling and distribution expenses 37 (507,812) (299,050)
(988,465) 441,955 Finance cost 38 (1,639,646) (2,611,036)Other expenses 39 (386,940) (218,131)
(3,015,051) (2,387,212) Other income 40 260,581 1,528,566 Loss on remeasurement of financial assets at fair value through profit or loss - (47,120) Loss before taxation (2,754,470) (905,766)
Taxation 41 953,403 660,311
Loss for the year (1,801,067) (245,455) Loss attributable to owners of the parent (1,801,067) (245,455)
The annexed notes 1 to 51 form an integral part of these financial statements.

87Pakarab Group | Consolidated Annual Report
for the year ended December 31, 2013
Chief Executive Director
Consolidated Statement of Comprehensive Incomefor the year ended December 31, 2013
2013 2012 (Rupees in thousand)
Loss for the year (1,801,067) (245,455) Other comprehensive income: Items that may be reclassified subsequently to profit or loss - - Items that will not be reclassified subsequently to profit or loss: Surplus on revaluation of operating fixed assets realised through incremental depreciation charged on related assets for the year 79,902 163,901
Remeasurement of post retirement benefit obligation (7,498) -
72,404 163,901 Other comprehensive income - net of tax 72,404 163,901 Total comprehensive loss for the year - net of tax (1,728,663) (81,554) Attributable to owners of the parent (1,728,663) (81,554)
The annexed notes 1 to 51 form an integral part of these financial statements.
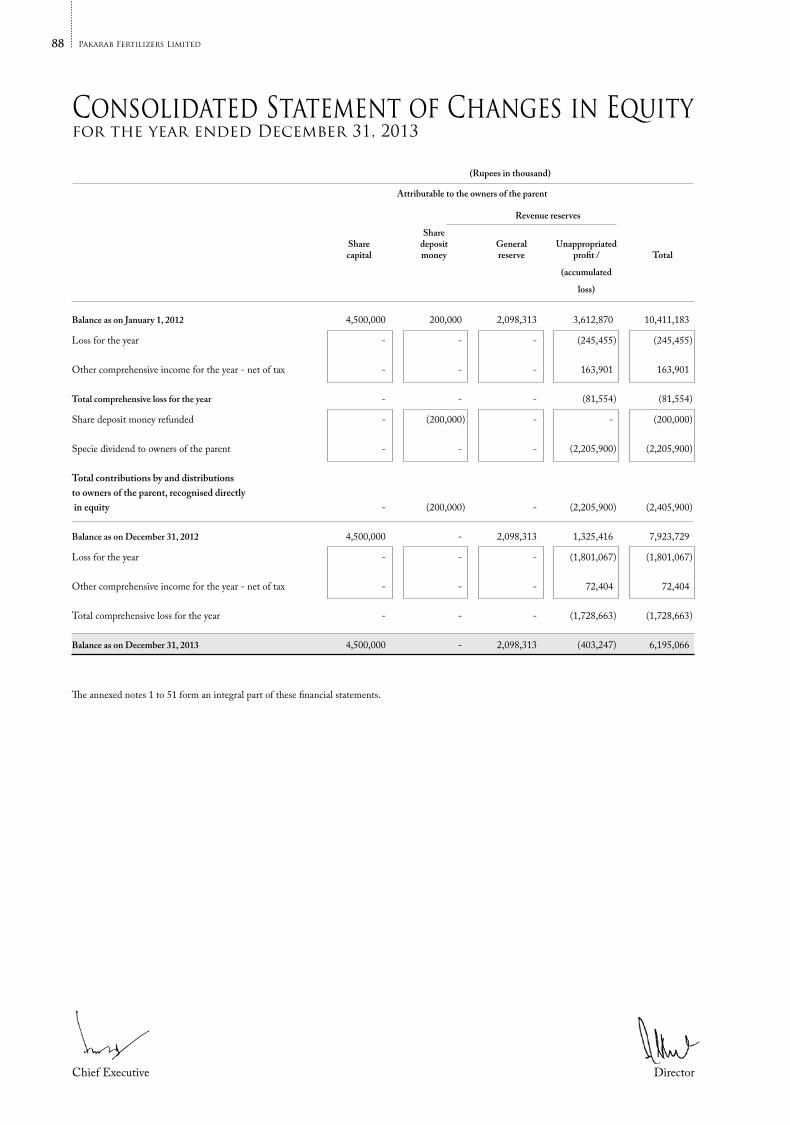
88 Pakarab Fertilizers Limited
(Rupees in thousand)
Attributable to the owners of the parent
Revenue reserves Share Share deposit General Unappropriated capital money reserve profit / Total
(accumulated
loss) Balance as on January 1, 2012 4,500,000 200,000 2,098,313 3,612,870 10,411,183
Loss for the year - - - (245,455) (245,455) Other comprehensive income for the year - net of tax - - - 163,901 163,901 Total comprehensive loss for the year - - - (81,554) (81,554)
Share deposit money refunded - (200,000) - - (200,000) Specie dividend to owners of the parent - - - (2,205,900) (2,205,900) Total contributions by and distributions to owners of the parent, recognised directly in equity - (200,000) - (2,205,900) (2,405,900) Balance as on December 31, 2012 4,500,000 - 2,098,313 1,325,416 7,923,729
Loss for the year - - - (1,801,067) (1,801,067) Other comprehensive income for the year - net of tax - - - 72,404 72,404 Total comprehensive loss for the year - - - (1,728,663) (1,728,663) Balance as on December 31, 2013 4,500,000 - 2,098,313 (403,247) 6,195,066
The annexed notes 1 to 51 form an integral part of these financial statements.
Chief Executive Director
Consolidated Statement of Changes in Equityfor the year ended December 31, 2013

89Pakarab Group | Consolidated Annual Report
for the year ended December 31, 2013
Chief Executive Director
Consolidated Cash Flow Statementfor the year ended December 31, 2013
2013 2012 Note (Rupees in thousand)
Cash flows from operating activities
Cash generated from operations 42 1,220,212 1,823,525 Finance cost paid (1,664,631) (2,917,841)Taxes paid (256,469) (260,259)Retirement benefits paid (67,930) (32,661)
Net cash outflow from operating activities (768,818) (1,387,236)
Cash flows from investing activities
Purchase of property, plant and equipment (273,138) (533,302)Purchase of intangible assets (22,493) (1,843)Security deposits 965 (11,369)Sale proceeds of property, plant and equipment disposed 75,006 64,648 Investments made (1,408) (62,596)Investments redeemed - 1,800,000 Sale proceeds of investment disposed 8,768 - Short term loan to related party - (1,300,000)Loans repaid by related party - 5,815,565 Interest received on receivable from related party 1,595,798 27,229 Preference dividend received from related party 1,337,214 824 Profit on bank deposits received 28,252 26,997 Net cash inflow from investing activities 2,748,964 5,826,153
Cash flows from financing activities
Repayment of redeemable capital (3,125,000) (3,825,000)Proceeds from long term loans acquired - 2,061,281 Proceeds from short term loan acquired from related party 3,000,000 - Repayment of long term loans (1,703,222) (3,551,418)Payment of liability against mining rights (21,000) - Share deposit money refunded - (200,000)Payment of finance lease liabilities (50,326) (88,092) Net cash outflow from financing activities (1,899,548) (5,603,229)
Net increase/(decrease) in cash and cash equivalents 80,598 (1,164,312)Cash and cash equivalents at the beginning of the year (5,011,782) (3,847,470)
Cash and cash equivalents at the end of the year 43 (4,931,184) (5,011,782)
The annexed notes 1 to 51 form an integral part of these financial statements.

90 Pakarab Fertilizers Limited
1. Legal status and nature of business
Pakarab Fertilizers Limited (the ‘parent company’) on April 12, 2011, incorporated a wholly owned subsidiary company, Reliance Sacks Limited (together, the ‘group’). The parent company is principally engaged in the manufacturing and sale of chemical fertilizers and generation and sale of Certified Emission Reductions (hereinafter collectively also referred to as the ‘fertilizers segment’) while the subsidiary company is principally engaged in the manufacturing and sale of polypropylene sacks, cloth and liners (hereinafter also referred to as the ‘sacks segment’). The sacks segment commenced commercial operations from January 2013.
2. Basis of preparation
2.1 These consolidated financial statements have been prepared in accordance with approved accounting standards as applicable in Pakistan. Approved accounting standards comprise of such International Financial Reporting Standards (IFRS) issued by the International Accounting Standards Board and Islamic Financial Accounting Standards (IFAS) issued by Institute of Chartered Accountants of Pakistan as are notified under the Companies Ordinance, 1984, provisions of and directives issued under the Companies Ordinance, 1984. Wherever the requirements of the Companies Ordinance, 1984 or directives issued by Securities and Exchange Commission of Pakistan differ with the requirements of IFRS or IFAS, the requirements of the Companies Ordinance, 1984 or the requirements of the said directives prevail.
2.2 Initial application of standards, amendments or an interpretation to existing standards
The following amendments to existing standards have been published that are applicable to the group’s financial statements covering annual periods, beginning on or after the following dates:
2.2.1 Standards, amendments and interpretations to approved accounting standards that are effective in current year
Certain standards, amendments and interpretations to approved accounting standards are effective for accounting periods beginning on January 1, 2013 but are considered not to be relevant or to have any significant effect on the group’s operations and are, therefore, not detailed in these financial statements except for the amendments as given below which have been fully explained in note 4.1 to these financial statements:
- Amendments to IAS 1, ‘Financial statement presentation’ regarding other comprehensive income, emphasizes on
the requirement for entities to group items presented in other comprehensive income (OCI) on the basis of whether they are potentially reclassifiable to profit or loss subsequently (reclassification adjustments). The application of the amendment has not affected the results or net assets of the group as it is only concerned with presentation and disclosures.
- IAS 19 (revised) ‘Employee Benefits’ has eliminated the corridor approach and requires to calculate finance cost
on net funding bases. The group has applied this change in accounting policy in accordance with IAS 8 ‘Accounting Policies, Changes in Accounting Estimates and Errors’ and recorded unrecognised actuarial losses net of taxes associated with retirement benefit plan.
2.2.2 Standards, amendments and interpretations to existing standards that are not yet effective and have not been early
adopted by the group
There are certain standards, amendments to the approved accounting standards and interpretations that are mandatory for the group’s accounting periods beginning on or after January 1, 2014 but are considered not to be relevant or to have any significant effect on the group’s operations and are, therefore, not detailed in these financial statements.
3. Basis of measurement
3.1 These financial statements have been prepared under the historical cost convention as modified by the revaluation of operating fixed assets and certain financial instruments at fair value and recognition of certain employee retirement benefits at present value.
3.2 Critical accounting estimates and judgments
The group’s significant accounting policies are stated in note 4. Not all of these significant policies require the management to make difficult, subjective or complex judgment or estimates. The following is intended to provide an understanding of the policies the management considers critical because of their complexity, judgment of estimation
Notes to and forming part of the Consolidated Financial Statementsfor the year ended December 31, 2013

91Pakarab Group | Consolidated Annual Report
for the year ended December 31, 2013
involved in their application and their impact on these financial statements. Estimates and judgments are continually evaluated and are based on historical experience, including expectations of future events that are believed to be reasonable under the circumstances. These judgments involve assumptions or estimates in respect of future events and the actual results may differ from these estimates.
a) Employee retirement benefits
The group uses the valuation performed by an independent actuary as the present value of its retirement benefit obligations. The valuation is based on assumptions as mentioned in note 4.4.
b) Provision for taxation
The group takes into account the current income tax law and the decisions taken by appellate authorities. Instances where the group’s view differs from the view taken by the income tax department at the assessment stage and where the group considers that its views on items of material nature is in accordance with law, the amounts are shown as contingent liabilities.
c) Useful lives and residual values of property, plant and equipment
The group reviews the useful lives and residual values of property, plant and equipment on regular basis. Any change in estimates in future years might affect the carrying amounts of the respective items of property, plant and equipment with a corresponding effect on the depreciation charge and impairment.
d) Estimated impairment of goodwill
The group tests annually whether goodwill has suffered any impairment, in accordance with the accounting policy stated in note 4.9. The recoverable amounts of cash-generating units have been determined based on value-in-use calculations. These calculations require the use of estimates (note 26).
e) Revaluation surplus on operating fixed assets
Certain operating fixed assets are carried under the revaluation model as per International Accounting Standard (‘IAS’) 16 ‘Property, Plant and Equipment’ as stated in note 4.5.1. Revaluation is carried out with sufficient regularity to ensure that the carrying amount of assets does not differ materially from their fair value. Revalued amount has been determined by an independent professional valuer on the basis of present market value (note 7).
3.3 Change in accounting estimate
During the year, the group’s management has carried out a comprehensive review of the expected pattern of consumption of the future economic benefits embodied in certain assets and as a result of this review, has revised its depreciation method for such assets. Previously, the group depreciated the plant and machinery, factory equipment (included in tools and other equipment) and catalysts of the fertilizers segment on the straight line method over their estimated useful lives. Now the group charges depreciation on these assets based on the units of production method over their estimated remaining useful lives. Such a change has been accounted for as a change in an accounting estimate in accordance with IAS 8 ‘Accounting Policies, Changes in Accounting Estimates and Errors’. Had there been no change in the accounting estimate, the loss before tax for the year ended December 31, 2013 would have been higher by Rs 656.331 million and carrying value of operating fixed assets as at that date would have been lower by the same amount. Consequently, due to the above change in accounting estimate, future profits before tax would reduce by Rs 656.331 million.
4. Significant accounting policies
The significant accounting policies adopted in the preparation of these financial statements are set out below. These policies have been consistently applied to all years presented, except for the change in accounting policy as explained in note 4.1.
4.1 Changes in accounting policies and disclosures
4.1.1 Amendment to IAS 1 ‘Presentation of Financial Statements’
The primary change resulting from this amendment is that the group has grouped items presented in ‘other comprehensive income’ on the basis of whether they are potentially reclassifiable to profit or loss subsequently (reclassification adjustments). Had there been no change in the aforementioned accounting, there would not have been any bifurcation of items appearing in the ‘other comprehensive income’.
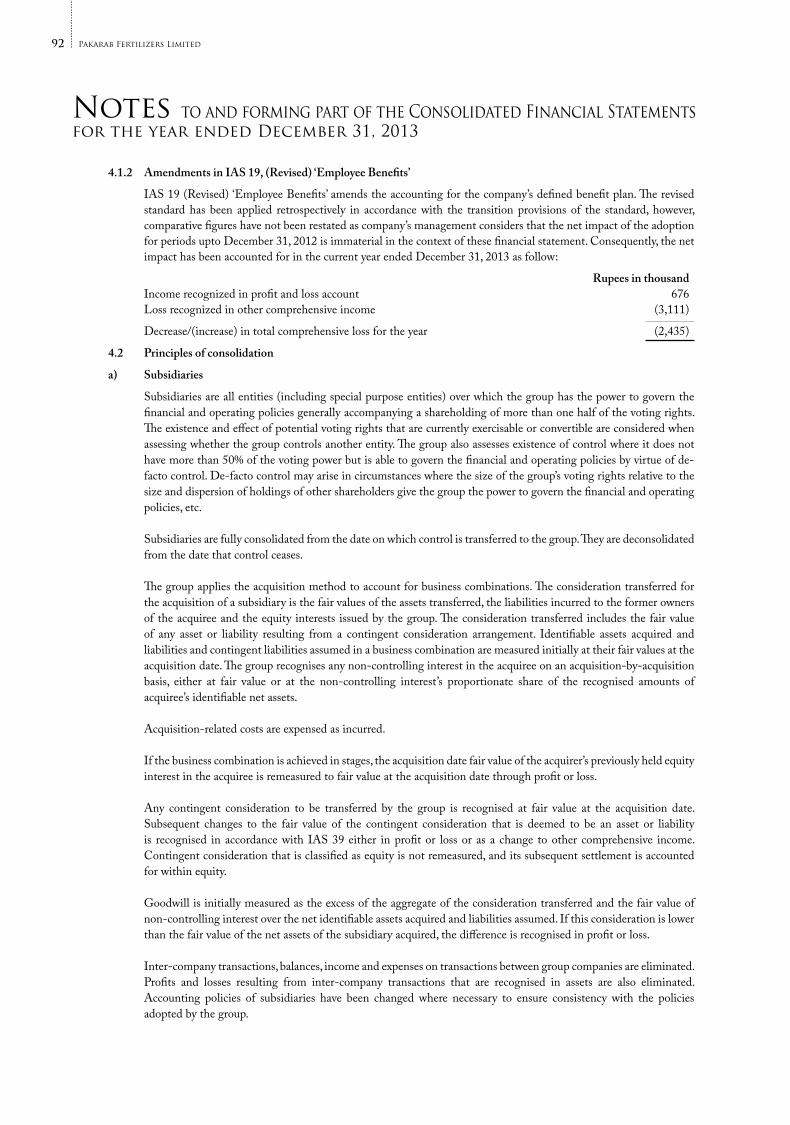
92 Pakarab Fertilizers Limited
4.1.2 Amendments in IAS 19, (Revised) ‘Employee Benefits’
IAS 19 (Revised) ‘Employee Benefits’ amends the accounting for the company’s defined benefit plan. The revised standard has been applied retrospectively in accordance with the transition provisions of the standard, however, comparative figures have not been restated as company’s management considers that the net impact of the adoption for periods upto December 31, 2012 is immaterial in the context of these financial statement. Consequently, the net impact has been accounted for in the current year ended December 31, 2013 as follow:
Rupees in thousand Income recognized in profit and loss account 676 Loss recognized in other comprehensive income (3,111)
Decrease/(increase) in total comprehensive loss for the year (2,435)
4.2 Principles of consolidation
a) Subsidiaries
Subsidiaries are all entities (including special purpose entities) over which the group has the power to govern the financial and operating policies generally accompanying a shareholding of more than one half of the voting rights. The existence and effect of potential voting rights that are currently exercisable or convertible are considered when assessing whether the group controls another entity. The group also assesses existence of control where it does not have more than 50% of the voting power but is able to govern the financial and operating policies by virtue of de-facto control. De-facto control may arise in circumstances where the size of the group’s voting rights relative to the size and dispersion of holdings of other shareholders give the group the power to govern the financial and operating policies, etc.
Subsidiaries are fully consolidated from the date on which control is transferred to the group. They are deconsolidated
from the date that control ceases. The group applies the acquisition method to account for business combinations. The consideration transferred for
the acquisition of a subsidiary is the fair values of the assets transferred, the liabilities incurred to the former owners of the acquiree and the equity interests issued by the group. The consideration transferred includes the fair value of any asset or liability resulting from a contingent consideration arrangement. Identifiable assets acquired and liabilities and contingent liabilities assumed in a business combination are measured initially at their fair values at the acquisition date. The group recognises any non-controlling interest in the acquiree on an acquisition-by-acquisition basis, either at fair value or at the non-controlling interest’s proportionate share of the recognised amounts of acquiree’s identifiable net assets.
Acquisition-related costs are expensed as incurred. If the business combination is achieved in stages, the acquisition date fair value of the acquirer’s previously held equity
interest in the acquiree is remeasured to fair value at the acquisition date through profit or loss. Any contingent consideration to be transferred by the group is recognised at fair value at the acquisition date.
Subsequent changes to the fair value of the contingent consideration that is deemed to be an asset or liability is recognised in accordance with IAS 39 either in profit or loss or as a change to other comprehensive income. Contingent consideration that is classified as equity is not remeasured, and its subsequent settlement is accounted for within equity.
Goodwill is initially measured as the excess of the aggregate of the consideration transferred and the fair value of
non-controlling interest over the net identifiable assets acquired and liabilities assumed. If this consideration is lower than the fair value of the net assets of the subsidiary acquired, the difference is recognised in profit or loss.
Inter-company transactions, balances, income and expenses on transactions between group companies are eliminated.
Profits and losses resulting from inter-company transactions that are recognised in assets are also eliminated. Accounting policies of subsidiaries have been changed where necessary to ensure consistency with the policies adopted by the group.
Notes to and forming part of the Consolidated Financial Statementsfor the year ended December 31, 2013
93Pakarab Group | Consolidated Annual Report
for the year ended December 31, 2013
b) Changes in ownership interests in subsidiaries without change of control
Transactions with non-controlling interests that do not result in loss of control are accounted for as equity transactions – that is, as transactions with the owners in their capacity as owners. The difference between fair value of any consideration paid and the relevant share acquired of the carrying value of net assets of the subsidiary is recorded in equity. Gains or losses on disposals to non-controlling interests are also recorded in equity.
c) Disposal of subsidiaries
When the group ceases to have control any retained interest in the entity is re-measured to its fair value at the date when control is lost, with the change in carrying amount recognised in profit or loss. The fair value is the initial carrying amount for the purposes of subsequently accounting for the retained interest as an associate, joint venture or financial asset. In addition, any amounts previously recognised in other comprehensive income in respect of that entity are accounted for as if the group had directly disposed of the related assets or liabilities. This may mean that amounts previously recognised in other comprehensive income are reclassified to profit or loss.
4.3 Taxation
Current
Provision of current tax is based on the taxable income for the year determined in accordance with the prevailing law for taxation of income. The charge for current tax is calculated using prevailing tax rates or tax rates expected to apply to the profit for the year if enacted. The charge for current tax also includes adjustments, where considered necessary, to provision for tax made in previous years arising from assessments framed during the year for such years.
Deferred
Deferred tax is accounted for using the balance sheet liability method in respect of all temporary differences arising from differences between the carrying amount of assets and liabilities in the financial statements and the corresponding tax bases used in the computation of the taxable profit. However, the deferred tax is not accounted for if it arises from initial recognition of an asset or liability in a transaction other than a business combination that at the time of transaction neither affects accounting nor taxable profit or loss. Deferred tax liabilities are generally recognized for all taxable temporary differences and deferred tax assets are recognized to the extent that it is probable that taxable profits will be available against which the deductible temporary differences, unused tax losses and tax credits can be utilised.
Deferred tax is calculated at the rates that are expected to apply to the period when the differences reverse based on tax rates that have been enacted or substantively enacted by the balance sheet date. Deferred tax is charged or credited in the profit and loss account, except in the case of items credited or charged to other comprehensive income or equity in which case it is included in other comprehensive income or equity.
4.4 Employee retirement benefits
The main features of the schemes operated by the group for its employees are as follows: (a) Defined benefit plan - Gratuity
The group operates an approved funded gratuity scheme for all permanent employees of the fertilizers segment. Annual provision is made on the basis of actuarial valuation to cover obligations under the scheme for all employees eligible to gratuity benefits.
The latest actuarial valuation for the gratuity scheme was carried out as at December 31, 2013. Projected unit credit
method, using the following significant assumptions, is used for valuation of the scheme: - Discount rate 12.5% per annum - Expected rate of increase in salary level 11.5% per annum - Expected rate of return 11% per annum Mortality rates are assumed to be based on the SLIC (2001-2005) mortality table. All actuarial gains and losses are recognised in ‘other comprehensive income’ as they occur. Previously actuarial gains/
losses were amortised using minimum recommended approach under IAS 19 “Employee Benefits”.

94 Pakarab Fertilizers Limited
(b) Defined contribution plan - Provident Fund
There is an approved defined contributory provident fund for all permanent employees of the fertilizers segment. Equal monthly contributions are made both by the group and employees to the fund at the rate of 8.33 percent of salary for the executives and 10 percent of salary for the workers.
(c) Accumulating compensated absences
Provisions are made annually to cover the obligation for accumulating compensated absences and are charged to profit or loss.
Retirement benefits are payable to employees on completion of prescribed qualifying period of service under these
schemes. 4.5 Property, plant and equipment
4.5.1 Operating fixed assets
Operating fixed assets except freehold land, buildings on freehold land, railway siding, plant and machinery and tools and other equipment of the fertilizers segment are stated at cost less accumulated depreciation and any identified impairment loss. Freehold land of the fertilizers segment is stated at revalued amount less any identified impairment loss while buildings on freehold land, railway siding, plant and machinery and tools and other equipment of the fertilizers segment are stated at revalued amount less accumulated depreciation and any identified impairment loss. Revaluation is carried out with sufficient regularity to ensure that the carrying amount of assets does not differ materially from their fair value. Revalued amount has been determined by an independent professional valuer on the basis of present market value. Any accumulated depreciation at the date of revaluation is eliminated against the gross carrying amount of the asset, and the net amount is restated to the revalued amount of the asset. Cost in relation to other operating fixed assets signifies historical cost, gains and losses transferred from other comprehensive income on qualifying cash flow hedges as referred to in note 4.14.
Increases in the carrying amount arising on revaluation of operating fixed assets are credited to surplus on revaluation
of operating fixed assets. Decreases that offset previous increases of the same assets are charged against this surplus, all other decreases are charged to profit or loss. Each year the difference between depreciation based on revalued carrying amount of the asset (the depreciation charged to the profit or loss) and depreciation based on the assets’ original cost is transferred from surplus on revaluation of operating fixed assets to other comprehensive income. All transfers to/from surplus on revaluation of operating fixed assets are net of applicable deferred taxation.
Depreciation on operating fixed assets is charged to profit or loss on the following methods and rates so as to write
off the depreciable amount of an asset over its estimated useful life after taking into account their residual values:
Asset category Depreciation method Annual depreciation rate
Buildings on freehold land Straight line 3.99% to 5.31% Railway siding - do - 26% Aircrafts - do - 10% to 10.8% Furniture and fixtures - do - 10% to 26.09% Tools and other equipment (other than factory equipment) - do - 10% to 50% Vehicles - do - 20% Plant and machinery - Sacks segment - do - 4.35% Plant and machinery - Fertilizers segment Units of production Tools and other equipment (factory equipment) - do - Catalyst - do - The assets’ residual values and useful lives are reviewed, at each financial year end, and adjusted if impact on
depreciation is significant. An asset’s carrying amount is written down immediately to its recoverable amount if the asset’s carrying amount is
greater than its estimated recoverable amount (note 4.7).
Notes to and forming part of the Consolidated Financial Statementsfor the year ended December 31, 2013

95Pakarab Group | Consolidated Annual Report
for the year ended December 31, 2013
Subsequent costs are included in the asset’s carrying amount or recognised as a separate asset, as appropriate, only when it is probable that future economic benefits associated with the item will flow to the group and the cost of the item can be measured reliably. All other repair and maintenance costs are charged to income during the period in which they are incurred.
The gain or loss on disposal or retirement of an asset represented by the difference between the sale proceeds and the
carrying amount of the asset is recognised as an income or expense. 4.5.2 Capital work-in-progress
Capital work-in-progress is stated at cost less any identified impairment loss. All expenditure connected with specific assets incurred during installation and construction period are carried under capital work-in-progress. These are transferred to operating fixed assets as and when these are available for use.
4.6 Intangible assets
4.6.1 Computer software
Expenditure incurred to acquire computer software is capitalised as intangible asset and stated at cost less accumulated amortisation and any identified impairment loss. Computer software is amortised using the straight line method over a period of four years.
An asset’s carrying amount is written down immediately to its recoverable amount if the asset’s carrying amount is
greater than its estimated recoverable amount (note 4.7). 4.6.2 Mining rights
Expenditure incurred to acquire mining rights is capitalised as intangible asset and stated at cost less accumulated amortisation and any identified impairment loss. Mining rights are amortised using the straight line method over a period of ten years.
An asset’s carrying amount is written down immediately to its recoverable amount if the asset’s carrying amount is
greater than its estimated recoverable amount (note 4.7). 4.7 Impairment of non-financial assets
Assets that have an indefinite useful life - for example, goodwill or intangible assets not ready to use - are not subject to amortisation and are tested annually for impairment. Assets that are subject to amortisation are reviewed for impairment whenever events or changes in circumstances indicate that the carrying amount may not be recoverable. An impairment loss is recognised for the amount by which the asset’s carrying amount exceeds its recoverable amount. The recoverable amount is the higher of an asset’s fair value less costs to sell and value in use. For the purposes of assessing impairment, assets are grouped at the lowest levels for which there are separately identifiable cash flows (cash-generating units). Non-financial assets other than goodwill that suffered an impairment are reviewed for possible reversal of the impairment at each reporting date.
4.8 Leases
The group is the lessee. 4.8.1 Finance leases
Leases where the group has substantially all the risks and rewards of ownership are classified as finance leases. At inception finance leases are capitalised at the lower of present value of minimum lease payments under the lease agreements and the fair value of the assets.
The related rental obligations, net of finance charges, are included in liabilities against assets subject to finance lease
as referred to in note 10. The liabilities are classified as current and long term depending upon the timing of the payment.
Each lease payment is allocated between the liability and finance charges so as to achieve a constant rate on the balance
outstanding. The interest element of the rental is charged to profit or loss over the lease term. Assets acquired under a finance lease are depreciated over the useful life of the asset on a straight-line method at the
rates given in note 24. Depreciation of leased assets is charged to profit or loss.

96 Pakarab Fertilizers Limited
4.8.2 Operating leases
Leases where a significant portion of the risks and rewards of ownership are retained by the lessor are classified as operating leases. Payments made under operating leases (net of any incentives received from the lessor) are charged to profit or loss on a straight-line basis over the lease term.
4.9 Goodwill
Goodwill represents the excess of the cost of an acquisition over the fair value of the group’s share of the net identifiable assets of the acquired subsidiary / associate at the date of acquisition. Goodwill on acquisitions of subsidiaries is included in ‘intangible assets’. Goodwill on acquisitions of associates is included in ‘investments in associates’ and is tested for impairment as part of the overall balance. Separately recognised goodwill is tested annually for impairment and carried at cost less accumulated impairment losses. Impairment losses on goodwill are not reversed. Gains and losses on the disposal of an entity include the carrying amount of goodwill relating to the entity sold.
4.10 Investments
Investments intended to be held for less than twelve months from the balance sheet date or to be sold to raise operating capital, are included in current assets, all other investments are classified as non-current. Management determines the appropriate classification of its investments at the time of the purchase and re-evaluates such designation on a regular basis.
4.11 Financial assets
4.11.1 Classification
The group classifies its financial assets in the following categories: at fair value through profit or loss, loans and receivables, available for sale and held to maturity. The classification depends on the purpose for which the financial assets were acquired. Management determines the classification of its financial assets at the time of initial recognition.
a) Financial assets at fair value through profit or loss
Financial assets at fair value through profit or loss are financial assets held for trading and financial assets designated upon initial recognition as at fair value through profit or loss. Derivatives are also categorised as held for trading unless they are designated as hedges. A financial asset is classified as held for trading if acquired principally for the purpose of selling in the short term. Assets in this category are classified as current assets if expected to be settled within twelve months, otherwise, they are classified as non-current.
b) Loans and receivables
Loans and receivables are non-derivative financial assets with fixed or determinable payments that are not quoted in an active market. They are included in current assets, except for maturities greater than twelve months after the balance sheet date, which are classified as non-current assets. Loans and receivables comprise loans, advances, deposits and other receivables and cash and cash equivalents in the balance sheet.
c) Available-for-sale financial assets
Available-for-sale financial assets are non-derivatives that are either designated in this category or not classified in any of the other categories. They are included in non-current assets unless management intends to dispose of the investments within twelve months from the balance sheet date.
d) Held to maturity
Financial assets with fixed or determinable payments and fixed maturity, where management has the intention and ability to hold till maturity are classified as held to maturity and are stated at amortised cost.
Notes to and forming part of the Consolidated Financial Statementsfor the year ended December 31, 2013

97Pakarab Group | Consolidated Annual Report
for the year ended December 31, 2013
4.11.2 Recognition and measurement
All financial assets are recognised at the time when the group becomes a party to the contractual provisions of the instrument. Regular purchases and sales of investments are recognised on trade-date – the date on which the group commits to purchase or sell the asset. Financial assets are initially recognised at fair value plus transaction costs for all financial assets not carried at fair value through profit or loss. Financial assets carried at fair value through profit or loss are initially recognised at fair value and transaction costs are expensed in the profit and loss account. Financial assets are derecognised when the rights to receive cash flows from the assets have expired or have been transferred and the group has transferred substantially all the risks and rewards of ownership. Available-for-sale financial assets and financial assets at fair value through profit or loss are subsequently carried at fair value. Available-for-sale financial assets are carried at cost in case fair value cannot be measured reliably. Loans and receivables and held-to-maturity investments are carried at amortised cost using the effective interest rate method.
Gains or losses arising from changes in the fair value of the ‘financial assets at fair value through profit or loss’
category are presented in the profit and loss account in the period in which they arise. Dividend income from financial assets at fair value through profit or loss is recognised in the profit and loss account as part of other income when the group’s right to receive payments is established.
Changes in the fair value of securities classified as available-for-sale are recognised in other comprehensive income. When securities classified as available-for-sale are sold or impaired, the accumulated fair value adjustments recognised in equity are included in the profit and loss account as gains and losses from investment securities. Interest on available-for-sale securities calculated using the effective interest method is recognised in the profit and loss account. Dividends on available-for-sale equity instruments are recognised in the profit and loss account when the group’s right to receive payments is established.
The fair values of quoted investments are based on current prices. If the market for a financial asset is not active (and
for unlisted securities), the group measures the investments at cost less impairment in value, if any. The group assesses at each balance sheet date whether there is objective evidence that a financial asset or a group of
financial assets is impaired. If any such evidence exists for available-for-sale financial assets, the cumulative loss is removed from equity and recognised in the profit and loss account. Impairment losses recognised in the profit and loss account on equity instruments are not reversed through the profit and loss account. Impairment testing of trade debts and other receivables is described in note 4.17.
4.12 Financial liabilities
All financial liabilities are recognised at the time when the group becomes a party to the contractual provisions of the instrument.
A financial liability is derecognised when the obligation under the liability is discharged or cancelled or expired.
Where an existing financial liability is replaced by another from the same lender on substantially different terms, or the terms of an existing liability are substantially modified, such an exchange or modification is treated as a derecognition of the original liability and the recognition of a new liability, and the difference in respective carrying amounts is recognised in the profit and loss account.
4.13 Offsetting of financial assets and financial liabilities
Financial assets and financial liabilities are offset and the net amount is reported in the financial statements only when there is a legally enforceable right to set off the recognized amount and the group intends either to settle on a net basis or to realize the assets and to settle the liabilities simultaneously.
4.14 Derivative financial instruments
These are initially recorded at cost on the date a derivative contract is entered into and are remeasured to fair value at subsequent reporting dates. The method of recognizing the resulting gain or loss depends on whether the derivative is designated as a hedging instrument, and if so, the nature of the item being hedged. The group designates certain derivatives as cash flow hedges.

98 Pakarab Fertilizers Limited
The group documents at the inception of the transaction the relationship between the hedging instruments and hedged items, as well as its risk management objective and strategy for undertaking various hedge transactions. The group also documents its assessment, both at hedge inception and on an ongoing basis, of whether the derivatives that are used in hedging transactions are highly effective in offsetting changes in cash flow of hedged items.
The effective portion of changes in the fair value of derivatives that are designated and qualify as cash flow hedges
is recognized in other comprehensive income. The gain or loss relating to the ineffective portion is recognized immediately in the profit and loss account.
Amounts accumulated in other comprehensive income are recognised in profit and loss account in the periods when
the hedged item will affect profit or loss. However, when the forecast hedged transaction results in the recognition of a non-financial asset or a liability, the gains and losses previously deferred in other comprehensive income are transferred from other comprehensive income and included in the initial measurement of the cost of the asset or liability. The changes in fair value re-measurement of derivatives which the group has not designated as a hedging instrument are recognised in the profit and loss account. Trading derivatives are classified as a current asset or liability.
4.15 Stores and spare parts
These are valued at weighted average cost except for items in transit which are stated at invoice value plus other charges paid thereon till the balance sheet date. For items which are slow moving and/or identified as obsolete, adequate provision is made for any excess book value over estimated realisable value. The group reviews the carrying amount of stores and spares on a regular basis and provision is made for obsolescence.
4.16 Stock-in-trade
All stocks are valued at the lower of cost and net realizable value. Cost in relation to raw and packing materials, except for those in transit, signifies weighted average cost and that relating to mid products, work in process and finished goods, annual average cost comprising cost of direct materials, labour and appropriate manufacturing overheads.
Materials in transit are stated at cost comprising invoice value plus other charges incurred thereon. Net realizable value signifies the estimated selling price in the ordinary course of business less costs necessarily to be
incurred in order to make the sale. Provision is made in the financial statements for obsolete and slow moving stock-in-trade based on management estimate.
4.17 Trade debts and other receivables
Trade debts and other receivables are recognised initially at invoice value, which approximates fair value, and subsequently measured at amortised cost using the effective interest method, less provision for doubtful debts. A provision for doubtful debts is established when there is objective evidence that the group will not be able to collect all the amount due according to the original terms of the receivable. Significant financial difficulties of the debtors, probability that the debtor will enter bankruptcy or financial reorganisation, and default or delinquency in payments are considered indicators that the trade debt is impaired. The provision is recognised in the profit and loss account. When a trade debt is uncollectible, it is written off against the provision. Subsequent recoveries of amounts previously written off are credited to the profit and loss account.
4.18 Cash and cash equivalents
Cash and cash equivalents includes cash in hand, deposits held at call with banks, other short-term highly liquid investments with original maturities of three months or less, and bank overdrafts / short term borrowings. Bank overdrafts are shown within current liabilities on the balance sheet.
4.19 Borrowings
Borrowings are recognised initially at fair value, net of transaction costs incurred. Borrowings are subsequently stated at amortised cost, any difference between the proceeds (net of transaction costs) and the redemption value is recognised in the profit and loss account over the period of the borrowings using the effective interest method. Finance costs are accounted for on an accrual basis and are reported under accrued finance costs to the extent of the amount remaining unpaid.
Borrowings are classified as current liabilities unless the group has an unconditional right to defer settlement of the
liability for at least twelve months after the balance sheet date.
Notes to and forming part of the Consolidated Financial Statementsfor the year ended December 31, 2013

99Pakarab Group | Consolidated Annual Report
for the year ended December 31, 2013
4.20 Trade and other payables
Trade and other payables are recognised initially at fair value and subsequently measured at amortised cost using the effective interest method. Exchange gains and losses arising on translation in respect of liabilities in foreign currency are added to the carrying amount of the respective liabilities.
4.21 Provisions
Provisions are recognized when the group has a present legal or constructive obligation as a result of past events, it is probable that an outflow of resources embodying economic benefits will be required to settle the obligation and a reliable estimate of the amount can be made. Provisions are reviewed at each balance sheet date and adjusted to reflect the current best estimate.
4.22 Foreign currency transactions and translation
a) Functional and presentation currency
Items included in the financial statements of the group are measured using the currency of the primary economic environment in which the group operates (the functional currency). The financial statements are presented in Pak Rupees, which is the group’s functional and presentation currency.
b) Transactions and balances
Foreign currency transactions are translated into Pak Rupees using the exchange rates prevailing at the dates of the transactions. Foreign exchange gains and losses resulting from the settlement of such transactions and from the translation at year-end exchange rates of monetary assets and liabilities denominated in foreign currencies are recognized in the profit and loss account.
4.23 Borrowing costs
General and specific borrowing costs directly attributable to the acquisition, construction or production of qualifying assets, which are assets that necessarily take a substantial period of time to get ready for their intended use or sale, are added to the cost of those assets, until such time as the assets are substantially ready for their intended use or sale. Investment income earned on the temporary investment of specific borrowings pending their expenditure on qualifying assets is deducted from the borrowing costs eligible for capitalisation. All other borrowing costs are recognized in profit or loss in the period in which they are incurred.
4.24 Revenue recognition
Revenue is recognised when it is probable that the economic benefits will flow to the group and the revenue can be measured reliably. Revenue is measured at the fair value of the consideration received or receivable on the following basis:
Revenue from sale of goods and export rebate is recognized on dispatch to customers. Revenue from sale of Certified Emission Reductions (CERs) is recognized on the generation of the Emission
Reductions when a firm commitment for sale of CERs exists with a buyer. Return on deposits is accrued on a time proportion basis by reference to the principal outstanding and the applicable
rate of return. Dividend income and entitlement of bonus shares are recognized when the right to receive such dividend and bonus
shares is established. 4.25 Share capital
Ordinary shares are classified as equity and recognized at their face value. Incremental costs directly attributable to the issue of new shares are shown in equity as a deduction, net of tax.
4.26 Dividend
Dividend distribution to members is recognize as a liability in the period in whereas dividends are approved.

100 Pakarab Fertilizers Limited
5. Issued, subscribed and paid up share capital
2013 2012 2013 2012 (Number of shares) (Rupees in thousand) 2,791,260 2,791,260 Ordinary shares of Rs 10 each fully paid in cash 27,913 27,913 447,208,740 447,208,740 Ordinary shares of Rs 10 each issued as fully paid bonus shares 4,472,087 4,472,087
450,000,000 450,000,000 4,500,000 4,500,000 Ordinary shares of the company held by associated undertakings as at year end are as follows: Reliance Commodities (Private) Limited 7,136,613 7,136,613 Fatima Sugar Mills Limited 71,250,558 71,250,558 Fazal Cloth Mills Limited 25,790,610 25,790,610 Arif Habib Corporation Limited 135,000,000 135,000,000
239,177,781 239,177,781
2013 2012 (Rupees in thousand)
6. Reserves Revenue: - General reserve 2,098,313 2,098,313 - (Accumulated loss)/un-appropriated profit (403,247) 1,325,416 1,695,066 3,423,729
7. Surplus on revaluation of operating fixed assets
This represents surplus over book value resulting from the revaluation of freehold land, buildings on freehold land, plant and machinery, railway siding and tools and other equipment of the fertilizers segment, adjusted by incremental depreciation arising out of revaluation of abovementioned assets except freehold land. The valuation was carried out by independent valuers, M/s Pirsons Chemical Engineering (Private) Limited, on September 30, 2011 under current market price/appraisal methods wherever applicable for the respective assets. Surplus on revaluation of operating fixed assets can be utilized for the purposes specified in section 235 of the Companies Ordinance, 1984.
The revaluation surplus relating to abovementioned operating fixed assets excluding freehold land is net of applicable deferred income taxes. Incremental depreciation represents the difference between the actual depreciation on the abovementioned assets excluding freehold land and the equivalent depreciation based on the historical cost of these assets. The movement in revaluation surplus is as follows:
2013 2012 (Rupees in thousand)
Opening balance - net of tax 11,964,238 11,942,294 Deferred tax on revaluation surplus - note 13 - 185,845 Surplus transferred to other comprehensive income for the year on account of incremental depreciation - net of tax (79,902) (163,901)
Closing balance - net of tax - note 7.1 11,884,336 11,964,238
7.1 Includes surplus on revaluation of freehold land amounting to Rs 3,855.69 million (2012: Rs 3,855.69 million).
Notes to and forming part of the Consolidated Financial Statementsfor the year ended December 31, 2013

101Pakarab Group | Consolidated Annual Report
for the year ended December 31, 2013
2013 2012 (Rupees in thousand)
8. Long term finances - secured
Redeemable capital - note 8.1 - 1,625,000 Long term loans - note 8.2 1,608,500 2,870,591 Syndicated term finance - note 8.3 - 277,333
1,608,500 4,772,924
8.1 Redeemable capital
This is composed of: Listed Term Finance Certificates - note 8.1.1 - 1,500,000 Privately Placed Term Finance Certificates - note 8.1.2 1,625,000 3,250,000
1,625,000 4,750,000 Less: Current portion shown under current liabilities - note 14 1,625,000 3,125,000
- 1,625,000
8.1.1 Listed Term Finance Certificates
Opening balance 1,500,000 3,700,000 Less: Redeemed during the year 1,500,000 2,200,000
- 1,500,000 Less: Current portion shown under current liabilities - 1,500,000
- -
The effective markup rate charged during the year on the outstanding balance was 12.03% per annum.
2013 2012 (Rupees in thousand)
8.1.2 Privately Placed Term Finance Certificates (PPTFCs)
Opening balance 3,250,000 4,875,000 Less: Redeemed during the year 1,625,000 1,625,000
1,625,000 3,250,000 Less: Current portion shown under current liabilities 1,625,000 1,625,000
- 1,625,000
On December 15, 2009, the group converted the bridge finance of Rs 6,500 million from Habib Bank Limited (HBL) and National Bank of Pakistan (NBP) to Term Finance Certificates having unit value of Rs 5,000 each by way of private placement. As of December 31, 2013, HBL and NBP hold 400,000 units and 757,070 units respectively while the remaining 142,930 units are held by other private investors.
Terms of redemption The tenure of the PPTFCs is from December 16, 2009 to September 1, 2014. The PPTFCs are redeemable in six
semi-annual installments of Rs 812.5 million ending on September 1, 2014. The group has an option to redeem in full (Call Option) or part (Partial Call Option) of the outstanding amount without any premium by giving written notice to the Trustee at least thirty days prior to the option date. The Call Option is exercisable only on mark up payment dates.
Rate of return The return on PPTFCs is payable semi-annually and is calculated on the outstanding balance at the rate of six
months Karachi Inter Bank Offered Rate (KIBOR) plus 2.5% per annum. The effective mark up rate charged during the year on the outstanding balance ranges from 11.97% to 12.32% per annum.
Trustee In order to protect the interests of the PPTFC holders, HBL was appointed as Trustee under a trust deed dated
September 01, 2009. The Trustee is paid a fee of Rs 0.75 million per annum.
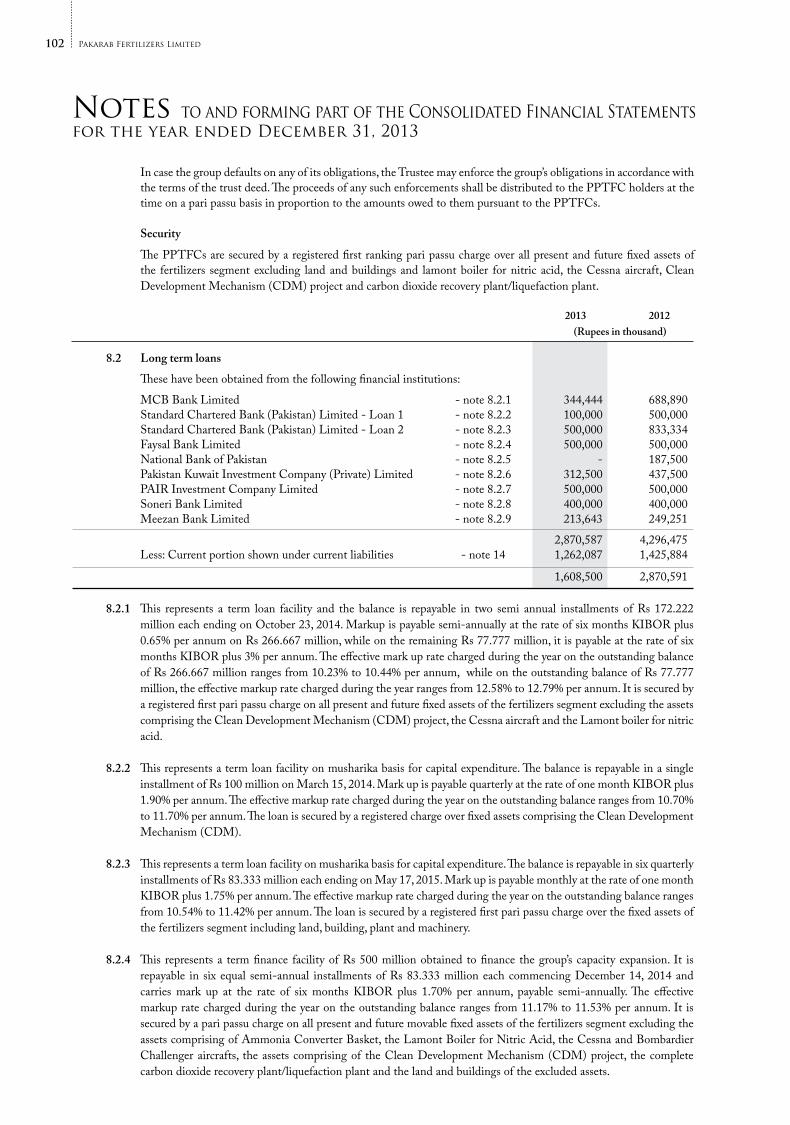
102 Pakarab Fertilizers Limited
Notes to and forming part of the Consolidated Financial Statementsfor the year ended December 31, 2013
2013 2012 (Rupees in thousand)
8.2 Long term loans
These have been obtained from the following financial institutions:
MCB Bank Limited - note 8.2.1 344,444 688,890 Standard Chartered Bank (Pakistan) Limited - Loan 1 - note 8.2.2 100,000 500,000 Standard Chartered Bank (Pakistan) Limited - Loan 2 - note 8.2.3 500,000 833,334 Faysal Bank Limited - note 8.2.4 500,000 500,000 National Bank of Pakistan - note 8.2.5 - 187,500 Pakistan Kuwait Investment Company (Private) Limited - note 8.2.6 312,500 437,500 PAIR Investment Company Limited - note 8.2.7 500,000 500,000 Soneri Bank Limited - note 8.2.8 400,000 400,000 Meezan Bank Limited - note 8.2.9 213,643 249,251
2,870,587 4,296,475 Less: Current portion shown under current liabilities - note 14 1,262,087 1,425,884
1,608,500 2,870,591
8.2.1 This represents a term loan facility and the balance is repayable in two semi annual installments of Rs 172.222 million each ending on October 23, 2014. Markup is payable semi-annually at the rate of six months KIBOR plus 0.65% per annum on Rs 266.667 million, while on the remaining Rs 77.777 million, it is payable at the rate of six months KIBOR plus 3% per annum. The effective mark up rate charged during the year on the outstanding balance of Rs 266.667 million ranges from 10.23% to 10.44% per annum, while on the outstanding balance of Rs 77.777 million, the effective markup rate charged during the year ranges from 12.58% to 12.79% per annum. It is secured by a registered first pari passu charge on all present and future fixed assets of the fertilizers segment excluding the assets comprising the Clean Development Mechanism (CDM) project, the Cessna aircraft and the Lamont boiler for nitric acid.
8.2.2 This represents a term loan facility on musharika basis for capital expenditure. The balance is repayable in a single
installment of Rs 100 million on March 15, 2014. Mark up is payable quarterly at the rate of one month KIBOR plus 1.90% per annum. The effective markup rate charged during the year on the outstanding balance ranges from 10.70% to 11.70% per annum. The loan is secured by a registered charge over fixed assets comprising the Clean Development Mechanism (CDM).
8.2.3 This represents a term loan facility on musharika basis for capital expenditure. The balance is repayable in six quarterly
installments of Rs 83.333 million each ending on May 17, 2015. Mark up is payable monthly at the rate of one month KIBOR plus 1.75% per annum. The effective markup rate charged during the year on the outstanding balance ranges from 10.54% to 11.42% per annum. The loan is secured by a registered first pari passu charge over the fixed assets of the fertilizers segment including land, building, plant and machinery.
8.2.4 This represents a term finance facility of Rs 500 million obtained to finance the group’s capacity expansion. It is
repayable in six equal semi-annual installments of Rs 83.333 million each commencing December 14, 2014 and carries mark up at the rate of six months KIBOR plus 1.70% per annum, payable semi-annually. The effective markup rate charged during the year on the outstanding balance ranges from 11.17% to 11.53% per annum. It is secured by a pari passu charge on all present and future movable fixed assets of the fertilizers segment excluding the assets comprising of Ammonia Converter Basket, the Lamont Boiler for Nitric Acid, the Cessna and Bombardier Challenger aircrafts, the assets comprising of the Clean Development Mechanism (CDM) project, the complete carbon dioxide recovery plant/liquefaction plant and the land and buildings of the excluded assets.
In case the group defaults on any of its obligations, the Trustee may enforce the group’s obligations in accordance with the terms of the trust deed. The proceeds of any such enforcements shall be distributed to the PPTFC holders at the time on a pari passu basis in proportion to the amounts owed to them pursuant to the PPTFCs.
Security
The PPTFCs are secured by a registered first ranking pari passu charge over all present and future fixed assets of the fertilizers segment excluding land and buildings and lamont boiler for nitric acid, the Cessna aircraft, Clean Development Mechanism (CDM) project and carbon dioxide recovery plant/liquefaction plant.

103Pakarab Group | Consolidated Annual Report
for the year ended December 31, 2013
8.2.5 This has been repaid during the year. The effective markup rate charged during the year on the outstanding balance ranges from 11.87% to 12.03% per annum.
8.2.6 This represents term finance facility to finance the group’s capacity expansion. The balance is repayable in five equal
semi-annual installments of Rs 62.5 million each ending on June 29, 2016 and carries mark up at the rate of six months KIBOR plus 2.25% per annum, payable semi-annually. The effective markup rate charged during the year on the outstanding balance ranges from 11.34% to 11.87% per annum. It is secured by a pari passu charge on all present and future movable fixed assets of the fertilizers segment excluding the assets comprising of Ammonia Converter Basket, the Lamont Boiler for Nitric Acid, the Cessna aircraft, the assets comprising of the Clean Development Mechanism (CDM) project, the complete carbon dioxide recovery plant/liquefaction plant along with carbon dioxide static storage tank, tools and its spares, tools and accessories.
8.2.7 This represents term finance facility of Rs 500 million for balance sheet restructuring and group’s capital expenditure
requirements. It is repayable in seven equal semi-annual installments of Rs 71.428 million each commencing August 28, 2014 and carries mark up at the rate of six months KIBOR plus 2.25% per annum, payable semi-annually. The effective markup rate charged during the year on the outstanding balance ranges from 11.32% to 12.77% per annum. It is secured by a first pari passu charge on the fertilizers segment’s present and future fixed assets.
8.2.8 This represents term finance facility of Rs 400 million to meet the group’s capital expenditure/repayment of expensive
debt. It is repayable in six equal semi-annual installments of Rs 66.667 million each commencing May 2, 2014 and carries mark up at the rate of six months KIBOR plus 1.75% per annum, payable semi-annually. The effective markup rate charged during the year on the outstanding balance ranges from 10.81% to 11.11% per annum. It is secured by a first pari passu charge on the fertilizers segment’s present and future fixed assets including land and building and machinery excluding the assets comprising of Ammonia Converter Basket, the Lamont Boiler for Nitric Acid, the Cessna aircraft, the assets comprising of the Clean Development Mechanism (CDM) project, the complete carbon dioxide recovery plant/liquefaction plant along with carbon dioxide static storage tank, tools and its spares, tools and accessories and the land and buildings related to these assets.
8.2.9 This represents diminishing musharika facility and the purpose of this facility is to finance the purchase of both local and imported plant and machinery for the sacks segment. As of December 31, 2013, the principal is repayable in twelve equal quarterly installments of Rs 17,803,624 each ending on December 15, 2016 and carries markup at the rate of six months KIBOR plus 2% per annum with a floor of 8% and a cap of 25%. The effective markup rate charged during the year on the outstanding balance ranges from 11.51% to 12.47% per annum. The facility is secured by a registered mortgage of Rs 100 million over the sacks segment’s building/superstructure on the leasehold land and an exclusive hypothecation charge on plant and machinery.
2013 2012 (Rupees in thousand)
8.3 Syndicated term finance
This has been obtained from a consortium of the following financial institutions: National Bank of Pakistan 133,167 266,333 United Bank Limited 119,047 238,095 Faysal Bank Limited 25,119 50,239
277,333 554,667 Less: Current portion shown under current liabilities - note 14 277,333 277,334
- 277,333
It represents a syndicated term finance facility (STFF) to finance equity investment/debt financing in Fatima Fertilizer Company Limited (‘FATIMA’), a related party. The balance is repayable in two equal semi annual installments of Rs 138.667 million each ending on August 26, 2014. Mark up is payable semi-annually at the rate of six months KIBOR plus 2.5% per annum with no floor and no cap. The effective markup rate charged during the year on the outstanding balance ranges from 11.57% to 13.03% per annum. The facility is secured by a registered first pari passu charge on all present and future fixed assets of the fertilizers segment including plant and machinery, fixtures, fittings, vehicles, tools and equipment but excluding immovable property, land and buildings, Lamont Boiler for nitric acid, Cessna aircraft, the assets comprising of the Clean Development Mechanism (CDM) project and the complete carbon dioxide recovery plant/liquefaction plant along with carbon dioxide static storage tank, its spares, tools and accessories.

104 Pakarab Fertilizers Limited
Notes to and forming part of the Consolidated Financial Statementsfor the year ended December 31, 2013
9. Import bill payable - secured
This represents deferred payment letter of credit established with Allied Bank Limited for import of an aircraft from Bombardier Inc., Canada. It is interest free and is secured through an exclusive hypothecation charge over the aircraft with all accessories, spares and parts installed or which may be installed in future.
2013 2012 (Rupees in thousand)
Import bill payable [USD 24 million (2012: USD 24 million)] 2,524,800 2,330,400 Less: Current portion included in trade and other payables 1,424,800 842,000
1,100,000 1,488,400 10. Liabilities against assets subject to finance lease
Present value of minimum lease payments - note 10.1 38,811 113,189 Less: Current portion shown under current liabilities - note 14 38,811 63,511
- 49,678 The minimum lease payments have been discounted at an implicit interest rate of KIBOR plus 2% to 2.5% reset at the
beginning of every three or six months depending upon the terms of the lease agreement. The implicit interest rate used during the period to arrive at the present value of minimum lease payments ranges from 5.96% to 15.99%. Since the implicit interest rate is linked with KIBOR so the amount of minimum lease payments and finance charge may vary from period to period. The lessee has the option to purchase the assets after expiry of the lease term.
Taxes, repairs and insurance costs are to be borne by the group. In case of early termination of lease, the lessee shall pay entire amount of rentals for unexpired period of lease agreement.
The amount of future payments of the lease and the period in which these payments will become due are as follows:
Minimum Future Present value of lease lease finance liability payments cost 2013 2012 (Rupees in thousand)
Not later than one year 39,812 1,001 38,811 63,511
Later than one year and not later than five years - - - 49,678
39,812 1,001 38,811 113,189
10.1 These include a balance of Rs 0.028 million (2012: Rs 0.08 million) of a related party, Summit Bank Limited.
11. These represent interest free security deposits from customers and carriage contractors and are repayable on cancellation/withdrawal of the dealership or on cessation of the business with the group respectively.
2013 2012 (Rupees in thousand)
12. Deferred liabilities
Accumulating compensated absences - note 12.1 86,320 84,150 Retirement benefits - gratuity fund - note 12.2 40,152 30,690
126,472 114,840

105Pakarab Group | Consolidated Annual Report
for the year ended December 31, 2013
2013 2012 (Rupees in thousand)
12.1 Accumulating compensated absences
Opening balance 84,150 66,001 Provision for the year 20,100 26,568
104,250 92,569 Less: Payments made during the year 17,930 8,419
Closing balance 86,320 84,150
12.2 Gratuity fund
The amounts recognised in the balance sheet are as follows: Present value of defined benefit obligation 129,962 115,230 Fair value of plan assets (89,810) (82,105) Unrecognised actuarial losses - (2,435)
Liability as at year end 40,152 30,690 Opening net liability 30,690 24,683 Charge to profit and loss account 23,163 21,746 Charge to related party 9,491 8,944 Net remeasurements for the year 7,498 - Contribution by the company (30,690) (24,683)
Liability as at year end 40,152 30,690 The movement in the present value of defined benefit obligation is as follows: Opening present value of defined benefit obligation 115,230 88,126 Service cost 29,685 27,102 Interest cost 12,675 11,016 Benefits paid to out-going members during the year (30,719) (14,727) Experience loss (3,110) 3,713 Remeasurements on obligation 6,201 -
Present value of defined benefit obligation as at year end 129,962 115,230 The movement in fair value of plan assets is as follows: Opening fair value 82,105 64,824 Expected return on plan assets 9,031 8,104 Company contributions 30,690 24,683 Benefits paid to out-going members during the year (30,719) (14,727) Experience loss - (779) Remeasurements on fair value of plan assets (1,297) -
Fair value as at year end 89,810 82,105 Plan assets are comprised as follows: Mixed funds 74,400 56,520 Cash 15,410 25,585
89,810 82,105

106 Pakarab Fertilizers Limited
Notes to and forming part of the Consolidated Financial Statementsfor the year ended December 31, 2013
The sensitivity of the defined benefit obligation to changes in the weighted principal assumptions is:
Impact on defined benefit obligation
Change in Increase in Decrease in assumptions assumption assumption (Rupees in thousand)
Discount rate 1% 118,995 142,813 Salary growth rate 1% 142,813 118,811
2013 2012 (Rupees in thousand)
13. Deferred taxation
The liability for deferred taxation comprises temporary differences relating to: Accelerated tax depreciation 10,053,113 9,912,589 Accumulating compensated absences (30,212) (29,453) Provision for doubtful receivable (3,119) (3,119) Post retirement medical benefits and other allowances payable (4,030) (4,030) Assets subject to finance lease 4,137 2,778 Interest receivable 5,433 553,828 Preference dividend receivable - 468,025 Unrealised recovery of chemical catalyst 56,957 50,799 Goodwill 964,416 836,155 Unused tax losses (986,823) (793,934) Minimum tax available for carry forward (127,387) (73,669) Precommencement expenditure (4,086) (4,731) Short term employee benefits (1,152)
9,927,247 10,915,238 Deferred tax asset on tax losses available for carry forward and those representing minimum tax paid available for carry
forward under section 113 of the Income Tax Ordinance, 2001 are recognized to the extent that the realisation of related tax benefits through future taxable profits is probable.
Management considers that minimum tax available for carry forward of Rs 2.772 million would not be utilised in the foreseeable future. Consequently, based on the prudence principle, deferred tax asset to the extent of Rs 2.772 million has not been recognized in these financial statements.
The present value of defined benefit obligation, the fair value of plan assets and the surplus or deficit of gratuity fund is as follows:
2013 2012 2011 2010 2009 (Rupees in thousand)
Present value of defined benefit obligation 129,962 115,230 88,126 53,709 38,481 Fair value of plan assets 89,810 82,105 64,824 45,505 29,959
Loss (40,152) (33,125) (23,302) (8,204) (8,522) Experience adjustment on obligation 5% 3% 6% 2% -21% Experience adjustment on plan assets -1.44% -0.95% 0.89% 0.21% 2%

107Pakarab Group | Consolidated Annual Report
for the year ended December 31, 2013
15. This represents a short term loan facility of Rs 3 billion obtained during the year from FATIMA, a related party, to meet the group’s working capital requirements and repayment of long term liabilities.. It carries mark up at the rate of six months KIBOR plus 2.12% per annum or average borrowing cost of FATIMA which ever is higher, payable semi-annually. The effective markup rate charged during the year on the outstanding balance was 11.21% per annum. It has been secured by providing a cash cheque of Rs 3 billion renewable after every six months accompanied with ranking charge on the fertilizers segment’s present and future fixed assets including plant and machinery, fixtures, fittings, vehicles, tools and equipment, but excluding immovable property and land and building and lamont boiler for nitric acid, cessna aircraft and the assets comprising of the Clean Development Mechanism (CDM) project, the complete carbon dioxide recovery plant/liquefaction plant along with carbon dioxide static storage tank, tools and its spares, tools and accessories, wherever situated together with all documents of title thereto and sale proceeds thereof and with the benefit of all contracts entered by the group with the suppliers of such fixed assets to be imported or purchased by the group.
2013 2012 (Rupees in thousand)
16. Short term borrowings - secured
Running finances - note 16.1 3,013,610 3,914,106 Term finances - note 16.2 2,082,849 2,092,118
5,096,459 6,006,224
16.1 Running finances
Short term running finance facilities available from commercial banks under mark-up arrangements amount to Rs 6,077 million (2012: Rs 8,300 million). The rates of mark-up range from 10.27% to 13.95% on the outstanding balance or part thereof. The aggregate running finances are secured against pledge of stock-in-trade as referred to in note 29.1 and registered hypothecation charge on current assets. Included in the above is a running finance of Rs 400 million (2012: Rs 400 million) from a related party, Summit Bank Limited.
16.2 Term finances
Term finance facilities available from various commercial banks under profit arrangements amount to Rs 2,724 million (2012: Rs 3,029 million). The rates of profit range from 9.76% to 19.00% on the outstanding balance or part thereof. The aggregate term finances are secured against first pari passu charge over all current assets of the fertilizers segment and pledge of raw materials, stock-in-trade, hypothecation charge on all current assets of the sacks segment.
2013 2012 (Rupees in thousand)
The gross movement in deferred tax liability during the year is as follows: Opening balance 10,915,238 10,967,290 Deferred tax on revaluation surplus - note 7 - (185,845) (Credited)/charged to profit and loss account - note 41 (987,991) 133,793
Closing balance 9,927,247 10,915,238
14. Current portion of long term liabilities
Long term finances - secured: - - Redeemable capital - note 8.1 1,625,000 3,125,000 - Long term loans - note 8.2 1,262,087 1,425,884 - Syndicated term finance - note 8.3 277,333 277,334 Liabilities against assets subject to finance lease - note 10 38,811 63,511 Payable against mining rights - note 14.1 - 21,000
3,203,231 4,912,729
14.1 This represents interest free amount payable to Director General, Mines and Minerals, Government of Khyber Pakhtunkhwa (‘GOKP’) in respect of mining rights acquired for extraction of rock phosphate from a block of area in District Abbottabad for a ten years period ending on August 11, 2019. This has been paid during the current year.

108 Pakarab Fertilizers Limited
Notes to and forming part of the Consolidated Financial Statementsfor the year ended December 31, 2013
16.3 Letters of credit and guarantees
Of the aggregate facility of Rs 8,125 million (2012: Rs 8,214 million) for opening letters of credit and Rs 120 million (2012: Rs 2,350 million) for guarantees, the amount utilised at December 31, 2013 was Nil (2012: Nil) and Nil (2012: Rs 17 million) respectively. The facility for opening letters of credit is secured against import documents and registered joint pari passu charge over current assets whereas facility for guarantees is secured against pledge of stock-in-trade as referred to in note 29.1.
17. Reliance Exports (Private) Limited (‘REL’), under the terms and conditions stated in the ‘Share Purchase Agreement’ (the
Agreement), acquired 100% shares in the parent company on July 14, 2005 through the process of privatization. Under the terms of the Agreement, the purchase consideration, in addition to lump sum cash payment, included a further payment equivalent to 90% of the group’s claim of tax refund aggregating to Rs 2,814.511 million for the assessment years 1993-94, 1995-96 through 2002-2003 and tax years 2003 and 2004. The amount is payable to the Privatization Commission in the event of and at the time of cash receipt of the refund from the concerned tax authorities.
The amount recognized in these financial statements as payable to Privatization Commission is net off Rs 240.119 million which, according to the management of the group, has already been withdrawn by the Previous Members as part of the dividend distribution for the year ended June 30, 2005. The management of the group feels that the Agreement as presently worded, if executed, would result into double payment of the same amount to the Privatization Commission/Previous Members, firstly, as part of the profits for the year ended June 30, 2005 (computed without recognition of the tax expense for the years for which when the refund is issued, an amount equivalent to 90% would be the right of the Privatization Commission/Previous Members) and secondly, at the time the refund is received from the tax authorities when an amount equivalent to 90% of such refund is paid off to the Privatization Commission, as agreed. The management of the group feels that such double payment is neither the intention nor warranted under the specific provisions of the Agreement.
Upon dissolution of REL and its amalgamation with the parent company on July 14, 2005, this liability was recognised in the books of the parent company being the surviving entity upon REL’s amalgamation with the parent company in accordance with the Scheme of Arrangement for Amalgamation.
18. This represents the derivative cross currency swaps the group had entered into with various banks. These have matured
during the year resulting in a gain of Rs 2.217 million that has been recognised in the profit and loss account.
2013 2012 (Rupees in thousand)
19. Trade and other payables
Trade creditors - note 19.1 1,641,318 1,486,779 Sui gas bill payable - note 19.2 6,093 112,228 Security deposits 21,969 30,160 Accrued liabilities - note 19.3 863,875 376,333 Workers’ profit participation fund - note 19.4 730,152 753,108 Workers’ welfare fund 244,046 244,046 Customers’ balances 344,946 130,676 Bank guarantees discounted - 66,348 Due to related party - 133,000 Due to employees’ provident fund trust 6,055 6,084 Withholding tax payable 7,569 14,006 Excise duty payable 1,724 1,724 Sales tax payable - note 19.5 154,177 - Electricity duty payable 19,506 16,481 Retention money 1,765 1,541 Due to employees 4 - Others - 535
4,043,199 3,373,049
19.1 Includes an amount of Rs 0.05 million (2012: Rs 0.05 million) payable to FATIMA, a related party. 19.2 This amount is payable to Sui Northern Gas Pipelines Limited (‘SNGPL’), a related party against purchase of gas.
19.3 Included in accrued liabilities are amounts aggregating Rs 1.012 million (2012: Nil) due to FATIMA, a related party.

109Pakarab Group | Consolidated Annual Report
for the year ended December 31, 2013
2013 2012 (Rupees in thousand)
20. Accrued finance cost
Accrued mark-up on: - redeemable capital - secured 9,011 79,805 - long term loans - secured 41,591 62,148 - syndicated term finance - secured 12,204 26,051 - short term borrowings - secured - note 20.1 136,077 159,848 - short term loan from related party - secured - note 20.2 147,148 - Acceptance commission on letter of credit - 43,164
346,031 371,016
20.1 Includes an amount of Rs 10.906 million (2012: Rs 11.629 million) payable to Summit Bank Limited, a related party. 20.2 This amount is payable to FATIMA.
21. This represents a book overdraft balance due to unpresented cheques.
22. Contingencies and commitments
22.1 Contingencies
(i) The company has netted off an amount of Rs 240.119 million from the amount payable to the Privatization Commission, as part of purchase consideration, at the time and in the event the refund is received from the tax authorities. In case, the company’s contention relating to possible double payment is not acceded to by the other party to the Share Purchase Agreement, the company is contingently liable to the aforesaid amount of Rs 240.119 million. In case, the amount becomes payable, the corresponding effect would be reflected in the computation of goodwill.
2013 2012 (Rupees in thousand)
19.4 Workers’ profit participation fund
Opening balance 753,108 803,274 Provision for the year - note 39 2,524 -
755,632 803,274 Less: Payments made during the year 25,480 50,166
Closing balance 730,152 753,108
The parent company has an agreement with the Workers Welfare Fund (‘WWF’), Ministry of Labour and Manpower, Government of Pakistan whereby the balance amount of Workers’ Profit Participation Fund (‘WPPF’) remaining after deducting the workers’ portion of WPPF that is required to be deposited in the WWF, would be used for establishing a hospital for the workers as per the mechanism defined in that agreement.
19.5 Includes Rs 134.022 million which primarily represents the input sales tax paid by the group in respect of raw materials acquired before June 11, 2008 on which date fertilizer products manufactured by the group were exempted from levy of sales tax through notification SRO 535(I)/2008. The amount stood refundable to the group there being no output sales tax liability remaining payable on fertilizer products manufactured by the group against which such input sales tax was adjustable. The group’s claim of refund on this account was not entertained by Federal Board of Revenue (‘FBR’) on the premise that since subject raw materials were subsequently consumed in manufacture of a product exempt from levy of sales tax, claim was not in accordance with the relevant provisions of the Sales Tax Act, 1990.
Group’s management being aggrieved with the interpretation advanced by FBR on the issue has preferred a writ petition before the Lahore High Court, which has not yet been disposed off. Since group’s management considers that claim of refund is completely in accordance with relevant statutory framework and expects relief from appellate authorities on this account, it considers that the receivable amount was unimpaired at the balance sheet date.

110 Pakarab Fertilizers Limited
Notes to and forming part of the Consolidated Financial Statementsfor the year ended December 31, 2013
(ii) The company has issued following guarantees in favour of: - Sui Northern Gas Pipelines Limited against gas sale amounting to Rs 10 million (2012: Rs 10 million). - Pakistan State Oil Company Limited against fuel for aircraft amounting to Rs 7 million (2012: Rs 7 million). - Meezan Bank Limited as security against finance obtained by its subsidiary, Reliance Sacks Limited. (iii) Indemnity bonds amounting to Nil (2012: Rs 152.7 million) issued to the Customs authorities in favour of The
President of Islamic Republic of Pakistan under SRO 489(I)/2000 for the value of goods exported and to be re-imported.
(iv) As at June 30, 2004, the group had investment of 140,000 ordinary shares of Rs 10 each valuing Rs 100,000 in
National Fertilizer Marketing Limited, being the associated company on that date. On May 20, 2005, this investment was transferred to National Fertilizer Corporation of Pakistan (Private) Limited by the management of the group. However, the new buyer, Reliance Exports (Private) Limited filed an application before Privatization Commission challenging this transfer on the grounds that such transfer had been carried out against the terms and conditions of the bid documents. In case of a positive outcome to the application, this investment would be re-instated.
(v) An amount of Rs 129.169 million was withdrawn by the previous members of the parent company as part of dividend
for the year ended June 30, 2005 under the Share Purchase Agreement. Out of the aggregate amount, Rs 89.39 million represents the value of certain catalysts recovered in consequence of clean down operations of the plant prior to undertaking the process of privatization, which was accounted for as income in the financial statements for the year ended June 30, 2005 in the light of applicable financial reporting framework.
The management of the group feels that notwithstanding the applicability of the financial reporting framework, on the financial statements for the year ended June 30, 2005, the amount was not distributable as part of dividend for that year in view of the clear understanding behind the execution of the Agreement as categorically confirmed, in writing, by the Privatization Commission prior to signing of the Agreement. Similarly, the balance amount of Rs 39.779 million is considered to be dividend distribution out of the then available reserves which was also not distributable to the previous members in terms of other covenants of the Agreement.
The group has filed a claim for the recovery of the aforesaid aggregate amount on the grounds that in the present form, the distribution has been made out of the accumulated reserves, for the years up to June 30, 2004, which, under the specific provisions of the Agreement were not distributable to the previous members of the parent company. In case of a positive outcome to the group’s claim, the excess dividend withdrawn by the previous members of the parent company would be recovered.
(vi) Through a show cause notice, the department raised the issue of short payment of output sales tax on supplies of the
group’s fertilizer product, Calcium Ammonium Nitrate (‘CAN’) for the period from April 18, 2011 to December 31, 2011 involving a principal sales tax demand of Rs 500 million. Such issue has been raised on the grounds that notification SRO 15(I)/2006, providing for levy of sales tax on the basis of ‘notified price’ of CAN, was withdrawn through notification SRO 313(I)/2011 dated April 18, 2011 and hence, group was legally required to recover output sales tax on supplies of CAN on the basis of actual consideration received there against. The group has impugned the vires of such notice through institution of a constitutional petition before the Lahore High Court, inter alia, on the grounds that (i) pending the disposal of application earlier filed with the Federal Board of Revenue by the group under section 65B of the Sales Tax Act, 1990, on this matter, instant proceedings initiated by department lack the legal sanctity; and (ii) that inadvertence of charging the sales tax on the basis of notified price was not attributable to any mala fide on group’s part. In view of the fact that management considers group’s stance to be based on meritorious grounds and hence expects a favourable decision on the matter by Lahore High Court, no provision on this account has been made in these financial statements.

111Pakarab Group | Consolidated Annual Report
for the year ended December 31, 2013
(vii) For assessment years 1993-94 and 1995-96 through 2002-2003 and for tax years 2003 through 2005, the group, in view of the position taken by the tax authorities that the income of the group is chargeable to tax on the basis of ‘net income’, had provided for in the financial statements the tax liability on net income basis which aggregated to Rs 5,223.343 million. Tax liabilities admitted in respective returns of total income in respect of these assessment/tax years, however, aggregated to Rs 1,947.671 million being the liabilities leviable under the Presumptive Tax Regime (‘PTR’), considered by the management to be applicable in respect of group’s income from sale of own manufactured fertilizer products.
The Appellate Tribunal Inland Revenue (‘ATIR’) through its separate orders for the assessment years 1993-94, 1995-96 through 2002-03 upheld the group’s position as taken in respective returns of total income and consequently, management reversed the excess provisions aggregating to Rs 3,275.673 million on the strength of such judgments. ATIR’s decisions in respect of certain assessment years have also been upheld by the Lahore High Court while disposing departmental appeals against respective orders of ATIR. Income tax department has statedly agitated the issue further before Supreme Court of Pakistan, which is pending adjudication.
In view of the favourable disposal of the matter up to the level of High Court, management of the group feels that the decision of the apex court would also be in the favour of the group and hence in these financial statements, tax liabilities in respect of above referred assessment/tax years have been provided on the basis that group’s income during such years was taxable under PTR. In case, the apex court decides the matter otherwise, amount aggregating to Rs 3,275.673 million will have to be recognized as tax expense in respect of such assessment/tax years.
(viii) Included in trade debts is an amount of Rs 18.877 million (2012: Rs 28.511 million) which has not been acknowledged
as debts by its customers due to a dispute regarding the discount on the product’s price. The group’s customers had collectively filed an appeal regarding the price dispute before the Civil Court, Multan, which decided the case in favour of the group’s customers. The group preferred an appeal before the District and Sessions Court, Multan which set aside the order of the Civil Court. The group’s customers filed a revised petition before the Lahore High Court against the order of the District and Sessions Court, which is pending for adjudication. Based on the advice of the group’s legal counsel, the group’s management considers that there are meritorious grounds to defend the group’s stance and hence, no provision has been made in these financial statements on this account.
(ix) Claims against the group not acknowledged as debts Rs 23.051 million (2012: Rs 23.051 million). Provision has not been made in these financial statements as management is confident that it will not materialize.
22.2 Commitments in respect of
(i) Contracts for capital expenditure Nil (2012: Rs 61.222 million).
(ii) Letters of credit other than for capital expenditure Rs 135.511 million (2012: Rs 128.189 million).
(iii) Purchase orders aggregating to Nil (2012: Rs 5.656 million) were placed and letters of credit were established subsequently.
(iv) The amount of future payments under operating leases and the period in which these payments will become due are as follows:
2013 2012 (Rupees in thousand)
Not later than one year 53,646 57,597 Later than one year and not later than five years 54,658 112,547
108,304 170,144
23. Property, plant and equipment
Operating fixed assets - note 23.1 37,477,752 36,846,416 Capital work-in-progress - note 23.2 77,271 863,946
37,555,023 37,710,362

112 Pakarab Fertilizers Limited
Notes to and forming part of the Consolidated Financial Statementsfor the year ended December 31, 2013
23.1 Operating fixed assets (Rupees in thousand) Building on Furniture Tools and Freehold freehold Railway Plant and Aircrafts and other Vehicles Catalyst Total land land siding machinery fixtures equipment COST
Balance as at January 01, 2012 4,767,634 1,928,551 - 36,800 28,066,369 2,778,905 64,640 622,530 243,508 102,102 38,611,039 Additions during the year - 124,652 - - 23,432 4,304 5,264 55,231 6,844 115,210 334,937 Transfers in from assets subject to finance lease - - - - - - - - 117,858 - 117,858 Disposals during the year - - - - (6,759) - - - (123,909) - (130,668)
Balance as at December 31, 2012 4,767,634 2,053,203 - 36,800 28,083,042 2,783,209 69,904 677,761 244,301 217,312 38,933,166 Balance as at January 01, 2013 4,767,634 2,053,203 - 36,800 28,083,042 2,783,209 69,904 677,761 244,301 217,312 38,933,166 Additions during the year - 4,061 132,812 - 872,784 - 3,408 44,978 1,770 - 1,059,813 Transfers in from assets subject to finance lease - - - - - - - - 91,715 - 91,715 Disposals during the year - - - - - - - (10) (125,380) - (125,390)
Balance as at December 31, 2013 4,767,634 2,057,264 132,812 36,800 28,955,826 2,783,209 73,312 722,729 212,406 217,312 39,959,304 DEPRECIATION
Balance as at January 01, 2012 - 34,080 - 3,201 217,319 425,163 2,295 59,510 177,149 48,561 967,278 Charge for the year - note 23.1.3 - 101,661 - 9,600 698,441 215,368 7,887 43,614 28,632 23,610 1,128,813 Transfers in from assets subject to finance lease - - - - - - - - 74,917 - 74,917 Charge on disposals - - - - (91) - - - (84,167) - (84,258)
Balance as at December 31, 2012 - 135,741 - 12,801 915,669 640,531 10,182 103,124 196,531 72,171 2,086,750 Balance as at January 01, 2013 - 135,741 - 12,801 915,669 640,531 10,182 103,124 196,531 72,171 2,086,750 Charge for the year - note 23.1.3 - 106,396 5,064 9,600 93,648 128,026 8,472 46,096 24,453 2,523 424,278 Transfers in from assets subject to finance lease - - - - - - - - 63,280 - 63,280 Charge on disposals - - - - - - - - (92,756) - (92,756)
Balance as at December 31, 2013 - 242,137 5,064 22,401 1,009,317 768,557 18,654 149,220 191,508 74,694 2,481,552 Book value as at December 31, 2012 4,767,634 1,917,462 - 23,999 27,167,373 2,142,678 59,722 574,637 47,770 145,141 36,846,416 Book value as at December 31, 2013 4,767,634 1,815,127 127,748 14,399 27,946,509 2,014,652 54,658 573,509 20,898 142,618 37,477,752
23.1.1 Freehold land, buildings on freehold land, railway siding, plant and machinery and tools and other equipment were revalued by an independent valuer M/s Pirsons Chemical Engineering (Private) Limited on September 30, 2011 on current market value basis. The revaluation surplus net of deferred tax was credited to surplus on revaluation of operating fixed assets. Had there been no revaluation, the carrying amounts of the following classes of assets would have been as follows:
2013 2012 (Rupees in thousand)
Freehold land 3,387,787 3,387,787 Buildings on freehold land 1,421,839 1,509,190 Railway siding 1,223 6,312 Plant and machinery 16,478,164 15,653,706 Tools and other equipment 355,344 341,642
21,644,357 20,898,637
23.1.2 Included in plant and machinery are assets costing Rs 34.613 million which are installed at the manufacturing facilities of the group’s customers namely Iceberg Gas Company, Coca-Cola Beverages Pakistan Limited and Shamim & Company (Private) Limited as these assets are used for sales to these customers.

113Pakarab Group | Consolidated Annual Report
for the year ended December 31, 2013
2013 2012 (Rupees in thousand)
23.1.3 The depreciation charge for the year has been allocated as follows:
Cost of sales - note 35 204,254 829,836 Administrative expenses - note 36 215,658 296,239 Selling and distribution expenses - note 37 4,366 1,975 Unallocated expenditure - 763
424,278 1,128,813 23.1.4 Disposal of operating fixed assets 2013 (Rupees in thousand)
Accumulated Book Sale Mode of Particulars Sold to Cost depreciation value proceeds disposal Vehicles Ex - employees
Muhammad Nabeel 650 574 76 234 As per company policy
Saleem Shahzad 765 599 166 354 - do - M. Qaisar Imran 876 482 394 600 - do - Kaleemullah Memon 785 679 106 372 - do - Adeel Haider 785 693 92 375 - do - Maj.(R) Muhammad Pervaiz 780 701 79 284 - do - Israr Ali Memon 610 559 51 191 - do - Irfan Ali 695 591 104 285 - do - Faisal Baig 1,328 1,238 90 133 - do - Ahsan Sarfaraz 1,541 694 847 1,359 - do - M.Jawad Ahmed Khan Sherwani 670 436 234 394 - do - Najam Abbas 881 484 397 445 - do - Abdul Rab 695 486 209 284 - do - Yasir Imtiaz 1,350 720 630 630 - do - Naveed Ahmed 951 570 381 375 - do - Shahab Arshad 1,318 769 549 1,061 - do - Riaz Ahmad Abbasi 827 633 194 446 - do - Nauman Arshad 893 655 238 565 - do - Atiq Ur Rehman 715 536 179 355 - do - Tariq Faiz 1,476 714 762 800 - do - Khalid Javed 1,297 994 303 630 - do - Muhammad Ilyas Grewal 1,255 900 355 1,116 - do - Rashid Razzaq 727 388 339 524 - do - Farhan K Ghori 1,297 994 303 697 - do - Yasin Zaffar 529 405 124 111 - do - Athar Mumtaz 1,476 861 615 669 - do - C/f 25,172 17,355 7,817 13,290

114 Pakarab Fertilizers Limited
2013 (Rupees in thousand)
Accumulated Book Sale Mode of Particulars Sold to Cost depreciation value proceeds disposal B/f 25,172 17,355 7,817 13,290 Gulam Rasool 1,133 812 321 311 As per company
policy Tarique Ali Khuro 934 467 467 463 - do - Moghees Haider 927 556 371 503 - do - Ali Raza Soomro 878 614 264 253 - do - Muhammad Noman Arain 916 595 321 375 - do - Abdul Momin 1,488 942 546 542 - do - Tariq Qasim Khan 1,921 1,216 705 1,182 - do - Shabir Ahmed Dar 1,485 965 520 620 - do - Latif Khan 1,353 857 496 794 - do - Liaqat Ali Khan 1,964 1,342 622 1,181 - do - Mazhar ishaq 1,488 942 546 891 - do - Muzumil Saleem 727 460 267 438 - do - Muhammad Shoaib Majeed 542 398 144 162 - do - Brig (R) Syed Nazarat Bashir 1,539 795 744 666 - do - Nasir Hussain 929 464 465 729 - do - Farhat Malik 1,414 1,131 283 928 - do - Zubair Hassan 715 572 143 311 - do - Junaid Shakeel 671 547 124 270 - do - Asif Abbas 696 556 140 294 - do - Rizwan Malik 826 674 152 427 - do - Furqan Habib Durani 695 544 151 283 - do - Raja Ghazanwer Ansari 622 507 115 219 - do - Rizwan Majeed 671 536 135 266 - do - M. Mudassar Shah 826 674 152 426 - do - Syed Adeel Ahmed 825 673 152 426 - do - Shahid Hussain 826 674 152 425 - do - Ali Ahmad Javed 826 674 152 426 - do - M. Hashim 529 432 97 121 - do - Naveed Zafar 1,256 1,109 147 113 - do - Muhammad Saleem Zafar 1,297 1,037 260 269 - do -
Employees
Kamran Qureshi 1,103 1,010 93 1,032 - do - C/f 57,193 40,130 17,064 28,635
Notes to and forming part of the Consolidated Financial Statementsfor the year ended December 31, 2013

115Pakarab Group | Consolidated Annual Report
for the year ended December 31, 2013
2013 (Rupees in thousand)
Accumulated Book Sale Mode of Particulars Sold to Cost depreciation value proceeds disposal B/f 57,193 40,130 17,064 28,635 Muhammad Iqbal Khan 929 402 527 522 As per company
policy Anil Zia 826 632 194 159 - do - Zulfiqar Ali 932 606 326 628 - do - Mazhar Abbas 825 592 233 516 - do - Ishtiaq Ahmad 901 631 270 240 - do - Muhammad Shahid 708 495 213 410 - do - Syed Muhammad Arif Zaki 678 543 135 265 - do - Muhammad Farooq 1,297 1,037 260 896 - do - Waqas Ahmad 715 572 143 311 - do - Muhammad Ali Qureshi 893 714 179 492 - do - Muhammad Asghar 1,414 1,131 283 932 - do - Ghulam Rasool 715 572 143 289 - do - Syed Muhammad Nadeem 825 674 151 422 - do - M.Saleem 529 441 88 120 - do - M.Waseem 826 674 152 427 - do - Abdul Rauf 825 646 179 416 - do - M. Aleem 826 674 152 426 - do - Hafiz Hamza Nauman 696 544 152 284 - do - M. Muzaffar Hussain Shah 893 744 149 486 - do - Abdul Rehman 690 551 139 278 - do - Saad Khalid 790 644 146 379 - do - Abdul Jabbar 622 507 115 205 - do - Abdul Majeed Zia 1,476 935 541 774 - do - Waheed Ahmed 1,732 1,126 606 808 - do - Accidental loss 24,935 17,455 7,480 22,000 Insurance claim Accidental loss 1,443 1,034 409 1,384 - do - Accidental loss 1,998 699 1,299 2,088 - do - Accidental loss 1,406 1,030 378 1,354 - do - Outside party Noor Hayat 1,903 1,656 246 1,496 Auction Other assets with book value less than Rs 50,000 14,948 14,666 282 7,364 - do - 125,390 92,756 32,634 75,006
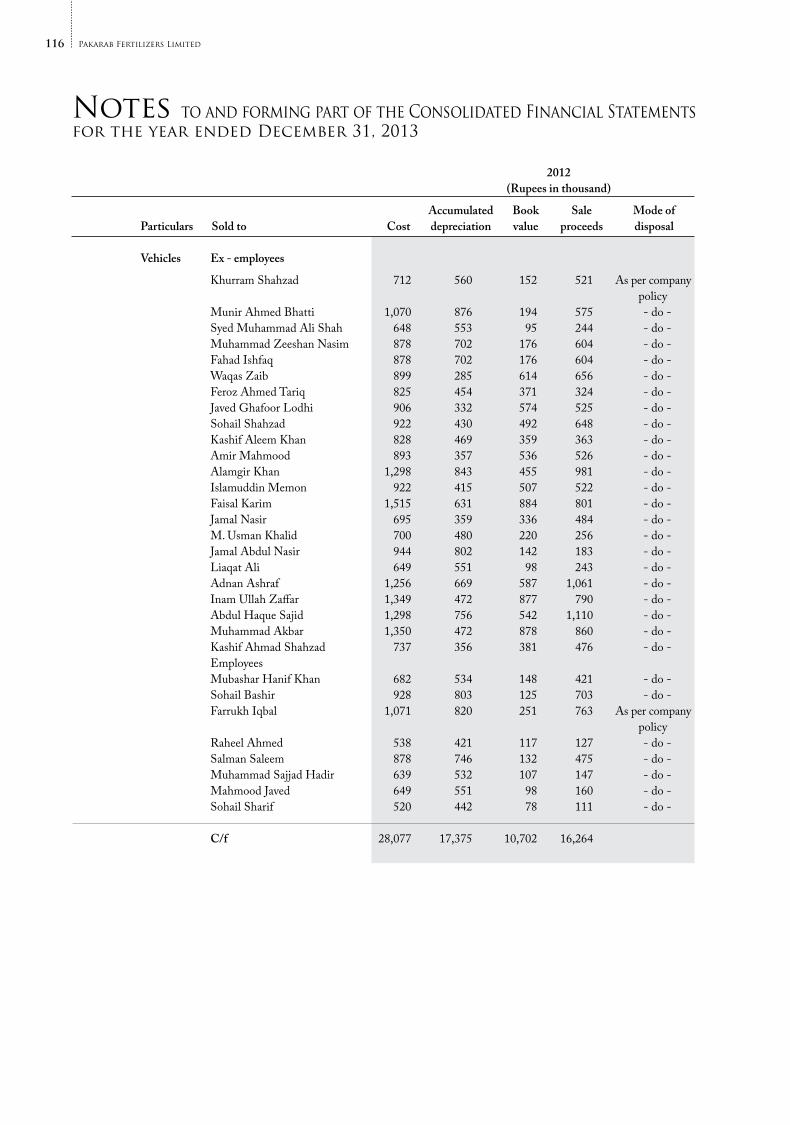
116 Pakarab Fertilizers Limited
2012 (Rupees in thousand)
Accumulated Book Sale Mode of Particulars Sold to Cost depreciation value proceeds disposal Vehicles Ex - employees
Khurram Shahzad 712 560 152 521 As per company policy
Munir Ahmed Bhatti 1,070 876 194 575 - do - Syed Muhammad Ali Shah 648 553 95 244 - do - Muhammad Zeeshan Nasim 878 702 176 604 - do - Fahad Ishfaq 878 702 176 604 - do - Waqas Zaib 899 285 614 656 - do - Feroz Ahmed Tariq 825 454 371 324 - do - Javed Ghafoor Lodhi 906 332 574 525 - do - Sohail Shahzad 922 430 492 648 - do - Kashif Aleem Khan 828 469 359 363 - do - Amir Mahmood 893 357 536 526 - do - Alamgir Khan 1,298 843 455 981 - do - Islamuddin Memon 922 415 507 522 - do - Faisal Karim 1,515 631 884 801 - do - Jamal Nasir 695 359 336 484 - do - M. Usman Khalid 700 480 220 256 - do - Jamal Abdul Nasir 944 802 142 183 - do - Liaqat Ali 649 551 98 243 - do - Adnan Ashraf 1,256 669 587 1,061 - do - Inam Ullah Zaffar 1,349 472 877 790 - do - Abdul Haque Sajid 1,298 756 542 1,110 - do - Muhammad Akbar 1,350 472 878 860 - do - Kashif Ahmad Shahzad 737 356 381 476 - do - Employees Mubashar Hanif Khan 682 534 148 421 - do - Sohail Bashir 928 803 125 703 - do - Farrukh Iqbal 1,071 820 251 763 As per company
policy Raheel Ahmed 538 421 117 127 - do - Salman Saleem 878 746 132 475 - do - Muhammad Sajjad Hadir 639 532 107 147 - do - Mahmood Javed 649 551 98 160 - do - Sohail Sharif 520 442 78 111 - do - C/f 28,077 17,375 10,702 16,264
Notes to and forming part of the Consolidated Financial Statementsfor the year ended December 31, 2013

117Pakarab Group | Consolidated Annual Report
for the year ended December 31, 2013
2012 (Rupees in thousand)
Accumulated Book Sale Mode of Particulars Sold to Cost depreciation value proceeds disposal B/f 28,077 17,375 10,702 16,264 Farooq Ahmad Rana 878 746 132 389 As per company
policy Muhammad Saeed 649 551 98 244 - do - Tahir Asghar Raja 878 746 132 475 - do - Muhammad Atif Masood 649 551 98 244 - do - Waseem Zaman 639 532 107 147 - do - Muhammad Faisal Gurmani 525 446 79 116 - do - Muhammad Nauman Talat 596 507 89 190 - do - Yousaf Ali 516 438 78 117 - do - Muhammad Afzal Bajwa 878 746 132 475 - do - Mohammad Mohtashim Ali 516 438 78 117 - do - Muhammad Usman 520 442 78 111 - do - Farhan Talib 682 568 114 269 - do - Muhammad Abubakar 672 594 78 266 - do - Amjad Manzoor 682 614 68 269 - do - Shams Ur Rehman Afzal 1,297 605 692 527 - do - Imran Hameed 644 515 129 127 - do - Ammar Anwar Ch. 888 355 533 526 - do - Qadeer Ahmed Khan 1,887 1,507 380 444 - do - Qadeer Ahmed Khan 1,118 875 243 479 - do - Farhan Rashid 899 359 540 529 - do - Sahrish Khawaja 606 484 122 191 - do - Yousaf Imran Khan 893 387 506 479 - do - Rashid Ali Rashid 893 387 506 494 - do - Muhammad Khalid 928 417 511 525 - do - Muhammad Yaqoob 928 417 511 525 - do - Muhammad Yasin 899 389 510 528 - do - Afzal Ahmad Khan Babar 1,450 1,063 387 375 As per company
policy Azhar Nawaz 520 416 104 111 - do - M. Asif Javed 525 420 105 116 - do - Kamil Hussain 520 416 104 31 - do - Muhammad Iqbal Baig 644 515 129 301 - do - C/f 52,896 34,821 18,075 26,001

118 Pakarab Fertilizers Limited
Notes to and forming part of the Consolidated Financial Statementsfor the year ended December 31, 2013
2012 (Rupees in thousand)
Accumulated Book Sale Mode of Particulars Sold to Cost depreciation value proceeds disposal B/f 57,193 40,130 17,064 28,635 Muhammad Shahid 649 519 130 306 As per company
policy Faryad Hussain 644 526 118 239 - do - Syed M. Ali 649 530 119 244 - do - Hafiz Imran Anjum Saleemi 899 329 570 529 - do - M. Bilal Arshad 893 372 521 529 - do - Mudassar Hafeez 899 359 540 529 - do - Shahid Habib 825 495 330 481 - do - Imran Ali Bhatti 928 417 511 525 - do - Ahmad Majeed 908 393 515 482 - do - Accidental loss 1,387 555 832 1,325 Insurance claim Accidental loss 1,476 714 762 1,414 - do - Accidental loss 1,961 360 1,601 1,889 - do - Related parties Reliance Weaving Mills Limited 1,635 1,291 344 344 Negotiation Fatima Fertilizer Company Limited 42,902 28,128 14,774 23,687 - do - Plant & Outside party machinery Johnson Matthey Public Limited Company, United Kingdom 6,759 91 6,668 2,035 Negotiation Other assets with book value less than Rs 50,000 14,358 14,358 - 4,089 130,668 84,258 46,410 64,648
2013 2012 (Rupees in thousand)
23.2 Capital work - in progress
Civil works - note 23.2.1 11,713 119,974 Plant and machinery - note 23.2.2 51,795 665,657 Advances - considered good - against purchase of plant and machinery 3,835 80,158 - to contractor 2,202 2,399 - to suppliers 6,211 8,629 Intangible asset under development - computer software 202 - Others 1,313 1,132 Unallocated expenditure - (14,003)
77,271 863,946
23.2.1 Includes purchases of Rs 0.026 million (2012: Rs 1.236 million) from FATIMA, a related party.
23.2.2 During the year, borrowing cost of Nil (2012: Rs 36.854 million) has been capitalised.
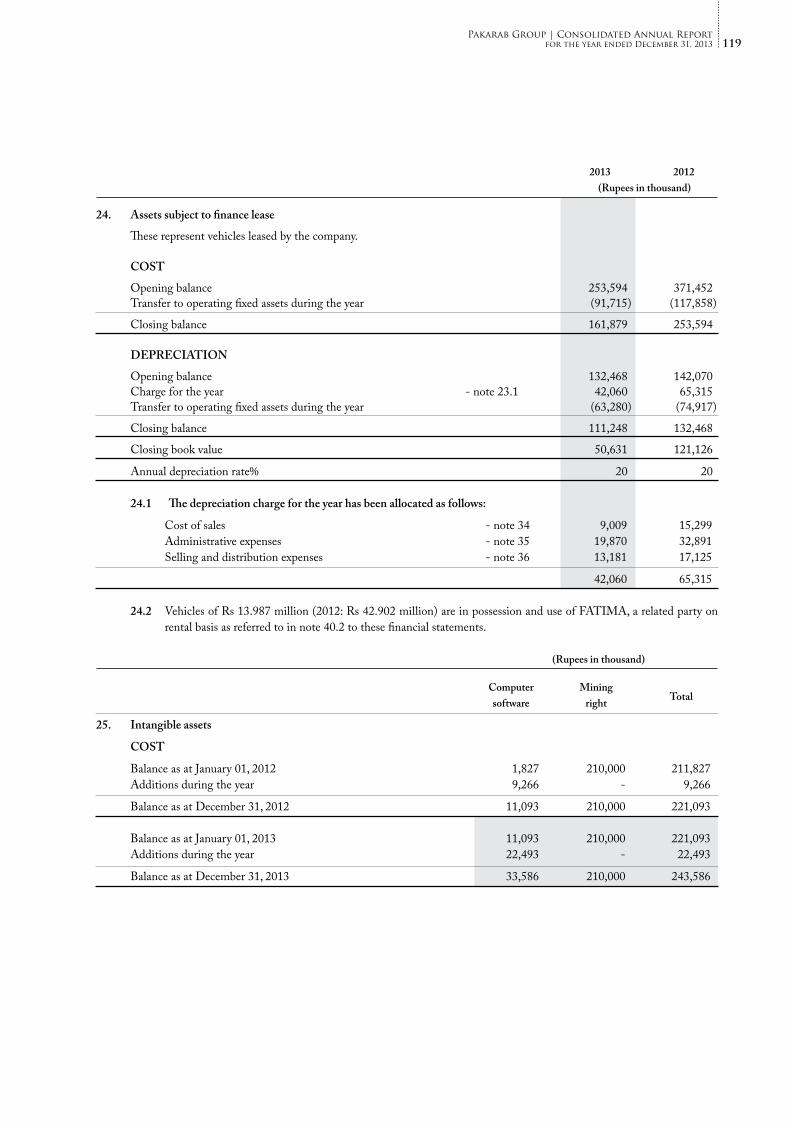
119Pakarab Group | Consolidated Annual Report
for the year ended December 31, 2013
2013 2012 (Rupees in thousand)
24. Assets subject to finance lease
These represent vehicles leased by the company. COST
Opening balance 253,594 371,452 Transfer to operating fixed assets during the year (91,715) (117,858)
Closing balance 161,879 253,594 DEPRECIATION
Opening balance 132,468 142,070 Charge for the year - note 23.1 42,060 65,315 Transfer to operating fixed assets during the year (63,280) (74,917)
Closing balance 111,248 132,468
Closing book value 50,631 121,126
Annual depreciation rate% 20 20 24.1 The depreciation charge for the year has been allocated as follows:
Cost of sales - note 34 9,009 15,299 Administrative expenses - note 35 19,870 32,891 Selling and distribution expenses - note 36 13,181 17,125
42,060 65,315 24.2 Vehicles of Rs 13.987 million (2012: Rs 42.902 million) are in possession and use of FATIMA, a related party on
rental basis as referred to in note 40.2 to these financial statements.
(Rupees in thousand)
Computer Mining Total software right
25. Intangible assets
COST
Balance as at January 01, 2012 1,827 210,000 211,827 Additions during the year 9,266 - 9,266
Balance as at December 31, 2012 11,093 210,000 221,093 Balance as at January 01, 2013 11,093 210,000 221,093 Additions during the year 22,493 - 22,493
Balance as at December 31, 2013 33,586 210,000 243,586

120 Pakarab Fertilizers Limited
Notes to and forming part of the Consolidated Financial Statementsfor the year ended December 31, 2013
(Rupees in thousand)
Computer Mining Total software right
AMORTIZATION
Balance as at January 01, 2012 1,827 49,000 50,827 Charge for the year - note 24.2 193 21,000 21,193
Balance as at December 31, 2012 2,020 70,000 72,020 Balance as at January 01, 2013 2,020 70,000 72,020 Charge for the year - note 24.2 6,159 21,000 27,159
Balance as at December 31, 2013 8,179 91,000 99,179 Book value as at December 31, 2012 9,073 140,000 149,073
Book value as at December 31, 2013 25,407 119,000 144,407
Annual amortization rate% 25 10
25.1 Mining rights represent rights acquired for extraction of rock phosphate from a block of area in District Abbottabad for a ten years period ending on August 11, 2019. The aforesaid area is in the possession and control of Pakistan Mining Company Limited (‘PMCL’), a related party, which provides rock phosphate extraction services to the group as per the Services Agreement.
2013 2012 (Rupees in thousand)
25.2 The amortization charge for the year has been allocated as follows:
Cost of sales (included in raw materials consumed) 21,000 21,000 Administrative expenses - note 36 6,159 193
27,159 21,193
26. Goodwill
This represents goodwill on amalgamation as referred to in note 17 to these financial statements.
Impairment testing of goodwill has been carried out at the fertilizers segment level. The recoverable amount of the Cash Generating Unit has been determined based on a value in use calculation. This calculation uses cash flow projections based on financial budgets approved by management covering a five-year period. The cash flows beyond the five year period are extrapolated using estimated growth rates stated below. The growth rate does not exceed the long term average growth rate for the fertilizer industry. The recoverable amount calculated based on value in use exceeded carrying value by Rs 11,797.784 million. An annual growth rate of 11.23% or a rise in discount rate to 21.67% would remove the remaining headroom.
The key assumptions used in value-in-use calculations are as follows:
Budgeted annual operating days (average of next five years) 246 Long term/terminal growth rate 3% Discount rate 20.53%
Carrying amount of the Cash Generating Unit Rupees in thousand 40,614,057
Recoverable amount Rupees in thousand 42,498,883
The above cash flow projections are principally based on the assumption that gas supply would resume to the group. During the previous and current year, the fertilizers segment has faced excessive gas shortages due to which the operations have remained suspended for major part of the years resulting into losses for the years. However, during the current year, the Government of Pakistan (‘GOP’) has approved long term gas supply arrangements from dedicated sources for fertilizer plants and subsequent to year end, GOP has announced to resume gas supply to the fertilizer sector from the existing gas supply network, based on which management feels that the current gas shortage is of a temporary nature and the gas supply will resume in the near future which would result in increased production as compared to previous and current years thereby leading to future profits.

121Pakarab Group | Consolidated Annual Report
for the year ended December 31, 2013
2013 2012 (Rupees in thousand)
27. Long term investments
Available for sale: Held to maturity: - Other - note 27.1 34,409 30,681 Advance against purchase of shares in Multan Real Estate Company (Private) Limited, Related party 64,004 62,596
98,413 93,277
27.1 Investment - Other
This represents Defence Saving Certificates issued for a period of ten years, which will mature on September 11, 2019. Yield to maturity on these certificates is 12.15%. These certificates have been pledged as security with the Director General, Mines & Minerals, Government of Khyber Pakhtunkhwa as per the terms of the mining agreement as referred to in note 14.1.
2013 2012 (Rupees in thousand)
28. Stores and spare parts
Chemicals and catalysts - note 28.1 1,109,427 1,158,793 Stores 130,562 144,353 Spare parts [including in transit Rs 8.609 million [(2012: Rs 86.915 million)] 1,746,758 1,799,153
2,986,747 3,102,299 Less: Provision for obsolete items 76,224 76,224
- note 28.2 2,910,523 3,026,075
28.1 Included in chemicals and catalysts is platinum, rhodium and palladium of Rs 69.337 million (2012: Rs 69.337 million) which is in the possession of Johnson Matthey Public Limited Company, United Kingdom on behalf of the company for refining purposes.
28.2 Stores and spares include items which may result in fixed capital expenditure but are not distinguishable.
2013 2012 (Rupees in thousand)
29. Stock-in-trade
Raw materials - note 29.2 823,379 1,687,433 Packing materials 37,347 50,727 Mid products 40,519 38,080 Work-in-process 31,487 61,796 Finished goods: - Own manufactured: Fertilizers 9,074 8,521 Emission reductions - note 29.3 11,317 5,064 Polypropylene sacks and cloth 4,742 54,962
25,133 68,547 - Fertilizer purchased for resale 18 -
957,883 1,906,583

122 Pakarab Fertilizers Limited
29.1 Raw materials and finished goods amounting to Rs 366.350 million (2012: Rs 981.903 million) are pledged with lenders as security against short term borrowings as referred to in note 16.
29.2 Includes rock phosphate amounting to Rs 42.068 million (2012: 10.567 million) and Rs 103.389 million (2012: Rs
279.863 million) which is in the possession of related parties, PMCL and FATIMA respectively. The rock phophate in possession of PMCL is due to the reason explained in note 25.1 to these financial statements and the rock phosphate in possession of FATIMA is due to the reason that it has been provided on loan basis.
29.3 This represents emission reductions costing Rs 34.169 million carried at their Net Realizable Value (‘NRV’)
amounting to Rs 11.317 million. The NRV write down expense of Rs 22.852 million has been charged to cost of sales.
2013 2012 (Rupees in thousand)
30. Trade debts
Considered good: - Secured (by way of bank guarantees and security deposits) 27,031 103,121 - Unsecured - note 30.2 307,495 571,325
334,526 674,446 30.1 These are in the normal course of business and certain debts carry interest ranging from 1% to 9% (2012: 1% to 9%)
per annum. 30.2 Includes the following amounts due from related parties:
2013 2012 (Rupees in thousand)
Fatima Fertilizer Company Limited 38,396 8,818 Fatima Sugar Mills Limited 37,177 38,738 Reliance Weaving Mills Limited 3,008 1,588 Reliance Commodities (Private) Limited 3,957 - Fazal Cloth Mills Limited 750 -
83,288 49,144 The age analysis of trade debts due from related parties is as follows: Neither past due nor impaired 82,538 49,144 Past due but not impaired - 31 to 60 days 750 -
83,288 49,144
Notes to and forming part of the Consolidated Financial Statementsfor the year ended December 31, 2013

123Pakarab Group | Consolidated Annual Report
for the year ended December 31, 2013
2013 2012 (Rupees in thousand)
31. Advances, deposits, prepayments and other receivables
Advances - considered good: - To employees - note 31.1 5,017 16,747 - To suppliers 36,788 68,389 Trade deposits 100 100 Prepayments 51,895 95,947 Due from related party: - Interest receivable on long term loans - 1,477,634 - Interest receivable on preference dividend receivable - 94,017 - Preference dividend receivable - 1,337,214 Interest receivable on bank deposits 2,114 1,035 Balances with statutory authorities: - Sales tax - considered good - 104,741 - considered doubtful 8,911 8,911
8,911 113,652 - Income tax recoverable 2,947,884 2,849,127 - Custom duty recoverable 9,811 9,811 - Export rebate recoverable 2,421 572 Letters of credit - margins, deposits, opening charges etc. 1,419 1,531 Security deposits - note 31.2 131,319 20,192 Other receivables - considered good 28,757 12,887
3,226,436 6,098,855 Less: Provision for doubtful receivable 8,911 8,911
3,217,525 6,089,944 31.1 Included in advances to employees are amounts due from executives of Rs 1.345 million (2011: Rs 6.950 million). 31.2 Includes an amount of Rs 100 million (2012: Nil) deposited with Sindh High Court, in respect of suit filed by the
group in relation to proposed acquisition of DH Fertilizers Limited. 2013 2012 (Rupees in thousand)
32. Short term investments
Assets at fair value through profit or loss: Wateen Telecom Limited Nil (2012: 2,000,000) fully paid ordinary shares of Rs 10 each - 5,960
- 5,960
Investment held for distribution to members - 1,078,200
- 1,084,160 33. Cash and bank balances
At banks on: - Saving accounts - note 33.1 & 33.2 64,125 698,633 - Current accounts - note 33.2 96,703 290,657
160,828 989,290 In hand 4,573 5,152
165,401 994,442

124 Pakarab Fertilizers Limited
Notes to and forming part of the Consolidated Financial Statementsfor the year ended December 31, 2013
33.1 Profit on balances in saving accounts ranges from 5% to 10% (2012: 5% to 10%) per annum. 33.2 Included in saving accounts is an amount of Rs 0.256 million (2012: Rs 17.637 million) which bears mark up at the
rate of 9% (2012: 9%) per annum and included in current accounts is an amount of Rs 4.005 million (2012: Rs 4.049 million), both placed with Summit Bank Limited, a related party.
2013 2012 (Rupees in thousand)
34. Sales
Fertilizer products: - Own manufactured 5,064,733 8,772,572 - Purchased for resale 3,522,521 21,497
8,587,254 8,794,069
Certified Emission Reductions (CERs) 2,009 223,310 Mid products 241,684 520,500 Rock phosphate 153,373 122,560 Processing income - note 34.1 - 12,551
397,066 878,921
Sales of fertilizers segment 8,984,320 9,672,990 Polypropylene sacks and cloth - note 34.2 1,435,824 - Export sales 54,297 - Export rebate 1,849 -
Sales of sacks segment 1,491,970 -
10,476,290 9,672,990 Less: Sales tax 1,475,137 1,255,351 Sales incentive 302,130 259,836 Discount - 21,645
1,777,267 1,536,832
8,699,023 8,136,158
34.1 This represents income from processing services rendered for a related party, FATIMA. 34.2 Includes sales to the following related parties:
Fatima Fertilizer Company Limited 701,438 - Fatima Sugar Mills Limited 63,559 - Reliance Weaving Mills Limited 8,173 - Reliance Commodities (Private) Limited 11,000 - Fazal Cloth Mills Limited 2,014 -
786,184 -

125Pakarab Group | Consolidated Annual Report
for the year ended December 31, 2013
2013 2012 (Rupees in thousand)
35. Cost of sales
Raw material consumed - note 35.1 & 35.2 2,455,840 2,194,693 Packing material consumed 13,723 98,237 Liners consumed 200,662 - Liner insertion cost 11,866 -
2,682,091 2,292,930 Salaries, wages and other benefits - note 35.3 & 35.4 617,808 691,704 Fuel and power - note 35.5 643,876 770,201 Chemicals and catalysts consumed 107,778 42,431 Spare parts consumed 111,676 183,705 Stores consumed 43,910 66,489 Travelling and conveyance 2,653 - Telephone, telex and postage 163 - Stationery, printing and periodicals 203 Repairs and maintenance 296,077 170,391 Rent, rates and taxes - note 35.4 2,089 - Insurance 275,446 282,609 Vehicle running expenses - note 35.4 990 - Entertainment - note 35.4 618 - Depreciation on operating fixed assets - note 23.1.3 204,254 829,836 Depreciation on assets subject to finance lease - note 24.1 9,009 15,299 Toll manufacturing charges and freight - note 35.6 709,822 - Utilities - note 35.4 48,164 - Fees and subscription 95 - Others - note 35.7 39,612 90,449
5,796,334 5,436,044
Opening stock of mid products and work-in-process 99,876 16,964 Closing stock of mid products and work-in-process (72,006) (38,080)
27,870 (21,116)
Cost of goods manufactured 5,824,204 5,414,928 Opening stock of finished goods 68,547 803,235 Closing stock of finished goods (25,133) (13,585)
43,414 789,650
Cost of goods sold - own manufactured 5,867,618 6,204,578 Cost of goods sold - purchased for resale - note 35.8 2,415,259 16,299
8,282,877 6,220,877
35.1 Includes feed gas consumed of Rs 576.356 million (2012: Rs 1,065.407 million) purchased from SNGPL, a related party.
35.2 Includes expenses of Rs 103.144 million (2012: Rs 113.503 million) for extraction of rock phosphate by Pakistan
Mining Company Limited, a related party, as explained in note 25.1 to these financial statements.

126 Pakarab Fertilizers Limited
2013 2012 (Rupees in thousand)
35.3 Salaries, wages and other benefits
Salaries, wages and other benefits include following in respect of gratuity: Current service cost 15,618 14,842 Interest cost for the year 6,668 6,031 Expected return on plan assets (4,751) (4,435) - 369
17,535 16,807 In addition to the above, salaries, wages and other benefits include Rs 14.176 million (2012: Rs 16.221 million) and
Rs 8.447 million (2012: Rs 17.607 million) in respect of provident fund contribution by the group and accumulating compensated absences respectively.
2013 2012 (Rupees in thousand)
35.4 Includes expenses charged by FATIMA, a related party:
Salaries, wages and other benefits 60 - Rent against lease of land 578 - Vehicle running expenses 137 - Entertainment 347 - Utilities 48,164 -
49,286 - 35.5 Includes fuel gas consumed of Rs 571.3 million (2012: Rs 715.540 million) purchased from SNGPL, a related party.
35.6 This includes processing services of Rs 679.291 million (2012: Nil) availed from FATIMA, a related party. 35.7 Includes operating lease rentals amounting to Rs 15.192 million (2012: Rs 14.234 million). 35.8 This includes fertilizer purchased from FATIMA, a related party amounting to Nil (2012: Rs 16.299 million).
2013 2012 (Rupees in thousand)
36. Administrative expenses
Salaries, wages and other benefits - note 36.1 326,477 378,570 Travelling and conveyance 17,535 71,579 Telephone, telex and postage 17,938 15,528 Stationery, printing and periodicals 8,577 6,138 Rent, rates and taxes - note 36.2 33,257 23,207 Fee and subscription 132 205 Repairs and maintenance 34,949 46,496 Aircraft operating expenses - note 36.3 75,830 89,281 Insurance 14,410 12,933 Legal and professional charges - note 36.4 45,445 48,063 Vehicle running expenses 7,069 9,084 Entertainment 3,531 5,418 Advertisement 1,003 2,986 Depreciation on operating fixed assets - note 23.1.3 215,658 296,239 Depreciation on assets subject to finance lease - note 24.1 19,870 32,891 Amortization on intangible assets - note 25.2 6,159 193 CDM administrative expenses 2,151 7,202 Others - note 36.5 66,808 128,263
- note 36.6 896,799 1,174,276
Notes to and forming part of the Consolidated Financial Statementsfor the year ended December 31, 2013

127Pakarab Group | Consolidated Annual Report
for the year ended December 31, 2013
2013 2012 (Rupees in thousand)
36.1 Salaries, wages and other benefits
Salaries, wages and other benefits include following in respect of gratuity: Current service cost 5,602 5,623 Interest cost for the year 2,392 2,286 Expected return on plan assets (1,849) (1,681) Actuarial loss - 140 Less: amount charged to related party (1,694) (1,595)
4,451 4,773 In addition to the above, salaries, wages and other benefits include Rs 9.091 million (2012: Rs 7.181 million) and
Rs 6.913 million (2012: Rs 5.509 million) in respect of provident fund contribution by the group and accumulating compensated absences respectively.
36.2 Includes operating lease rentals amounting to Rs 14.967 million (2012: Rs 8 million). 36.3 Includes expenses of Rs 28.253 million (2012: Rs 34.152 million) for flying and maintenance services of the group’s
aircrafts by Air One (Private) Limited, a related party as per the Services Agreement.
2013 2012 (Rupees in thousand)
36.4 Professional services
The charges for professional services include the following in respect of auditors’ services for: - Statutory audit 3,070 2,920 - Half yearly review - 825 - Tax services 2,208 12,530 - Assurance and other certification services 65 3,410 - Out of pocket expenses 614 873
5,957 20,558 36.5 Includes expenses of Rs 9.416 million (2012: Rs 38.532 million) for research and development activities of the
extracted rock phosphate, which has been carried out by a foreign consultant. 36.6 Includes amount of Rs 173.986 million (2012: Rs 115 million) which represents common costs charged to the group
by FATIMA, a related party, out of which Rs 172.913 million (2012: Rs 114.929 million) is covered under the Expense Sharing Agreement. Also included is an amount of Rs 114.603 million (2012: Rs 133.771 million) which represents common costs charged by the group to FATIMA, a related party as per the Expense Sharing Agreement.

128 Pakarab Fertilizers Limited
Notes to and forming part of the Consolidated Financial Statementsfor the year ended December 31, 2013
2013 2012 (Rupees in thousand)
37. Selling and distribution expenses
Salaries, wages and other benefits - note 37.1 20,947 33,970 Travelling and conveyance 2,017 4,167 Telephone, telex and postage 1,475 3,120 Stationery, printing and periodicals 284 976 Rent, rates and taxes - note 37.2 7,157 12,723 Repairs and maintenance 793 2,635 Insurance 706 955 Vehicle running expenses 1,950 4,237 Entertainment 293 1,507 Advertisement and sale promotion 78,738 67,138 Depreciation on operating fixed assets - note 23.1.3 4,366 1,975 Depreciation on assets subject to finance lease - note 24.1 13,181 17,125 Transportation and freight 328,358 120,060 Fees and subscription 223 - Utilities 171 455 Technical services 92 1,005 CERs share of Mitsubishi Corporation, Japan 44,988 25,026 Others 2,073 1,976
- note 37.3 507,812 299,050
37.1 Salaries, wages and other benefits
Salaries, wages and other benefits include following in respect of gratuity: Current service cost 7,992 6,637 Interest cost for the year 3,413 2,698 Expected return on plan assets (2,432) (1,984) Past service cost - 165 Less: amount charged to related party (7,796) (7,348)
1,177 168 In addition to the above, salaries, wages and other benefits include Rs 8.234 million (2012: Rs 7.742 million) and
Rs 4.739 million (2012: Rs 3.999 million) in respect of provident fund contribution by the group and accumulating compensated absences respectively.
37.2 Includes operating lease rentals amounting to Rs 17.502 million (2012: Rs 12.523 million). 37.3 Includes amount of Rs 27.045 million (2012: Rs 36.781 million) which represents common costs charged to the
group by its related party, FATIMA as per the Expense Sharing Agreement. Also included is an amount of Rs 345.887 million (2012: Rs 425.150 million) which represents common costs charged by the group to its related party, FATIMA as per the Expense Sharing Agreement.

129Pakarab Group | Consolidated Annual Report
for the year ended December 31, 2013
2013 2012 (Rupees in thousand)
38. Finance cost
Interest/mark up on: - Listed TFCs - secured 28,686 329,864 - PPTFCs - secured 331,551 633,526 - Finance leases 3,845 12,478 - Share deposit money from related party - note 38.1 - 14,583 - Short term borrowings - secured - note 38.2 608,024 712,789 - Short term borrowing from related party - note 38.3 - 17,429 - Long term loans - secured 412,728 589,664 - Syndicated term finance - secured 47,203 230,502 - Short term loan from related party - secured - note 38.3 147,148 - Loan arrangement fees and other charges 6,072 22,385 Acceptance commission on letter of credit 44,369 37,378 Bank charges 10,020 10,438
1,639,646 2,611,036
38.1 This relates to Fazal Cloth Mills Limited. 38.2 Includes interest expense of Rs 42.860 million (2012: Rs 51.835 million) on account of running finance facility
availed from Summit Bank Limited, a related party. 38.3 This relates to FATIMA.
2013 2012 (Rupees in thousand)
39. Other expenses
Workers’ welfare fund - 68,084 Workers’ profit participation fund - note 19 2,524 - Donations - note 39.1 152,900 10,290 Exchange loss 231,516 139,757
386,940 218,131
2013 2012 (Rupees in thousand)
Name and address of donee Directors Interest in donee
Mukhtar A. Sheikh Trust, 2nd Mr. Fawad Ahmad Mukhtar Trustees 150,000 5,640 Floor, Trust Plaza, L.M.Q Road, & Mr. Faisal Ahmad Mukhtar Multan.

130 Pakarab Fertilizers Limited
Notes to and forming part of the Consolidated Financial Statementsfor the year ended December 31, 2013
2013 2012 (Rupees in thousand)
40. Other income
Income from financial assets:
Income on bank deposits - note 40.1 29,331 28,032 Income from FATIMA, a related party: - Interest income on long term loan (from STFF) - 221,792 - Interest income on long term loan - 313,515 - Interest income on short term loan - 27,229 - Interest income on preference dividend receivable 24,147 94,017 - Accrued dividend on preference shares - 194,067 Gain on conversion of preference shares - 455,400 Unrealised gain on investment held to maturity 3,728 3,332 Mark-up on credit sale of fertilizers 388 5,956 Gain on disposal of short-term investment 2,808 - Gain on derivative financial instruments 2,217 2,929
62,619 1,346,269 Income from non-financial assets:
Rental income - note 40.2 45,517 46,587 Profit on disposal of operating fixed assets 42,372 18,238 Scrap sales and sundry income 57,300 24,387 Gain on recovery of chemical catalysts - 9,468 Provisions and unclaimed balances written back 3,861 81,444 Income from biological laboratory 3,481 2,173 Excess insurance premium refunded 45,431 -
197,962 182,297
260,581 1,528,566
40.1 Includes interest income of Rs 13.282 million (2012: Rs 14.520 million) on saving account with Summit Bank Limited, a related party.
40.2 Includes rental income of Rs 31.511 million (2012: Rs 31.741 million) for vehicles in use of FATIMA, a related party
as referred to in note 24.2 to these financial statements.
2013 2012 (Rupees in thousand)
41. Taxation
Current - For the year 34,588 76,768 - Prior years - (870,872)
34,588 (794,104) Deferred - note 13 (987,991) 133,793
(953,403) (660,311) The provision for current taxation represents minimum tax under section 113 of the Income Tax Ordinance, 2001 on
turnover from local sales. In addition to this, it includes tax on exports and rental income which is full and final discharge of group’s tax liability in respect of income arising from such sources.

131Pakarab Group | Consolidated Annual Report
for the year ended December 31, 2013
2013 2012 % age % age
41.1 Tax charge reconciliation
Numerical reconciliation between the average effective tax rate and the applicable tax rate Applicable tax rate 35.00 35.00
Tax effect of amounts that are: Not deductible for tax purposes (1.94) (0.40) Exempt for tax purposes (0.67) 6.01 Not taxable under the law (0.02) 15.80 Chargeable at lower rate of tax 0.41 1.25 Chargeable at different rate of tax 0.01 (0.09) Allowable as tax credit 2.07 0.26 Effect of change in prior years’ tax (0.25) 15.07
(0.39) 37.90
Average effective tax rate 34.61 72.90
2013 2012 (Rupees in thousand)
42. Cash generated from operations
Loss before taxation (2,754,470) (905,766) Adjustments for non-cash charges and other items: - Depreciation on operating fixed assets 424,278 1,128,813 - Depreciation on leased assets 42,060 65,315 - Amortization on intangible assets 27,159 21,193 - Retirement benefits accrued 72,035 56,817 - Profit on disposal of operating fixed assets (42,372) (18,238) - Provisions and unclaimed balances written back (3,861) (81,444) - Finance cost 1,639,646 2,611,036 - Income on bank deposits (29,331) (28,032) - Interest income on loans to related party (24,147) (656,553) - Loss on re-measurement of investments - 47,120 - Gain on conversion of preference shares - (455,400) - Dividend income on preference shares of related party - (194,067) - Unrealised gain on investment held to maturity (3,728) (3,332) - Unrealised gain on recovery of catalyst - - - Exchange loss 231,516 91,955 - Gain on derivative financial instruments (2,217) (2,929) - Gain on disposal of investment (2,808) - Profit before working capital changes (426,240) 1,676,488 Effect on cash flow due to working capital changes - Decrease/(increase) in stores and spare parts 115,691 (511,194) - Decrease in stock-in-trade 948,700 150,780 - Decrease in trade debts 339,920 270,172 - Decrease in advances, deposits prepayments and other receivables 73,017 340,102 - Decrease in trade and other payables 169,124 (102,823)
1,646,452 147,037
1,220,212 1,823,525
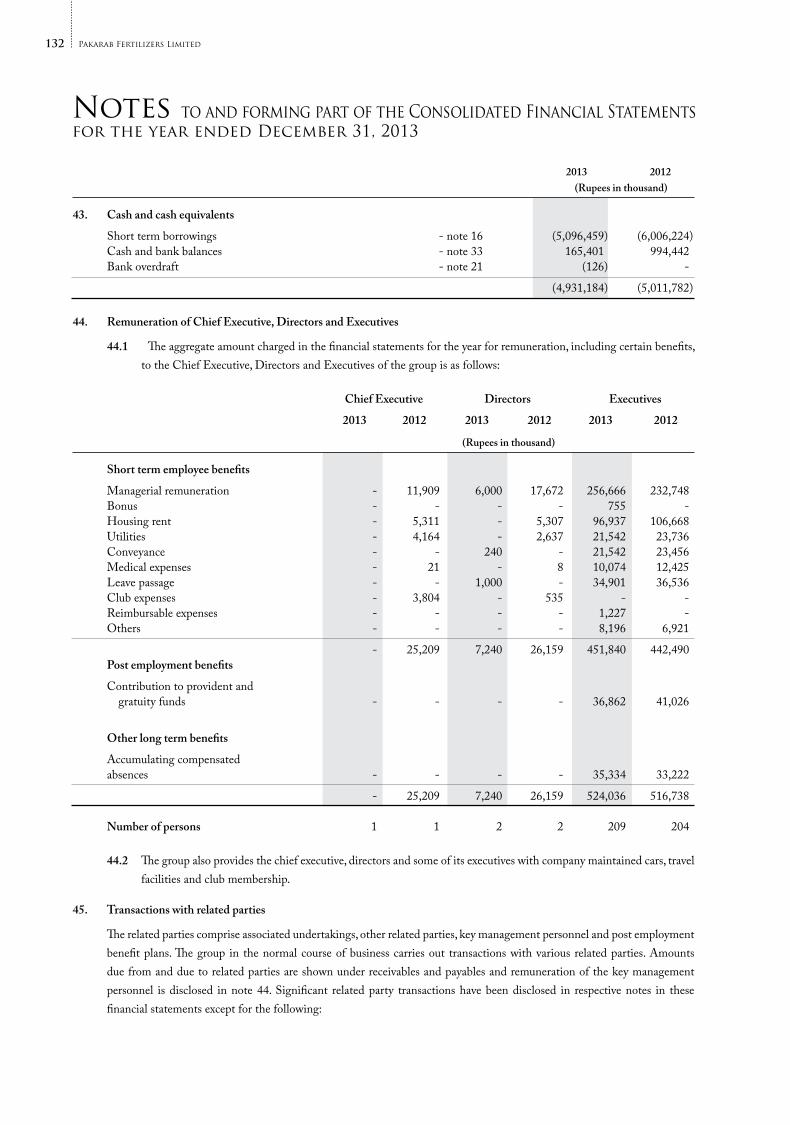
132 Pakarab Fertilizers Limited
Notes to and forming part of the Consolidated Financial Statementsfor the year ended December 31, 2013
2013 2012 (Rupees in thousand)
43. Cash and cash equivalents
Short term borrowings - note 16 (5,096,459) (6,006,224) Cash and bank balances - note 33 165,401 994,442 Bank overdraft - note 21 (126) -
(4,931,184) (5,011,782)
44. Remuneration of Chief Executive, Directors and Executives
44.1 The aggregate amount charged in the financial statements for the year for remuneration, including certain benefits, to the Chief Executive, Directors and Executives of the group is as follows:
Chief Executive Directors Executives
2013 2012 2013 2012 2013 2012
(Rupees in thousand)
Short term employee benefits
Managerial remuneration - 11,909 6,000 17,672 256,666 232,748 Bonus - - - - 755 - Housing rent - 5,311 - 5,307 96,937 106,668 Utilities - 4,164 - 2,637 21,542 23,736 Conveyance - - 240 - 21,542 23,456 Medical expenses - 21 - 8 10,074 12,425 Leave passage - - 1,000 - 34,901 36,536 Club expenses - 3,804 - 535 - - Reimbursable expenses - - - - 1,227 - Others - - - - 8,196 6,921
- 25,209 7,240 26,159 451,840 442,490 Post employment benefits
Contribution to provident and gratuity funds - - - - 36,862 41,026
Other long term benefits
Accumulating compensated absences - - - - 35,334 33,222
- 25,209 7,240 26,159 524,036 516,738 Number of persons 1 1 2 2 209 204
44.2 The group also provides the chief executive, directors and some of its executives with company maintained cars, travel facilities and club membership.
45. Transactions with related parties
The related parties comprise associated undertakings, other related parties, key management personnel and post employment benefit plans. The group in the normal course of business carries out transactions with various related parties. Amounts due from and due to related parties are shown under receivables and payables and remuneration of the key management personnel is disclosed in note 44. Significant related party transactions have been disclosed in respective notes in these financial statements except for the following:

133Pakarab Group | Consolidated Annual Report
for the year ended December 31, 2013
2013 2012 (Rupees in thousand)
Relationship with the company Nature of transactions
i. Associated undertakings Sale of goods and services 179,646 339,224 Purchase of goods 53,135 - ii. Post employment benefit plans Expense charged in respect of 86,277 91,650 retirement benefit plans
2013 2012
46. Capacity and production
Urea
Rated production capacity M. Tons 92,400 92,400 Actual urea produced M. Tons 2,262 - The low production of urea is due to shortage of natural gas and periodical maintenance.
Nitro Phosphate (NP)
Rated production capacity M. Tons 304,500 304,500 Actual NP produced M. Tons 48,382 75,732 The low production of NP is due to shortage of natural gas and periodical maintenance.
Calcium Ammonium Nitrate (CAN)
Rated production capacity M. Tons 450,000 450,000 Actual CAN produced M. Tons 55,419 100,302 The low production of CAN is due to shortage of natural gas and periodical maintenance.
Polypropylene sacks
Rated production capacity No. of sacks 52,800,000 41,800,000 Actual sacks produced No. of sacks 49,891,121 21,061,500
The low production of polypropylene sacks is due to the product mix.
47. Disclosures relating to Provident Fund
The company operates two provident funds: (i) Employees’ Provident Fund Trust Lahore
(ii) Employees’ Provident Fund Trust Multan The following information is based on the audited financial statements of the Funds as at June 30, 2013 and 2012:
2013 2012 (Rupees in thousand)
Size of the Fund - total assets 297,775 236,914 Cost of investments made 220,290 197,964 Percentage of investments made 79% 88% Fair value of investments 235,980 207,910 Break up of investments
Special accounts in a scheduled bank 202,290 173,964 Mutual funds - listed 33,690 33,946

134 Pakarab Fertilizers Limited
Notes to and forming part of the Consolidated Financial Statementsfor the year ended December 31, 2013
2013 2012 % age of size of the Fund
Break up of investments
Special accounts in a scheduled bank 68% 73% Mutual funds - listed 11% 14% Investments out of Provident Funds have been made in accordance with the provisions of section 227 of the Companies
Ordinance, 1984 and the rules formulated for this purpose.
48. Financial risk management
48.1 Financial risk factors
The group is exposed to a variety of financial risks: market risk (including currency risk, other price risk and interest rate risk), credit risk and liquidity risk. The group’s overall risk management programme focuses on the unpredictability of financial markets and seeks to minimise potential adverse effects on the financial performance.
Risk management is carried out by the group’s Board of Directors (the Board). The group’s finance department evaluates and hedges financial risks. The Board provides written principles for overall risk management, as well as written policies covering specific areas, such as foreign exchange risk, interest rate risk, credit risk, use of derivative financial instruments and non-derivative financial instruments, and investment of excess liquidity.
a) Market risk
i) Currency risk
Currency risk is the risk that the fair value or future cash flows of a financial instrument will fluctuate because of changes in foreign exchange rates. Currency risk arises mainly from future commercial transactions or receivables and payables that exist due to transactions in foreign currencies.
The group is exposed to currency risk arising from various currency exposures, primarily with respect to the United States Dollar (USD) and Euro. Currently, the group’s foreign exchange risk exposure is restricted to bank balances and amounts receivable from/payable to the foreign entities.
At December 31, 2013 if the Rupee had weakened/strengthened by 5% against the USD with all other variables held constant, the impact on pre tax loss for the year would have been Rs 120.402 million (2012: Rs 103.504 million) higher/lower, mainly as a result of exchange losses/gains on translation of USD denominated financial instruments.
At December 31, 2013 if the Rupee had weakened/strengthened by 5% against the Euro with all other variables held constant, the impact on pre tax loss for the year would have been Rs 2.591 million (2012: Rs 19.795 million) lower/higher, mainly as a result of exchange gains/losses on translation of Euro denominated financial instruments.
ii) Other price risk
Other price risk represents the risk that the fair value or future cash flows of a financial instrument will fluctuate because of changes in market prices (other than those arising from interest rate risk or currency risk), whether those changes are caused by factors specific to the individual financial instrument or its issuer, or factors affecting all similar financial instruments traded in the market. The group is not materially exposed to equity price risk since there are no significant investments in equity instruments traded in the market either classified as available-for-sale or at fair value through profit or loss at the reporting date. The group is also not exposed to commodity price risk since it does not hold any financial instrument based on commodity prices.

135Pakarab Group | Consolidated Annual Report
for the year ended December 31, 2013
iii) Interest rate risk
Interest rate risk represents the risk that the fair value or future cash flows of a financial instrument will fluctuate because of changes in market interest rates.
The group’s interest rate risk arises from long term finances, lease liabilities, short term borrowings, derivative
financial instruments and dividend receivable on preference shares. Borrowings obtained and loans provided at variable rates expose the group to cash flow interest rate risk.
At the balance sheet date, the interest rate profile of the group’s significant interest bearing financial instruments was:
2013 2012 (Rupees in thousand)
Fixed rate instruments:
Financial assets
Investment 34,409 30,681 Trade debts 26,140 101,503 Bank balances - saving accounts 64,125 698,633
124,674 830,817 Financial liabilities - -
Net exposure 124,674 830,817
Floating rate instruments:
Financial assets
Dividend receivable on preference shares - 1,337,214 Financial liabilities
Long term finances 4,772,920 9,601,142 Liabilities against assets subject to finance lease 38,811 113,189 Short term loan from related party 3,000,000 - Short term borrowings 5,096,459 6,006,224 Derivative financial instruments - 714
12,908,190 15,721,269
Net exposure (12,908,190) (14,384,055)
Fair value sensitivity analysis for fixed rate instruments
The group does not account for any fixed rate financial assets and liabilities at fair value through profit or loss. Therefore, a change in interest rate at the balance sheet date would not affect profit or loss of the group.
Cash flow sensitivity analysis for variable rate instruments
If interest rates on variable rate financial instruments, at the year end date, fluctuates by 1% higher/lower with all other variables held constant, pre tax loss for the year would have been Rs 129.044 million (2012: Rs 157.396 million) higher/lower, mainly as a result of higher/lower interest expense on floating rate instruments.

136 Pakarab Fertilizers Limited
Notes to and forming part of the Consolidated Financial Statementsfor the year ended December 31, 2013
b) Credit risk
Credit risk represents the risk of financial loss being caused if counter party fails to discharge an obligation. Credit risk of the group arises from cash and cash equivalents and deposits with banks and financial institutions, as
well as credit exposures to customers, including outstanding receivables and committed transactions. The management assesses the credit quality of the customers, taking into account their financial position, past experience and other factors. Individual risk limits are set based on internal or external ratings in accordance with limits set by the Board. The utilisation of credit limits is regularly monitored and major sales to customers are settled in cash. For banks and financial institutions, only independently rated parties with a strong credit rating are accepted.
The group monitors the credit quality of its financial assets with reference to historical performance of such assets and
available external credit ratings. The carrying values of financial assets which are neither past due nor impaired are as under:
2013 2012 (Rupees in thousand)
Long term investments 98,413 93,277 Security deposits 36,218 60,409 Trade debts 269,570 207,550 Advances, deposits and other receivables 200,497 3,012,999 Short term investments - 1,084,160 Cash and bank balances 165,401 994,442
770,099 5,452,837 The company’s exposure to credit risk is limited to the carrying amount of unsecured trade receivables and bank
balances. The ageing analysis of trade receivable balances is as follows:
2013 2012 (Rupees in thousand)
Neither past due nor impaired (upto 90 days) 269,570 207,550 Past due but not impaired: 91 to 180 days 28,935 19,985 181 to 270 days 8,349 166,823 271 to 360 days 6,866 97,943 above 360 days 20,806 182,145
64,956 466,896
334,526 674,446
The management estimates the recoverability of trade receivables on the basis of financial position and past history of its customers based on the objective evidence that it will not receive the amount due from the particular customer. A provision for doubtful debts is established when there is objective evidence that the group will not be able to collect all the amount due according to the original terms of the receivable. Significant financial difficulties of the debtors, probability that the debtor will enter bankruptcy or financial reorganisation, and default or delinquency in payments are considered indicators that the trade debt is impaired. The provision is recognised in the profit and loss account. The provision is written off by the group when it expects that it cannot recover the balance due. Any subsequent repayments in relation to amount written off, are credited directly to profit and loss account.

137Pakarab Group | Consolidated Annual Report
for the year ended December 31, 2013
The credit quality of company’s bank balances can be assessed with reference to external credit ratings as follows:
2013 2012 Rating Rating (Rupees in thousand) Short term Long term Agency
Al Baraka Islamic Bank Limited A1 A PACRA 235 10,892 Allied Bank Limited A1+ AA+ PACRA 37 604,087 Summit Bank Limited A-3 A- JCR-VIS 4,260 22,118 Askari Bank Limited A1+ AA PACRA 3 3 Bank Alfalah Limited A1+ AA PACRA 5 62 Dubai Islamic Bank Limited A-1 A JCR-VIS 73 73 Faysal Bank Limited A1+ AA PACRA 3,345 11,799 Habib Bank Limited A-1+ AAA JCR-VIS 77,802 250,549 Habib Metropolitan Bank Limited A1+ AA+ PACRA 28 100 MCB Bank Limited A1+ AAA PACRA 9,284 - Meezan Bank Limited A-1+ AA JCR-VIS 5,094 5,472 National Bank of Pakistan A-1+ AAA JCR-VIS 468 3,827 Silkbank Limited A-2 A- JCR-VIS - 1 Standard Chartered Bank(Pakistan) Limited” A1+ AAA PACRA 4,673 11,248 United Bank Limited A-1+ AA+ JCR-VIS 46,124 44,978 Zarai Taraqiati Bank Limited A-2 A JCR-VIS 56 55 Bank Islami Pakistan Limited A1 A PACRA 421 19,141 Sindh Bank Limited A-1+ AA- JCR-VIS 5,635 3,827 Burj Bank Limited A-1 A JCR-VIS 1,355 1,058 The Bank of Punjab A1+ AA- PACRA 9 - KASB Bank Limited A-2 BBB+ JCR-VIS 1,921 -
160,828 989,290 Due to the group’s long standing business relationships with these counterparties and after giving due consideration
to their strong financial standing, management does not expect non-performance by these counter parties on their obligations to the group. Accordingly, the credit risk is minimal.
c) Liquidity risk
Liquidity risk is the risk that an entity will encounter difficulty in meeting obligations associated with financial liabilities.
The group’s approach to managing liquidity is to ensure that, as far as possible, it always has sufficient liquidity to meet its liabilities when due, under both normal and stressed conditions, without incurring unacceptable loss or risking damage to the group’s reputation.

138 Pakarab Fertilizers Limited
Notes to and forming part of the Consolidated Financial Statementsfor the year ended December 31, 2013
The following are the contractual maturities of financial liabilities as at December 31, 2013 and December 31, 2012:
At December 31, 2013 Carrying Less than One to More than
amount one year five years five years (Rupees in thousand)
Long term finances 4,772,920 3,164,420 1,608,500 - Import bill payable 2,524,800 1,424,800 1,100,000 - Liabilities against assets subject to finance lease 38,811 38,811 - - Long term deposits 47,145 - - 47,145 Short term loan from related party 3,000,000 3,000,000 - - Short term borrowings 5,096,459 5,096,459 - - Trade and other payables 2,708,707 2,708,707 - - Accrued finance cost 346,031 346,031 - -
18,534,873 15,779,228 2,708,500 47,145
At December 31, 2012 Carrying Less than One to More than
amount one year five years five years (Rupees in thousand) Long term finances 9,601,142 4,828,218 4,772,924 - Import bill payable 2,330,400 842,000 1,488,400 - Liabilities against assets subject to finance lease 113,189 63,511 49,678 - Payable against mining rights 21,000 21,000 - - Long term deposits 46,180 - - 46,180 Short term borrowings 6,006,224 6,006,224 - - Derivative financial instruments 714 714 Trade and other payables 2,138,500 2,138,500 - - Accrued finance cost 371,016 371,016 - - Dividend payable 1,078,200 1,078,200 - -
21,706,565 15,349,383 6,311,002 46,180 48.2 Fair value estimation
The table below analyses financial instruments carried at fair value, by valuation method. The different levels have been defined as follows:
- Quoted prices (unadjusted) in active markets for identical assets or liabilities (level 1) - Inputs other than quoted prices included within level 1 that are observable for the asset or liability, either directly
(that is, as prices) or indirectly (that is, derived from prices) (level 2). - Inputs for the asset or liability that are not based on observable market data (that is, unobservable inputs) (level 3).

139Pakarab Group | Consolidated Annual Report
for the year ended December 31, 2013
The following table presents the company’s assets and liabilities that are measured at fair value at December 31, 2013.
Level 1 Level 2 Level 3 Total (Rupees in thousand)
Total assets - - - -
Total liabilities - - - - The following table presents the company’s assets and liabilities that are measured at fair value at December 31, 2012.
Level 1 Level 2 Level 3 Total (Rupees in thousand)
At fair value through profit or loss
Ordinary shares of Wateen Telecom Limited 5,960 - - 5,960 Total assets 5,960 - - 5,960 At fair value through profit or loss Derivative financial instruments - 714 - 714 Total liabilities - 714 - 714
The fair value of financial instruments traded in active markets is based on quoted market prices at the balance sheet date. A market is regarded as active if quoted prices are readily and regularly available from an exchange, dealer, broker, industry group, pricing service, or regulatory agency, and those prices represent actual and regularly occurring market transactions on an arm’s length basis. The quoted market price used for financial assets held by the group is the current bid price. These instruments are included in Level 1.
The fair value of financial instruments that are not traded in an active market is determined by using valuation techniques. These valuation techniques maximise the use of observable market data where it is available and rely as little as possible on entity specific estimates. If all significant inputs required to fair value an instrument are observable, the instrument is included in Level 2.
If one or more of the significant inputs is not based on observable market data, the instrument is included in Level 3.
Specific valuation techniques used to value financial instruments include: - Quoted market prices or dealer quotes for similar instruments. - The fair value of interest rate swaps is calculated as the present value of the estimated future cash flows based on
observable yield curves. - Other techniques, such as discounted cash flow analysis, are used to determine fair value for the remaining financial
instruments.

140 Pakarab Fertilizers Limited
Notes to and forming part of the Consolidated Financial Statementsfor the year ended December 31, 2013
The carrying value less impairment provision of trade and other receivables, and payables are assumed to approximate their fair values. The fair value of financial liabilities for disclosure purposes is estimated by discounting the future contractual cash flows at the current market interest rate that is available to the group for similar financial instruments. The carrying values of all financial assets and liabilities reflected in the financial statements approximate their fair values.
48.3 Financial instruments by categories
Held to Loans and maturity receivables Total (Rupees in thousand)
At December 31, 2013
Liabilities as per balance sheet
Security deposits - 36,218 36,218 Trade debts - 334,526 334,526 Advances, deposits and other receivables - 162,190 162,190 Investments 34,409 64,004 98,413 Cash and bank balances - 165,401 165,401
34,409 762,339 796,748
Financial liabilities at amortized cost (Rupees in As at December 31, 2013 thousand)
Liabilities as per balance sheet
Long term finances 4,772,920 Import bill payable 2,524,800 Liabilities against assets subject to finance lease 38,811 Long term deposits 47,145 Short term loan from related party 3,000,000 Short term borrowings 5,096,459 Trade and other payables 2,708,707 Accrued finance cost 346,031
18,534,873
Assets at fair Held to Loans and Total value through maturity receivables
profit or lossAs at December 31, 2012 (Rupees in thousand)
Assets as per balance sheet
Security deposits - - 60,409 60,409 Trade debts - - 570,992 570,992 Advances, deposits and other receivables - - 3,030,931 3,030,931 Investments 5,960 30,681 62,596 99,237 Cash and bank balances - - 993,957 993,957
5,960 30,681 4,718,885 4,755,526

141Pakarab Group | Consolidated Annual Report
for the year ended December 31, 2013
Financial Financial liabilities at liabilities at fair value amortized through profit cost or loss Total (Rupees in thousand)
At December 31, 2012
Liabilities as per balance sheet
Long term finances - 9,351,891 9,351,891 Import bill payable - 2,330,400 2,330,400 Liabilities against assets subject to finance lease - 113,189 113,189 Payable against mining rights - 21,000 21,000 Long term deposits - 46,180 46,180 Short term borrowings - 5,814,085 5,814,085 Derivative financial instruments 714 - 714 Trade and other payables - 1,996,874 1,996,874 Accrued finance cost - 365,673 365,673 Dividend payable - 1,078,200 1,078,200
714 21,117,492 21,118,206
48.4 Capital management
The group’s objectives when managing capital are to safeguard the group’s ability to continue as a going concern in order to provide returns for shareholders and benefits for other stakeholders and to maintain an optimal capital structure to reduce the cost of capital. In order to maintain or adjust the capital structure, the group may adjust the amount of dividends paid to shareholders, return capital to shareholders through repurchase of shares, issue new shares or sell assets to reduce debt. Consistent with others in the industry and the requirements of the lenders, the group monitors the capital structure on the basis of gearing ratio. This ratio is calculated as net debt divided by total capital employed. Net debt is calculated as total borrowings (including current and non-current borrowings) less cash and cash equivalents. Total capital includes equity as shown in the balance sheet plus net debt. The gearing ratios as at December 31, 2013 and 2012 were as follows:
2013 2012 (Rupees in thousand)
Borrowings - note 8, 14 & 15 7,772,920 9,351,891 Less: Cash and cash equivalents - note 43 (4,931,184) (5,011,782)
Net debt 12,704,104 14,363,673 Total equity (includes surplus on revaluation of operating fixed assets) 18,079,402 19,887,967
Gearing ratio Percentage 41% 42%

142 Pakarab Fertilizers Limited
2013 2012
49. Number of employees
Total number of employees as at December 31 1,021 1,096
Average number of employees during the year 1,064 945
50. Details of subsidiary
Name of subsidiary Accounting year end Percentage of holding Country of incorporation
Reliance Sacks Limited December 31, 2013 100% Pakistan
51. Date of authorization for issue These financial statements were authorized for issue on March 27, 2014 by the Board of Directors.
Chief Executive Director
Notes to and forming part of the Consolidated Financial Statementsfor the year ended December 31, 2013

143Pakarab Group | Consolidated Annual Report
for the year ended December 31, 2013
This page is intentionally left blank.

144 Pakarab Fertilizers Limited
Details of holding as on December 31, 2013
Shares held
1. Associated Companies, Undertakings and Related Parties
Reliance Commodities (Pvt) Limited 7,136,613 Fazal Cloth Mills Limited 25,790,610 Fatima Sugar Mills Limited 71,250,558 Arif Habib Corporation Limited 135,000,000
2. Mutual Funds -
3. Directors and their spouse(s) and minor children Mr. Arif Habib - Chairman 50,624,877 Mr. Fawad Ahmed Mukhtar - CEO 12,499,995 Mr. Rehman Naseem 964,425 Mr. Fazal Ahmed Shekih 30,943,236 Mr. Faisal Ahmed Mukhtar 30,943,236 Mr. Nasim Beg 1 Mr. Abdus Samad 1 Mr. Muhammad Kashif 1 Mrs. Zetun Arif 39,375,120 Mrs. Ambreen Fawad 3,577,410 Miss Meraj Fatima 4,030,431 Mr. Amin Rehman Fazal 6,428,045 Mr. Sadek Rehman 6,428,052
4. Executives -
5. Public Sector companies and corporations -
6. Banks, Development Finance Institutions, Non-Banking Finance Companies, Insurance Companies, Takaful, Modarabas and Pension Funds -
7. Shareholders holding five percent or more voting rights Arif Habib Corporation Limited 135,000,000 Fatima Sugar Mills Limited 71,250,558 Fazal Cloth Mills Limited 25,790,610 Mr. Arif Habib 50,624,877 Mrs. Zetun Arif 39,375,120 Mr. Faisal Ahmed Mukhtar 30,943,236 Mr. Fazal Ahmed Sheikh 30,943,236
Pattern of Shareholding as at December 31, 2013Disclosure Requirement under the Code of Corporate Governance

145Pakarab Group | Consolidated Annual Report
for the year ended December 31, 2013
Shareholding No. of Shareholders Total Shares held Percentage From To 1 100 3 3 0.00 900,001 965,000 1 964,425 0.21 3,575,001 3,580,000 1 3,577,410 0.79 4,030,001 4,035,000 4 16,121,724 3.58 6,425,001 6,430,000 2 12,856,097 2.86 6,455,001 6,460,000 2 12,916,096 2.87 7,135,001 7,140,000 1 7,136,613 1.59 12,495,001 12,500,000 1 12,499,995 2.78 25,790,001 25,795,000 1 25,790,610 5.73 30,940,001 30,945,000 2 61,886,472 13.75 39,375,001 39,380,000 1 39,375,120 8.75 50,620,001 50,625,000 1 50,624,877 11.25 71,250,001 71,255,000 1 71,250,558 15.83 134,995,001 135,000,000 1 135,000,000 30.00
Total 22 450,000,000 100
Categories of Shareholders Shares Held Percentage
Directors, Chief Executive Officer, and their spouse and minor children 185,814,830 41.29 Associated Companies, undertakings and related parties 239,177,781 53.15 Executives - - Public Sector Companies and Corporation - - Banks, Development Financial Institutions, Non Banking Financial Institutions, Insurance Companies, Takaful, Modarabas and Pension Funds - - Mutual Funds - - General Public a. Local - - b. Foreign - - Others 25,007,389 5.56 Total 450,000,000 100.00
Pattern of Shareholding as at December 31, 2013Category - wise
Pattern of Shareholding as at December 31, 2013

146 Pakarab Fertilizers Limited
The financial results will be announced as per the following tentative schedule:
Annual General Meeting April 30, 2014
1st Quarter ending March 31, 2014 Last week of April, 2014
2nd Quarter ending June 30, 2014 Third week of August, 2014
3rd Quarter ending September 30, 2014 Last week of October, 2014
Year ending December 31, 2014 Last week of January, 2015
Financial CAlendar

Form of Proxy41st Annual General Meeting
I/We
of
being a member(s) of Pakarab Fertilizers Limited hold
Ordinary Shares hereby appoint Mr. / Mrs. / Miss
of or falling him / her
of as my / our proxy in my / our absence to attend and vote for me / us and on my / our behalf
at the 41st Annual General Meeting of the Company to be held on April 30, 2014 and / or any adjournment thereof.
As witness my/our hand/seal this day of 2014.
Signed by
in the presence of
Folio No. CDC Account No.
Participant I.D. Account No.
Signature onFive Rupees
Revenue Stamp
The Signature shouldagree with the
specimen registeredwith the Company
IMPORTANT:1. This Proxy Form, duly completed and signed, must be received at the Registered Office of the Company, E-110, Khayaban-
e-Jinnah, Lahore Cantt., not less than 48 hours before the time of holding the meeting. 2. If a member appoints more than one proxy and more than one instruments of proxies are deposited by a member with the
Company, all such instruments of proxy shall be rendered invalid. 3. For CDC Account Holders / Corporate Entities
In addition to the above the following requirements have to be met.(i) Attested copies of CNIC or the passport of the beneficial owners and the proxy shall be provided with the proxy form. (ii) The proxy shall produce his original CNIC or original passport at the time of the meeting.(iii) In case of a corporate entity, the Board of Directors resolution / power of attorney with specimen signature shall be
submitted (unless it has been provided earlier alongwith proxy form to the Company).

AFFIXCORRECTPOSTAGE
PAKARAB FERTILIZERS LIMITEDE-110, Khayaban-e-Jinnah,Lahore Cantt.

