core petrophysics section5 notes imperial
TRANSCRIPT

8/9/2019 Core Petrophysics Section5 Notes Imperial
http://slidepdf.com/reader/full/core-petrophysics-section5-notes-imperial 1/7
5. Interpretation and application of core analysis dataExcept for those employed directly in laboratories where core analysis measurements areobtained, most petroleum professionals are users of petrophyscial data, rather than experts indata acquisition. However, it is important to know something of how the data are acquired tounderstand its limitations, reservoir applicability, and the associated uncertainties, and also to
be able to quality control the data which is often provided by a contractor. It is alsoimportant to be able to use and apply the data to reservoir problems of interest. This sectionwill work through a number of applications of core petrophysical data, including permeability
prediction in uncored wells (and uncored sections of cored wells), petrophysical rock typing,and integration of core petrophysical data with other data types. We will not do justice to the
broad range of application of core petrophysical data.
5.1 Predicting permeability in uncored wells and uncored intervals of cored wellsIn general a minority of wells on any field will be cored, so permeability data are availableonly for a subset of wells. Even in those wells where core data are acquired, there may be
missing core owing to incomplete recovery. As yet there is no routine method of acquiring permeability measurements at many short-spaced depth intervals using wireline tools alone;thus permeability data are usually acquired in the laboratory during basic core analysis and amethod is used to predict permeability in uncored wells (and sections of wells where core aremissing or incomplete) based on a relationship between core measurements of permeabilityand data acquired from wireline logs.
Much effort has been devoted to developing methods to relate core permeability and wirelinelog data (such as application of fuzzy logic and multivariate analysis) but many reservoirmodels still use permeability predictors based on a relationship developed between core
porosity ( core ) and core permeability ( k core ) measurements. Permeability is then predicted in
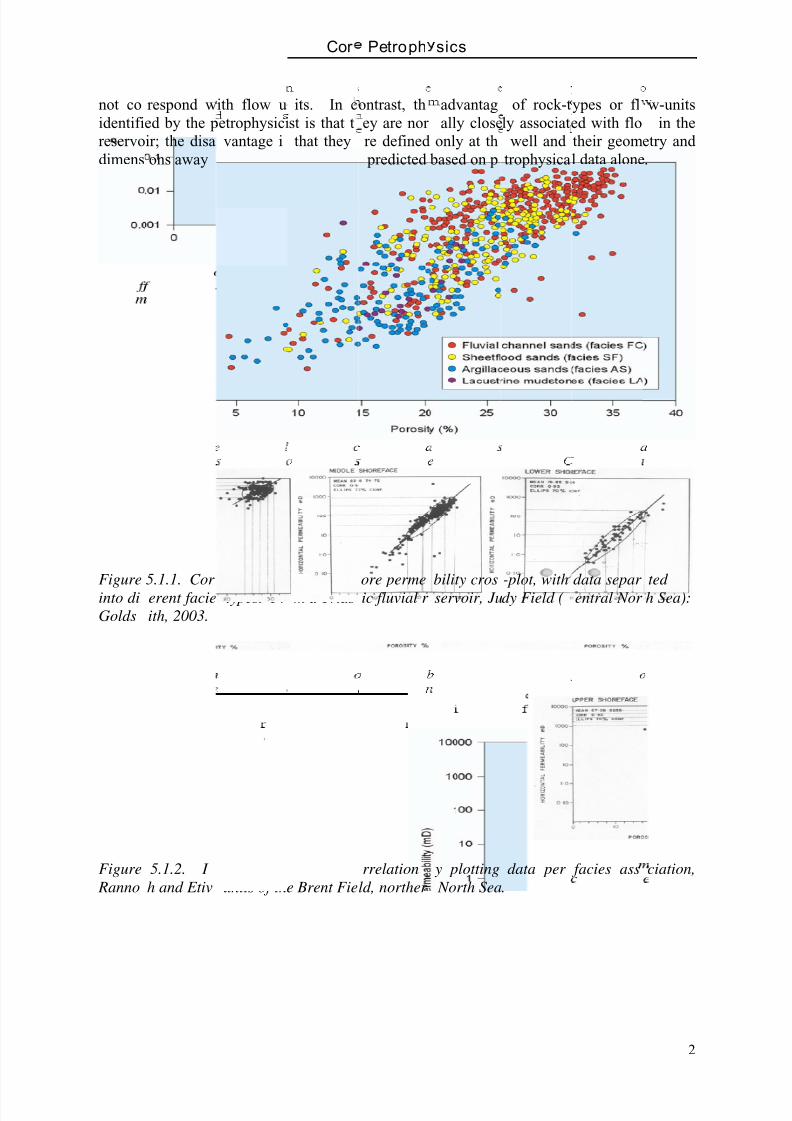
the uncored wells using the permeability predictor and porosity interpreted from wireline logmeasurements ( wireline ). The typical approach to developing a porosity-permeability (or‘ poro-perm ’) relationship is based around plots of log 10(k core ) versus core (e.g. Figure 5.1.1)In some cases, log 10(k core ) may be plotted against wireline values obtained at the same depth.However, this approach requires a very accurate correlation between core- and wireline-logdepth.
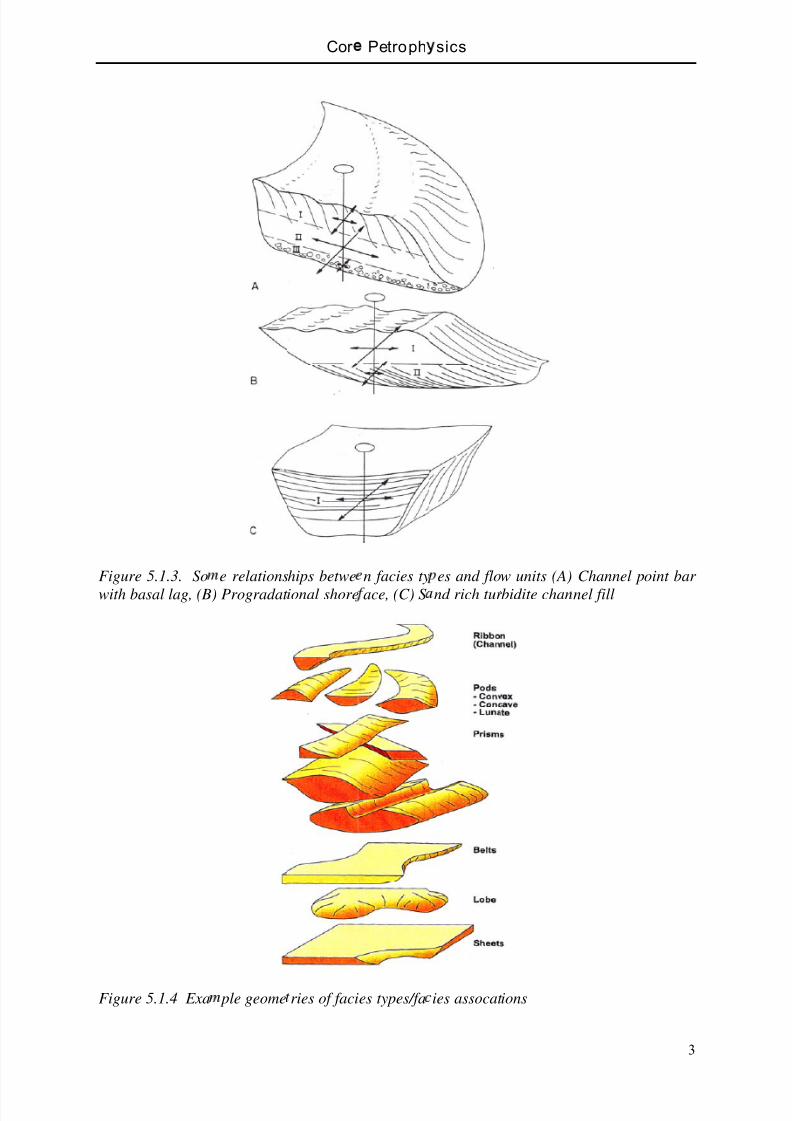
In many cases, the correlation between log 10(k core ) versus core may be poor. Attempts maythen be made to improve the correlation by grouping data on the basis of rock- or facies types(e.g. Figure 5.1.2). Ideally, the rock types identified using petrophysical data will beconsistent with those identified by the geologist based on lithology, sedimentary structuresand depositional processes etc. The process of grouping rocks based on their petrophysicalcharacteristics is known as ‘rock typing’ and reservoir intervals with similar petrophysical
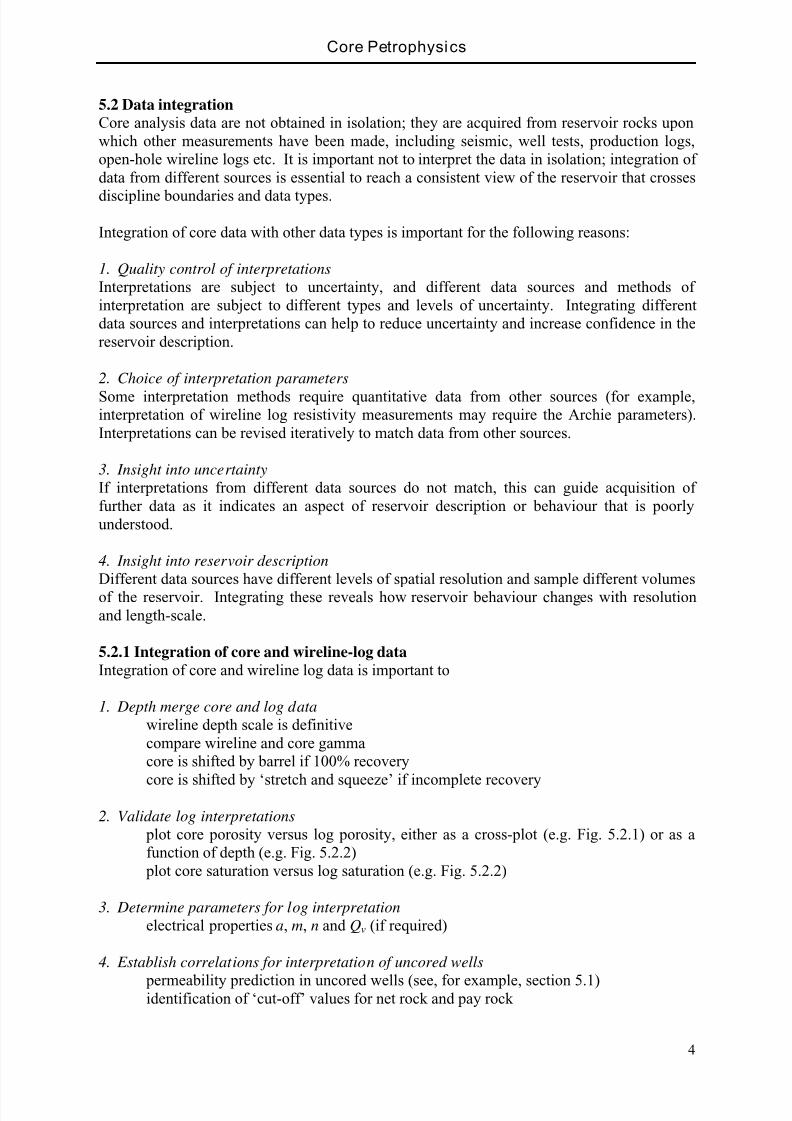
properties are sometimes termed ‘flow units’. A complicating factor in integrating geologicaland petrophysical rock types is that one geological rock- or facies-type may contain severalflow units and vice-versa. For example, a channel-fill sandbody may contain a coarse lag atthe base, a cross-bedded sandstone fill, and a mudstone top. Each of these may have different
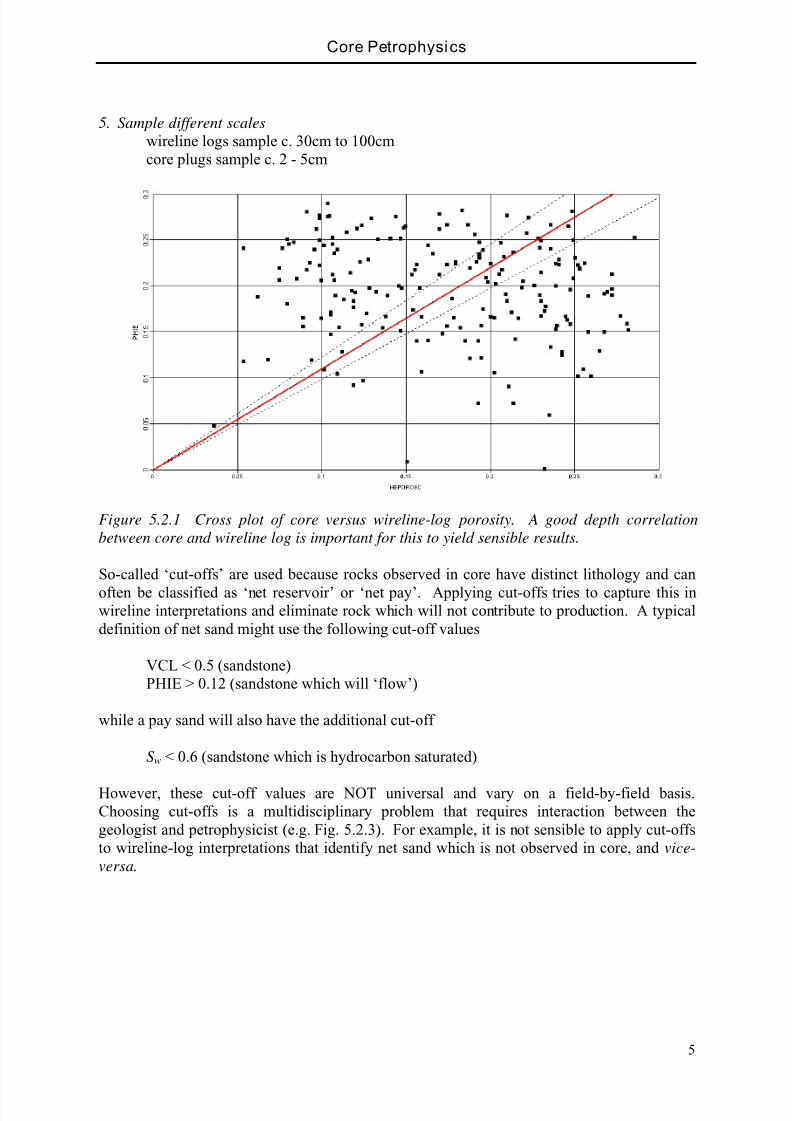
petrophysical properties and behave as a different flow unit (e.g. Fig. 5.1.3). The advantageof rock- or facies-types identified by the geologist is that they are normally associated with aconceptual or depositional model that allows their geometry and dimensions away from thewell to be predicted; for example, identifying a channel-fill sandbody at the well provides a
direct constraint on the likely lateral dimensions and geometry of the sandbody (e.g. Fig.5.1.4). The disadvantage of rock- or facies-types identified by the geologist is that they may
8/9/2019 Core Petrophysics Section5 Notes Imperial
http://slidepdf.com/reader/full/core-petrophysics-section5-notes-imperial 2/7
not coidentifireservodimens
Figureinto diGolds
Figure Ranno
respond wed by the pir; the disaons away
5.1.1. Cor erent facieith, 2003.
5.1.2. I h and Etiv
ith flow uetrophysicivantage i
rom the we
permeabi types. Fr
proved po units of th
Cor
its. In cst is that t that theyll cannot b
ity versusm a Trias
ro-perm ce Brent Fie
Petroph
ontrast, they are nor re defined predicted
ore permeic fluvial r
rrelationld, norther
sics
advantagally close
only at th based on p
bility crosservoir, Ju
y plotting North Sea
of rock-tly associat well andtrophysica
-plot, withdy Field (
data per.
ypes or fled with flotheir geoml data alone
data separ entral Nor
facies ass
2
w-unitsin the
etry and.
tedh Sea):
ciation,
8/9/2019 Core Petrophysics Section5 Notes Imperial
http://slidepdf.com/reader/full/core-petrophysics-section5-notes-imperial 3/7
8/9/2019 Core Petrophysics Section5 Notes Imperial
http://slidepdf.com/reader/full/core-petrophysics-section5-notes-imperial 4/7
Core Petrophysics
4
5.2 Data integrationCore analysis data are not obtained in isolation; they are acquired from reservoir rocks uponwhich other measurements have been made, including seismic, well tests, production logs,open-hole wireline logs etc. It is important not to interpret the data in isolation; integration ofdata from different sources is essential to reach a consistent view of the reservoir that crosses
discipline boundaries and data types.
Integration of core data with other data types is important for the following reasons:
1. Quality control of interpretationsInterpretations are subject to uncertainty, and different data sources and methods ofinterpretation are subject to different types and levels of uncertainty. Integrating differentdata sources and interpretations can help to reduce uncertainty and increase confidence in thereservoir description.
2. Choice of interpretation parametersSome interpretation methods require quantitative data from other sources (for example,interpretation of wireline log resistivity measurements may require the Archie parameters).Interpretations can be revised iteratively to match data from other sources.
3. Insight into uncertaintyIf interpretations from different data sources do not match, this can guide acquisition offurther data as it indicates an aspect of reservoir description or behaviour that is poorlyunderstood.
4. Insight into reservoir descriptionDifferent data sources have different levels of spatial resolution and sample different volumesof the reservoir. Integrating these reveals how reservoir behaviour changes with resolutionand length-scale.
5.2.1 Integration of core and wireline-log dataIntegration of core and wireline log data is important to
1. Depth merge core and log datawireline depth scale is definitivecompare wireline and core gammacore is shifted by barrel if 100% recovery
core is shifted by ‘stretch and squeeze’ if incomplete recovery
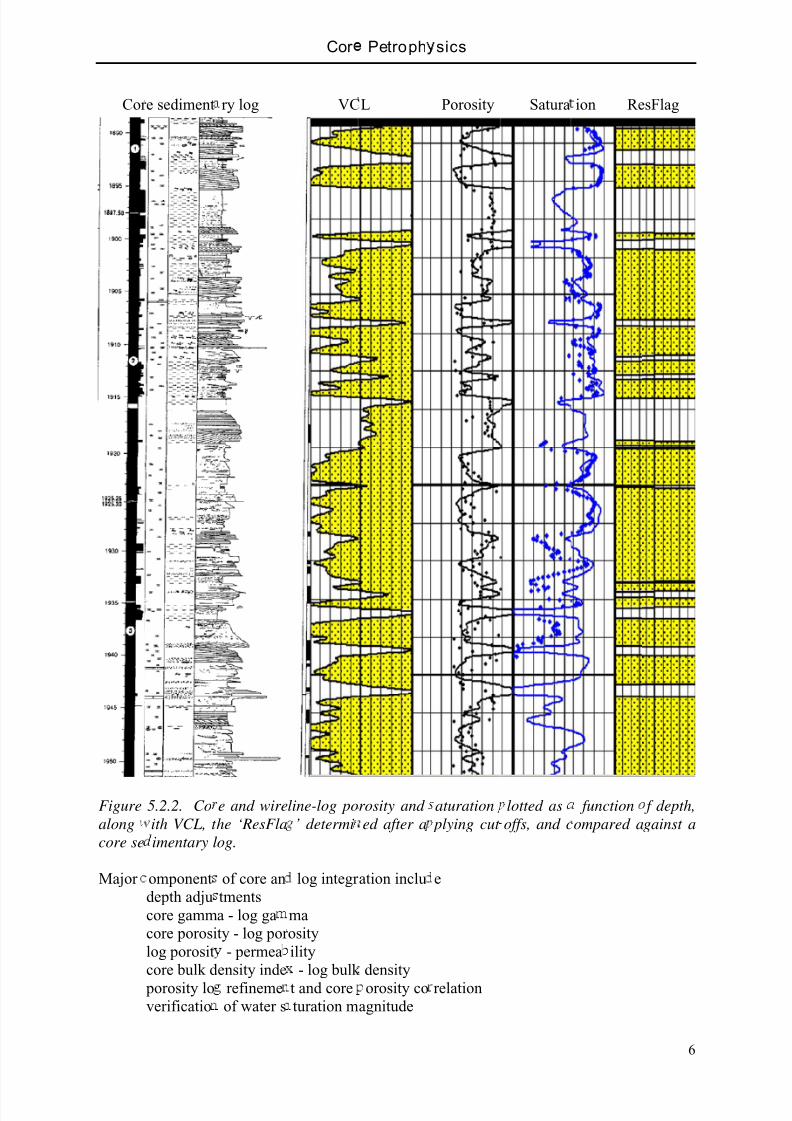
2. Validate log interpretations plot core porosity versus log porosity, either as a cross-plot (e.g. Fig. 5.2.1) or as afunction of depth (e.g. Fig. 5.2.2)
plot core saturation versus log saturation (e.g. Fig. 5.2.2)
3. Determine parameters for log interpretationelectrical properties a , m, n and Qv (if required)
4. Establish correlations for interpretation of uncored wells
permeability prediction in uncored wells (see, for example, section 5.1)identification of ‘cut-off’ values for net rock and pay rock
8/9/2019 Core Petrophysics Section5 Notes Imperial
http://slidepdf.com/reader/full/core-petrophysics-section5-notes-imperial 5/7
Core Petrophysics
5
5. Sample different scaleswireline logs sample c. 30cm to 100cmcore plugs sample c. 2 - 5cm
Figure 5.2.1 Cross plot of core versus wireline-log porosity. A good depth correlationbetween core and wireline log is important for this to yield sensible results.
So-called ‘cut-offs’ are used because rocks observed in core have distinct lithology and canoften be classified as ‘net reservoir’ or ‘net pay’. Applying cut-offs tries to capture this inwireline interpretations and eliminate rock which will not contribute to production. A typicaldefinition of net sand might use the following cut-off values
VCL < 0.5 (sandstone)PHIE > 0.12 (sandstone which will ‘flow’)
while a pay sand will also have the additional cut-off
S w < 0.6 (sandstone which is hydrocarbon saturated)
However, these cut-off values are NOT universal and vary on a field-by-field basis.Choosing cut-offs is a multidisciplinary problem that requires interaction between thegeologist and petrophysicist (e.g. Fig. 5.2.3). For example, it is not sensible to apply cut-offsto wireline-log interpretations that identify net sand which is not observed in core, and vice-versa .
8/9/2019 Core Petrophysics Section5 Notes Imperial
http://slidepdf.com/reader/full/core-petrophysics-section5-notes-imperial 6/7
Cor
Figurealongcore se Major
e sediment
5.2.2. Coith VCL, t imentary l
omponentdepth adjucore gammcore porosilog porositcore bulk d
porosity loverificatio
ry log
e and wirehe ‘ResFlaog.
of core antmentsa - log gaty - log por - permea
ensity inde refineme of water s
Cor
VC
line-log po’ determi
log integr
maosityility
- log bulk t and coreturation m
Petroph
L
rosity anded after a
ation inclu
densityorosity co
agnitude
sics
Porosity
aturation plying cut
e
relation
Satura
lotted asoffs, and c
ion Re
functionompared a
6
sFlag
f depth,gainst a
8/9/2019 Core Petrophysics Section5 Notes Imperial
http://slidepdf.com/reader/full/core-petrophysics-section5-notes-imperial 7/7
Core Petrophysics
7
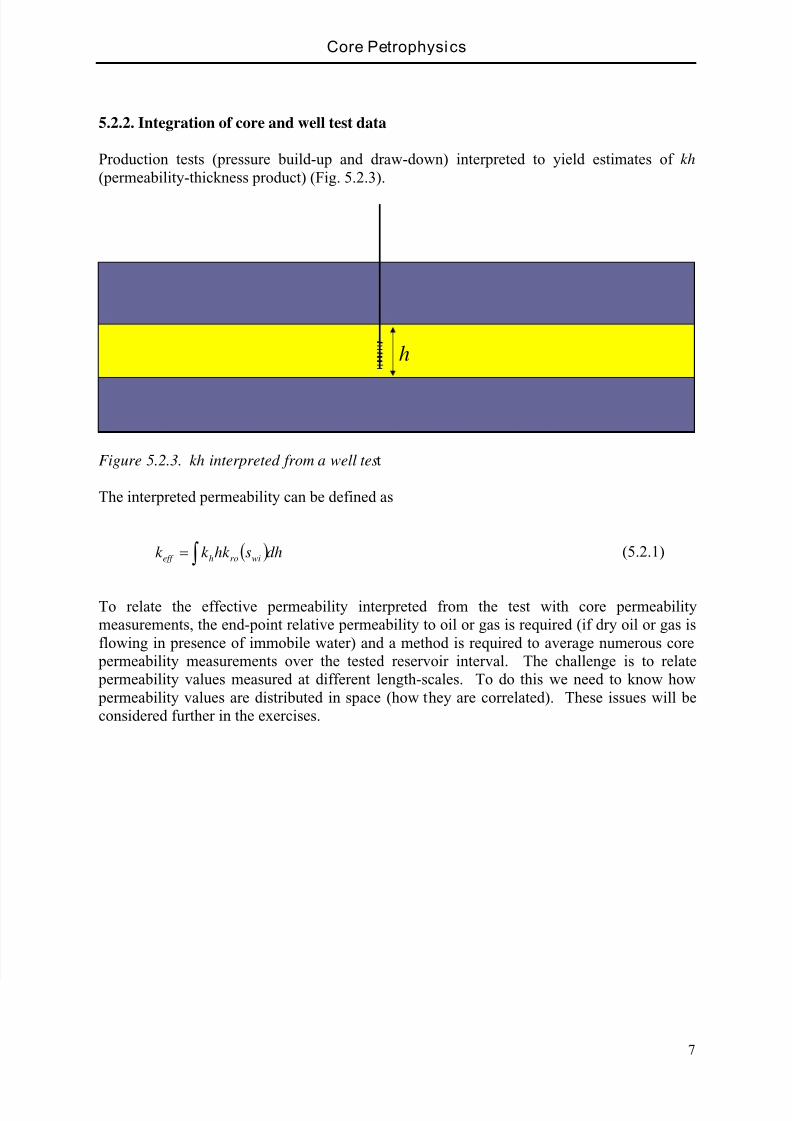
5.2.2. Integration of core and well test data
Production tests (pressure build-up and draw-down) interpreted to yield estimates of kh (permeability-thickness product) (Fig. 5.2.3).
Figure 5.2.3. kh interpreted from a well tes t
The interpreted permeability can be defined as
(5.2.1)
To relate the effective permeability interpreted from the test with core permeabilitymeasurements, the end-point relative permeability to oil or gas is required (if dry oil or gas isflowing in presence of immobile water) and a method is required to average numerous core
permeability measurements over the tested reservoir interval. The challenge is to relate permeability values measured at different length-scales. To do this we need to know how permeability values are distributed in space (how they are correlated). These issues will beconsidered further in the exercises.
h
dhshk k k wiroheff