core metrics for employee health management - shrm.org · 2.01.2009 · karen o. marlo, mpp,...
TRANSCRIPT

Program Measurement and Evaluation Guide:Core Metrics for Employee Health Management
2 015
Health Enhancement Research Organization and Population Health Alliance

Acknowledgments ................................................................................................................................................................................3
Chapter 1: Introduction ....................................................................................................................................................................5
Matt Damsker, Michael Connor, DrPH, Edward Marc Framer, PhD, Beth Umland, David Anderson, PhD, Geoff Alexander, Michael Brennan, MS, MBA, Jennifer Flynn, MS, Jessica Grossmeier, PhD, MPH, Ben Hamlin, Iver A. Juster, MD, Gordon D. Kaplan, PhD, Adam Long, PhD, Craig F. Nelson, DC, MS, LaVaughn Palma-Davis, MA, Robert Palmer, PhD, MSN, RN, Prashant Srivastava, David Veroff, MPP, Jerry Noyce, and Karen Moseley
List of Measures
Chapter 2: Financial Outcomes..................................................................................................................................................11
Iver A. Juster, MD, and Ben Hamlin
Chapter 3: Health Impact .............................................................................................................................................................26
Gordon D. Kaplan, PhD, and LaVaughn Palma-Davis, MA
Chapter 4: Participation .................................................................................................................................................................39
Robert Palmer, PhD, MSN, RN, and Prashant Srivastava
Chapter 5: Satisfaction ....................................................................................................................................................................42
Adam Long, PhD, and Geoff Alexander
Chapter 6: Organizational Support ........................................................................................................................................48
Jennifer Flynn, MS, and Michael Brennan, MS, MBA
Chapter 7: Productivity and Performance .........................................................................................................................56
Jessica Grossmeier, PhD, MPH
Chapter 8: Value on Investment Framework ...................................................................................................................66
Craig F. Nelson, DC, MS, and David Veroff, MPP
Appendix ................................................................................................................................................................................................77
A: Participant Satisfaction (PSAT) Survey
B: Client Satisfaction (CSAT) Survey
C: Organizational Support
Case Studies
Barry-Wehmiller
GlaxoSmithKline
Lincoln Industries
TABLE OF CONTENTS

www.hero-health.org www.populationhealthalliance.org3
Collaborators
AetnaAlere HealthAllOne HealthAmerican College of Occupational and Environmental MedicineCorporate Health Improvement Program (CHIP)Engaged Health SolutionsFindley Davies, Inc.Geneia, Inc.Health DialogH2U | Health to You, LLCHealthFitnessHealthPartnersHospital Alemao Oswaldo Cruz (Brazil)Kaiser PermanenteMayo ClinicNational Association of Worksite Health CentersNational Business Group on HealthOnlife Health, Inc.OptumRiedel & Associates Consultants, Inc.StayWellTruven Health AnalyticsUniversity of Michigan
Endorsers
Johnson & JohnsonMediFit Corporate ServicesRedBrick HealthViridian Health Management
HERO-PHA Steering Committee
David Anderson, PhD, StayWell
Michael J. Connor, DrPH, Alere Health
Edward Marc Framer, PhD, HealthFitnessKaren Moseley, PHA Jerry Noyce, HERO
Beth Umland, Mercer
Subject Matter ExpertsSteve Aldana, WellSteps
Judd Allen, Human Resources Institute, LLC
Robert Eisenberger, University of Houston
Kimberly M. Firth, PhD, Samueli Institute
Ron Goetzel, Truven Health Analytics
Allison Hess, Geisinger Health Plan
Cheryl Larson, Midwest Business Group on Health
Debra Lerner, MS, PhD, Tufts Medical Center
Joe Leutzinger, PhD, Health Improvement Solutions, Inc.Ari Levy, Engaged Health Solutions
Amaya Ortiz, Engaged Health Solutions
Tom Parry, PhD, Integrated Benefits Institute
Nico Pronk, PhD, FACSM, FAWHP, HealthPartners
John E. Riedel, MPH, MBA, Riedel and Associates Consultants, Inc.
Seth Serxner, PhD, Optum
Bruce Sherman, MD, FCCP, FACOEM, Employers Health Coalition
Shelly Wolff, MBA, Watson Wyatt
Leadership Group
Geoff Alexander, Onlife Health
Michael Brennan, MS, MBA, The Boeing Company
Jennifer Flynn, MS, Mayo Clinic
Jessica Grossmeier, PhD, MPH, StayWell
Ben Hamlin, NCQA
Iver A. Juster, MD, Healthagen
Gordon D. Kaplan, PhD, Alere Health
Adam Long, PhD, H2U | Health to You, LLC
Craig F. Nelson, DC, MS, American Specialty Health
LaVaughn Palma-Davis, MA, University of Michigan
Robert Palmer, PhD, MSN, RN, Alere Health
Prashant Srivastava, eVive Health
David Veroff, MPP, Health Dialog
ACKNOWLEDGMENTS

www.hero-health.org www.populationhealthalliance.org4
Financial Outcomes Work Group
Co-leaders:
Ben Hamlin, NCQA
Iver A. Juster, MD, Healthagen
Jeff Dobro, MD, Redbrick Health
Josh Dunsby, PhD, Mercer
Jessica Grossmeier, PhD, MPH, StayWell Erik Lesneski, AllOne
Kristin Parker, PhD, MPH, Mercer
Erin L. D. Seaverson, MPH, StayWell Kelly M. Shreve, MEd, MCHES, CIC, Capital BlueCross
David Schweppe, MPH, CPHIMS, Kaiser Permanente
Health Impact Work Group
Co-leaders:
Gordon D. Kaplan, PhD, Alere Health
LaVaughn Palma-Davis, MA, University of Michigan
Marybeth Farquhar, PhD, MSN, RN, URAC
R. Allen Frommelt, PhD, MS, Nurtur Health Sandi Greenawalt, RN, URAC
Vince Haufle, DrPH, MPH, Alere Health
Fikry Isaac, MD, MPH, FACOEM, Johnson & Johnson
Erik Lesneski, AllOne
Jenna Williams-Bader, MPH, NCQA
Organizational Support Work Group
Co-leaders:
Michael Brennan, MS, MBA, The Boeing Company
Jennifer Flynn, MS, Mayo Clinic
Nicole Gaudette, MPH, MCHES, Capital Blue Cross
Rosie Gonzalez, MS, RD, LD, HealthFitness Corporation
Deborah M. Gorhan, MS, CHES, Johnson & Johnson Global Health Services
Andriana Hohlbauch, Truven Health Analytics
Travis M. Lehman, CHES, Highmark Inc.
Joe Leutzinger, PhD, Health Improvement Solutions, Inc.
Participation Work Group
Co-leaders:
Robert Palmer, PhD, MSN, RN, Alere Health
Prashant Srivastava, eVive Health
Kailin Alberti, MS, FACW, CWWPC, ActiveHealth Management
Helene S. Forte, RN, MS, PAHM, Aetna
Kurt Hobbs, Mayo Clinic
J. Douglas Knoop, MD, MHA, FACS, CPE, Healthstat, Inc.
Jennifer Nailor, RN, BSN, CCP, Capital Blue CrossErin Rademacher, MA, StayWell
Productivity and Performance Work Group
Leader:
Jessica Grossmeier, PhD, MPH, StayWell
Jack Groppel, PhD, Human Performance Institute and Wellness & Prevention, Inc.
Iver A. Juster, MD, Healthagen
Travis M. Lehman, CHES, Highmark Inc.
Paul C. Mendelowitz, MD, MPH, ActiveHealth Management
David Schweppe, MPH, CPHIMS, Kaiser Permanente
Satisfaction Work Group
Co-leaders:
Geoff Alexander, Onlife Health
Adam Long, PhD, Health to You, LLC
Joseph Alexander, Ortho Clinical Diagnostics
Crystal Hemmenway, Nurtur
John E. Riedel, MPH, MBA, Riedel and Associates Consultants, Inc.
Lisa Saheba, MPH, URAC
Value on Investment Work Group
Co-leaders:
Craig F. Nelson, DC, MS, American Specialty Health
David Veroff, MPP, Health Dialog
Susan Dorfman, PhD, Communications Media, Inc.
Rebecca Kelly, PhD, RD, The University of Alabama
Karen O. Marlo, MPP, National Business Group on Health
Kenneth R. Pelletier, PhD, MD, University of Arizona School of Medicine and University of California School of Medicine San Francisco
David Schweppe, MPH, CPHIMS, Kaiser Permanente

www.hero-health.org www.populationhealthalliance.org5
The Health Enhancement Research Organization (HERO) and Population Health Alliance (PHA) are pleased to present Program Measurement & Evaluation Guide: Core Metrics for Employee Health Management (herein referred to as “Guide”), a core set of metrics for the evaluation of employee health management programs. After two years and countless hours of research and discussions by more than 60 members of both organizations and many outside experts, HERO and PHA are responding to employers who seek a greater level of clarity regarding the value of their wellness efforts. Thus, we recommend an initial set of measures to assess the impact of the health management programs offered to employees. The results are better informed business decisions and boardroom discussions.
HERO is dedicated to improving the health of the employee population through research and education to create and disseminate evidence-based research describing “best practices” in employee health management (EHM). PHA is acknowledged for years of work in consensus-driven and evidence-based evaluation measures and methodology and has a broad perspective which includes the health of the entire US population, including the employee population. HERO and PHA collaborated with more than 40 other organizations in developing the Guide. Virtually all industry segments were represented, including employers, health plans, program providers, academic research centers, and certification agencies.
THE GOAL FOR THE GUIDE
The goal of this collaborative project and the Guide is to provide standard measures for the assessment of employee health management. This project does not seek to be prescriptive about the types of programs offered to an employee population. Rather, the recommended metrics can be applied to any program intended to improve the health of a population. For example, some programs may be focused on low-risk individuals with the goal of keeping
risks low, while others may be focused on employees already at risk of future disease with the goal of risk reduction. Still other programs may be designed to help individuals with disease achieve better outcomes. The Guide includes metrics and evaluation strategies that apply to these and other focus areas.
At the project’s outset, the additional goal of developing standard recommendations for the levels of performance that wellness programs should be expected to attain was considered. However, our conclusion, based on a review of the literature, is that codifying expected program outcomes would be premature. Therefore, the scope of the project was limited to providing a common set of standard measures and measurement methods. As data based on these standard measures become available, future plans for the project include developing standards of performance and best practice. While the initiative is focused on supporting employer programs, our hope is that other stakeholders and communities also will benefit from this work.
STAKEHOLDER BENEFITS FOR GUIDE USERS
The use of a core set of standard measures is expected to benefit all EHM program stakeholders.
Employers/Benefits Managers: For those faced with decisions regarding the selection of health enhancement programs, core metrics can facilitate comparisons and provide a reasonable basis for the development of vendor performance metrics and expectations. In addition, employers can use these data to identify gaps in their own employee health management programs.
Benefits Consultants: Core metrics can be used across EHM vendors and employer purchasers of EHM services. When EHM program outcomes are based on standard metrics, sharing these findings can be expected to result in industry norms. These, in turn, will provide consultants
CHAPTER 1: INTRODUCTION
Matt Damsker, Michael Connor, DrPH, Edward Marc Framer, PhD, Beth Umland, David Anderson, PhD, Geoff Alexander, Michael Brennan, MS, MBA, Jennifer Flynn, MS, Jessica Grossmeier, PhD, MPH, Ben Hamlin, Iver A. Juster, MD, Gordon D. Kaplan, PhD, Adam Long, PhD, Craig F. Nelson, DC, MS, LaVaughn Palma-Davis, MA, Robert Palmer, PhD, MSN, RN, Prashant Srivastava, David Veroff, MPP, Jerry Noyce, and Karen Moseley

www.hero-health.org www.populationhealthalliance.org6
with reliable comparative data for making vendor recommendations and for negotiating health improvement performance standards.
Health Management Program Managers: Core metrics will provide data to fine-tune health enhancement interventions as well as data for reporting success to C-Suite stakeholders.
Accrediting Organizations: These groups will be able to use metrics endorsed by relevant stakeholders to evaluate vendor and/or health plan compliance; they can also serve as industry ‘clearinghouses’ for aggregated results.
National Health Management Policy Makers: Core metrics will facilitate the development of benchmarks and recommendations for use by federal/state policy makers.
Employee Health Management Services Vendors: Core metrics will create a level playing field for competitors and encourage product improvements based on efforts to meet or surpass benchmarks based on the standard measure set. These metrics will also support industry-level research demonstrating the value of EHM programs.
Employee Health Management Participants: Participants will benefit from product improvements stemming from competition to meet and surpass benchmarks based on these core metrics.
SCOPE OF THE GUIDE
Measures applicable to key health management programs delivered to an employer’s population were considered. These were categorized into the following measurement domains:
• Financial outcomes• Health impact• Participation• Satisfaction• Organizational support• Productivity and performance• Value on investment
OUR COLLABORATIVE PROCESS
HERO and PHA drew on member experts, prior research, and a strong project process for the Guide. The collaboration was guided by a small steering committee comprised of members from both organizations. Seven work groups were assembled, each addressing one of the respective domains listed above. The groups were staffed by HERO and PHA members and other volunteers. The co-leaders of each work group (largely drawn from
each organization’s research-related committees) formed a leadership group that met regularly with the steering committee to provide updates, discuss issues, review and offer comment and feedback on the measure-development work in each domain, and to assure consistency across domains. Major steps in the process included:
• Review of the literature to discover what metrics are currently used to measure the performance of employee health management programs;
• Obtain guidance and advice from other subject matter experts in the domain areas;
• Identify and/or develop recommended measures;• Review the work with key stakeholders to obtain
feedback and consensus;• Release the work through conference presentations,
publication, and other channels recommended by stakeholders and others.
EHM VALUE CHAIN
Measuring the value of EHM programs is widely desired by employers. Unfortunately, accurately measuring the value of EHM is not straightforward. There is no practical “gold standard” methodology by which to measure savings or other desired outcomes. We could find no cases where different evaluation methodologies have been compared against the same program or over the same time period.
Nonetheless, the science of EHM evaluation has evolved to the point that we can provide useful guidance on what metrics to select—and the methodologies that accompany the use of the metrics. Moreover, the Guide offers information about how various metrics fit specific cases differing in population size, data availability, and resources available for program evaluation.
EHM programs vary in the types of health opportunities addressed, the specific content, and the multiple ways individuals can participate. The following steps may not all occur in a linear fashion, yet the overall EHM value proposition is largely similar across program types:
1. Assess all individuals in the population across the health continuum to identify opportunities to maintain or improve health, or to reduce the risk for future illness.
2. Engage individuals with programs and tools through which they can successfully address these opportunities.
3. Continue engagement long enough for them to acquire and sustain healthy behaviors.

www.hero-health.org www.populationhealthalliance.org7
4. This sustained “effective engagement” results in preventing or reducing lifestyle-related risk factors (e.g., excess weight, high blood pressure, or unhealthy cholesterol).
5. Sustained healthy behaviors and clinical outcomes result in fewer ER visits, hospitalizations, and procedures related to lifestyle-related risk factors and poor clinical outcomes. Sustained healthy behaviors may also directly improve employee productivity and performance.
6. Fewer ER visits, hospitalizations, and procedures yield medical, absenteeism, worker’s compensation, and disability cost-savings; and increased productivity and performance.
7. Improved employee productivity and performance contribute to improved financial outcomes for individuals and organizations.
Understanding the EHM value chain provides guidance on what to look for on your programs’ reports: It is important to look for metrics about activities and results in the steps that lead to savings.1,2 Metrics related to the first five steps in the value chain are often referred to as “value metrics” or “plausibility metrics” and serve as a reminder to check whether the EHM programs accomplished enough to make the claim of savings plausible.
NEXT STEPS
The development and release of the Guide is a major industry initiative, but in many ways it is just the beginning. These core metrics and methods need to be further applied by employers and other purchasers in assessing value and improving performance of EHM programs. Through practical application, the measures will be refined and further standardized, enabling more robust reporting across the industry and leading, eventually, to normative benchmarks.
The HERO-PHA measurement collaborative will continue its process of encouraging and assessing the adoption of core metrics and facilitate the development of additional metrics, particularly in the areas of organizational support, productivity and performance, and value on investment.
CHAPTER 1 REFERENCES1 Grossmeier J, Terry PE, Cipriotti A, Burtaine JE. Best practices in evaluating worksite health promotion programs. American Journal of Health Promotion. Jan/Feb 2010; 24(3):TAHP1–TAHP9.2 Linden A. What will it take for disease management to demonstrate a return on investment? New perspectives on an old theme. Am J Manag Care 2006;12:217–222.
engage enough of them
with effective programs…
Find people with potential health improvement
opportunities…
and continue for enough time and
intensity.
*Effective (activated) engagement
Results in:
Improved clinical outcomes
Improved utilization outcomes
Improved financial outcomes

www.hero-health.org www.populationhealthalliance.org8
FINANCIAL OUTCOMESGiven the importance of financial outcomes to employers who invest in EHM programs, the Guide focuses on specific financial metrics and savings methodologies, as follows:
1. Directly monetized claims savings using one of five savings methodologies.
2. The monetized impact on rates of hospitalizations (and ER visits and procedures) that are potentially preventable by EHM.
3. Financial impact based on a model that links to what occurred during the program (such as participation, changes in lifestyle-related health risks, and clinical outcomes) and characteristics of program participants using published evidence and/or rigorous claims-based studies of prior years of the program or a vendor’s book of business.
The five savings methodologies applied to directly monetized claims are:
1. Cost trend compared with industry peers2. Adjusted-expected compared to actual cost trend3. Chronic vs. non-chronic trend comparison4. Participant vs. non-participant trend comparison5. Comparison with matched controls in a
non-exposed population
HEALTH IMPACTThis measurement domain assesses the impact of EHM programs on the overall health and well-being of targeted populations. Four dimensions of health were identified for inclusion in the base set of measures.
1. PHYSICAL HEALTH IMPACT
A. BMI (height; weight)B. Blood pressure (systolic/diastolic)C. Cholesterol (Total; HDL; LDL)D. Fasting blood glucose or HbA1cE. Medical conditionsF. Perceived health status
2. MENTAL AND EMOTIONAL HEALTH IMPACT
A. Perceived stressB. DepressionC. AnxietyD. Perceived life satisfaction
3. HEALTH BEHAVIORS THAT IMPACT PHYSICAL/MENTAL AND EMOTIONAL HEALTH
A. Physical activity (total amount)B. Tobacco use (all types)C. Alcohol use (total amount/risky drinking)D. Fruit/Vegetable intakeE. Sleep (typical hours/night)F. Daytime sleepinessG. Safety restraint useH. Drinking/DrivingI. Health screenings according to recommended
schedule (blood pressure; glucose/A1c; cholesterol; colorectal, cervical and breast cancer)
J. Immunization status (flu, tetanus/diphtheria, pneumonia, varicella, HPV)
4. SUMMARY OF HEALTH MEASURES (RISK STATUS INDICES)
A. Overall risk reduction—maintenance of low risk status and net risk reduction
B. Individual risk reduction
PARTICIPATIONIdeally, “participation” would be defined as a level of interaction between an EHM program and an individual that has shown some evidence of producing an outcome. The level of interaction would presumably vary based on the program and the modality. Due to a lack of consistency between interventions, levels of intervention, and the outcomes in the literature, the approach recommended is to use a range of participation measures based on general themes we observed in the literature. These were not themes associated with specific outcomes and/or programs but, rather, were those observed across the modalities. In-person contact was associated with the lowest number of contacts able to produce a positive outcome, while online contact was associated with the highest number of contacts required for an outcome.
Thus a categorical reporting structure using ranges is recommended rather than a prescriptive minimum number of contacts. This recommendation is based upon observations from the literature with regard to the number of contacts associated with a positive health outcome. Displaying a categorical range allows employers to interpret and understand the continuum of what could be defined as participation within their population.
LIST OF MEASURES

www.hero-health.org www.populationhealthalliance.org9
Participation Metrics Summary
CHANNEL / MODALITY
CONTACT CATEGORIES FOR REPORTING PARTICIPATION
Telephonic• 1–2 contacts• 3–4 contacts• 5+ contacts
Web-based• 1–5 contacts• 6–10 contacts• 11+ contacts
In-person• 1 contact• 2 contacts• 3+ contacts
SATISFACTIONThis outcome domain provides a set of satisfaction measures and methods to enable consistent and transparent reporting for appropriate and relevant comparisons. The satisfaction areas addressed are Client and Participant. ‘Client’ generally refers to the purchaser or cost-bearing entity for the EHM program. ‘Participant’ has several synonyms depending upon EHM area (e.g., user, consumer, patient). The domains are listed below by area in a roughly prioritized fashion, with those most critical for near-term adoption ranked higher.
I. PATIENT SATISFACTION
A. Overall (including loyalty)B. EffectivenessC. ScopeD. ConvenienceE. CommunicationsF. ExperienceG. CostH. Benefits
II. CLIENT SATISFACTION
A. Overall (including loyalty)B. EffectivenessC. ValueD. ScopeE. Member experienceF. Account managementG. Reporting
ORGANIZATIONAL SUPPORTOrganizational Support refers to the degree to which an organization is committed to the health and well-being of its employees. The formal and informal programs, policies and procedures within an organization that make "the healthy choice the easy and desired choice" are recognized as deliberate steps to which a company is committed. A healthy culture incorporates management policies and
practices that involve, empower, and engage the employee in decisions about their work, health and safety, and the direction of the organization. Such an environment makes it easy, convenient, acceptable, and expected to engage in healthy behaviors. Intentionally limiting our focus to supportive efforts that can be performed in the workplace, a thorough review of the literature and interviews with experts resulted in the identification of eight key elements of organizational support. These elements represent the deliberate steps a company can take to support their employees and leaders in their health and well-being.ORGANIZATIONAL SUPPORT ELEMENTS
A. Company-stated health valuesB. Health-related policies C. Supportive environment (the physical or “built”
environment of the workplace) D. Organizational structureE. Leadership support F. Resources and strategies (adequate EHM services,
budget, communication, etc.)G. Employee involvement (employees have
opportunity for input and evaluation) H. Rewards and recognition
It is recommended that employers measure both their level of organizational support and the degree to which their employees, managers and leaders perceive both that health is a priority for the business and that they are supported by their employer organization. To accomplish this, these measures would include the assessment of:
1. Deliberate steps (organizational support elements) the employer has taken to create an environment that supports health and well-being.
2. Employee-perceived level of organizational support (POS).
3. Leaders-perceived organizational support (POS).
PRODUCTIVITY AND PERFORMANCEBelow is a list of metrics that can be used to assess the worker productivity and performance gains realized from EHM. Using the broadest possible definitions of productivity and performance, metrics would ideally quantify worker presence at work and the execution or accomplishment of job-specific tasks against pre-determined performance standards. Some organizations are able to capture employee sick time associated with poor health, fully leverage disability and workers compensation data to manage time away from work, and measure observed changes in work output to optimize on-the-job productivity. However, most employers must rely on self-report tools for at least some of these

www.hero-health.org www.populationhealthalliance.org10
issues. The recommended metrics below provide options for measurement for organizations to select from based on the availability of appropriate administrative data or self-report tools.
I. TIME AWAY FROM WORK (TAW) DUE TO POOR HEALTH
A. Unscheduled absenceB. Workers compensationC. Short term disabilityD. Long term disabilityE. Self-reported absence due to employee
poor healthII. PRODUCTIVITY LOSS WHILE AT WORK
(PLAW) DUE TO POOR HEALTH
A. Self-reported presenteeismIII. WORKER PERFORMANCE
A. Employee performance ratingsB. Objective measures of performance by job type
VALUE ON INVESTMENTThe proposed VOI formula uses a cost effectiveness analysis (CEA) convention, which places the dollar investment or resources used first (the numerator) and the outcomes second (the denominator). The outcomes may be specific clinical measures (reduced rates of a particular disease state), or in dollar amounts representing the monetized value of the outcomes.
The numerator will represent all inputs and investments in an EHM program as shown below:
I. DIRECT COSTS
A. Program fees (which may include case management; medication adherence; biometric screening; employee assistance programs; health risk assessment; lifestyle coaching; on-site fitness facility or club discounts; decision assistance; triage/nurse line; injury prevention program; concierge services; on-site clinics: ergonomic/back health program: cost transparency programs; Provider support programs, etc.)
B. Incentive costs (to the extent they are incremental costs to the purchaser)
II. INDIRECT COSTS
A. Employee time (biometric screening, etc.)B. Communications/Print materialsC. Data systems and reportingD. Contract personnelE. Legal reviewF. Facility space
III. TANGENTIAL COSTS
A. Employee moraleB. Company reputationC. Legal challengesD. Selection effects (on employee population)
www.hero-health.org www.populationhealthalliance.org11
INTRODUCTION
Financial outcomes are key performance indicators for most capital, system, or human resource investments. An important feature of the employee health management (EHM) value proposition is the idea that—by improving the health and reducing health-risky behaviors of employees and their dependents—these programs produce a positive return on investment (ROI). This section considers the ROI contribution from savings in healthcare claims.
We aim to reduce the often-expressed confusion over EHM financial outcomes reports: e.g. that the metrics used are unfamiliar or are inconsistent amongst vendors and consultants; that the methodologies used to calculate savings and ROI are not transparent; and that different programs cite an implausibly-wide range of ROIs.
A common barrier to understanding EHM financial metrics is that they don’t easily fit with the ROI paradigm familiar to business decision makers, where return is usually thought of as revenue—money earned for investment made. In contrast, the financial value of EHM is counted as savings—money not spent to due prevented events (such as hospitalizations or ER visits). While ROI from the more-familiar paradigm often does include some savings (e.g. fewer accidents from improving safety), it’s important to reorient perspective in order to fairly compare EHM’s statements of ROI with those of competing (potential or actual) investments.
This section of the Guide begins with a summary of financial metrics and guidance, followed by a deeper dive into the rationale for our metrics and guidance.
FINANCIAL METRICS AND GUIDANCE SUMMARY
HERO and PHA recommend the following metrics to measure healthcare cost (claims) savings from EHM:
• Directly monetized claims savings, using one of five methodologies;
• Monetized impact on rates of hospitalizations (and ER visits and procedures) that are potentially preventable by EHM;
• Financial impact based on a model that links to what occurred during the program (such as participation, changes in lifestyle-related health risks and clinical outcomes) and characteristics of program participants, using published evidence and/or rigorous claims-based studies of prior years of the program or a vendor’s book of business.
In addition, HERO and PHA recommend reporting impact on lifestyle-related health risk factors. While there is good evidence that preventing or decreasing such risks is cost-saving, current evidence is not sufficient to recommend a monetization formula based on specific risk factors.
To best work with your analyst, consultant or EHM vendor to report savings, it’s important to understand the link between EHM and financial outcomes (financial value proposition), when savings may be expected to occur, some basics about how savings are measured, and how our recommended metrics get at financial outcomes. This linkage was described in the section EHM Value Chain (p. 6).
When Should We Expect to See Savings?
Despite the common expectation that EHM should produce an ROI of at least one dollar per dollar invested (greater than 1 to 1) in its first year, much of the research on financial impact demonstrates savings no earlier than the second year of EHM.1 Understanding the EHM value-production chain with its “leading” and “lagging” indicators will enable you to advance or accept realistic performance goals, and to be a wise reader of ROI reports.
Recall how EHM produces financial value—by preventing costly events such as trips to the ER, hospitalizations, and certain procedures.
For example, EHM can identify individuals with health risk factors (such as smoking, poorly managed stress or depression) that are known to raise healthcare costs. For members with chronic conditions, EHM identifies individuals who are not receiving (or adhering to) best
CHAPTER 2: FINANCIAL OUTCOMES
Iver A. Juster, MD, and Ben Hamlin

www.hero-health.org www.populationhealthalliance.org12
practices. For example, taking ACE inhibitor medication reduces the rate of hospitalizations for worsening heart failure by about one-third.2 Because ACE inhibitors are inexpensive and hospitalizations for heart failure are very expensive, it is cost-saving if EHM improves adherence to ACE inhibitors.
A more common example is attention to their blood sugars, cholesterol, diet, blood pressure, medication, regular foot exams, and attentive wound care for individuals with diabetes. Over time, diabetics who adhere to these practices have fewer complications, and better function and quality of life. The cost of these practices is often less than those of the ER visits and hospitalizations that result from poor adherence.
Key points about the plausibility of reported EHM savings:
• EHM must exert a strong impact on preventable service utilization to get to positive ROI.
• Ensure the value-chain indicators line up to make it plausible that the program produced approximately that level of savings when judging a report of EHM savings. Consider how many hospitalizations and procedures would have to be prevented to break even in the first year (see Deeper Dive section, p. 14).
A set of “leading indicators” can tell you during the first year whether your program is likely headed for savings later on. As shown in the EHM Value Chain section (p. 6), each link in the chain—from identification to changes in risk factors and clinical outcomes—can be associated to performance metrics. If these metrics are doing well, you can forecast that your program will produce savings in an appropriate time frame. This is similar to the concept of leading and lagging economic indicators; for example when claims for unemployment decrease consistently (leading indicator), the growth in Gross Domestic Product rises several months later (lagging indicator).
Table 1 shows important EHM leading and lagging indicators. Sustained high performance on Leading Indicators forecasts high performance on the outcomes of value to employers—the Lagging Indicators. Time Course indicates time points at which impact on the listed indicator is typically first observed. Also, lagging indicators other than cost are themselves leading indicators for future cost.
A Closer Look at the Recommended Financial Metrics
HERO and PHA recommend three categories of metrics to evaluate the financial value of EHM programs. The first is “directly-monetized” (calculated using costs from claims); the second is the monetized impact on rates of hospitalizations that are potentially-preventable by EHM;
Table 1: Leading and Lagging Indicators of EHM’s Financial Impact
LEADING INDICATORS EXAMPLES TIME COURSEIdentification, Stratification and Targeting (outreach) Count/% with risk factors . ..conditions…etc. Few months
Program enrollment and use of tools Initial enrollment by type of program or tool Few months
Continuing engagement or program completion 4 or more sessions; or (better) program completion 6–12 months
Behavior change (lifestyle risks) Physical activity, tobacco, nutrition, stress 6–12 months
Behavior maintenance 6- or 12-month rates of low lifestyle risk 12+ months
Processes of care % of diabetics with annual LDL testing Six months
Medication adherence % of people with CAD on statins with MPR 80%+ 6–12 months
Achieving clinical targets % of diabetics with LDL less than 100 Six months
Activation (survey or composite measures) Patient Activation Measure or composite performance Six months
Satisfaction with EHM Positive experience and high marks on usefulness 6–12 months
Well-being Gallup-Healthways Well-Being Index 6–12 months
LAGGING INDICATORS EXAMPLES TIME COURSEFunctional status SF-12/36, Activities of Daily Living Six months
Quality of life and well-being SF-12/36, Gallup-Healthways Well-Being Index Six months
Absenteeism and presenteeism Health-related absenteeism and presenteeism scales Six months
Morbidity (ER, hospital, procedures) Rates for ER, hospital, and preference-sensitive procedures 1–3 years
Healthcare claims cost Paid or allowed amounts as trends 2–5 years
KEY CAD: Coronary artery disease; MPR: medication possession ratio (defined as the % of the days that a person should be taking their medication, that they actually are as evidenced by count of days’ supply dispensed); LDL: Low density lipoprotein cholesterol; SF12 and 36: Standard measures of functional status and quality of ; ER: Emergency room

www.hero-health.org www.populationhealthalliance.org13
and the third is the monetized impact on lifestyle-related health risks (based on published evidence of avoided costs from eliminating or preventing these risks.a For the first metric—depending on availability of data, time, resources, and expertise—we recommend selecting one of its five versions; or use a model. Your analyst, consultant, or vendor may make that decision for you, but it’s valuable to understand the implications of their decision.
All savings reports should be accompanied by value-chain (“plausibility”) metrics such as initial and sustained engagement, initial and sustained improvements in risk factors and utilization.
METRIC 1—DIRECTLY-MONETIZED SAVINGS(1) Cost trend compared with industry peer organizations
• Compares company’s trend with that of industry peers (optimally those without EHM).
• Because of the imprecision inherent in comparing trends in statistically small populations, this metric is recommended only for relatively large organizations with access to a database of peer trends. May require consulting expertise to appropriately adjust peer trend and to account for other impacts on trend.
• Because most large companies have implemented EHM, it is becoming very challenging to use this methodology in many industries.
(2) Inflection on expected cost trend• Compares expected to observed trend. Usually
trend is “decomposed” into components such as demographics, non-demographic (i.e., clinical), service utilization, price, and changes in benefit design. Credit is taken for EHM-impactible components (e.g., the non-demographic part of risk and certain types of utilization). Expected trend is established by adjusting the non EHM-impactible prospectively-estimated components to their observed year-end values.
• Recommended only for relatively large organizations. May require actuarial or epidemiological input to prospectively estimate components of trend and to make appropriate adjustments after completion of the performance year.
(3) Chronic vs. Non-chronic trends comparison• Often used when disease management (management
of people with chronic conditions) is the only or primary EHM service and it is not feasible or desirable (due to analytic capabilities or resource cost) to use a more rigorous methodology.
• Compares expected to observed trend. For each of the measurement and comparison ("baseline") years, the population is divided into Chronics (members who have at least one of the program-managed conditions) and Non-chronics (everyone else). The expected Chronic trend is equal to the observed Non-chronic trend, and savings is calculated from the difference between the expected and the observed Chronic trend.
• Basic assumption is that in the absence of EHM the two trends would be equal (or bear the same relationship to each other) over time. For this reason, measuring pre-baseline trends is recommended if sufficient data history is available.
• Recommended only for large companies. Because Chronic and Non-chronic members have very different costs, analysts should consider risk-adjusting trends in an effort to neutralize the effect of clinical differences on costs.
(4) Cost or trend comparison of program participants (P) vs. non-participants (NP)• Compares cost-trajectories of P and NP, usually with
procedures to neutralize the expected impact of non-EHM differences on cost trajectories.
• Recommended for relatively large organizations though may not need to be as large as for methodologies 1 and 2. Often requires significant analytic expertise and time.
(5) Comparison with matched controls in a non-exposed population• Compares cost-trajectories of members who meet
criteria for EHM program targeting in the employer’s population, with trajectories of matched members who meet criteria in a different “comparison” population that does not have EHM programs. There are variations on criteria for the comparison population.
• Recommended for moderate to large organizations, though smaller may be valid in programs with high program participation, especially if high in members with chronic conditions (high spends). Can require significant analytic expertise and time.
• HERO and PHA regard this methodology as the most rigorous and least subject to bias and “noise” (due to non-EHM impacts), but the methodology is rarely feasible because untouched comparison populations are rarely available and expertise and cost is substantial.

www.hero-health.org www.populationhealthalliance.org14
METRICS—MONETIZABLE (6) Utilization (hospitalizations and ER visits) for which
EHM has an impact• Monetizes a downward trend in ER and hospital visits
and procedures that can be prevented by EHM (varies with the nature of the program).
• Generally straightforward to measure given accurate utilization data. Only modest analytic expertise required.
• We strongly advise reporting on utilization along with any directly monetizable metric.
(7) Reduction or prevention of lifestyle-related health risk factors• A model (does not use claims) that relates reduction
in or prevention of lifestyle-related health risk factors to published evidence on the economics of preventing and reducing such risk factors.
• Generally straightforward to measure reduction, but monetizing risks prevented requires a valid estimate of the type and frequency of risk factors that would have been acquired by the population since the last measurement year.
• While there is good evidence that preventing or decreasing such risks is cost-saving, there is not currently sufficient evidence to recommend a monetization formula based on specific risk factors.
RECOMMENDED FINANCIAL METRICS: A DEEPER DIVE
As explained in the Summary section, understanding how EHM programs produce value helps you evaluate the impact of an existing program or to compare programs’ savings reports. Accurately measuring the savings from EHM is not straightforward. While there is no practical “gold standard” methodology by which to measure savings, the science of EHM evaluation has progressed to the point that we can provide useful guidance on what metrics to select—and the methodology used to measure them—to best fit your membership size, data availability, and resources available for program evaluation.
It’s always important to keep in mind the EHM value production chain—how EHM’s programs, services and tools produce savings through identification, engagement, and improvement in lifestyle-related risk factors, clinical outcomes, and EHM-preventable utilization.
Should Savings be reported at the EHM program level or at the population level?
Recommendations for reporting at the program-versus population-level:
Understanding the advantages and disadvantages of program- and population-level financial reporting will help you work with your analyst, consultant, or vendor to design a reporting package to fit your evolving needs. A partial list of solutions (not mutually exclusive) includes:
• Population pricing and reporting (the program or vendor designs a set of coordinated program components and tools to deliver a targeted population health status and ROI);
• Reporting ‘natural’ population-level metrics (see above) along with cost- and trend-drivers by demographics, conditions and risk factors;
• Hybrids of whole-population and by-program reporting (particularly useful during transitions to a true EHM during which population-paradigm metrics are being developed and tested).
In this program-centric model, savings from the component programs are summed to yield total EHM savings, expressed as total dollars, per employee per month (PEPM), or per member per month (PMPM). Each program may report savings as per participant per year or per month (PPPY or PPPM), but when there is more than one program, per-participant savings must be converted to savings spread over the entire covered population. This “sum of the parts model” might erroneously double-count savings, and it can’t account for the synergistic action of multiple programs.
As EHM evolves from a collection of programs designed to address specific needs to a paradigm that monitors and supports the whole person over time, the by-program savings model is less capable of capturing what’s taking place in the entire covered population, because individuals may engage with multiple tools and programs simultaneously or over time.
EHM value proposition:
Identify opportunities to 1) improve (or maintain) health and 2) mitigate or eliminate current risks or avoid future risks; and address these opportunities with effective programs and tools to improve the population’s health status, improve productivity, and lower health-related costs.

www.hero-health.org www.populationhealthalliance.org15
The EHM value proposition is about improving or maintaining health—not about particular programs or tools. Improving and sustaining health status over time is needed to achieve and sustain savings.
Over the next few years, national professional organizations (such as PHA and HERO) will develop recommendations and standards for reporting in the population paradigm, but for the near future we will continue to see hybrids of program-level and population-level reporting. Some metrics (such as many clinical measures, population cost trend, and hospitalizations) inherently relate to the population model.
For any savings metric, ask: What is its measurement group?
Common examples of measurement groups include:
• The entire covered population;• Age-restricted subset of the covered population;• All participants (in any EHM program or component);• All participants (in any program or component) with
chronic conditions versus all participants without any chronic conditions;
• Participants in a specific program.
While a population-centric metric paradigm has intuitive appeal, it has an important downside: By itself, population savings doesn’t contain actionable information. For example, we are given a result (“Your program saved $4.00 PMPM”) but that doesn’t tell us how the EHM saved $4.00. That is, what were the savings drivers? Was it individuals with certain demographic characteristics (e.g., females age 25–44) or specific conditions (such as people with multiple lifestyle risk factors or with chronic conditions)? Engaging person-to-person with a coach or online? What about duration, intensity, or frequency of engagement with one or more programs or tools? Type of health opportunity addressed? Program-level results excel at helping us understand which program components drive savings (or losses); this approach fits with the common approach of pricing by program component, since each program has a reported ROI.
An emerging hybrid approach combines reporting savings at the population level with insight into program-level impacts using metrics specific to various types of health improvement opportunities (e.g., lifestyle risk factors and clinical outcomes).
When Should We Expect to See Savings? An Illustration
As discussed above, most published research finds that EHM programs produce savings no earlier than in the second year.3 Understanding the EHM value-production chain with its “leading” and “lagging” indicators will enable you to advance or accept realistic performance goals, and to be an informed reader of ROI reports.
A simple example will illustrate why it’s so challenging to exceed break-even in the first year. A significant driver of claims savings in EHM is prevented hospitalizations. Suppose the annual without-EHM rate of non-maternity, non-newborn hospitalizations per 1,000 members is 45 (referred to as “45/K”), and that the employer pays, on average $25,000 per hospitalization (including facility and professional fees and related events and services after hospitalization).
If the EHM vendor fees are $1.50 PMPM, or $18,000 per K (per 1000 members per year), then the 2 to 1 ROI target is $36,000, and—if all savings come from avoided hospitalizations—the program must reduce the hospitalization rate by 1.44 per K to achieve the ROI target:
1,000 Number of members
45 Expected hospitalizations/K
$25,000 All-in cost of a hospitalization
$1.50 Cost of EHM PMPM, fees
$18,000 Cost of EHM per K
2 ROI target (savings per $ on fees)
$36,000 Savings target per K members
1.44 Number of hospitalizations/K needed to reduce
However if not all savings come from avoided hospitalizations, the number of hospitalizations (per 1,000 members) needed to reduce from the pre-PHM (or no-PHM) state may be less than 1.44/K. There may also be a reduction in ER visits and outpatient procedures, substitution of generic for brand drugs, and overall wiser use of healthcare. On the other hand, some costs increase as individuals start on appropriate treatment, become more adherent to their meds, and have recommended preventive or screening services. But in relation to a hospitalization, these costs are usually overshadowed. It is likely, then, that in our illustration, a reduction of only 1 or 1.25 hospitalizations/K is needed to support ROI of 2 to 1 given the above assumptions. Generally, only about 5 to 10 of the total 45 hospitalizations concern conditions that can be strongly impacted by EHM, so the impact on ‘EHM-impactible’ hospitalizations would have to be on the order of 10–20%.
Remember the key points: (a) EHM must exert a strong impact on preventable service utilization to get to positive ROI; (b) when judging a report of EHM savings, make sure the value-chain indicators line up to make it plausible that the program produced approximately that level of savings.

www.hero-health.org www.populationhealthalliance.org16
As discussed in the Value on Investment section (Chapter 8), the ROI denominator should take into account the entire cost of delivering EHM, such as vendor fees, employer’s cost of communicating and managing EHM, consultant fees, biometrics, and incentives. Also, EHM’s true value may include tangible and intangible savings (or revenue) besides medical and productivity.b
When Should a Model Be Used In Place of Measurement for Savings?
Key points and recommendations: Report savings from a model or a measurement?
• It isn’t always best to insist on measuring savings from claims. This is especially true with small-to-medium population size, or when funds for evaluation are limited.
• Modeled savings provide a line-of-sight between what your EHM programs do and savings based on well-conducted published studies.
• Unless your organization has the population size and funds required for a valid measured-savings study—especially if your program design parallels that in the programs with savings reported in the published literature—we strongly recommend that you consider quantifying savings from your programs with models run by experienced hands.
EHM savings may be calculated based on the financial data in health care claims, or on a model derived from the type, quantity, and intensity of engagement of members who participate in EHM programs. It may seem intuitive that we should always prefer reporting on financial outcomes based on claims, but often a good model based on your program data and actual measurements in other populations is a good (or even better) alternative.
Example: If I walk into the store with $100 in my wallet and spend $50, I should expect to count $50 remaining when I leave. That’s a direct financial measurement. A more relevant (and less direct) example is that I walk into the store to purchase a pair of shoes that normally cost $100 but find they are on sale at $50. I still leave with $50 in my wallet. I count the difference between what I expected to pay and what I actually paid as $50 savings. Savings from EHM is not a direct measurement; it’s more like this example (expected minus actual spend). And like the example, measurement is based on assumptions and may be subject to bias (such as accurately estimating the non-sale price or the probability that I would have bought shoes in the first place).
Suppose your analyst tells you that as a result of your EHM, your company’s health care cost was $100,000 less than it would have been without the EHM. If you trust the “would have been” estimate, how do you know this “reduction” in spend was due to the EHM rather than to the effect of other factors such as more use of less expensive generic drugs, less out-of-network care, general improvements in health not directly associated with your EHM, reductions in hospitalizations due to conditions not covered by your program, or the random variation that occurs in the cost of healthcare over time?
Health care savings measurements are based on finding the difference between (1) expected (what would have been spent without EHM), and (2) the actual amount spent with EHM. The expected spend is an estimate based on a series of assumptions. While these assumptions and methods aim to provide an accurate estimate of the expected cost, we still can’t attribute with certainty the entire difference between expected and actual cost to EHM.
Savings models also incorporate assumptions, but have the benefit of relating what the EHM program does to financial outcomes. They aren’t as sensitive to assumptions about non-EHM factors that could impact costs. The factors that go into EHM savings modeling are based on studies designed to control for these non-EHM factors. For example, an important impact of EHM is to reduce lifestyle-related health risks such as tobacco use, lack of physical activity, or high blood pressure. EHM savings models use published studies on the cost difference of having vs. not having each risk factor, or having then eliminating risk factors.
Savings models are based on published evidence or well- designed internal studies that relate factors such as participation rates, intensity and duration, participant characteristics (demographics, presence of risk factors and chronic conditions, gaps in care) and outcomes (short- and long-term reduction or prevention of risk factors, gap closure and clinical outcomes) to savings. Then, the specific EHM program’s factors are matched to those in the model’s, generating a savings report for your program. Essentially the model relates known relationships among participation, participant characteristics, outcomes and savings to facts about your program.
Models have several important advantages: they require only data typically generated through the program, such as demographics, participation, risk factors, diseases, or gaps in care. Financial data—which must undergo a complex process involving data cleansing and logical manipulations to be useful for analytics—is not needed. Models can be

www.hero-health.org www.populationhealthalliance.org17
run with any desired frequency and they clearly relate how the program works to the dollars invested.
As mentioned all models are built on assumptions, so it’s important to understand those that can influence the conclusions of modeling savings due to lifestyle risk reduction and prevention. Keep in mind that:
• The factors used to build the model should be as close as possible to those in the studies upon which the model is based. For example, there should be consistency in terms of concept (e.g., blood pressure) and risk threshold level (e.g., high-risk blood pressure definition of 140/90).
• If possible, model the behavior of as much of the population as possible. For example, sometimes savings due to lifestyle risk reduction is calculated on the 20% of the population that supplied appropriate data. It’s assumed that the other 80% didn’t change but if some of the people who didn’t supply risk factor data worsened, and people who got worse were less likely to report their data, that model would overestimate savings.c
• To the extent possible, the model should take into account what would have happened without EHM. An ideal comparison group is one that was not exposed to EHM but this is often not possible. Instead, there may be public data such as national-level data from Centers for Disease Control and Prevention, National Center for Health Statistics, or National Institutes of Health that can help to provide comparison.
• Determine in advance what savings are appropriate to model for your situation. Health care savings are always appropriate to include, but you may also want to include savings in the realms of disability, absenteeism, presenteeism, and employee turnover.
USE MODELED SAVINGS USE MEASURED SAVINGS
Total members in your covered population
The smaller the population, the less accurate are measured savings. There’s no concrete rule based on member count, but many consider that models should be used for populations of less than 25,000 (discuss with your analyst).
Statistically "large"—as a very general guideline, more than 25,000 members. Some analysis designs may support smaller populations.
Type of data availableMedical and pharmacy claims that are not fully adjudicated, lab results, eligibility, data generated by the EHM.
Includes fully-adjudicated claims for accurate accounting for ER, hospital, and procedure use and cost
Desired frequency of reporting
Monthly or quarterlyAnnually reported 5–6 months after close of performance year
Ability of the model to incorporate your specific data
Model accuracy is improved when it incorporates program engagement and specific lifestyle risk data; and information on the prevalence of members with chronic conditions and other health risk in your population. Accuracy may also be improved through adjustment to reflect your annual healthcare trend and average cost PMPM. For models for absenteeism and presenteeism savings, consider incorporating wages for various types of workers.
By definition, measured outcomes incorporate your specific data
How developedBased on high-quality, published evidence relating key actions of your EHM to improvement in clinical, utilization, and financial outcomes.
Validated (or audited) by a third party; based on sound principles of study design and analytics
“Fully adjudicated” claims have been cleansed and treated so as to eliminate duplicates, compress adjustments and reversals, and combine all claims related to a specific encounter (e.g., office visit, hospitalization, or ER visit) into a single claim that designates the type of service (e.g., hospital, ER, lab) and provider identifier. Financial editing facilitates accurate analysis. This is the quality of data found in claims data warehouses.
Table 2: Using Modeled v. Measured Savings
Table 2 provides more guidance on when to use modeled versus measured savings:

www.hero-health.org www.populationhealthalliance.org18
How Accurately Can We Measure EHM Savings?
Key points and recommendations: How accurately can we measure EHM cost savings?
• For all savings metrics, the basic principle is that savings is the difference between expected and actual cost.
• Savings metrics differ in how “expected cost” is calculated.
• It is rarely feasible to perform a “gold standard” savings calculation (which is based on randomizing people to EHM or no EHM).
• Work with your analyst, consultant, or vendor to use a metric that is as close to the gold standard as possible, recognizing the limitations of the time, resources and data required.
• Regardless of metric, include value (plausibility) metrics in reporting to bolster a claim of program savings.
It is impossible to measure with certainty how much was saved or lost by EHM. This has to do with the basis of EHM’s impact: savings are due to preventing costly adverse events. Because we can never know with certainty how many events (such as strokes or hospitalizations for complications of diabetes) were avoided, we must make an educated guess. The difference between the educated guess (what would have happened without the EHM) and what actually happened is our estimate of the EHM’s impact:
EHM savings = ($ spend expected) – ($ spend actual)
All savings measurement methodologies begin with the question: “How can we estimate what would have happened without the EHM?” Each of the recommended metrics must answer that key question.
Most analysts believe that the best way to know what would have happened without the EHM is to conduct a randomized controlled study in which people are randomly selected to participate in EHM or to not participate. Given the proper conditions, random assignment to treatment versus no-treatment “controls for” or neutralizes the personal, organizational, and social characteristics that could influence the outcome. By accounting for these influencing factors we can know— from what we observe in the control group—what would have happened absent EHM.
However, it’s rarely feasible to do a randomized study because employers want EHM to include their entire eligible population. As a result, we must depend on alternative methodologies to estimate the expected cost. Common methodologies used to estimate expected costs are explored in the Metrics section.
The accuracy of measured savings depends on how alike the comparison and EHM scenarios are. It is believed that accuracy is best achieved when the comparison scenario involves a population that is very similar to the EHM population—with the crucial exception that that population did not have the option of being exposed to EHM. For example, a factory with EHM might be compared to a factory without EHM.
Often an unexposed population is not available (e.g., when the company implements EHM across all employees). In that situation, it is typical to compare the cost trajectories of those who do and those who do not participate in various EHM program components. However, even with careful study design (using techniques to render the two groups as comparable as possible on their observable characteristics), we can’t really know how alike the exposed and unexposed (or participant and non-participant) populations are in the factors that drive cost trajectory.
Does this mean that we should never trust savings reports? No, as long as we remember to ask about how well-designed the savings study was (e.g., the size of the populations being compared, markers of how alike they were prior to EHM implementation, and what was done to render the groups comparable during the analysis). Equally crucial are the plausibility metrics, such as engaging a sufficient percentage of members with health-improvement opportunities and showing sustained improvements in their risk factors and clinical outcomes.
A Deeper Dive into the Recommended Financial Metrics
HERO and PHA recommend three savings metrics:
(1) Directly monetized: One (from a selection of five options) that is measured using the cost fields on claims, so by nature are already monetized
(2) Monetized improvements in healthcare service utilization: Based on a model that relates measured reductions in EHM-impactible healthcare service utilization to the known costs of these services
(3) Monetized improvement or prevention of lifestyle-related health risks

www.hero-health.org www.populationhealthalliance.org19
The directly monetized metric has five options characterized by the methodologies used to measure them. We recommend selecting one of these methodologies.
Five options for the directly monetized metric include:
(1) Cost trend compared with industry peers(2) Adjusted-expected compared to actual cost trend(3) Chronic vs. Non-chronic trends comparison(4) Participant vs. Non-participant cost comparison(5) Comparison with matched controls in a non-exposed
population
HERO and PHA selected these five savings metrics because they are commonly used or advocated, embody safeguards to improve their validity, are measured using the employer’s medical and pharmacy claims, and are reasonably easy to understand. Each of these metrics has advantages and disadvantages. However, as mentioned, none are perfect and—to our knowledge—none have been directly compared (on the same EHM program) to the prospective randomized controlled methodology, or even to each other. It is therefore strongly recommended that results using any of these methodologies be viewed together with the program’s value-chain plausibility metrics.
For a detailed discussion of financial measurement methodologies (including illustrations showing the tradeoffs in feasibility and validity), refer to the PHA Outcomes Guidelines Report vol. 5, p. 27–34.
Remember that all of these savings metrics incorporate ways of answering the basic question: “What would have happened without EHM?” The answer to this question gives the expected cost, to which the actual cost is compared: EHM savings = the difference between expected and actual cost.
Directly monetized savings Metric Option 1: Cost trend compared with industry peers. Cost trend is defined as the rate of change of cost between two time points, usually a year apart. Thus:
Cost trend (Year 1 to Year 2) = (Year 2 cost – Year 1 cost) / (Year 1 cost)
Usually the costs are as per member per month (PMPM). For example, suppose 2012 cost was $250 PMPM and 2013 cost was $265 PMPM. Then:
Cost trend (2012-2013) = ($15)/ ($250) = 6.0%
The difference between expected and actual trend can be converted to savings:
YEARACTUAL CG PMPM
ACTUAL SG PMPM
EXPECTED SG PMPM
2012 $250.00 $245.00 $245.00
2013 $265.00 $257.00 $259.70
Actual trend 6.0% 4.9%
EHM savings $2.70
CG: Comparison group; SG: Study group; PMPM: per member per month cost
In the above example, the 2012 healthcare cost of the Study Group (SG-covered members of the company with EHM) was $245.00 PMPM and the comparison group (CG) cost was $250.00 PMPM. In this metric option, the CG is made up of industry peers, as described below.
The 2013 actual costs for the CG and SG are shown, and 2012–2013 trends are calculated. The CG’s trend was 6.0% and the methodology therefore expects that the SG’s trend would have been 6.0% absent the EHM. But in fact it was only 4.9%, a trend reduction of 1.1 percentage points. The trend impact can be monetized by first calculating the SG’s expected cost as $245.00 x (1 + 6.0%) or $259.70. Subtracting actual from expected cost, savings for the SG (that is, for the EHM) were $2.70 PMPM.
This illustration used only three years of data to produce 2 trends (2011 and 2012 to produce the 2012 trend, and 2012 and 2013 to produce the 2013 trend). More data history (and therefore more consecutive trends) is preferred because it gives a better understanding of the employer’s health plan economics, but often only three years’ data are available.
All trend-based savings metrics calculate an expected trend, and then monetize the SG-CG trend difference in this way.
For Option 1 of the savings metric, the expected trend measured in the CG is that of industry peers, such as airlines, travel, banking, pharmaceuticals, or technology. Thus, the peer industry trend is the expected trend to which the specific study company’s trend is compared. The underlying assumption is that organizations in the industry peer group do not have EHM and that other factors that drive trend are very similar.

www.hero-health.org www.populationhealthalliance.org20
Directly monetized savings Metric Option 2: Adjusted-expected compared to actual cost trend. Expected trend for the performance year is developed in advance of the study year. Upon completion of the study year, the expected trend would be adjusted for factors that were not considered impactible by the EHM, if those factors turned out to be incorrectly forecasted before the beginning of the performance year.
Typically, overall expected and actual trends are decomposed into components, with some designated as EHM-impactible, others not EHM-impactible. A common list of components of trend includes:
• Demographics (age and gender distribution),• Risk (net of demographics),• Utilization units (net of price),• Price per unit of utilization,• Plan design (e.g., deductibles, copays, and
coinsurance amounts).
In this scheme, it is considered that risk (net of demographics) and at least some types of utilization can be impacted by EHM; the difference between their expected and actual values is monetized.
This “adjusted-expected whole-population cost trend” is compared to the actual trend and the difference is converted to savings using arithmetic similar to that in metric Option 1, in which:
• The expected trends of components that can be impacted by the EHM (risk net of demographics and utilization) are carried forward into the adjusted-expected column.
• The adjusted-expected trend components that are not impacted by EHM are set to equal their retrospectively measured values.
• The total adjusted-expected and retrospectively measured trends are compared, and that difference in total trends is monetized.
In the illustration on the next page, we assume for simplicity that all utilization services can be impacted by the EHM. Before the start of the performance year, all five trend components are projected.
• The non EHM-impactible demographic changes component was initially projected at 1.0%, but after the end of the year, retrospectively, it was measured at an actual value of 0.0%; therefore the adjusted-expected trend for this component was set to actual value of 0.0.
• Similarly, the other two non-EHM impactible factors (unit price and plan design) were initially projected, and their adjusted-expected values were set to be equal to their actual values as measured after the end of the performance year.
• The EHM-impactible risk net of demographic changes component was projected at 0.0%, so its adjusted-expected value was set at its initially-projected value of 0.0%. After the end of the year, this component was measured at -1.2% (value in the Retrospective Actual column set at -1.2%).
8.5%
8.0%
7.5%
7.0%
6.5%
6.0%
5.5%
5.0%2009 2010 2011 2012 2013
PHMINTRODUCED
Study Company
Peer Companies

www.hero-health.org www.populationhealthalliance.org21
Before the performance year, the Prospective Expected total trend was projected to be 8.1%; the Actuarially Adjusted “Expected” trend was reset to 8.4%, as described above; and the Actual trend was measured at 6.2%. The gap between Expected (8.4%) and Actual (6.2%) can be monetized as described for Metric 1.
Directly monetized savings Metric Option 3: Chronic vs. Non-chronic trends comparison. This metric is often used to calculate savings from a disease management program. It is less commonly used to estimate savings for members with chronic conditions in a more comprehensive EHM program because the supposition of this metric’s methodology is that the comparison group is not touched by EHM. The underlying assumption is that, absent disease management, the trend of the Chronic population (members who have at least one of the conditions managed by the program, such as heart failure, diabetes, or asthma) and of the Non-chronic population (everyone else) would be equal or bear the same relationship to each other over time.
The measured Non-Chronic trend is therefore the expected trend; the Chronic trend is the actual trend.
While Metric Option 3 remains in use for DM-focused programs, it should be noted that its fundamental assumption has been subjected to only a few studies and that it may not be valid to assume it is true. Some experts recommend risk-adjusting the Chronic and Non-chronic trends to attempt to mitigate the concern that the two populations may exhibit different trends (absent EHM) because they are inherently different. Several adjustments to the methodology have been described; it is important to ensure that your analyst or vendor understands when and how to adjust for the differing risks in the Chronic and Non-chronic populations. Nonetheless, this methodology remains popular (for programs focused on DM) because it is more rigorous than Options 1 and 2 and the calculations are more straightforward than for Options 4 and 5.
We recommend using Metric Option 3 only for EHM programs that primarily address chronic conditions, especially when a suitable comparison group is not available. For further guidance on evaluation of financial impact of programs that address chronic conditions, please see the PHA Outcomes Guidelines Report vol. 5, pp. 55–64.
Directly-monetized savings Metric Option 4: Participant vs. Non-participant cost comparison. Two basic approaches are used to calculate this metric; both rely on the assumption that the cost trajectories of EHM participants (P) and non-participants (NP) would be equal absent EHM. Thus the NP cost trend is used as the expected (comparison) trend to calculate expected costs for the P.
The simplest version of the P vs. NP metric—P vs. NP cohort methodology—compares the cost trends of the two P and NP cohorts (i.e., groups of the same people tracked over time). Those trends may optionally be adjusted for the difference in risk (predicted cost based on their clinical profiles) between the groups.d For EHM with multiple components (e.g., health risk appraisals, biometric screening, care gaps, telephone or online coaching for lifestyle risks or chronic conditions), separate participant (P) groups can be developed for each component.e The comparison NP group is developed from members targeted for EHM who did not participate.
A more rigorous version—the P vs. NP multivariate methodology—is similar to the cohort methodology but goes further to ensure that the NP comparison population is well-matched to the P population. The purpose of matching is to try to isolate the impact of EHM by neutralizing, or controlling for, non-program factors that might drive differences in cost trajectories between the P and NP.
Cost Trend
PROSPECTIVE EXPECTED
PROGRAM IMPACTABLE?ACTUARIALLY
ADJUSTED “EXPECTED”RETROSPECTIVE
ACTUAL
Demographic Changes 1.0% No 0.0% 0.0%
Risk Factors (net of demographics)
0.0% Yes 0.0% -1.2%
Unit Prices 6.0% No 5.2% 5.2%
Utilization 2.0% Yes 2.0% 1.3%
Plan Design -1.0% No 1.0% 1.0%
Total Trend 8.1% 8.4% 6.2%

www.hero-health.org www.populationhealthalliance.org22
Several ways are used to match the NP to the P groups. The goal is to get the differences in cost-driving characteristics between the groups to be statistically or clinically insignificant. This allows us to assume that, at least on characteristics that can be observed in the data, the groups would be expected to exhibit identical cost trajectories were it not for EHM. However, the method cannot eliminate unobservable cost-driving differences such as the effect of volunteering (selection bias).f
Directly monetized savings Metric Option 5: Comparison with matched controls in a non-exposed population. This is the most rigorous of the directly monetized savings metrics, and, if properly done, the closest simulation to the gold standard randomized controlled study. This is so because it uses a population not exposed to EHM but otherwise similar along characteristics (e.g., demographics, chronic conditions and historical cost patterns) to the EHM-exposed population to develop expected cost.
Key to success with this metric is to ensure that the comparison population is like the EHM population in all ways that are believed to drive cost trajectory, with the exception that members in the EHM population have the opportunity to participate in EHM. There are statistical methods available to accomplish this and to determine whether observable characteristics of the comparison population are sufficiently similar to the EHM population. While this methodology is considered to be the most rigorous of our recommended metrics, it requires a large number of individuals in the comparison population without EHM to ensure that all EHM-program participants (or program-qualified)g can be matched with like individuals in the non-EHM population.
Monetizable metrics
• EHM-impactible utilization (hospitalizations, ER visits and procedures that can be potentially impacted by EHM)
• Reduction in or prevention of lifestyle-related health risk factors
Monetizable savings Metric 6: EHM-impactible utilization. ‘Utilization’ refers to use of health care services such as lab testing, imaging, emergency room, hospitalizations, drugs, and procedures. Depending on the components of an EHM program, some utilization may be affected by EHM. The impact may result in increased or decreased use of such services. While we focus on decreased impactible utilization here, it is important to recognize that EHM should increase the use of certain services, such as preventive and screening services, certain chronic medications, and outpatient visits. It is even possible to see a rise in ER and urgent care visits as well-informed patients learn to get urgent medical care when they experience early warning signs of stroke, asthma, or heart attack.
Because the cost of these services is known from claims data, changes in their usage rates can be monetized by multiplying the number of service units gained or lost by the average service cost. As with directly monetized metrics, the change in usage rate for a given service is the difference between the expected and actual rates.
Example focusing on hospitalizations: By reducing and preventing risks for chronic cardiovascular conditions,h diabetes, and COPD, a successful EHM program that engages people with chronic conditions should reduce unscheduled outpatient, emergency, and hospital visits related to these diagnoses. Over several years, EHM should reduce the rate at which people newly develop these conditions. This example will focus on “potentially preventable” hospitalizations (PPH) for these conditions.i The two pre-EHM years are selected as the comparison period, and the analysis is performed on the program’s second performance year (PY2).
The report shows that the population grew slightly between the comparison period and the second performance year, and that rates of chronic conditions in the population (i.e., prevalence) rose as well: the percent of the population with one of the target chronic conditions rose from 6.6% in the two pre-program years to 6.9% in the PY2. However, the PPH rate declined from 3.14 to 2.62 per 1,000 members— a decrease of 0.53 per 1,000 members or 9.26 for the entire population (0.53 x 211,000/12,000).

www.hero-health.org www.populationhealthalliance.org23
The slight rise in proportion of members with the target conditions from the comparison period to PY2 may imply that all else equal, PPH should have risen slightly if not for EHM.j In fact, all-cause hospitalizations except PPH declined slightly, but not nearly as much as the PPH decline, suggesting (but not proving) that the PPH decline could be attributed to the EHM programs.
Reduction in EHM-impactible hospitalizations may be due to factors other than EHM, such as improved treatment of established disease from drugs, medical devices and surgery; movement of some treatment to outpatient settings; or general improvement in risk factors not specifically due to EHM. Your analyst, consultant, or vendor should provide this background context with your report.
EHM-impactible utilization metrics are important plausibility markers in the value-production chain and EHM’s impact on these metrics is the step just before (and the cause of) savings.k
Your report should be clear about which types of utilization were included in the savings calculation. Typically reports should include the following types of utilization:
• Expect to see decreases in: ERl and hospital use for common chronic conditions (e.g., heart disease, stroke, asthma, COPD, and diabetes); use of generic medications.
• Expect to see increases in: primary care visits, screening services (e.g., breast, cervical or colon cancer) and immunizations.
Monetizable savings Metric 7: Reduction in or prevention of lifestyle-related health risk factors. Several studies4,5 have concluded that worksite “health promotion” programs— which generally focus on reducing lifestyle-related health risk factors such as tobacco use, poor nutrition, overweight, poor stress management, and physical inactivity—reduce healthcare and absenteeism costs. It’s thought that lower costs result from short- and long-term reductions in the consequences of having these risk factors (i.e., EHM-impactible utilization).
COMPARISON PERIOD PY2
Prevalence Hosp Hosp/K Prevalence Hosp Hosp/K
Member-months 210,000 211,000
Member count 18,100 18,200
IVD 2.1% 32 1.83 2.6% 25 1.42
CHF 0.2% 3 0.17 0.3% 4 0.23
Diabetes 2.4% 3 0.17 3.2% 6 0.34
Asthma 2.7% 13 0.74 4.3% 9 0.51
COPD 0.4% 4 0.23 0.6% 2 0.11
PPH 6.6% 55 3.14 6.9% 46 2.62
All-cause hospitalizations 702 40.04 685 38.96
All-cause except PPH 647 36.97 639 36.64
Savings estimation
Trend: PPH -17%
Trend: All-cause except PPH -2%
Saved PPH/K 0.53
Saved PPH for population 9.26
Weighted cost/PPH $22,500
Saved PPH cost $208,393
Saved PPH cost PMPM $0.99
IVD: Ischemic vascular disease (coronary artery disease, peripheral artery disease and stroke); CHF: congestive heart failure; Prevalence: Percent of the population with the listed condition; Hosp: hospitalization count; Hosp/K: Rate of hospitalizations per 1,000 members (per 12,000 member months); All-cause hospitalizations include all hospitalizations except those for pregnancy, delivery, or newborns.
The average facility and professional cost per PPH in the PY2 was $22,500, so the 9.26 prevented hospitalizations resulted in $208,393 in savings:

www.hero-health.org www.populationhealthalliance.org24
Evidence for savings from prevention and reduction of lifestyle-related risk factors comes from carefully-conducted published studies. However, it should not be assumed that the savings from preventing, as compared with the savings from reducing, a risk factor are equal. While PHA and HERO believe that evidence supports savings from reducing or preventing risk factors, monetization for specific program results is not yet supported by the evidence. Nevertheless because of the great interest in this topic we will summarize the evidence to date.
Risk prevention: HERO maintains a large, longitudinal database to which several large employers contribute de-identified data on their members’ healthcare costs, lifestyle risk factors, and program participation. The HERO database has supported several studies relating presence of these risk factors to healthcare costs. The original HERO study6 concluded that most of ten risk factors were associated with increased cost. These results were supported by a second larger HERO study published in late 2012.7 Many analysts use the studies’ findings to monetize changes in the individual risk factors in a population year over year, or in a cohort of individuals tracked from one year to the next.
Risk reduction: Strictly speaking the HERO findings should be used to monetize prevented risks because the studies showed the incremental cost of having, versus not having, each risk factor. There is less evidence on which to base savings from net risk reduction (i.e., the difference between increases and decreases in risk factors). Except for a few factors, the current evidence is strong enough only to monetize savings per risk reduced, or for an individual’s movement from a higher to a lower risk category.
SELECTING FINANCIAL METRICS: A DECISION AID
Here’s guidance on selecting financial metrics to best evaluate your EHM program. Two important caveats: First, this section is provided to help you work with your analyst, consultant, or vendor and to assess their metric recommendations. Second, these are intended to provide guidance only. For example, if your membership size is only 15,000, your analyst may have good reason to believe that some of the metrics labeled as suitable only for populations larger than approximately 25,000 are valid in your situation.
As discussed earlier, there are two basic strategies of metrics: models and measurements. The latter requires accurate, adjudicated, financial data, but it’s important to note that models should still be based upon data specifically about your membership, programs and results. It’s not necessarily always preferable to insist on a measurement over a well-constructed model.
In selecting financial metrics, your analyst, consultant, or vendor will ask:
1. Do we have enough baseline (pre-program) claims data? If so, is it of high enough quality? Baseline data should include a minimum of 12 months (or 24 months for a more solid baseline) of membership, eligibility, medical and pharmacy claims—and preferably lab test (or biometric) results—and, if appropriate, risk factor (HRA) data. It must be possible to link individuals in the baseline data set to those in the program years’ data.
2. Do we have fully adjudicated claims? If not, a dollar- based analysis is not possible, though with an accurate utilization file, Metric 5 could still be run.
3. Is our membership size more than approximately 25,000?
4. Do we have the analytic resources (expertise and time) available for a methodologically sophisticated study? If we do, do we need a sophisticated study? If so, why?
5. Which EHM components are we implementing (e.g., lifestyle coaching, case management, gaps in care, disease management and maternity)?
6. Is the structure of our EHM program reasonably close to those in published savings literature?
7. Does our consultant have a large benchmarking database that includes employers in our industry?
8. If considering a rigorous study based on Metrics 4 and 5: Do our leading indicators indicate the program has achieved enough initial success to make it plausible to detect a sizable enough savings to demonstrate ROI? Minimums we recommend are 50% health assessment and/or screening participation rates; 30% enrollment into targeted coaching; and 15% or more participation in a population-wide health improvement program (e.g., pedometer program). These are minimums; typically, two years of these data are required for a rigorous study.
✔ If your membership size is much less than 25,000, it’s generally not advisable to run Metrics 1-5—though there are circumstances where a valid result can be obtained with substantially fewer members. Metric 6 may lose validity with smaller populations as well due to the usually low PPH rate.
✔ If your program has a strong population health orientation and have sufficient analytics expertise, and have good justification for doing a rigorous study, HERO and PHA recommend running Metrics 4 or 5 (the latter if you have a good comparison population not exposed to the components in your EHM program).

www.hero-health.org www.populationhealthalliance.org25
✔ If your EHM program structure is fairly similar to those in published savings studies, consider using a model based on engagement, rates of lifestyle risk prevention and reduction, and improvement in clinical outcomes.
✔ Trend-based Metrics 1 and 2 may require input from an actuary and, at best, can tell you only if your program was cost-saving, but not what caused savings or what worked or didn’t work. Combine trend-based metrics with value-chain markers to gain the insight you need to evolve your programs.
CHAPTER 2 REFERENCES1 Grossmeier J, Terry P, Anderson DR, Wright S. Financial impact of population health management programs: reevaluating the literature. Population Health Management, 2012;15(3):129-134.2 The SOLVD Investigators. Effect of enalapril on survival in patients with reduced left ventricular ejection fraction and congestive heart failure. N Engl J Med 1991;325:293-302.3 Grossmeier J, Terry P, Anderson DR, Wright S. Financial impact of population health management programs: reevaluating the literature. Population Health Management, 2012;15(3):129-134.4 Grossmeier J, Terry P, Anderson DR, Wright S. Financial impact of population health management programs: reevaluating the literature. Population Health Management, 2012;15(3):129-134.5 Baicker K, Cutler D, and Song Z. Workplace wellness can generate savings. Health Affairs 2010;29(2):304-311.6 (HERO 1) Goetzel RZ, Anderson DR, Whitmer RW, et al. The relationship between modifiable health risks and health care expenditures: An analysis of the multi-employer HERO health risk and cost database. J Occ Envir Med 1998;40:843-854.7 (HERO 2) Goetzel RZ, X Pei, MJ Tabrizi, et al. Ten modifiable health risk factors are linked to more than one-fifth of employer-employee health care spending. Health Affairs 2012;31(11):2474-2484.
CHAPTER 2 FOOTNOTESa This metric is included because we find solid, consistent evidence of increased cost in individuals with risk factors, and consistent evidence of savings when individuals eliminate risk factors—but insufficient evidence from which to develop a specific cost-saving model.b The recommendation to figure in all sources of value and all sources cost when estimating ROI is meant to help employers evaluate their EHM program’s value from a holistic perspective. It is not meant to suggest that performance guarantee ROIs (which usually are stated as medical or medical plus productivity savings divided by program fees) do so.c Expert opinion on whether savings should be modeled from gross or net risk reduction. Under the assumption that EHM doesn't worsen risk factors, the gross model takes credit for the number of risks reduced and ignores risks that newly arose during the measurement period. The net model takes credit only for (risks reduced - risks added). The gross model's proponents claim it more accurately reflects the impact of EHM; the net model's proponents claim that it better reflects the program's impact on the employer's financial position, since risks acquired will become financial.d PHA Outcomes Guidelines Report, vol. 5 recommends “the appropriate use of adjustment to achieve comparison group equivalence” (p. 15), and gives examples of how to use risk adjustment in pp. 73-82. However, the use of risk adjustment in cohorts is somewhat controversial because a cohort is composed of the same people tracked over time. If your analyst uses this version of Metric 4, you should ask if risk adjustment was used. e Many analysts believe that it’s not appropriate to measure the independent savings from health risk appraisals and biometric screening on the grounds that their role is to identify people with opportunities to improve their health and engage them with programs and tools whose financial value is the appropriate measurement target.f For example, it may be that people who volunteer are those who were about to take the initiative to improve their health anyway; or that those who volunteer are inherently earlier or later in their cost-trajectory. g Often it is not the P who are matched to like members of the comparison group but rather members who were qualified to participate, regardless of whether they did. This process eliminates the possibility of selection bias.h Typically, cardiovascular conditions include ischemic vascular disease (coronary artery disease, peripheral artery disease, and stroke) and congestive heart failure.i The term, “for the condition”, designates hospitalizations where the condition appeared on the claim or hospital discharge record as either the principal diagnosis (main reason for which the patient was hospitalized) or in some cases the secondary diagnosis (principal diagnosis was a complication of the EHM-impactible diagnosis—for example, a diabetic hospitalized for lower limb amputation might show ‘diabetes’ as secondary diagnosis but since the amputation was due to a complication of diabetes, such a hospitalization would be counted as a PPH).j Whether PPH rates should be adjusted for changes in prevalence of the related conditions is controversial, but it is certainly useful to know whether the prevalence of such conditions in your population is rising or falling. k Because of this tight relationship, some analysts have proposed replacing measured financial savings with monetized changes in utilization. While this would reduce the ‘noise’ introduced by direct-measurement methodologies, it doesn’t resolve the question of whether the EHM program caused the reduced utilization; other factors such as changes in benefit design, the economy, and advances in medicine may influence utilization rates.l Use of ER services is a controversial measure of EHM effectiveness. In some circumstances ER services for PPH-type conditions could increase with effective EHM as members learn to attend proactively to the warning signs of clinical decompensation and are treated in ER and released—thus preventing an inpatient stay. However, because an ER visit that results in a hospitalization is not billed separately, it might appear that ER visits are increasing while in fact some of them are simply becoming visible as claims.

www.hero-health.org www.populationhealthalliance.org26
INTRODUCTION
The initial task was to identify all areas that might reasonably be construed to demonstrate the impact that an EHM program might have on the overall health and well-being of the population being served. To address this task, HERO and PHA considered various models for health and well-being.1,2,3 These typically include dimensions such as: physical, mental/emotional, social, environmental, spiritual, intellectual, and occupational. Based on our review, we identified the 4 dimensions of health for inclusion in our basic set of health impact measures that are discussed below.a
Process for Selecting Health Dimensions
Choice of the health dimensions was based on consensus among the workgroup members. However, to be included a dimension had to meet at least one and usually more of the following criteria:
1. Clear relationship with health outcomes (as determined by literature review).
2. Clear relationship with healthcare and/or productivity costs (as determined by literature review).
3. Able to be affected by employers via their EHM programs.
4. Industry consensus on the importance of the dimension (as determined by review of: (1) existing guidance documents and (2) inclusion in more than one (generally most) of the most widely used HRAs (including WebMD, StayWell, Alere, HealthFitness, University of Michigan, CDC, RedBrick, and Mayo Clinic).
Based on these criteria, the final dimensions chosen for the initial set of measures for the health impact section of standards included:
• Physical Health (biometrics such as blood pressure, height, weight, etc., and existence of chronic conditions)
• Mental/Emotional Health• Health Behaviors• Health Status• Summary Health Measures (indices relating to
risk status)
Other dimensions that were discussed but not included in this health impact section were:
Environmental and Occupational Health: It was the consensus of the workgroup that these dimensions would be addressed as part of organizational culture indices, which were covered by a separate workgroup.
Intellectual Health: Not included due to lack of adequate demonstration of the relationships with health outcomes and with healthcare and productivity costs. While there is significant evidence that level of education can influence health status, this is a broader issue beyond specific actions that should be taken as part of an employee health management program. Encouraging life-long learning could contribute to well-being and life satisfaction, but this dimension more appropriately falls under the organizational support section in the future.
Social Health: While there is evidence showing that social support systems are important and effective in influencing health and behavior change, it is still not adequate to demonstrate a direct relationship with health outcomes and healthcare and productivity costs. Again, this dimension could be addressed under the organizational support section.
Spiritual Health (Purpose/Meaning in Life): This area is gaining recognition but the evidence for the relationships with health outcomes and costs were not considered adequate for inclusion in this version. There is also a lack of consensus on the role or influence that an employer can/should play with this dimension.
Although the consensus of the group was that each of these dimensions are potentially important in promoting the total health of the individual, there was less consensus around how to best measure them as stand-alone areas which impact health status. In addition, we could not identify satisfactory brief surveys that could be incorporated into our minimum measure set that addressed each of these dimensions adequately. They will be reconsidered for inclusion in future versions of this document.
CHAPTER 3: HEALTH IMPACT
Gordon D. Kaplan, PhD, and LaVaughn Palma-Davis, MA

www.hero-health.org www.populationhealthalliance.org27
Criteria for Selecting Measures Within Health Dimensions
Measures (items) within each health dimension were selected for inclusion based on the following general criteria:
1. The measure has been recognized by the field as being an important determinant of health outcomes and healthcare/productivity costs. This determination was based on literature review, review of major HRAs, review of currently available guidance documents, and the collective experience of the workgroup members as subject matter experts.
2. The measure is reasonable for employers to implement. This includes availability and ease of measurement, reasonable cost, and, where applicable, direct measurement capability. For example, measures available in the public domain were preferred over measures that were proprietary and, therefore, had additional costs for use.
3. The measure is or can be made comparable across program providers/vendors.
4. The measure can be affected by the employee health management programs provided by employers.
5. Assessment of the measure does not significantly increase the overall length of the measurement tool. The workgroup recognized the need to keep the measurement tool to a reasonable length to improve completion rates and to not be overly burdensome to users who may wish to enhance the basic question set with unique additional items. Therefore, wherever possible single item measures were preferred over measures requiring multiple items.
The following process was used to determine the measures selected for inclusion in the final draft of the health impact basic measure set:
1. Literature Review2. Review of currently available HRAs3. Review of existing consensus documents4. Expert opinion/consensus on the final measure set
Special Issues
Length of Question Set: Ideally should be able to be completed by participant in 15–20 minutes. Therefore a goal was set to have no more than 30 items.
Direct vs. Self-report measures: We acknowledge that to maximize the validity of the measures that are collected, where possible the preferred measurement approach would be direct measurement. An example would be the onsite measurement of biometrics (height/weight, blood pressure, blood lipids, blood glucose) or biochemically validated
tobacco use status. However, in most cases, direct measurement may not be practical or even possible. Therefore self-report remains the primary method for collecting most of the health impact measures. Although the validity of self-report has been challenged in certain areas—particularly for health biometrics—consensus in the field is that self-report may be used with reasonable confidence that it represents the health status of the individual.4,5 A number of factors can influence the likelihood that individuals might bias their responses to HRA survey items; these are reviewed in Donaldson and Grant-Vallone.6 In the design of EHM programs, it is important to note that when self-report data are being included, care should be taken that participants are not incentivized to misrepresent their status. Incentives that are based on outcomes may require direct measurement for employers to be comfortable with results.b
Apart from these issues, it should be noted that self- reported data are not without value in their own right. These data reflect the participant’s perceptions of their health risks and allow the assessment of preventive behaviors that are difficult to assess through direct measurement. These perceptions are part of the constellation of health status that is important for EHM programs to address. For example, mismatches between actual and perceived risk provide opportunities for more effective tailoring of interventions. When self-reported biometric values are used, we recommend that a flag be included in the data set that allows self-report and direct measures to be distinguished from one another.
Timing of Data Collection: The varying processes of how Health Assessments (HA) are administered and how biometric data are collected raises issues related to timing. When these health impact measures are being used to evaluate the overall impact of a health enhancement program, they should be collected as close as possible to the beginning and end of the evaluation period. The rollout of the Health Assessment at the beginning of the evaluation period, however, may allow people to complete the assessment over a period of months, and in many cases assessments are available for completion throughout a program year. In addition, when biometrics are being measured directly as in a health fair, there may be reasonable scheduling issues that result in these measures needing to be collected over a period of time, and possibly not at the same time as other Health Assessment questions are answered. Given these issues, the workgroup recommends: (1) whenever possible HA’s should be completed as near as possible to the beginning and end of the program evaluation period. A reasonable time frame

www.hero-health.org www.populationhealthalliance.org28
would be within 3 months of either side of the beginning or the end of the program evaluation period. The employer might consider offering incentives that would encourage completion of the HA within the desired time frame. (2) It is desirable that directly measured biometric and self-reported HA data are collected at the same time. When biometric data are being collected at a different point in time (e.g., due to scheduling restraints), a reasonable rule should be applied so that these data are as synchronized as possible. We recommend a 3-month rule for combining biometric and HA data collected at different points in time. (3) In evaluating an EHM program, pre and post HA’s should be sufficiently far apart to allow for change to have taken place. We recommend that HA’s be at least 9 months apart to accomplish this purpose.
We also recommend that, if at all possible, the timing of the health assessment and other measurements be consistent year over year.
Specific Item/Response Option Wording: To maximize data comparability across employers, it is desirable for all users to include identical items and response options for these basic measures. Having said that, minor variations in the wording of an item which would not be expected to impact the meaning of the measure may be acceptable. Examples are included in the list of recommended measures that follow.
Basic vs. Expanded Measure Sets: The basic measure set is being recommended as the basis for common measurement across all employee health enhancement evaluation efforts. However, the recommendations of this group do not mean that individual users cannot add additional items to the basic set as they look for ways to further refine their evaluation strategy. The nature of the EHM program being assessed may call for additional items to allow for a more robust analysis. This document is not suggesting that this should not be done. In addition, if the program being evaluated does not address specific areas included in this recommended measure set, it may be acceptable to remove non-relevant items.
Are all Health Risks Equal? The answer to this question may seem obvious. Not all risks are equal either with regard to their impact on health status or their impact on near or even long-term costs. These facts are functions both of the strength of the association of risk factors to health outcomes and utilization and the timing of the impact of these risks on outcomes and utilization. So when it comes to making decisions about what interventions to emphasize in an EHM program, these factors should be considered along with one other—the individual or population’s readiness to address the risks identified. Generally, among
modifiable risks, elevated biometric risks tend to reflect a point further along the health continuum from optimal health and vitality to chronic illness and death. Therefore their impact on health outcomes (e.g., adverse health events) and costs will tend to be closer in proximity to their measured status than would be the case for risks that are considered part of lifestyle such as tobacco use, excessive alcohol use, or lack of physical activity. And for each biometric risk, the degree to which it is elevated also makes a difference. So to the extent that elevated biometric risks can be effectively identified and addressed within a population, such an approach is likely to yield nearer term results in terms of reduced healthcare and productivity costs.
It is also well-known, however, that traditional lifestyle-related risks are often the precursors of biometric risks and have been linked to increased health costs on their own. Therefore, they continue to be the focus of and the first line of attack for prevention efforts. It is also important to note that research on sets of risk factors shows that the total number of elevated risks and the change in multiple risk status is strongly associated with cost savings.7,8,9,10 A basic message coming out of this research is that the most important risk to change (from a set of elevated risks) is generally going to be the one which the individual is most ready to change.11 The third factor of an individual’s readiness to change, therefore, should be given serious consideration in program design and the priority of risk management within a population.
In summary, from a practical point of view for the employer, most risks can be considered relatively equal from the perspective of what should be done. In planning interventions, employers should consider the risk factors with the highest prevalence in their population and the relationship between risk factors (e.g., obesity, physical activity and nutrition are all linked), with the goal of improving and maintaining low risk status and reducing high risk status overall.
LIST OF RECOMMENDED MEASURES
The following list represents the minimum set of measures recommended upon which a basic evaluation of the effect of employer-sponsored health enhancement initiatives on the health of the populations being served can be made. References for each measure can be found at the end of this section.

www.hero-health.org www.populationhealthalliance.org29
DIMENSION 1: PHYSICAL HEALTH IMPACT
These items/measures represent the minimum set of indices that can be used to judge the impact of health enhancement programs on participants’ overall physical health status.1. BMI (derived from Height; Weight)12,13,14,15,16,17
Method:Direct Measurement and Data Entry (preferred) Self-report (if direct measurement is not possible)
Suggested Item:Please enter your height and weight below. (If you are a female and are currently pregnant, please enter your pre-pregnancy weight.)
Height (without shoes): ft inWeight (without clothes): pounds
Notes:Reasonable variant ways of asking for these measures are acceptable.Note that for certain populations, BMI may not adequately represent risk. For example, athletes with higher lean body mass may have elevated BMIs but not be at risk due to low body fat levels. For such populations it would be desirable to add a measure of body fat.
At Risk Definitions:Not at Risk: BMI = 18.5–24.9At Risk, Underweight: BMI < 18.5At Risk, Overweight: BMI = 25.0–29.9At Risk, Obese: BMI >= 30.0
2. Blood Pressure (Systolic and Diastoic)18,19,20,21,22,23
Method:Direct Measurement and Data Entry (preferred) Self-report (if direct measurement is not possible)
Suggested Item:If your blood pressure was checked within the past year, what was it when it was last checked? Enter the value or check one of the options listed below. / mm Hg
Low or Normal (Below 120/80) Borderline high (120/80 to 139/89) High (140/90 or higher) Don't Know/Not Sure
Notes:If individuals do not know or remember their last blood pressure, it is advisable to allow them to give their best estimate using ranges such as shown in the suggested item. Reasonable variant ways of asking for these measures are acceptable.
At Risk Definitions:Not at Risk: BP < 120/70At Risk, Borderline High: BP 120–139.9/80–89At Risk, High: BP >= 140/90
3. Cholesterol (Total; HDL; LDL)24,25,26,27,28,29
Method:Direct Measurement and Data Entry (preferred)Self-report (if direct measurement is not possible)
Suggested Items:If your total cholesterol was checked within the past year, what was it when it was last checked? Enter the value or check one of the options listed below. mg/dL
Desirable (Below 200) Borderline high (200 to 239) High (240 or higher) Don't Know/Not SureIf your HDL cholesterol was checked within the past year, what was it when it was last checked? Enter the value or check one of the options listed below. mg/dL
Low (Below 40) Average (40–59) High (60 or higher) Don't Know/Not SureIf your LDL cholesterol was checked within the past year, what was it when it was last checked? Enter the value or check one of the options listed below. mg/dL
Optimal (Below 100) Near optimal/above optimal (100 to 129) Borderline high (130 to 159) High (160 to 189) Very High (190 or higher) Don't Know/Not Sure
Notes: If individuals do not know or remember their last cholesterol values, it is advisable to allow them to give their best estimate using ranges such as shown in the suggested items.Reasonable variant ways of asking for these measures are acceptable.
At Risk Definitions:Not at Risk: TC < 200 and HDL >= 40 and LDL < 100At Risk, Moderate Risk: TC = 200–239; HDL >= 40; LDL = 100–159At Risk, High Risk: TC >= 240 or HDL < 40 or LDL >= 160

www.hero-health.org www.populationhealthalliance.org30
4. Fasting Blood Glucose30,31,32,33,34Method:Direct Measurement and Data Entry (preferred)Self-report (if direct measurement is not possible)
Suggested Item:If your blood glucose (blood sugar) was checked within the past year, what was it when it was last checked? mg/dL
Was this value taken after you had not had anything to eat or drink besides water for at least 8 hours (check Fasting) or not (check Non-Fasting)?❍ Fasting ❍ Non-FastingIf you do not know your last blood glucose value, check one of the options listed below. Low (Fasting blood glucose less than 70) Desirable (Fasting blood glucose 70–99) Borderline high (Fasting blood glucose between
100 to 125) High (Fasting blood glucose 126 or higher) Don't Know/Not Sure
Notes:If individuals do not know or remember their last blood glucose value, it is advisable to allow them to give their best estimate using ranges such as shown in the suggested item.Reasonable variant ways of asking for these measures are acceptable.If a fasting blood glucose is not available, it may be possible to use a non-fasting value and apply non-fasting cut points for determining risk status.
At Risk Definitions:Fasting:Not at Risk: 70–99 mg/dLAt Risk (Low BG): < 70 mg/dLAt Risk (Moderate): 100–125 mg/dLAt Risk (High): >= 126 mg/dLNon-Fasting:Not at Risk: 70–139 mg/dLAt Risk (Low BG): < 70 mg/dLAt Risk (Moderate): 140–199 mg/dL (but requires further evaluation)At Risk (High): >= 200 mg/dL with symptoms of diabetes or HbA1c35,36,37,38
Method:Direct Measurement and Data Entry (preferred) Self-report (if direct measurement is not possible)
Suggested Item:If your A1c level was checked within the past six months, what was it when it was last checked?If you have diabetes: Desirable (Below 7.0) High (7.0–8.9) Very high (9.0 or higher) Don't Know/Not SureIf you do not have diabetes: Desirable (Below 5.7) Somewhat High (5.7–6.4) High (6.5 or higher) Don't Know/Not Sure
Notes:If individuals do not know or remember their last HbA1c value, it is advisable to allow them to give their best estimate using ranges such as shown in the suggested item.Reasonable variant ways of asking for these measures are acceptable.
At Risk Definitions:Diabetics:Not at Risk: A1c <7.0At Risk (Moderate): A1c =7.0–8.9At Risk (High): A1c >= 9.0Non-diabetics:Not at Risk: A1c < 5.7At Risk (Moderate): A1c = 5.7–6.4At Risk (High): A1c >= 6.5
5. Medical Conditions39,40
Method:Self-report (can augment with claims-based identification if available but should not replace self-report)
Suggested Item: Do you have:Arthritis Never In the past Have currentlyAsthma Never In the past Have currentlyBack Pain Never In the past Have currentlyCancer Never In the past Have currentlyDepression Never In the past Have currentlyDiabetes Never In the past Have currentlyHeart Disease Never In the past Have currently

www.hero-health.org www.populationhealthalliance.org31
Heart Failure Never In the past Have currentlyHypertension Never In the past Have currentlyHyperlipidemia Never In the past Have currentlyLung Disease, other than asthma (e.g. COPD, Chronic bronchitis, Emphysema) Never In the past Have currentlyChronic Insomnia Never In the past Have currently
Notes:These are the minimum conditions that we recommend should be assessed; others may be added if there is a good reason for doing so (such as a particular initiative being pursued by the employer in collaboration with a vendor).Reasonable variant ways of asking about these conditions are acceptable. The concept is to identify current medical conditions. It is advisable to give definitions for medical terms that may be unfamiliar to individuals (this is not shown in the suggested item).
At Risk Definitions:Not Really Applicable: Since wellness programs cannot eliminate the presence of a condition. Within a value context, this information is mainly useful to distinguish among populations with one or more medical conditions in order to see the impact of a wellness program on the health of these subpopulations.
DIMENSION 2: MENTAL AND EMOTIONAL HEALTH IMPACT
These items/measures represent the minimum set of indices that can be used to judge the impact of health promotion programs on participants’ overall mental and emotional health status. Mental health issues are a significant cost area for employers in health care, absenteeism, productivity and disability. Collaboration between an employer’s EHM and EAP programs can be very useful in addressing these issues offering both individual and organizational approaches.
6. Perceived Stress41,42,43,44,45,46 Method: Self-report
Suggested Item: How often is stress a problem for you in handling such things as your:healthfinancesfamily or social relationships, or work?
Answer options for each: Never or rarely Sometimes Often Always
Notes: Consider "at risk" if individual answers "often" or "always."Although harder to measure across individuals, most authorities agree that a high level perceived stress is likely to have a negative impact on health either directly or indirectly (by affecting adherence to healthy lifestyles or prescribed health management regimens).There is no agreed upon gold standard for assessing perceived stress, although most SMEs agree that it has meaningful impact on health and/or adherence to a health-promoting lifestyle. Proprietary scales exist (e.g. Cohen, 1983) but have associated costs and also add length to a survey.Given that various simple self-report items have been used in research demonstrating the relationship among multiple risk factors and healthcare/productivity costs, it seems prudent to recommend including such an item, pending the emergence of an improved measure.Reasonable variant ways of asking for this measure are acceptable. Concept is to assess the extent to which the individual perceives his/her current stress level to be a problem.
At Risk Definitions:Not at Risk: Never or rarely, SometimesAt Risk: Often, Always
7. Depression47,48 Method: Self-report
Suggested Items: Over the last 2 weeks, how often have you been bothered by feeling down, depressed, or hopeless? Not at all Several days More than half the days Nearly every dayOver the last 2 weeks, how often have you been bothered by little interest or pleasure in doing things? Not at all Several days More than half the days Nearly every day

www.hero-health.org www.populationhealthalliance.org32
Notes:Both items are required. This approach to depression screening allows for scoring.49 There are longer instruments for evaluating depression (CESD; Beck; PHQ); using these would significantly increase the length of the survey. Consider using a longer instrument as part of an intervention program rather than as an initial screener.At Risk Definitions:Not at Risk: Score < 3At Risk: Score >= 3
8. Anxiety50
Method: Self-reportSuggested Items: Over the last 2 weeks, how often have you been bothered by feeling nervous, anxious, or on edge? Not at all Several days More than half the days Nearly every dayOver the last 2 weeks, how often have you been bothered by not being able to stop or control worrying? Not at all Several days More than half the days Nearly every dayNotes:Both items are required. This approach to anxiety screening allows for scoring.51 At Risk Definitions:Not at Risk: Score < 3At Risk: Score >= 3
9. Perceived Life SatisfactionMethod: Self-reportSuggested Item: In general, how satisfied are you with your life (include personal and professional aspects)? Completely satisfied Mostly satisfied Partly satisfied Not satisfiedNotes:Perceived life satisfaction has been correlated with health status and annual health care costs.52
At Risk Definitions:Not at Risk: Completely or Mostly SatisfiedAt Risk: Partly or Not Satisfied
DIMENSION 3: HEALTH BEHAVIORS THAT IMPACT PHYSICAL/MENTAL AND EMOTIONAL HEALTH
10. Physical Activity (Total amount)53,54,55,56,57,58 Method: Self-report (consider augmenting by direct measurement using, for example, pedometer or accelerometer data if available)
Suggested Items: Consider any high intensity activity that you do either at work or in your leisure time. In a typical week, how many days do you get at least 20 minutes of high intensity physical activity? You may count any high intensity activity that you do that lasts at least 10 minutes at a time. (High intensity activities are activities that increase your heart rate, make you sweat, and may make you feel out of breath. Examples include jogging, running, fast cycling, aerobics classes, swimming laps, singles tennis, etc.)Answer options: 0–7 daysConsider any moderate intensity activity that you do either at work or in your leisure time. In a typical week, how many days do you get at least 30 minutes of moderate intensity physical activity? You may count any moderate intensity activity that you do that lasts at least 10 minutes at a time. (Moderate intensity activities are activities that require more effort than is needed to carry out typical everyday tasks. Examples include brisk walking, gardening, slow cycling, dancing, doubles tennis, etc.)Answer options: 0–7 days
Notes: There are several ways this can be done within the context of an HRA. NCQA guidance suggests one of two possible methods. We recommend that one of these be used.Method 1: Days per week of 20 (30) minutes of vigorous (moderate) activity (see suggested item)For survey items that ask respondents how many days per week they got at least 20 (30) minutes of vigorous (moderate) activity, count the number of days for each type of activity level.Respondent is considered at risk for physical activity if NONE of the following are met:
• Number of days of vigorous activity for at least 20 minutes < 3
• Number of days of moderate activity for at least 30 minutes < 5

www.hero-health.org www.populationhealthalliance.org33
Method 2: Time per week using minutes per day of vigorous (moderate) activityFor survey items that ask respondents how much time per day spent doing vigorous (moderate) activity in either actual minutes or number of 10 minute intervals:Calculate total minutes per week of vigorous activities• Calculate total minutes per week of moderate activities• Calculate total amount of metabolic equivalent
(MET) minutes per week (optional)- Multiply total minutes per week of vigorous
activities by 7.5- Multiply total minutes per week of moderate
activities by 3.0- Add the two values to determine the total
MET minutes per weekRespondent is considered at risk for physical inactivity if NONE of the following are met:• Total minutes per week of vigorous activities < 60• Total minutes per week of moderate activities <150• Total combined MET minutes per week < 450 (optional)A similar approach is taken by the CDC in their recommendation that people achieve a minimum of 150 moderate minute equivalents.59
At Risk Definitions: Low Risk: See above per method chosenAt Risk: See above per method chosen
11. Tobacco Use (all types)60,61,62,63,64 Method: Self-report (consider validation by biochemical testing)
Suggested Item:Do you currently use any of the following tobacco products? 1. Cigarettes
[Daily; Some days; Not any more; Never used] 2. Cigars
[Daily; Some days; Not any more; Never used] 3. Pipes
[Daily; Some days; Not any more; Never used] 4. Smokeless tobacco
[Daily; Some days; Not any more; Never used]
Notes: Consider at risk if any current use of tobacco.Reasonable variant ways of asking about current tobacco use are acceptable.Survey items must determine whether the participant currently smokes cigarettes. NCQA recommends using validated survey items. To ensure the comparability of populations identified as current cigarette smokers, the survey items used must be able to:
• Identify smokers who smoke cigarettes under certain circumstances (e.g., social occasions) and who may not consider themselves as “smokers.” For example, avoid asking only, “Are you a cigarette smoker?”
• Not identify individuals who have tried cigarettes (e.g., one cigarette, one “puff”) but would not be considered smokers. For example, avoid asking only, “Have you ever smoked cigarettes?”
• Differentiate between cigarette smoking and other types of smoking such as a pipe or cigar. For example, avoid asking only, “Are you a smoker?”
Since any use of tobacco is considered to put an individual at increased risk, additional items beyond current use such as amount used or pattern of use are desirable but optional. If the individual has quit tobacco use, the time since quit should also be assessed because it is required for NCQA accreditation.
At Risk Definitions:Low Risk: No tobacco useAt Risk: Any tobacco use
12. Alcohol Use (Total Amount/Risky Drinking)65,66,67,68,69
Method:Self-report
Suggested Items:Total Amount:How many drinks of alcoholic beverages do you have in a typical week? (one drink = one beer, glass of wine, shot of liquor or mixed drink)
{enter value}
At Risk Definitions:Low Risk: Males <= 14 drinks/week;
Females <= 7 drinks/weekAt Risk: Males > 14 drinks/week;
Females > 7 drinks/week
Risky Drinking:During the past year, on any single day how often have you had:For men: More than 4 standard drinks?For women: More than 3 standard drinks? Never One day 2–3 days More than 3 days
At Risk Definitions: Low Risk: NeverAt Risk: One or more days

www.hero-health.org www.populationhealthalliance.org34
Notes:Reasonable variant ways of asking for this measure are acceptable. The item(s) selected needs to be able to distinguish males who routinely consume > 2 drinks/day or > 14 drinks/week and females who routinely consume > 1 drink/day or > 7 drinks/week. These are generally considered "at risk" levels.The risky drinking item is meant to screen for excessive drinking (rather than "at risk" or "heavy" drinking for which the item above is used).
13. Fruit/Vegetable Intake70,71,72 Method: Self-report
Suggested Item:Think of the foods that are a part of your normal diet. How many servings of fruits and vegetables do you eat in a normal day? One serving = ½ cup fresh, chopped, cooked or canned vegetables; 1 cup leafy greens; medium piece of fruit or ¾ cup juice.Less than one serving1 serving2 servings3 servings4 servings5 or more servings
Notes:Consider at risk if fewer than 5 servings of fruits/ vegetables.Reasonable variant ways of asking for these measures are acceptable, as is asking for fruit and vegetable servings separately.Most supporting literature suggests combining fruits and vegetables into one item; however, to relate to Surgeon General targets, it is necessary to ask about each separately.
At Risk Definitions: Low Risk: 5 or more servings/dayAt Risk: < 5 servings/day
14. Sleep (Typical hours/night)73,74
Method: Self-report
Suggested Item:How many hours of sleep do you usually get at night?6 hours or less7 hours8 hours9 hours or more
Notes:Reasonable variant ways of asking for this measure are acceptable as are expanded answer options. At risk is defined as less than 8 hours for those aged 18 to 21 years and less than 7 hours for those aged 22 years and older, on average, during a 24-hour period.
At Risk Definitions:Low Risk: 7–8 hoursAt Risk: < 7 hours or > 8 hours
15. Daytime Sleepiness75
Method:Self-report
Suggested Item:In the past 7 days, how often have you felt sleepy during the daytime?AlwaysUsuallySometimesRarelyNever
Notes:Because individual sleep needs vary and because actual hours and restfulness of sleep are different issues, it is recommended that some measure of daytime (waking hours) sleepiness/fatigue is assessed.There is no consensus on a single item to assess this measure. Best available scale is probably the Epworth Sleepiness Scale but it is proprietary.Reasonable variant ways of asking for these measures are acceptable. Consider at risk if individual reports being tired/ sleepy more than occasionally during their waking hours.
At Risk Definitions:Low Risk: Rarely or NeverAt Risk: Sometimes (Moderate Risk); Usually or Always (High Risk)
16. Safety Restraint Use76,77
Method: Self-report
Suggested Item:How often do you buckle your seat belt when driving or riding in a motor vehicle?AlwaysAlmost alwaysSometimesSeldomNever

www.hero-health.org www.populationhealthalliance.org35
Notes:Reasonable variant ways of asking for this measure are acceptable. Consider at risk if individual does not always use a seat belt when driving or riding in a motor vehicle.
At Risk Definitions:Low Risk: Always or Almost alwaysAt Risk: Sometimes (Moderate Risk); Seldom or Never (High Risk)
17. Drinking/Driving:Method: Self-report
Suggested Item:Do you ever drive after drinking, or ride with a driver who has been drinking?{Yes/No}
Notes: Reasonable variant ways of asking for this measure are acceptable.
At Risk Definitions:Low Risk: NoAt Risk: Yes
18. Health Screenings According to Recommended Schedule (Blood Pressure; Glucose/A1c; Cholesterol; Colorectal, Cervical, Breast Cancer; and Tuberculosis for selected work settings)78
Method:Self-report; May augment with claims if available.
Suggested Items:How long has it been since you last had your blood cholesterol checked?Less than one year1–2 years ago3–5 years agoMore than 5 years agoNeverDon’t know
Notes:Reasonable variants are acceptable. The item should be able to distinguish between those who meet current screening recommendations and those who do not. The stem and answer options will differ based on the screening. Item should ask for date of last screening or if screening has occurred within recommended time frame.
At Risk Definitions: Low Risk: See National GuidelinesAt Risk: See National Guidelines
19. Immunization Status79
Method:Self-report; May augment with claims if available.
Suggested Items:Have you been immunized or received a shot for:Flu (in the most recent flu season) Yes/NoTetanus/Diptheria booster in the last 10 years Yes/No
Notes:Reasonable variant ways of asking for this measure are acceptable. With regard to flu in particular, it may also be desirable to capture information about the timing of flu immunization since getting a flu shot prior to the onset of flu season is the most effective way to prevent influenza.Depending on the demographics and job types of the population being surveyed, other immunizations might be considered for inclusion such as:Pneumonia—for populations aged 65 or older; Varicella/Zoster (Chickenpox)—for populations aged 60 or older; or Tuberculosis—for populations working in healthcare settings.
At Risk Definitions:Low Risk: YesAt Risk: No
DIMENSION 4: HEALTH STATUS
20. Perceived Health Status80,81,82 Method: Self-report
Suggested Item:In general, would you say your health is:ExcellentVery goodGoodFairPoor
Notes:Perceived health status has been correlated with health status and annual health care costs.This is a seminal, well-documented item, related both to health and costs.
At Risk Definitions:Not at Risk: Excellent, Very GoodAt Risk, Moderate: GoodAt Risk, High: Fair, Poor

www.hero-health.org www.populationhealthalliance.org36
21. Healthy Days—PhysicalMethod:Self-report
Suggested Item:Now thinking about your physical health, which includes physical illness and injury, for how many days during the past 30 days was your physical health not good?
{Answer options: 0–30}
Notes:Widely used measure from the CDC. There is also an index developed by the CDC that requires an additional item: During the past 30 days, for about how many days did poor physical or mental health keep you from doing your usual activities, such as self-care, work, or recreation? Employers wishing to use this index will need to add this item, but it is not necessary to demonstrate health impact.
22. Healthy Days—MentalMethod: Self-report
Suggested Item:Now thinking about your mental health, for how many days during the past 30 days was your mental health not good?
{Answer options: 0–30}
Notes:See note for Healthy Days—Physical.
Note: One area considered but not included in the basic measurement set were measures of function such as those provided by the SF-12 (Role mental/emotional function and role physical function). These are excellent measures to include, but they require the use of a proprietary tool and also increase the length of the survey beyond the limits we were trying to achieve. In addition, these measures are less commonly used by employers.
DIMENSION 5: SUMMARY HEALTH MEASURES83,84
The following indices are recommended for evaluating the impact of an EHM on the health of the population.
Overall Risk Reduction; Maintenance of Low Risk Status; and Net Risk Reduction
Overall Risk Reduction can be used to describe the overall change in the number of elevated health risks in a population over time. This metric can be based on whatever total number of risks that an employer deems important, but
a standard set of 10 is recommended as a minimum. This will allow comparisons across wellness programs. Each risk factor is assigned a risk status based on national guidelines, where available, or expert opinion, where not. There are 4 medical risks: BMI; Cholesterol (at risk if TC, HDL or LDL is at risk); Blood Glucose; and Blood Pressure (at risk if either systolic or diastolic blood pressure is at risk). There are also 6 lifestyle risks: Tobacco Use (any = at risk); Alcohol Use; Physical Activity; Fruit/Vegetable Intake; Stress; and Seat Belt Use. At risk definitions are given in the previous sections. Overall risk reduction then becomes the change in the total number of elevated risk factors (out of 10 possible) between two time periods.
It is also possible to assign risk status levels (low, medium, high) based on the total number of elevated risks. The definitions for risk status may depend on the risk set considered; however, as a general rule of thumb, people with 0 or 1 risk may be assigned low risk status, while those with 5 or more risks would be high risk. By doing this it is possible to focus on the percent of individuals maintaining low risk status in your population. Maintaining low risk status has been shown to be important for controlling healthcare and productivity costs.85
Finally, it is well-known that people move in both directions with regard to health risk; therefore, an even better indicator of the impact of an EHM program on health risks is net risk reduction. This is defined as the total number of risks in the population that decreased minus the total number of risks that increased.Individual Risk Reduction:The same approach can be used to create indices to determine value for reducing specific risk factors. Using BMI risk status as an example, the following three metrics could be reported:
(1) the change in the total number of people at risk for obesity (BMI >= 30) over time (e.g. obesity decreased by x% in the population over a specific time period);
(2) the net change in BMI risk in the population (total number improving BMI risk status—total number increasing BMI risk status) was x% in the population over a specific time period; and
(3) x% of the population maintained their low risk status with regard to BMI over a specific time period.

www.hero-health.org www.populationhealthalliance.org37
CHAPTER 3 FOOTNOTESa As the field of EHM matures, additional measures will be considered. Emerging studies point to well-being metrics as important determinants of health outcomes and healthcare / productivity costs. Well-being metrics include the measurement of several interrelated elements such as sense of purpose, social relationships, financial security, relationship to community and physical health. Research from Gallup and Healthways shows that high well-being individuals cost less and perform better than others.b Employers may want to verify new compliance rules and guidelines around outcomes based incentives.
CHAPTER 3 REFERENCES1 O’Donnell MP. The face of wellness: Aspirational vision of health, renewing health behavior change process and balanced portfolio approach to planning change strategies. The Art of Health Promotion 2008 (November/December): 1–12.2 Burton, J. WHO healthy workplace framework and model: Background and supporting literature and practices. http://www.who.int/occupational_health/healthy_workplace_framework.pdf3 Pronk N. Worksite health promotion: A global approach. ACSM Health and Fitness Journal; 2011, 15:48–50.4 Bourgeois FT, Porter SC , Valim C, Jackson T, Cook EF, Mandl KD. The Value of Patient Self-report for Disease Surveillance. Journal of the American Medical Informatics Association; 2007; 14:765–771.5 Noyce et al. Uncommon knowledge: The value of health assessment data. http://www.shrm.org/hrdisciplines/benefits/articles/pages/assessmentdata.aspx6 Donaldson SI and Grant-Vallone EJ. Understanding self-report bias in organizational behavior research. Journal of Business and Psychology; 2002; 17:245–260.7 Edington DW. Zero Trends:Health as a Serious Economic Strategy. Health Management Research Center, University of Michigan, 2009.8 Goetzel RZ, Anderson DR, Whitmer RW, Ozminkowski RJ, Dunn RL, Wasserman J, The Health Enhancement Research Organization (HERO) Research Committee. The Relationship Between Modifiable Health Risks and Health Care Expenditures: An Analysis of the Multi-Employer HERO Health Risk and Cost Database. Journal of Occupational & Environmental Medicine; 1998; 40:843–854.9 Goetzel RZ, Pei X, Tabrizi MJ, Henke RM, Kowlessar M, Nelson CF, and Metz RD. Ten modifiable health risk factors are linked to more than one-fifth of employer-employee health care spending. Health Affairs; 2012; 31(11):2474–2484.10 Kowlessar NM, Goetzel RZ, Carls GS, Tabrizi MJ, and Guindon A. The Relationship Between 11 Health Risks and Medical and Productivity Costs for a Large Employer. Journal of Occupational & Environmental Medicine; 2011; 53:468–477.11 Prochaska JO, Norcross JC and DiClemente CC. Changing for Good. Avon Books: New York, 1994.12 CDC. Behavioral Risk Factor Surveillance System. http://www.cdc.gov/brfss/13 Edington DW. Zero Trends:Health as a Serious Economic Strategy. Health Management Research Center, University of Michigan, 2009.14 Goetzel RZ, Pei X, Tabrizi MJ, Henke RM, Kowlessar M, Nelson CF, and Metz RD. Ten modifiable health risk factors are linked to more than one-fifth of employer-employee health care spending. Health Affairs; 2012; 31(11):2474–2484.15 Goetzel, RZ; Staley, P; Ogden, L; Stange, P; Fox, J; Spangler, J; Tabrizi, M; Beckowski, M; Kowlessar, N; Glasgow ,RE, Taylor, MV. A framework for patient-centered health risk assessments—providing health promotion and disease prevention services to Medicare beneficiaries. Atlanta, GA: US Department of Health and Human Services, Centers for Disease Control and Prevention, 2011. Available at: http://www.cdc.gov/policy/opth/hra/.16 Healthy People 2020. http://www.healthypeople.gov/2020/default.aspx17 National Institutes of Health. Clinical Guidelines on the Identification, Evaluation, and Treatment of Overweight and Obesity in Adults: The Evidence Report. NIH Publication No. 98–4083, September 1998.18 CDC. Behavioral Risk Factor Surveillance System. http://www.cdc.gov/brfss/19 Chobanian AV, Bakris GL, Black HR, Cushman WC, Green LA, Izzo JL, Jr, Jones DW, Materson BJ, Oparil S, Wright JT, Jr, Roccella EJ, and the National High Blood Pressure Education Program Coordinating Committee. Seventh Report of the Joint National Committee on Prevention, Detection, Evaluation, and Treatment of High Blood Pressure. Hypertension. 2003;42:1206–1252.20 Edington DW. Zero Trends:Health as a Serious Economic Strategy. Health Management Research Center, University of Michigan, 2009.
21 Goetzel RZ, Pei X, Tabrizi MJ, Henke RM, Kowlessar M, Nelson CF, and Metz RD. Ten modifiable health risk factors are linked to more than one-fifth of employer-employee health care spending. Health Affairs; 2012; 31(11):2474–2484.22 Goetzel, RZ; Staley, P; Ogden, L; Stange, P; Fox, J; Spangler, J; Tabrizi, M; Beckowski, M; Kowlessar, N; Glasgow ,RE, Taylor, MV. A framework for patient-centered health risk assessments – providing health promotion and disease prevention services to Medicare beneficiaries. Atlanta, GA: US Department of Health and Human Services, Centers for Disease Control and Prevention, 2011. Available at: http://www.cdc.gov/policy/opth/hra/23 Healthy People 2020. http://www.healthypeople.gov/2020/default.aspx24 CDC. Behavioral Risk Factor Surveillance System. http://www.cdc.gov/brfss/25 Edington DW. Zero Trends:Health as a Serious Economic Strategy. Health Management Research Center, University of Michigan, 2009.26 Healthy People 2020. http://www.healthypeople.gov/2020/default.aspx27 Goetzel RZ, Pei X, Tabrizi MJ, Henke RM, Kowlessar M, Nelson CF, and Metz RD. Ten modifiable health risk factors are linked to more than one-fifth of employer-employee health care spending. Health Affairs; 2012; 31(11):2474–2484.28 Goetzel, RZ; Staley, P; Ogden, L; Stange, P; Fox, J; Spangler, J; Tabrizi, M; Beckowski, M; Kowlessar, N; Glasgow ,RE, Taylor, MV. A framework for patient-centered health risk assessments – providing health promotion and disease prevention services to Medicare beneficiaries. Atlanta, GA: US Department of Health and Human Services, Centers for Disease Control and Prevention, 2011. Available at: http://www.cdc.gov/policy/opth/hra/29 National Institutes of Health. Third Report of the National Cholesterol Education Program (NCEP) Expert Panel on Detection, Evaluation, and Treatment of High Blood Cholesterol in Adults (Adult Treatment Panel III): Final Report. NIH Publication No. 02–5215, September 2002.30 American Diabetes Association. Standards of Medical Care in Diabetes–2013. Diabetes Care, Volume 36, Supplement 1, January 2012 S11–S66.31 CDC. Behavioral Risk Factor Surveillance System. http://www.cdc.gov/brfss/32 Goetzel RZ, Pei X, Tabrizi MJ, Henke RM, Kowlessar M, Nelson CF, and Metz RD. Ten modifiable health risk factors are linked to more than one-fifth of employer-employee health care spending. Health Affairs; 2012; 31(11):2474–2484.33 Goetzel, RZ; Staley, P; Ogden, L; Stange, P; Fox, J; Spangler, J; Tabrizi, M; Beckowski, M; Kowlessar, N; Glasgow ,RE, Taylor, MV. A framework for patient-centered health risk assessments—providing health promotion and disease prevention services to Medicare beneficiaries. Atlanta, GA: US Department of Health and Human Services, Centers for Disease Control and Prevention, 2011. Available at: http://www.cdc.gov/policy/opth/hra/.34 Healthy People 2020. http://www.healthypeople.gov/2020/default.aspx35 American Diabetes Association. Standards of Medical Care in Diabetes–2013. Diabetes Care, Volume 36, Supplement 1, January 2013 S11–S66.36 CDC. Behavioral Risk Factor Surveillance System. http://www.cdc.gov/brfss/37 Goetzel, RZ; Staley, P; Ogden, L; Stange, P; Fox, J; Spangler, J; Tabrizi, M; Beckowski, M; Kowlessar, N; Glasgow ,RE, Taylor, MV. A framework for patient-centered health risk assessments – providing health promotion and disease prevention services to Medicare beneficiaries. Atlanta, GA: US Department of Health and Human Services, Centers for Disease Control and Prevention, 2011. Available at: http://www.cdc.gov/policy/opth/hra/.38 Healthy People 2020. http://www.healthypeople.gov/2020/default.aspx39 Edington DW. Zero Trends:Health as a Serious Economic Strategy. Health Management Research Center, University of Michigan, 2009. {heart disease; cancer; diabetes; stroke}40 Goetzel, RZ; Staley, P; Ogden, L; Stange, P; Fox, J; Spangler, J; Tabrizi, M; Beckowski, M; Kowlessar, N; Glasgow ,RE, Taylor, MV. A framework for patient-centered health risk assessments – providing health promotion and disease prevention services to Medicare beneficiaries. Atlanta, GA: US Department of Health and Human Services, Centers for Disease Control and Prevention, 2011. Available at: http://www.cdc.gov/policy/opth/hra/.41 American Psychological Association. Stress in America Findings. November, 2010.42 Dimsdale JE. Psychological stress and cardiovascular disease. J Am Coll Cardiol, 2008, 51:1237–1246.43 Figueredo VM. The time has come for physicians to take notice: The impact of psychosocial stressors on the heart. The American Journal of Medicine, 2009, 122:704–712.44 Gallo LC, Shivpuri S, de los Monteros, KE, & Mills PJ. Domains of chronic stress, lifestyle factors, and allostatic load in middle-aged, Mexican-American women. Ann Behav Med, 2011, 41:21–31.

www.hero-health.org www.populationhealthalliance.org38
45 Goetzel RZ, Pei X, Tabrizi MJ, Henke RM, Kowlessar M, Nelson CF, and Metz RD. Ten modifiable health risk factors are linked to more than one-fifth of employer-employee health care spending. Health Affairs; 2012; 31(11):2474–2484.46 Goetzel, RZ; Staley, P; Ogden, L; Stange, P; Fox, J; Spangler, J; Tabrizi, M; Beckowski, M; Kowlessar, N; Glasgow ,RE, Taylor, MV. A framework for patient-centered health risk assessments—providing health promotion and disease prevention services to Medicare beneficiaries. Atlanta, GA: US Department of Health and Human Services, Centers for Disease Control and Prevention, 2011. Available at: http://www.cdc.gov/policy/opth/hra/.47 Goetzel RZ, Pei X, Tabrizi MJ, Henke RM, Kowlessar M, Nelson CF, and Metz RD. Ten modifiable health risk factors are linked to more than one-fifth of employer-employee health care spending. Health Affairs; 2012; 31(11):2474–2484.48 Goetzel, RZ; Staley, P; Ogden, L; Stange, P; Fox, J; Spangler, J; Tabrizi, M; Beckowski, M; Kowlessar, N; Glasgow ,RE, Taylor, MV. A framework for patient-centered health risk assessments – providing health promotion and disease prevention services to Medicare beneficiaries. Atlanta, GA: US Department of Health and Human Services, Centers for Disease Control and Prevention, 2011. Available at: http://www.cdc.gov/policy/opth/hra/49 Kroenke K, Spitzer RL, Williams, JBW, and Lowe, B. An Ultra-Brief Screening Scale for Anxiety and Depression: The PHQ–4. Psychosomatics 2009; 50:613–621.50 Goetzel, RZ; Staley, P; Ogden, L; Stange, P; Fox, J; Spangler, J; Tabrizi, M; Beckowski, M; Kowlessar, N; Glasgow ,RE, Taylor, MV. A framework for patient-centered health risk assessments – providing health promotion and disease prevention services to Medicare beneficiaries. Atlanta, GA: US Department of Health and Human Services, Centers for Disease Control and Prevention, 2011. Available at: http://www.cdc.gov/policy/opth/hra/.51 Kroenke K, Spitzer RL, Williams, JBW, and Lowe, B. An Ultra-Brief Screening Scale for Anxiety and Depression: The PHQ–4. Psychosomatics 2009; 50:613–621.52 Edington DW. Zero Trends:Health as a Serious Economic Strategy. Health Management Research Center, University of Michigan, 2009.53 Edington DW. Zero Trends:Health as a Serious Economic Strategy. Health Management Research Center, University of Michigan, 2009.54 Goetzel RZ, Pei X, Tabrizi MJ, Henke RM, Kowlessar M, Nelson CF, and Metz RD. Ten modifiable health risk factors are linked to more than one-fifth of employer-employee health care spending. Health Affairs; 2012; 31(11):2474–2484.55 Goetzel, RZ; Staley, P; Ogden, L; Stange, P; Fox, J; Spangler, J; Tabrizi, M; Beckowski, M; Kowlessar, N; Glasgow ,RE, Taylor, MV. A framework for patient-centered health risk assessments – providing health promotion and disease prevention services to Medicare beneficiaries. Atlanta, GA: US Department of Health and Human Services, Centers for Disease Control and Prevention, 2011. Available at: http://www.cdc.gov/policy/opth/hra/.56 Haskell WL, et al. Physical activity and public health: Updated recommendation for adults from the American College of Sports Medicine and the American Heart Association. Med. Sci. Sports Exerc., Vol. 39, No. 8, pp. 1423–1434.57 Healthy People 2020. http://www.healthypeople.gov/2020/default.aspx58 Nelson ME, et al. Physical activity and public health in older adults: Recommendation from the American College of Sports Medicine and the American Heart Association. Med. Sci. Sports Exerc., Vol. 39, No. 8, pp. 1435–1445.59 Centers for Disease Control. How much physical activity do adults need? http://www.cdc.gov/physicalactivity/everyone/guidelines/adults.html Accessed: 08/19/2013.60 Edington DW. Zero Trends:Health as a Serious Economic Strategy. Health Management Research Center, University of Michigan, 2009.61 Goetzel RZ, Pei X, Tabrizi MJ, Henke RM, Kowlessar M, Nelson CF, and Metz RD. Ten modifiable health risk factors are linked to more than one-fifth of employer-employee health care spending. Health Affairs; 2012; 31(11):2474–2484.62 Goetzel, RZ; Staley, P; Ogden, L; Stange, P; Fox, J; Spangler, J; Tabrizi, M; Beckowski, M; Kowlessar, N; Glasgow ,RE, Taylor, MV. A framework for patient-centered health risk assessments – providing health promotion and disease prevention services to Medicare beneficiaries. Atlanta, GA: US Department of Health and Human Services, Centers for Disease Control and Prevention, 2011. Available at: http://www.cdc.gov/policy/opth/hra/.
63 Healthy People 2020. http://www.healthypeople.gov/2020/default.aspx64 U.S. Department of Health and Human Services. How Tobacco Smoke Causes Disease: The Biology and Behavioral Basis for Smoking-Attributable Disease: A Report of the Surgeon General. Atlanta, GA: U.S. Department of Health and Human Services, Centers for Disease Control and Prevention, National Center for Chronic Disease Prevention and Health Promotion, Office on Smoking and Health, 2010.65 Edington DW. Zero Trends:Health as a Serious Economic Strategy. Health Management Research Center, University of Michigan, 2009.66 Goetzel RZ, Pei X, Tabrizi MJ, Henke RM, Kowlessar M, Nelson CF, and Metz RD. Ten modifiable health risk factors are linked to more than one-fifth of employer-employee health care spending. Health Affairs; 2012; 31(11):2474–2484.67 Goetzel, RZ; Staley, P; Ogden, L; Stange, P; Fox, J; Spangler, J; Tabrizi, M; Beckowski, M; Kowlessar, N; Glasgow ,RE, Taylor, MV. A framework for patient-centered health risk assessments—providing health promotion and disease prevention services to Medicare beneficiaries. Atlanta, GA: US Department of Health and Human Services, Centers for Disease Control and Prevention, 2011. Available at: http://www.cdc.gov/policy/opth/hra/.68 Healthy People 2020. http://www.healthypeople.gov/2020/default.aspx69 National Institute on Alcohol Abuse and Alcoholism (NIAAA): http://rethinkingdrinking.niaaa.nih.gov/isyourdrinkingpatternrisky/whatsatriskorheavydrinking.asp70 Goetzel RZ, Pei X, Tabrizi MJ, Henke RM, Kowlessar M, Nelson CF, and Metz RD. Ten modifiable health risk factors are linked to more than one-fifth of employer-employee health care spending. Health Affairs; 2012; 31(11):2474–2484.71 Goetzel, RZ; Staley, P; Ogden, L; Stange, P; Fox, J; Spangler, J; Tabrizi, M; Beckowski, M; Kowlessar, N; Glasgow ,RE, Taylor, MV. A framework for patient-centered health risk assessments – providing health promotion and disease prevention services to Medicare beneficiaries. Atlanta, GA: US Department of Health and Human Services, Centers for Disease Control and Prevention, 2011. Available at: http://www.cdc.gov/policy/opth/hra/.72 Healthy People 2020. http://www.healthypeople.gov/2020/default.aspx73 Edington DW. Zero Trends:Health as a Serious Economic Strategy. Health Management Research Center, University of Michigan, 2009.74 Healthy People 2020. http://www.healthypeople.gov/2020/default.aspx75 http://www.sleepfoundation.org/article/sleep-related-problems/excessive-sleepiness-and-sleep76 Edington DW. Zero Trends:Health as a Serious Economic Strategy. Health Management Research Center, University of Michigan, 2009.77 Healthy People 2020. http://www.healthypeople.gov/2020/default.aspx78 Centers for Disease Control/USPSTF Recommendations http://www.cdc.gov/nccdphp/dnpao/hwi/resources/preventative_screening.htm79 Centers for Disease Control and Prevention. Recommended adult immunization schedule—United States, 2012. MMWR 2012;61(4). http://www.cdc.gov/vaccines/schedules/index.html80 DeSalvo et al. Healthcare expenditure prediction with a single item self-rated health measure. Med Care 2009; 47:440–447.81 Edington DW. Zero Trends:Health as a Serious Economic Strategy. Health Management Research Center, University of Michigan, 2009.82 Singh-Manoux et al. Self-rated health and mortality: Short- and long-term associations in the Whitehall II Study. Psychosomatic Medicine 2007; 69:138–143.83 Pronk NP, Lowry M, Maciosek M, Gallagher J. The association between health assessment-derived summary health scores and health care costs. Journal of Occupational and Environmental Medicine, 2011;53(8):872–878.84 Soler RE, Leeks KD, Razi S, Hopkins D, Griffith M, Aten A, Chattopadhyay SK, Smith SC, Habarta N, Goetzel RZ, Pronk NP, Richling DE, Bauer DR, Buchanan LR, Florence CS, Koonin L, MacLean D, Rosenthal A, Matson Koffman D, Grizzell JV, Walker AM, Task Force on Community Preventive Services. A systematic review of selected interventions for worksite health promotion. American Journal of Preventive Medicine 2010;38(2S):S237–S26285 Edington DW. Zero Trends:Health as a Serious Economic Strategy. Health Management Research Center, University of Michigan, 2009.

www.hero-health.org www.populationhealthalliance.org39
CHAPTER 4: PARTICIPATION
Robert Palmer, PhD, MSN, RN, and Prashant Srivastava
INTRODUCTION
The primary objective is to recommend standard participation measures specifically related to the health support industry. It is not the intent of this initiative to establish concrete standards by which a threshold can be used to distinguish what can be defined as participation, but the goal is to provide a guideline by which contact with and participation by health support participants can be assessed.
Given the broad and diverse nature of health support programs which include multiple types of programs (condition management, lifestyle/wellness, coaching, case management, decision-support, etc.) and modalities (phone, online, in-person, video, devices, etc.), the scope was limited to select condition management and lifestyle/wellness programs. These programs included cardiac, respiratory, depression, and diabetes condition management programs. Additionally, lifestyle/wellness programs such as weight management, smoking cessation, nutrition, and physical activity were also included. There was no limitation placed on the modality.
Measure Selection Criteria/Approach
General measure selection criteria for participation included:
• potential for broad acceptance of the measure(s),• usefulness of the measure(s) to employers,• feasibility to implement the measure(s), and• ability to compare the measure(s) across vendors.
In addition to these criteria, the importance of the outcome of the intervention was stressed as a key expectation of employers.
The approach for measure selection was weighted toward defining a participation measure that resulted in a healthy outcome. Given the purpose of setting guides, the approach was not to be prescriptive, but educate where participation thresholds have been observed in literature with established healthy outcomes. Through the experience of this process, it was discovered that one key differentiator with regard to participation needs to be established. That is, participation may be defined using contacts, but contacts and participation are separate and distinct. For example, a single contact such as completion of an HRA (Health Risk Assessment) could be considered participation in the HRA, but most would
not consider a single contact for enrollment as on-going condition management program participation without some evidence of an assessment and a two-way exchange.
Literature Review Conclusion
Establishing general guidelines to support defining participation proved to be a challenging task. Despite limiting the scope to select condition management and lifestyle/wellness programs, the literature contained large variations in the number and type of contact for participants and their associated outcomes. Some studies looked at a single contact, while others looked at 10 or more. Additionally some studies looked at single modalities while others combined them without making discriminations between modalities used. Therefore, even if being non-prescriptive, there are too many variables to recommend a specific threshold, or even range, for the amount of contact for participation. This conclusion guided the approach to the recommendation.
RECOMMENDED MEASURES
Recommendation Approach
In order to establish a guide, the approach taken is to recommend a range of participation measures based upon general themes we observed in the literature. As stated, there were not themes associated with specific outcomes and/or programs, but there were themes across the modalities. These themes would seem to follow what could intrinsically be concluded. In-person contact was associated with the fewest number of contacts for an outcome, while on-line contact was associated with the most number of contacts for an outcome.
Participation Measure Context
For any participation measure, the context with regard to program model and modality should be clearly communicated. These two attributes would include:
• Opt-in or Opt-out• Channels/modalities available to members
We do not recommend a format, but provide Table 3 as an example simply to communicate this information.

www.hero-health.org www.populationhealthalliance.org40
Participation Measurement and Cascade
It is recommended that a participation measure include a cascade that follows a waterfall from the total identified, which is program-specific, to the number and percentage of participants. The components of this cascade are:
• Identification- Identification definition (i.e., identified = any
member with a program-related code, Identified = any member with a program-related code AND a valid phone number, etc.)
- Source of identification (i.e., administrative claims, self-referral, referral, etc.)
• Number of members identified for the program• Of those identified, number and % selected for
contact• Of those identified, number of successful contacts
by channel/modality and overall• Of those identified, number of participants
by channel/modality and overall• Definition of a participant or participation
In defining participation, a categorical reporting structure using ranges is recommended rather than having a prescriptive minimum number of contacts. This recommendation is based upon observations from the
literature with regard to the number of contacts that are associated with a positive health outcome. It is also important to note that some programs require the completion of a one-time activity for participation, such as an HRA or a decision-support program. As stated previously, specific on-going or time-based programs varied on the amount of contact for participants, but themes were present with regard to the channel/modality. Displaying a categorical range allows employers to interpret and understand the continuum of what could be defined as participation within their population. Table 4 lists the recommended contact categories based upon channel/modality.
CHANNEL/MODALITY
PROGRAM Opt-In Mail/Paper Telephone Web Based In-Person Phone AppOther
(Specify)
HRA Y Y N Y
DiabetesDiseaseManagement
Y Y Y
Weight Management Y N Y Y Y
PROGRAMMEANS OF
IDENTIFICATIONIDENTIFIED
SELECTED FOR CONTACT (AS % OF IDENTIFIED)
CHANNELSUCCESSFUL
CONTACTS (AS % OF IDENTIFIED)
PARTICIPANTS (AS % OF
IDENTIFIED)
HRA Eligibility 3234 3234 (100%) Paper NA 308 (9.5%)
Electronic NA 2012 (62.2%)
Total NA 2320 (71.7%)
CHANNEL/MODALITYCONTACT CATEGORIES FOR REPORTING PARTICIPATION
Telephonic• 1–2 contacts• 3–4 contacts• 5+ contacts
Web-based• 1–5 contacts• 6–10 contacts• 11+ contacts
In-person• 1 contact• 2 contacts• 3+ contacts
Table 3: Example Reporting Chart
Table 5: Example Reporting Chart—HRA
Table 4: Recommended Contact Categories for Participation
A specific format is not recommended, but examples can be seen in Tables 5–7.

www.hero-health.org www.populationhealthalliance.org41
PROGRAMMEANS OF
IDENTIFICATIONIDENTIFIED
SELECTED FOR CONTACT (AS % OF IDENTIFIED)
CHANNEL
SUCCESSFUL CONTACTS
(AS % OF IDENTIFIED)
CONTACT CATEGORIES
PARTICIPANTS (AS % OF
IDENTIFIED)
Diabetes Claims, HRA 589 350 (58.6%) Mail 350 (58.6%) NA 0
Telephone 237 (40%) 1–2 contacts 150 (25.5%)
3–4 contacts 50 (8.5%)
5+ contacts 37 (6.3%)
Total 350 NA 237 (40%)
PROGRAMMEANS OF
IDENTIFICATIONIDENTIFIED
SELECTED FOR CONTACT (AS % OF IDENTIFIED)
CHANNEL
SUCCESSFUL CONTACTS
(AS % OF IDENTIFIED)
CONTACT CATEGORIES
PARTICIPANTS (AS % OF
IDENTIFIED)
WeightManagement
HRA 902 902 (100%) Mail 902 (100%) NA 0
Online Coaching
400 (44.3%) 1–5 contacts 200 (22.2%)
6–10 contacts 150 (16.7%)
11+ contacts 50 (5.5%)
Total 902 NA 400 (44.3%)
Other Pertinent Measure Definitions
1. Program: Any intervention or set of interventions delivered with the goal of improving health of a population. Examples include (but are not limited to) Health Risk Appraisals, Biometrics, Condition Management, Weight Management, and Smoking Cessation.
2. Channel: The mode of delivery employed by the pro gram. Common modes include (but are not limited to) telephonic, web-based, and in-person delivery.
3. Members Identified: Includes all unique individuals who qualify for participation in the program. Qualification can be as a result of being eligible, or due to having a certain threshold (such as BMI, Stress Level, etc.) or having a medical condition (such as diabetes, Asthma, etc.).
4. Means of Identification: Includes all means utilized to identify those individuals that qualify for a program including (but not limited to) claims data, laboratory or biometrics data, and self-reported data such as Health Risk Appraisals.
5. Members Selected for Contact: Includes all unique individuals who have been identified and further selected to be enrolled in the program. This metric is included to acknowledge risk based stratification methodologies used in the industry to focus resources
upon engaging a smaller subset of individuals compared to those identified.
6. Successful Contacts: Includes all unique individuals who received information/materials to aid in behavior change/self-management. For opt-in programs, this number represents those that signed up/downloaded an app, and does not include those who received promotional materials or enrollment outreach for a program.
SUGGESTED ADDITIONAL RESEARCH
Even with the increased focus on participation and how to define participants in the market, there was little consistent literature on the variation of the amount of intervention and contact for those in a health support program. Employers can be appreciative of effort, but ultimately, the desire is for that effort to result in a positive health outcome. It is recommended that more research be done to focus on the amount of intervention necessary to produce a positive health outcome. This includes studies on the effectiveness and quality of contacts across channels/modalities, comparisons between channels/modalities whether they are single or mixed models, and determining if there is a dose-response relationship with regard to the number of contacts.
Table 7: Example Reporting Chart—Weight Management Online Coaching
Table 6: Example Reporting Chart—Diabetes Condition Management

www.hero-health.org www.populationhealthalliance.org42
INTRODUCTION
In this section, HERO and PHA propose: 1) satisfaction outcome measurements that can be used industry wide and will drive consistency in reporting and accelerate the creation of industry knowledge, and 2) appropriate research methods to collect these measures so that they can be reported consistently and transparently for appropriate and relevant comparisons.
Stakeholder Benefit
Relevant and readily available comparisons of EHM program satisfaction will advance all stakeholders’ interests. Employer purchasers of EHM services can compare their own program’s satisfaction performance with that of the industry; they can also benchmark companies competing for their EHM business, and set appropriate goals for program satisfaction performance. Benefits consultants who assist purchasers in choosing EHM vendors will have more reliable comparative data for vendor selection as well as for negotiating satisfaction performance standards. Accrediting bodies will have clearer standards by which to evaluate vendor compliancy, and can serve as industry ‘clearinghouses’ for aggregated satisfaction results. EHM service providers keen to become market leaders will have invaluable market intelligence for gauging their satisfaction performance relative to competitors. Although not direct consumers of satisfaction benchmarks, the EHM participants themselves will benefit from industry competition that strives to create ever better member/user experience.
Total Agreement or Conceptual Alignment?
Total agreement among all stakeholders on the specific satisfaction measures, methods and metrics standards is not realistic and, indeed, not necessary. Many of the benefits and advantages we seek can be obtained through conceptual alignment. There is so much variation in what is done now across satisfaction measures, methods and metrics that aligning at the conceptual level will drive marked improvement in our ability to later achieve the benefits cited above. Starting this evolutionary process towards a more uniform and valuable approach is what is needed
today. We see this work as the first step in that process. Although just the first step, it is imperative that stakeholders adopt recommended standards early. Failure to achieve widespread adoption will result in an inability to evolve standards through empirically validated quality improvement efforts. (Some of the many stakeholder benefits of adoption are delineated under Stakeholder Benefit.)
Scope
The satisfaction areas to be addressed are Client and Participant.a 'Client' generally refers to the purchaser or cost-bearing entity for the EHM program. 'Participant' has several synonyms depending upon EHM area (e.g., user, consumer, patient); the term Participant will apply to all of these wherever possible. Areas represent the respective target for satisfaction surveying. Domains per area are listed below in a roughly prioritized fashion, i.e., all domains listed below may be part of future standards, but those most critical for near-term adoption are ranked higher.
• Participant Satisfaction (PSAT)—below are the Domains identified within PSAT with brief thematic descriptions
a) Overall—satisfaction with the program generally as well as indicators of loyalty
b) Effectiveness—satisfaction with program's effectiveness in helping participant identify risk factors, understand them, set appropriate goals to change them, become healthier, and live better as a result
c) Scope—satisfaction with the scope of offerings (i.e., the program had what was needed to help meet member needs or expectations)
d) Convenience—satisfaction with accessibility or convenience of program components; help/resources were available when and how needed, including program staff, educational/program content, events, and tools
e) Communications—satisfaction with the relevance and understandability of program communications about program launch/enrollment, educational content, and other program components
CHAPTER 5: SATISFACTION
Adam Long, PhD, and Geoff Alexander

www.hero-health.org www.populationhealthalliance.org43
f ) Experience—satisfaction with participant experience related to delivery and deliverers of health information, customer service, and other items such as tools
g) Cost—satisfaction with the level of personal investment required, including tangible cost and time, energy, and other intangible costs
h) Benefits—satisfaction with the program's help in driving change or improvement in behavior, health, communicating with physician, and other meaningful areas
• Client Satisfaction (CSAT)—below are the Domains identified within CSAT with brief thematic descriptions
a) Overall—satisfaction with the program generally as well as indicator(s) of loyalty
b) Effectiveness—satisfaction with program's effectiveness in helping membership to identify risk factors, understand them, set appropriate goals to change them, become healthier, and live better as a result
c) Value—satisfaction with the net benefit or economic value of the program as well as, generally, whether it’s meeting expectations
d) Scope—satisfaction with the program’s breadth and depth of products and services to meet members’ needs, and vendor’s ability to tailor programming in innovative ways to meet Client needs
e) Member Experience—satisfaction with the members’ experience, including communicating how to access program components, the convenience of that access, how well program components meet members’ needs, and the Client’s own ease of program administration
f) Account Management—satisfaction with account management, including timely and satisfactory issue resolution, proactive and consultative communications, and acknowledgement of specific Client needs
g) Reporting—satisfaction with service and outcomes reporting, including comprehensiveness, timeliness, relevance and succinct summarization
Criteria and Process for Selecting Measures
Areas (Participant and Client) relevant to all EHM programs were chosen. Areas such as Provider that are not relevant to all EHM programs were excluded. Only one relevant published study could be identified,b so selecting Domains per area, as well as evaluating sub-topics per Domain, was
via review of EHM vendor surveys shared with HERO and PHA. Those included participant surveys from Onlife Health, Alere, Nurtur Health, Health Fitness, as well as surveys developed by URAC and PHA and for HEDIS Medicare for purposes similar to ours. Also included were client surveys from Redbrick Health, Nurtur Health, and Onlife Health. Unfortunately, although many other EHM vendors were solicited, only these organizations provided copies of surveys. A somewhat surprising finding was that, even among this somewhat small sampling of survey tools, there was a very wide variety of question and response sets. There also existed great variability in terminology and implicit purpose; for example, some so-called “satisfaction” assessment tools actually appeared to measure other constructs. This process thus acted to reinforce extremely well that a clear unmet need exists for satisfaction assessment standards.
Process used:
• Domains were identified and prioritized by discussion and consensus among HERO and PHA members and included brief description of the constructs.
• Published and ‘grey’ literature searches were focused on identifying anything within the PSAT and CSAT areas and identified domains.
• Existing surveys were reviewed.• Questions/items and response sets from acquired
surveys were categorized and distributed among PSAT and CSAT area by Domain.
• A master grid of survey items from vendor surveys in light of the prioritized domains per PSAT and CSAT area were reviewed to identify the themes and most relevant sub-topics.- Also resolved during this phase was to focus
work on:• Program commonalities rather than
idiosyncrasies (e.g., channels, technologies and program offerings vary widely so recommended surveys should not attempt to capture each possibility or combination thereof).
• Quantitative and not qualitative assessment because the former will be most relevant for benchmarking.
• Survey brevity rather than comprehensiveness, since survey fatigue is a real possibility and adoption of recommended measures and metrics will depend on ease of use; also, respondents are more likely to finish non-incentivized surveys if they take less than ten minutes to complete.

www.hero-health.org www.populationhealthalliance.org44
• Needing to (1) recommend surveys of sound scientific rigor, and (2) leverage existing survey content wherever possible, survey questions and appropriate response sets were drafted to assess sub-topics per Domain.
• Several rounds of review and edit of proposed survey questions and response sets were conducted, including members and SME volunteers from the HERO/PHA collaboration.
Other selection/process matters:
• Vendor adoption of both the measures and the appropriate research methods to collect these measures are the primary goals as consistency in surveys is needed to assure comparability across vendor results. Although this assures results can be benchmarked, this may not address the specific needs of vendors attempting to identify specific areas for improvement nor the success or evaluation of interventions used. Thus, although adopting survey items and response sets as recommended is very important, we also foresee the need for vendors to add qualitative and/or program-specific questions to their surveys to assure quality improvement opportunities are maximized. However, we would counsel vendors to:- Keep vendor-customized surveys as brief as possible;- Provide modest incentives to complete surveys
to assure high response rates;- Use branching logic in vendor-customized surveys
wherever possible to assure only respondents meeting particular criteria receive longer surveys;
- Offer longer surveys only to a randomized subset of survey participants.
RECOMMENDED MEASURES
• Participant Satisfaction (PSAT): Domains include overall satisfaction, program effectiveness, scope and convenience, program communications, general member experience, personal investment and benefits.- Aggregate satisfaction is a combination of all
sub-topics and Domains assessed within PSAT.- Sub-scale scores per Domain will also be measured
and benchmarked.• Client Satisfaction (CSAT): Domains include overall
satisfaction, program effectiveness, value and scope, experience of membership eligible for program, account management, and reporting.
- Aggregate satisfaction is a combination of all sub-topics and Domains assessed within CSAT.
- Sub-scale scores per Domain will also be measured and benchmarked.
MEASURE SPECIFICATIONS
• Participant Satisfaction (PSAT)- See Appendix A for the recommended PSAT
survey, including Domain and sub-topic names, survey question wording and response options.
- See Sections 2 and 4 (within this chapter) for recommended calculation methods for metrics related to overall PSAT, Domain and sub-topic.
- See Section 1 (within this chapter) for detailed description of PSAT survey’s provenance, why we believe this is the best course for standardizing PSAT measurement as well as limitations and recommended next steps, including how PSAT measurement can be improved.
• Client Satisfaction (CSAT)- See Appendix B for the recommended CSAT
survey, including Domain and sub-topic names, survey question wording and response options.
- See Sections 2 and 4 (within this chapter) for recommended calculation methods for metrics related to overall CSAT, Domain and sub-topic.
- See Section 1 (within this chapter) for detailed description of CSAT survey’s provenance, why we believe this is the best course for standardizing CSAT measurement as well as limitations and recommended next steps, including how CSAT measurement can be improved.
RECOMMENDED METHODS AND TARGETS
Sampling Methods: Random sampling of the universe (client representatives or participants) is recommended. Survey response rates should always be reported. When random sampling is used, confidence level and precision should also be reported as well.
1. Statistical tests for sample size calculation assume random sampling techniques. For example, for a universe of 1000 program participants, the researcher only needs 278 participants to take the survey to achieve 95% ± 5% confidence that the results are representative of the universe assuming the 278 were randomly sampled.c
• Most surveying conducted in the EHM space today does not use random sampling. Often, survey

www.hero-health.org www.populationhealthalliance.org45
targets are canvassed and respondent results are tallied and reported, whether response rates are 5% or 85%. High response rates help to mitigate bias associated with non-random sampling. However, as the universe shrinks, high response rates are necessary to achieve statistical representativeness, even with random sampling (e.g., 80% response rate for a universe of 100 persons is necessary to achieve 95% ± 5% confidence level even with random sampling).- This is most relevant, perhaps, when considering
that organizations where EHM services are provided vary widely (e.g., small to jumbo sized employers). However, sampling and surveying methods specified here need not shift with said circumstances.
• Telephonic surveying (via cell and land lines) by a respected and independent third-party that uses random sampling techniques, insures confidentiality/anonymity of response, and monitors closely the rate of targets who refuse to participate after learning of the purpose and source of the survey call is best for assuring high confidence in sample representativeness.
Surveying Methods
2. Achieve highest possible response rates. This is important for assuring representativeness and value of results. Offering financial incentives to improve response rates is acceptable so long as the incentive is not a biasing factor; bias can be avoided by assuring confidentiality.
3. Achieve highest possible quality and validity of responses. In addition to generating higher response rates, incentives can help assure all survey questions are answered. They cannot, however, assure the quality or validity of those responses. Taking pains to assure biasing factors are avoided while enhancing full survey completion is recommended. Debate exists as to whether respondent anonymity is required to assure valid responses, although quality answers are better assured when privacy/confidentiality is guaranteed. In the latter case, the surveying entity should have no real or perceived biasing power over the respondent. For example, an employer surveying its employees should be concerned about response quality and validity if the survey is not anonymous, even when promising confidentiality. If an EHM vendor has demonstrated responsible handling of participants’ personal health information then
it stands to reason that the vendor could achieve valid PSAT survey responses when guaranteeing confidentiality, even if anonymity is not evident in survey administration.
4. Survey Modality: Telephonic surveying by a respected and independent third-party that uses robust random sampling techniques is recommended. (See previous discussion on Sampling Methods for more on this point.)
• Paper-based surveying at the point of experience (e.g., biometric screening or health education event) is common in certain areas of EHM. These methods are often biased by social desirability pressures or even, at times, overt efforts by those who deliver the service. If used, however, the service provider should take pains to assure respondent confidentiality and solicitation should be by someone other than the service provider.
• Online surveying is attractive because it is economical. Convincing respondents that their confidentiality is assured is more difficult when survey solicitations are sent via email. Non-random sampling (i.e., some are more inclined to respond to online surveys than others) and low response rates are the most significant concerns in using online surveying. Creative solutions to assure confidentiality and drive high response rates are thus critical; claiming sampling randomness with online modality, however, is not appropriate.
5. Survey Timing: Organizations commissioning PSAT or CSAT surveying may desire ongoing satisfaction trending rather than, say, annual point-in-time results. Surveying unique individuals for CSAT or PSAT more than once or twice a year is discouraged to avoid respondent annoyance or even perceptions of harassment. That said, when the universe of possible respondents is large—or when the timing of survey triggers vary within the population—ongoing results of collected surveys is quite possible, even if respondent pre-post (panel) results are only available every six or twelve months.
• For EHM programs that have annual (re)launch campaigns, it is best to survey PSAT program performance for the program year in question prior to upcoming program year launch activities. Doing so will help avoid contaminating satisfaction results with current program year by new-year launch activities.

www.hero-health.org www.populationhealthalliance.org46
• For EHM programs of shorter duration (e.g., few weeks or up to six months), surveying following program completion—or, for participants who drop out, when the program should have completed—is recommended.- The PSAT and CSAT surveys recommended here
(see Appendices) are appropriate for infrequent assessment (e.g., once or, at most, twice per year). If vendors offer a number of short (e.g., 6-week) successive interventions then they may wish to use their own brief program-specific assessments following completion of each program. The PSAT survey recommended here would be appropriate, even in this context, for once-a-year assessment of the participant population. Efforts, however, should be made to assure that solicitations for surveys are not too frequent.
• Likewise, CSAT surveys assessing purchaser satisfaction with a particular program year should be conducted prior to planning for upcoming program year implementation. This will help avoid contaminating assessments of current program performance with perceptions of implementation work/planning for the upcoming (re)launch.
6. Use all questions and respective response options. The survey questions provided here for PSAT and CSAT should be used, wherever possible, in their entirety and with the response sets indicated. Administering questions with altered response sets will certainly bias comparability of results. Guidance provided on question ordering should be followed as much as possible (e.g., overall satisfaction at start of survey, loyalty and value at end of survey) for consistency and, therefore, comparability. As noted above, however, it is possible EHM vendors will wish to add questions or branching logic to assure results can be used more readily for quality improvement initiatives. Please consult the end of Section 1 above for guidance on such alterations.
• In the event not all items from PSAT and CSAT surveys can be feasibly administered, overall satisfaction and loyalty items will be most critical to retain for benchmarking purposes.
Performance Standards: A top box satisfaction rate in excess of 70% is an appropriate standard,d provided there are an adequate number of survey respondents (e.g., 100+). When the number of respondents is limited, an average rating equivalent to 85% of maximum is an appropriate standard (e.g., for a 6-point response scale,
an average rating of 5.1 is equivalent to 85% of maximum). These standards are subject to change as we do not yet have the large databases needed to set standards using actual benchmarked performance. Indeed, one of the benefits of this entire body of work will be the ability to set appropriately aggressive performance standards.
7. Top Box Rate Calculation: [number of responses or respondents answering with the most positive response option] / [number of responses or respondents answering said question(s)]
• The denominator should exclude missing or Don’t Know/Not Applicable kinds of responses (i.e., include only valid ratings). Note that scale mid-point (e.g., “Neither Satisfied nor Dissatisfied”) is a valid rating and, therefore, should be included in calculations.
8. Average Rating Calculation: [sum of ratings] / [count of responses with valid ratings]• Surveys with missing or Don’t Know/Not
Applicable kinds of responses should be excluded from calculation. Scale mid-point (e.g., “Neither Satisfied nor Dissatisfied”) is a valid rating and, therefore, should be included in calculations.
9. Metrics: Domain, sub-topic, and all-item aggregate Top Box Rate and Average Rating scores are appropriate for metric calculation, comparison, trending, etc.
• Domain and all-item aggregate metrics will only be comparable to external benchmarks (to be derived by an independent party like HERO and PHA) if all items within the Domain or recommended PSAT or CSAT survey are administered. As noted in calculation instructions, skipped items need not invalidate metric calculation, but failing to administer an item altogether will invalidate the reliability and validity of any benchmarking/comparison of such metrics that aggregate sets of items.
• Because not all recommended survey items are likely to be adopted by all users, sub-topic Top Box Rate and Average Rating scores are likely to serve as industry benchmarks, especially overall satisfaction and loyalty ones. Provided widespread adoption of the full surveys, and subsequent empirical research of large databases, validated (sub)scales or short versions can be recommended at a later time.

www.hero-health.org www.populationhealthalliance.org47
Suggestions For Additional Consideration
10. Third-party surveying and benchmarking organizations (e.g., Gallup, Press Ganey, WestEd, FranklinCovey) could advance the EHM industry further in the area of participant and client satisfaction. Widespread vendor adoption of PSAT and CSAT surveying through one of these organizations would standardize data collection methods thereby controlling the major source of confounding among those attempting to compare vendor performance or set performance standards.
11. One or more trusted, independent organizations need to build normative PSAT and CSAT response datasets for use in refining and validating the question sets. Research with normative data should consist of evaluations of validity (content, criterion, construct) and reliability (stability, internal consistency).1 The quicker this work commences following surveys adoption the quicker the EHM industry can achieve the objectives noted in Section 1.
CHAPTER 5 FOOTNOTESa A third area, Provider (i.e., physician, clinician), is an area evaluated by some but not all EHM vendors because not all EHM programs interact with providers. The satisfaction outcomes workgroup has elected to focus on these two areas because they are relevant to all EHM vendors.b The published study in question used a subset of participant survey data from Onlife Health: Ovbiosa-Akinbosoye, O.E. & Long, D.A. (2012). Wellness program satisfaction, sustained coaching engagement and achievement of health goals. Journal of Occupational & Environmental Medicine, 54 (5), 592-7. The full Onlife survey was one of those provided to this workgroup for deeper and broader evaluation of surveys in use today.c This also assumes equal (50/50) likelihood that the respondent will be satisfied as dissatisfied.d This recommendation comes from Ron Goetzel, Ph.D. His counsel is that top box rates should not vary excessively whether the responses are on 5- or 6-point Likert scales. Refinement of key performance indicator metrics like top box rate will take place following collection and analysis of a normative data set.
CHAPTER 5 REFERENCES1 Sitzia, J. (1999). How valid and reliable are patient satisfaction data? An analysis of 195 studies. International Journal of Quality in Health Care, 11 (4), 319-28.

www.hero-health.org www.populationhealthalliance.org48
INTRODUCTION
The primary goal was to define organizational support and recommend measures to adequately assess the degree to which an organization supports the health and well-being of its employees. In addition, the objective was to provide guidance and perspective on this evolving area of employee health management1,2,3 (EHM) as well as assemble practical recommendations for employers interested in better supporting or measuring the effectiveness of their current practices.
Definition
Industry literature focused on setting the ideal environment for positive employee health behaviors discusses the importance of culture and climate as key elements influencing employee engagement in healthy behaviors. As a maturing science, the discipline of organizational support encourages a collective belief in the connection between culture, climate, and organizational support in shaping employee health behaviors. While distinctly different, each has an important role and each influences the others.
• Culture refers to the prevailing norms, values, and beliefs inherent within each company. It has been described as “values, underlying assumptions, expectations, and definitions that members of a work organization collectively maintain and affect the way they think, feel, and behave related to matters of personal and group health.”4 A company’s culture directs how decisions are made and things get done. Organizational support is one of the dimensions of culture.
• Climate refers to the level of support provided within a specific work environment that can vary over time and across organizations within the same company. Aldana defines climate as “more sensitive to workgroup norms, and highly variable across an organization, whereas culture is more enduring and stable across the entire organization.”5 Allen defines climate in terms of the social cohesiveness that supports personal and organizational growth.6 Climate, like organizational support, is a dimension of culture.
• Organizational Support refers to the degree to which an organization commits to the health and well-being of its employees. The formal and informal programs, policies and procedures within an organization that make “the healthy choice the easy choice” are recognized as deliberate steps to which a company has committed. Success in establishing organizational support of employee health management can be measured by the company’s deliberate steps to create the conditions for healthy behaviors, as well as employees’ and managers’ perceived organizational support of employee health and well-being. Organizational support is an important dimension of organizational culture. Deliberate decisions and outwardly visible actions become part of the company norms, shared values, peer support, and the overall work climate to shape health behavior and well-being. This facilitates the company’s ability to design and implement key elements of organizational support to encourage healthy behaviors. Additionally, an employer who takes calculated actions to make a statement to employees about the importance of a healthy workforce is, in effect, influencing company culture. Employees who “feel” cultural support for taking care of themselves are more likely to feel positive about their organization, and may be more inclined to engage and utilize health resources and programs. Furthermore, when investigated, the relationship between organizational support and perceived employee culture was found to be significant by Hoebbel et al.7
Although organizational support was the focus of this effort, it is critical to understand the interdependent nature of these three distinct constructs.
Scope
As previously defined, organizational support is the degree to which an organization commits to the health and well-being of its employees. The formal and informational programs, policies and procedures within an organization that make “the healthy choice the easy and desired choice” are recognized as deliberate steps to which a company has
CHAPTER 6: ORGANIZATIONAL SUPPORT
Jennifer Flynn, MS, and Michael Brennan, MS, MBA

www.hero-health.org www.populationhealthalliance.org49
committed. Success in establishing organizational support of EHM can be measured by assessing the deliberate steps the company has taken to create the conditions for healthy behaviors, as well as employees’ and managers’ perceived organizational support (POS) of employee health and well-being.
A healthy culture incorporates management policies and practices that involve, empower, and engage the employee in decisions about their work, health and safety, and the direction of the organization. Such a work environment makes it easy, convenient, acceptable, and expected to engage in healthy behaviors. It should also be recognized that a healthy workplace culture can be influenced by what occurs inside and outside of the workplace. As outlined in the World Health Organization’s Healthy Workplace Model,8 there are four main facets that influence a workplace culture: physical work environment, personal health resources, psychosocial work environment, and enterprise community involvement. Our scope is focused on those supportive efforts that can be performed within the workplace.
Methods and criteria followed
Two methods were utilized to identify and select measures: 1) a thorough review of the published literature regarding organizational support and methods for measuring POS, and 2) interviews with employers and subject matter experts to learn about current best-practice strategies in organizational support of EHM. The criteria used to select the recommended measures included:
• Usefulness of the measure in providing organizational guidance;
• Practicality of using measures within the employer setting;
• Validity and reliability of the measure.
Based on this work, it is recommended that an employer measure both their level of organizational support and the degree to which employees, managers, and leaders perceive both that their health is a priority for the business and they are supported by their employer organization. In addition, an organization should also consider measuring the degree and relative strength of their programs, policies and procedures (deliberate steps) that support the adoption and engagement of health behaviors. To accomplish this, these measures would include the assessment of:
1. The deliberate steps (programs, policies, procedures, etc.) the employer has taken to create an environment that supports health and well-being
2. Employee perceived level of organizational support (POS)
3. Leaders/Managers perceived level of organizational support (POS)
Rationale and Assumptions
Based on current experience, it is believed that organizational support for health and well-being provided by an organization will result in greater success of an EHM program. These success measures include, but are not limited to:
• Greater program participation/engagement• Increased program satisfaction • Improved health behavior change, and maintenance
of positive health behaviors• Improved productivity and performance• Higher Return-on-Investment (ROI) of EHM programs• Higher Value-on-Investment (VOI) of EHM programs
Supporting this rationale, the correlation between POS and safety behavior has been well demonstrated through published literature.9,10,11 While this is not yet the case for EHM, it stands to reason that providing adequate programs, resources, and policies that support employee health and well-being will likely result in employees’ favorable perception regarding their employers’ support for their health and well-being.
Supporting this assumption, some employers have demonstrated that higher organizational support correlates with stronger business performance. The case studies included in Appendix C help to illustrate this relationship. Furthermore, a recent study found a strong correlation between companies offering a comprehensive health and safety program and stock market performance.12 Overall, additional research is needed in this area of EHM to fully establish the overall value of organizational support as it relates to increases in participation, satisfaction, health impact, productivity, performance, ROI, VOI, and other business performance metrics.
Elements of Organizational Support
Companies can take deliberate steps to support healthy employee behaviors. These company actions make a statement about the importance that leadership places on employee health as a way of doing business, remaining competitive, and supporting their employees. Organizational support elements vary to fit each company’s cultural norms and specific needs, and currently there is no scientific evidence to validate a specific set of organizational support

www.hero-health.org www.populationhealthalliance.org50
characteristics. However, the following elements are common among companies recognized for having successful programs:
Company-Stated Health Values: Employee health management value statements are included in the company vision/mission statement and health goals are built into the company's annual goals and objectives. Company leaders place high importance on being transparent with issues like cost sharing and linkage with healthy behaviors. The organization makes it clear to employees that it is concerned with the health of employees and that healthy behaviors are “norms” within the company culture. Mission statements include aspects of these norms and are frequently communicated at each level of an organization.
Health-Related Policies: The employer provides directives relating to healthy practice (i.e., tobacco-free workplace, safety, flex-time) and time at work devoted to accessing health resources and engaging in programs. Policies supporting the health and well-being of employees are enforced, and employees are held accountable for abiding by the policies put into place.
Supportive Environment: The physical (or “built”) environment of the workplace includes elements that encourage healthy behaviors and decisions (e.g., healthy food service offerings, a fitness center or easy access to physical activity, mothers’ rooms, quiet areas or gardens, non-sedentary furniture choices. Safety and health is a priority within the environment.
Organizational Structure: One or more persons in the organization has a dedicated EHM focus, access to high-level leadership, decision-making authority, and adequate resources to act on approved EHM goals.
Leadership Support: Leaders are expected to understand the business case for EHM, receive periodic training on EHM, communicate the value and importance within their organizations, model healthy behaviors, and recognize healthy actions and outcomes. In addition, they hold staff accountable, and emphasize EHM as a cultural norm.
Resources and Strategies: Foundational EHM services, such as health assessment, health education, lifestyle management, chronic condition management, and benefit and health consumerism education, are offered to address the pertinent health issues facing employers. Overall, the organization provides adequate budget, space and resources for EHM programs based on the organization’s needs, and allow for multi-modal methods of health interventions (e.g., phone, web, print, in-person). The organization supports managers and supervisors of individual work groups in their efforts to improve the health and well-being of their employees. Programs are well-communicated under one brand with a uniform look and feel, are well-integrated and
seamless through cross-promotion and data transfers. An effective health plan design supports health management and prevention for enrollees.
Employee Involvement: Employees are educated on healthy habits and health care realities; how cost and productivity are affected by health issues; and how their everyday health decisions have long-term personal and company impact. Employees have opportunities to provide input into program content, delivery methods, future needs, and best ways to communicate to them (i.e., wellness champion networks). Also, employees are able to provide their perception of organizational support for healthy behaviors via accepted company methods (e.g., annual employee survey, town hall meetings with leadership, custom health assessment question).
Rewards and Recognition: Positive changes/outcomes (e.g., behaviors, achievement, environmental improvement) are recognized and rewarded, calling attention to the importance of health and well-being.
Measuring Organizational Support
It is recommended that each of these eight elements be included in an assessment of the organization’s degree of support. This organizational assessment can be done in many ways. One option is for a company to conduct a self-assessment of their level of support in each of the eight areas on a scale from 1 (support not provided at all) to 5 (support is provided to the fullest extent possible). This self-assessment will allow each company to better understand where they stand on each of the eight elements and then identify any opportunity for growth in each area.
Another approach, recommended by Allen,13 is to understand primary touch points and “tip the balance” of these touch points (cultural influences) to establish new wellness norms or eliminate those that work against health and well-being. Many of these touch points, although cultural in scope of the organization, are closely aligned with the organizational support elements noted above.
Finally, a popular approach would be to utilize one of the organizational assessment tools available in the marketplace today. Such surveys are intended to measure organizational support and progress towards improving it. Below is an overview of some popular surveys:
• The CDC Worksite Health Scorecard (HSC)14 is a 100 question validated tool designed to help employers assess whether they have implemented evidence-based health promotion interventions or strategies in their worksites to prevent heart disease, stroke, and related conditions such as hypertension, diabetes, and obesity. In addition to assessing efforts directed
www.hero-health.org www.populationhealthalliance.org51
at physical activity, tobacco, nutrition, stress, weight, depression, hypertension, diabetes, high cholesterol, signs & symptoms of heart attack and stroke, emergency response, a significant section of this tool is devoted to the assessment of organizational support for effective program interventions. Eighteen of the 100 questions are focused on organizational support and provide the user with an opportunity to assess current strengths and weaknesses to form an improvement plan.
• Checklist of Health Promotion Environments at Worksites (CHEW)15 was designed as a direct observation instrument to assess characteristics of worksite environments that are known to influence health-related behaviors. The instrument is a 112-item checklist of workplace environmental features both positively and negatively associated with health promotion activities. Three domains are assessed: physical characteristics of the worksite, features of the information environment, and characteristics of the immediate neighborhood around the workplace.
• Dimensions of Corporate Well-Being Scorecard (DCW)16 is a scorecard designed by HealthPartners to guide employers and employer-employee partnerships in establishing effective workplace programs that sustain and improve worker health. The DCW adapts the National Institute for Occupational Safety and Health’s (NIOSH) “The Essential Elements of Effective Workplace Programs and Policies for Improving Worker Health and Well-Being,”17 and includes twenty components of the program, categorized into four dimensions: (1) Organizational Culture and Leadership, (2) Program Design, (3) Program Implementation and Resources, and (4) Program Evaluation. Employers are asked to rate each component on a scale from 0 to 5. Upon completion, an employer will receive a score for each dimension as well as a total score.
• The Environmental Assessment Tool (EAT)18 is a comprehensive tool assessing the physical work environment and policies as they relate to EHM. The EAT encompasses three categories of the physical environment: (1) Physical Activity, (2) Nutrition, and (3) Organizational Characteristics and Support. Organizational Characteristics and Support, includes questions about workplace rules, policies and health promotion programs.
• HealthLead™: US Healthiest Workplace Accreditation Program.19 US Healthiest, a 501(c)3 public/private collaboration, introduced an accreditation process in 2012. Inspired by the US Green Building Council’s LEED Certification program for environmental
sustainability, the accreditation process assesses an organization’s commitment to implementing and sustaining evidence-based worksite health management practices that are aligned with business sustainability, community engagement, and human capital management. Organizations complete an online assessment of their health management program, and those that score 70 out of 100 points are eligible to undergo an onsite audit to verify or adjust their score. The assessment is divided into three key practice areas: Organizational Engagement and Alignment, Population Health Management and Well-being, and Outcomes Reporting.
• HeartCheck20,21 is a 226-item inventory designed to measure such features in the worksite as organizational foundations, administrative supports, tobacco control, nutrition support, physical activity support, stress management, screening services, and company demographics. This public domain tool has been tested for validity and reliability, and has substantial applied research history. Recently, work has been completed demonstrating the utility of a 55-item version referred to as Heart Check Lite. In addition, additional assessment tools have been developed to include the framework and content of HeartCheck, as well as expand in additional focus areas (i.e., WorkCheck developed by HealthPartners, Minneapolis, MN; Working Well developed by American Cancer Society)
• HEcheck,22 with HE representing health environment, is a comprehensive, online organizational assessment that evaluates a workplace’s support for employee health and well-being. Through an interview-based assessment of the workplace, the tool measures policies, services, facilities and program administrative structures that influence the health risk of employees. The assessment measures the existence of criterion, and the total score and multiple sub-section scores represent the degree of workplace support for employee health. HECheck contains a substantial emphasis on organizational support criteria with the inclusion of sections on human resources function, commitment and culture change.
• The HERO Employee Health Management Best Practice Scorecard in Collaboration with Mercer V423 is an assessment designed to help organizations learn about employee health management (EHM) best practices, identify opportunities to improve their EHM programs, and measure progress over time. As both a self-assessment tool and an ongoing

www.hero-health.org www.populationhealthalliance.org52
research survey, the HERO Scorecard was developed to assist organizations, providers, and other stakeholders to identify and learn about the prevalence and effectiveness of EHM best practices. Comprised of 64 questions, it serves as an inventory of best practices in six foundational areas of effective EHM programs: (1) Strategic Planning, (2) Organizational & Cultural Support, (3) Programs, (4) Program Integrations, (5) Participation Strategies, and (6) Measurement and Evaluation. The organizational and cultural support section of the HERO Scorecard includes questions on health values, policies, built environment, and leadership, manager, and employee involvement. Completion of the HERO Scorecard allows organizations to identify the best practices they have in place, and report any program outcomes they have recorded to date.
• The Well Workplace Checklist24 is an interactive assessment tool developed by The Wellness Council of America (WELCOA) to help an organization assess how it’s doing with respect to developing a results-oriented worksite wellness program. The Checklist is comprised of 100 questions designed to assist organizations in assessing their wellness program against the Seven Benchmarks of successful results-oriented workplace wellness programs. Organizations receive a detailed report with information about their scores for each benchmark including feedback to document and quantify tangible improvements in their organization’s overall wellness program.
• WiScore®,25 the Wellness Impact Scorecard, is a best practice assessment tool designed to provide guidance to employers on the appropriate data elements to assess the impact of their wellness efforts. The tool allows employers to quantify the impact of their program, assess trends over time and compare their program to benchmarks. Organizational support elements included within the tool are C-suite support and communications, as well as wellness-related corporate policies.
• Worksite Wellness StrengthsBuilder26 is an instrument that features 81 possible actions that an organization can take to foster an environment that supports wellness. The items within the instrument are organized into nine categories and involve selecting new opportunities that fit within existing strengths and goals for the organization. The online version includes an online report that highlights existing strengths and discusses strategies for building upon strengths.
PERCEIVED ORGANIZATIONAL SUPPORT
As mentioned above, the purpose of this work was to not only define organizational support, but also recommend measures to assess the effectiveness of these efforts. The key measure of effectiveness is employee and leadership perception of organizational support (POS). It is understood that if managers show sincere concern for their employees, the employees in turn exhibit greater engagement in their work, participation in company-promoted programs, and loyalty to the organization. With the objective of identifying tools that accurately measure POS of health and well-being, we identified surveys that assess employee, manager, and leader perception of organizational support.
Measuring Employee Perceived Organizational Support
A survey can be used to measure employee perception of organizational support within a work environment. Through a self-report survey, employees are asked to respond to questions related to the organization’s norms, values, beliefs, and attitudes related to positive health practices. Their input on these factors is scored as their current perceptions. Matching current employee perceptions against a desired target of where they would like the organization to be using the same survey instrument provides a quantitative measure (i.e., norm gap) that can then be re-evaluated over time to determine if these factors are changing and moving in a positive direction.
While perceived organizational support can be measured using a dedicated survey (see available survey instruments below), a single question embedded in a general employee satisfaction survey or other employee feedback process, can also be used. Ideally, this single question would include a response scale for the respondent to indicate their perceived level of support within a range (i.e., very supportive–not supportive at all). In addition, the question would be followed by the opportunity to explain the response choice providing specific, actionable data to the employer. One such question example is provided here:
Do you feel that your employer supports your health and well being?
Five surveys that are dedicated to assessing perceived support are described below:
• CDC NWHP Health & Safety Climate Survey (INPUTS™)27 is designed to provide an overall assessment of workforce attitudes related to the physical and psychosocial work environment, including factors that support or detract from a healthy worksite culture. Its purpose is to assess an organization, company or workplace unit as a whole. The survey is designed to be used in conjunction with other assessment tools

www.hero-health.org www.populationhealthalliance.org53
provided by the CDC National Healthy Worksite Program, including the Employee Health and Safety Assessment (CAPTURE™) and the CDC Worksite Health ScoreCard. Results from these assessments can be used to guide worksite health, safety, and wellness program planning.
• Lifegain Health Culture Audit (LHCA)28 is a culture audit that assesses the level of cultural support for avoiding health risk behaviors. The audit examines five cultural factors: values, norms, culture touch points, peer support and climate. A participant’s POS of health and well-being is assessed in relation to the organization’s support, as well as the climate of their work environment (community, shared vision, and positive outlook). The authors of this tool have found a positive correlation between healthy work culture and people achieving and maintaining lifestyle improvements. In addition to assessing organizational, supervisor, co-worker and family support of healthy lifestyle, the audit measures a participant’s perception of leaders modeling healthy behaviors, resources to support healthy lifestyles, rewards/recognitions for healthy lifestyles, and education provided on the topic. In 2008, researchers demonstrated the reliability and validity of the LHCA instrument.29
• Organizational Health & Safety Climate Scale developed by Basen-Enqguist30 consists of a series of eighteen items that assess the safety and health climate of a worksite. The assessment was developed with the goal of measuring the effect of a health promotion interventions on worksite health or safety climate, as well as better understanding the relationship between health and safety climate. These scales are useful instruments for measuring organizational change related to worksite health promotion activities.
• Perceived Organizational Support (POS) Survey 31 is a validated and reliable assessment tool that measures a participant’s perception of support in which their organization is providing to them, in general. The survey includes two questions that assess health and well being by measuring whether the participant perceives that their organization “would understand a long absence due to illness” and “really cares about my well-being.” The correlation between POS score and increased safety behavior has been demonstrated.32,33,34 To date, there has been no research done to demonstrate a relationship between POS score and health/well-being.
• Perception of Environmental and Cultural Support for Health Survey35 is a survey instrument developed
by the University of Michigan Health Management Research Center to assess employee perceptions of workplace environment and culture for supporting health. The domains include senior leadership, policies and procedures, programs, rewards and quality assurance. For perception of cultural support, domains include perceptions of supervisor support, coworker support, values, mood, and norms.
• Worksite Health Climate Scales (WHCS)36 is a sixty-five-item questionnaire that measures three general categories of climate: organizational support, interpersonal support, and health norms. Within these three categories, there are twelve scales. The scales were developed by Ribisl and Reischl to demonstrate that there is an identifiable climate for health at worksites. These scales are reliable and valid, and may prove useful in evaluating the impact of health interventions on the climate of the worksite, as well as the climate for health within worksites.
Measuring Leadership and Management Perceived Organizational Support
An organization may ask its leaders and managers to prioritize, recognize, understand, support, and model health behaviors as a key business strategy. Furthermore, leaders and managers may be held accountable for these responsibilities. Given those expectations, it is important to ask managers and leaders their perception of the organization’s commitment to key EHM foundational elements and the support provided to them to carry out their responsibilities. Similar to employee perception, a survey tool can be used periodically to ask managers and leaders about the organization’s support of positive health practices and track progress in this area over time. A Time 1 versus Time 2 measure can then provide insight and guidance regarding progress being made by the organization in addressing these key cultural constructs (i.e., norms values beliefs, and attitudes supporting employee positive health practices).
An alternative option is to embed two questions within a manager survey or feedback process. Ideally, these questions would include response scales so the respondent could indicate their POS within a range (i.e., very supportive–not supportive at all). In addition, the questions would be followed by the opportunity to explain the response choices providing specific, actionable data to the employer. These questions might be:
• How well does your organization support you as a manager to best support your employees’ health and wellbeing?
• How well does your organization support you in your own health and wellbeing?

www.hero-health.org www.populationhealthalliance.org54
Two instruments currently available to assess manager/leader perception of organizational support are described below:
• The Leading by Example (LBE) instrument37,38 is a process evaluation tool that specifically measures management support for a healthy work culture and health promotion programs. A 13-question instrument, the LBE survey assesses perceptions of leaders’ level of support for health improvement programs and the extent to which the organization is committed to providing a healthy culture to its employees (social-organizational environment). The survey may be administered to various organizational groups from agency leadership to a cross section of employees from various levels of the organization. In addition to obtaining an overall score including all of the questions in the LBE, it is possible to group certain questions together for a more in depth understanding of a particular area of interest.
• Perception of Environmental and Cultural Support for Health Survey 39 is a survey instrument developed by the University of Michigan Health Management Research Center to assess employee perceptions of workplace environment and culture for supporting health. The domains include senior leadership, policies and procedures, programs, rewards and quality assurance. The development of this tool includes a version intended for supervisors and leaders.
THOUGHTS AND CONSIDERATIONS
Insights from Organizational Development
It should be acknowledged that even though the focus of this chapter is on organizational support for health and well-being, we know from the organizational development literature that the broader constructs of positive outlook, sense of community and shared vision are also connected to, and certainly influenced by, an overall supportive health-enhancing workplace.40 These constructs, often referred to as climate characteristics, are defined below:
1. Positive Outlook—People enjoy their work, celebrate accomplishments, adopt a “we can do it” attitude and bring out the best in each other.
2. Sense of Community—People really get to know one another, feel as if they belong and care for one another in times of need.
3. Shared Vision—People feel the organization’s conduct is consistent with their personal values and people are clear about how they fit in to the big picture.
Further research is needed to understand the relationship between a supportive health-enhancing workplace or climate and the health and well-being of those within
a specific workplace. Furthermore, there is also great opportunity to better understand the impact of health-specific leadership, and expand upon the research in this area.41 Finally, learning from our colleagues in the field of organizational development will allow us to better understand key constructs within this area.
Administration
Culture instruments are often confused with employee satisfaction surveys. They are different instruments designed to measure distinct variables. Culture Audit questions can be included on employee satisfaction surveys but they need to be described and included in their own section. Using a Culture Audit type tool among a stratified random sample of employees is the best option for gathering input related to POS and progress in this area. A repeat measures structure (i.e., time 1 versus time 2) can provide feedback and meaningful evaluation results over time. This approach is recommended to employers interested in assessing the effectiveness of organizational support strategies.
SUMMARY
Organizational Support of EHM is acknowledgment of and commitment to the importance of a healthy workforce within a company. Furthermore, the organization needs to “walk the talk.” It is in taking those necessary steps of devoting energy and resources to create an environment that supports health and well-being that result in a culture that clearly demonstrates an organization’s sincere caring of its people. This sets the stage for deliberate formal actions (policies, resources, programs) that foster employee engagement, high morale, healthy lifestyle behaviors, program participation, increased performance, and other positives outcomes as noted above.
Companies can measure the existing strength of their organizational support by evaluating the “deliberate steps” they have taken to promote healthy behaviors and by asking employees and leaders to measure the level of support they feel they receive from their company. We have provided a list of tools and assessments that can help organizations collect this data in order to assess their level of organizational support and gain insight on the success and effectiveness of their efforts. We need to have a basic understanding that when a company provides more programs; this does not necessarily result in providing greater value. It is critical to assess the level of perceived organizational support in relation to the deliberate steps that are taken to provide support, resources, and programs in order to find that essential and complete balance within an organization. Related research on POS and safety

www.hero-health.org www.populationhealthalliance.org55
behaviors clearly suggests the potential for deriving similar results when applied to health behaviors.
To date, a limited number of studies have embarked on determining if a high degree of organizational support for healthy behaviors leads to positive program outcomes,42,43 it is intuitive that a relationship exists, and the relationship is
beginning to be better understood. It is our hope that future research further investigates the relationship between POS of health/wellbeing and organizational health status, medical spending, ROI, VOI and business performance. In conclusion, the intent of the efforts was to provide a comprehensive overview of organizational support and practical options on elements and measures to be used for this domain.
CHAPTER 6 REFERENCES1 O’Donnell MP. Evolving definition of health promotion: what do you think? Am J Health Promot. 2008: 23:iv.2 O’Donnell MP. Definition of health promotion, part II: levels of programs. Am J Health Promot. 1986; 1:6-9.3 O’Donnell MP. Definition of health promotion, part III: expanding the definition. Am J Health Promot. 1989: 3:5.4 Allen J. Wellness Leadership. Burlington, VT: Healthyculture.com Publisher; 2008.5 Aldana, et al. A Review of the Knowledge Base on Healthy Workplace Culture. Journal of Occupational & Environmental Medicine, Volume 54, Number 4, April 2012.6 Allen, R. F. & Allen, J. (1987). A sense of community, a shared vision, and a positive culture: Core enabling factors in culture based health promotion efforts. American Journal of Health Promotion, 1:3, 40 47.7 Hoebbel, et al. Associations Between the Worksite Environment and Perceived Health Culture. American Journal of Health Promotion, May/June 2012, Vol 26; 5.8 World Health Organization Healthy Workplace Model: Avenues of Influence, Process and Core Principles (www.who.int/occupational_health/healthy_workplaces_workshop_report.pdf )9 Credo KR, Armenakis AA, Feild Hs, Young RL. Organizational Ethics, Leader-Member Exchange, and Organizational Support: Relationships With Workplace Safety. Journal of Leadership & Organizational Studies, 2010, Vol. 17: 325.10 Hofmann DA, Morgeson FP. Safety-Related Behavior as a Social Exchange: The Role of Perceived Organizational Support and Leader-Member Exchange. Journal of Applied Psychology, 1999; 84(2): 286-296.11 Mearns KJ, Reader T. Organizational support and safety outcomes: An un-investigated relationship? Safety Science, 2008; 46: 388-397.12 Fabius, R., Thayer, R. D., Konicki, D. L., Yarborough, C. M., Peterson, K. W., Isaac, F., Loeppke, R. R., Eisenberg, B. S., & Dreger, M. (2013). The Link Between Workforce Health and Safety and the Health of the Bottom Line. Journal of Environmental Medicine, 55(9), 993-1000.13 Allen, J. Wellness Leadership, Burlington, VT: Healthyculture.com Publisher:2008.14 Centers for Disease Control,and Prevention. The CDC Worksite Health ScoreCard: An Assessment Tool for Employers to Prevent Heart Disease, Stroke, and Related Health Conditions. Atlanta: U.S. Department of Health and Human Services; 2012.15 Oldenburg, B., Sallis, J. F., Harris, D., & Owen, N. (2002). Checklist of health promotion environments at worksites (CHEW): development and measurement characteristics. American Journal of Health Promotion, 16(5), 288-99.16 Dimensions of Corporate Well-Being Scorecard. Health Partners, Minneapolis, MN. Presented at the Harvard School of Public Health continuing professional education course “Work, Health, and Wellbeing: Strategic Solutions for Integrating Wellness and Occupational Safety and Health in the Workplace” in Boston, September, 2012.17 National Institute for Occupational Safety and Health (NIOSH). Essential Elements of Effective Workplace Programs and Policies for Improving Worker Health and Wellbeing. www.cdc.gov/niosh/twh/essentials.html18 DeJoy DM, Wilson MG, Goetzel RZ, Ozminkowski RJ, Wang S, Baker K, Bowen H, & Tully K. (2008).The Development of the Environmental Assessment Tool (EAT) to Measure Organizational Physical and Social Support for Worksite Obesity Prevention Programs. J Occup Environ Med, 50(2):126-137. 19 2013 Alliance to Make US Healthiest. (2012). HealthLeadTM: US Healthiest Workplace Accreditation Program. Retrieved from http://www.ushealthlead.org20 New York State Department of Health, Healthy Heart Program. (2013). Heart Check. Retrieved from http://www.nyhealth.gov/nysdoh/heart/healthy/heartcheck.pdf21 Golaszewski, T., Barr, D., & Pronk, N. (2003). Development of assessment tools to measure organizational support for employee health. American Journal of Health Behavior, 27(1), 43.22 Edington, D. & Golaszewski, T. (2013, March 20). Hecheck—new measurement tool for executives: Analysing your health promotion strategies [Web webinar recording]. Retrieved from http://www.hr.com/en/app/blog/2013/03/hecheck—new-measurement-tool-for-executives-anal_hdyygrgz.html
23 Health Enhancement Research Organization. (2009). The HERO Employee Health Management Best Practices Scorecard In Collaboration with Mercer. Retrieved from https://mercer.inquisiteasp.com/cgi-bin/qwebcorporate.dll?idx=NPPY5J&linkspons=024 Wellness Councils of America. (2013). Well Workplace Checklist. Retrieved from http://welcoa.org/wellworkplace/index.php?category=1825 National Business Group on Health. (2014). WiScore, the wellness impact scorecard. Retrieved from http://www.businessgrouphealth.org/scorecard_v5/ index.cfm?event=logon.landing26 Human Resources Institute, LLC. (2011). Worksite Wellness StrengthsBuilder. Retrieved from http://www.healthyculture.com/new_initiatives.html27 National Center for Chronic Disease Prevention and Health Promotion, Division of Population Health. (2013). CDC NHWP health and safety climate survey (INPUTSTM) user manual. Retrieved from http://www.cdc.gov/nhwp28 Human Resources Institute, LLC (2011). Lifegain Culture Audit. Retrieved from http://www.healthyculture.com/new_initiatives.html29 Golaszewski, T, Hoebbel, C, Crossley, J, Foley, G, & Dorn,J (2008). The Reliability and Validity of an Organizational Health Culture Audit. American Journal of Health Studies, 23(3):116-123.30 Basen-Engquist, K, Hudmon, K.S., Tripp, M., & Chamberlain, R. (1998). Worksite Health and Safety Climate: Scale Development and Effects of a Health Promotion Intervention. Preventive Medicine, 27: 111-119.31 Shore, L. M., & Tetrick, L. E. (1991). A construct validity study of the Survey of Perceived Organizational Support. Journal Of Applied Psychology, 76(5), 637-643. doi:10.1037/0021-9010.76.5.63732 Mearns, K.J., Reader, T. (2008). Organizational support and safety outcomes: An un-investigated relationship?. Safety Science 46,388-397.33 Hoffman, D.A., Morgeson, F.P. (1999). Safety-Related Behavior as a Social Exchange: The Role of Perceived Organizational Support and Leader-Member Exchange. Journal of Applied Psychology 84(2) 286-296.34 Credo, K.R., Armenakis, A.A., Field, H.S., & Young, R.L. (2010). Organizational Ethics, Leader-Member Exchange, and Organizational Support: Relationships With Workplace Safety. Journal of Leadership & Organizational Studies 17(4) 325-334.35 Marzec, Mary and Susan Hagen. September 2011. “Workplace Perception of Environment/Culture Support Survey: Identifying Areas for Program Improvements.” unpublished work. 36 Ribisl, KM & Reischl, TM (1993). Measuring the Climate for Health at Organizations. Journal of Occupational Medicine, 35(8):812-824.37 DeJoy DM, Della, L, DeJoy, DM, Goetzel, RZ, Ozminkowski, RJ, Wilson, M (2008). Assessing Management Support for Worksite Health Promotion: Psychometric Analysis of the Leading By Example Instrument. Am J Health Promot, 22(5):359-67.38 Della L, Mitchell SG, DeJoy DM, Goetzel RZ, Roemer EC, Wilson MG. (in press) Management Support for Worksite Health Promotion: Field Test of the Leading by Example Tool. Am J Health Promot.39 Marzec, Mary and Susan Hagen. September 2011. “Workplace Perception of Environment/Culture Support Survey: Identifying Areas for Program Improvements.” unpublished work.40 Allen, R. F. & Allen, J. (1987). A sense of community, a shared vision, and a positive culture: Core enabling factors in culture-based health promotion efforts. American Journal of Health Promotion, 1:3, 40 47.41 Gurt, J., Schwennen, C., & Elke, G. (2011). Health-specific leadership: Is there an association between leader consideration for health of employees and their strain and well-being? Work & Stress, 25(2), 108-127.42 Marzec ML, Golaszewski T, Musich S, Powers PE, Shewry S, & Edington DW. Effects of environmentally-focused interventions on health risks and absenteeism. International Journal of Workplace Health Management. 2011;4(3):200-203.43 Wilson MG, Goetzel RZ, Ozminkowski RJ, DeJoy DM, Della L, Roemer EC, Schneider J, Tully KJ, White JM, & Baase CM. Using formative research to develop environmental and ecological interventions to address overweight and obesity. Obesity. 2007;15(1S):37S-47S.
www.hero-health.org www.populationhealthalliance.org56
INTRODUCTION
Historically, the focus in EHM outcomes measurement has been on the impact of health risks, chronic conditions and clinical outcomes on direct health care costs. Recently the value proposition for EHM has broadened to include harder-to-measure impacts such as worker productivity.1,2,3,4 Health care cost management remains a significant concern to employers, but there is a need to broaden the value proposition for EHM from a singular focus on health care cost management to also include a focus on optimizing employee productivity and performance. While there are many non-health related contributors to employee performance, health is an important contributor and EHM programs have the potential to contribute to a healthy company bottom line.5 The challenge for purchasers of EHM programs is to incorporate measurement of productivity outcomes in a way that will be accepted by business leaders. Getting beyond a singular focus on health care costs will demand a focus on the effects of health (or illness) on work outcomes such as attendance, performance, and turnover. These measures are more readily linked to operations measures that matter to business leaders and therefore may be a more compelling argument for human capital investments rather than managing the “cost of doing business”.
A 2005 Integrated Benefits Institute survey found nearly 50% of the 343 surveyed senior financial executives believed absence and on-the-job performance affect business results, but less than half reported receiving reports on their organization’s absence and most had no data about health-related on-the-job performance.6 Despite consistent published evidence that health affects productivity, the presence of productivity as an organizational indicator of interest in the EHM field for nearly 30 years, and the availability of validated questionnaires, job performance and productivity loss is one of the least studied outcomes associated with employer-sponsored health management programs.7 As has been noted by others, the lack of employee productivity and performance data is due in part to the lack of guidance on best practices for productivity measurement.8
Employers keenly focused on measurement have invested in comprehensive data warehouses that include administrative data on employee time away from work in the form of absence, workers compensation, and disability records.9,10 However, many employers rely on paper-based systems, multiple vendors, or simply do not consistently track employee time away from work. In addition, movement to paid time off (PTO) banks has made it more difficult to associate time off with a health-specific reason. To meet the need for outcomes measurement, many have turned to self-report tools.11 Survey tools hold a lot of promise for employers looking for cost effective ways to fill gaps in their data and several self-report tools have emerged as the measurement method of choice due to their wide availability, ease of use, and/or rigorous validation against administrative data. The most validated self-report tools available to employers are especially strong when it comes to measuring time away from work (TAW) and productivity loss while at work (PLAW) due to a worker’s poor health.
A 2006 commentary describes the productive workforce as one that is “functioning to produce the maximum contribution to achievement of personal goals and organizational mission”.12 An emerging idea in the area of employee productivity is distinguishing traditional productivity measurement (focused on TAW and PLAW) from optimal employee performance. While there is not a single consensus set of definitions to differentiate between productivity and performance, there is a need to develop them. Although early definitions of productivity have been broad, the traditional way of thinking about employee productivity has been an impairment model which focuses on the gap between expected levels of contribution to a specific job or task and actual levels, which might be lower than expected due to employee health or other factors. The idea of performance suggests a focus on the gap between expected levels of contribution and the best possible levels of contribution for a given individual. This differentiation between productivity and performance is an emerging area of interest for the EHM field because employers need to understand how to create high
CHAPTER 7: PRODUCTIVITY AND PERFORMANCE
Jessica Grossmeier, PhD, MPH

www.hero-health.org www.populationhealthalliance.org57
performing individuals and teams that will deliver competitive value for their organizations. There is a strong and growing evidence base connecting individual health to cognitive function, particularly in the field of sports science.13,a While yet lacking conclusive research, there is growing acceptance that good health is also good business.14,15
Distinguishing Between Worker Productivity and Performance
To help distinguish the differences between TAW, PLAW, and optimal worker performance, HERO and PHA developed a 5-category continuum as depicted in Figure 2.
It does not represent a research-tested measurement model but rather a conceptual framework to illustrate the potential difference between productivity and performance. The figure represents an initial conceptual approach that will likely be expanded or modified as researchers and practitioners begin to apply it to their measurement work. While the continuum does not intend to establish a distinct cut point between productivity and performance, it does acknowledge that the strongest area of measurement in the EHM field has been on the first four categories. The size of the opportunity and the ability for health to improve employee performance above typical levels is an area that requires further study. As the continuum is adapted and tested over time our understanding of the link between health, non-health factors, and productivity/performance outcomes will grow. The next step then will be determining the most effective way to communicate about contributors and outcomes to business leaders. Many industry leaders believe a performance paradigm may resonate more strongly with C-suite leaders.
Perhaps the easiest component to conceptualize is time away from work (TAW), which can be measured from administrative data or self report. This aspect of productivity
is represented in the first box on the far left of the continuum. To be clear, “not at work” status does not intend to represent workers who are contributing to their work outside of the office, as is the case with remote workers. In this sense, “not at work” should be interpreted figuratively, not literally. It also is important to note that not all employee absence is due to an employee’s poor health. Absence may also be attributed to a family member’s poor health, to poor engagement with one’s work, or life circumstances unrelated to health. The focus for the Guide is measurement tools that support EHM so the remainder of this section focuses on measurement strategies for measuring health-related influence on employee TAW. While some work environments carefully track the reasons associated with time away from work, many others combine all paid time off into a “paid time off” or PTO bank that does not track the reason for the absence. This poses a major measurement challenge and is one reason why employers are increasingly relying on self-report tools for measurement.
The next four sections of the continuum represent on-the-job productivity. At the very minimum, an employee might “show up” for work but not produce any output. Based on current measurement practices, this might be considered significant productivity loss while at work (PLAW) or presenteeism.c,16,17 As for TAW, PLAW is most commonly measured in EHM research using well-tested self-report tools. Such tools capture the portion of the performance continuum that focuses on the opportunity to improve PLAW due to employee health. At the next point on the continuum the employee might be producing output to some degree but it is below acceptable standards regarding safety, quality, and/or quantity. Moving further to the right on the continuum, an employee might be at work and producing to meet at least the minimal standards expected for their job but not be fully productive. At the far
At work but not productive
At work and productive but below standards
At work and productive, meeting standards, not optimized
Optimal performance at work
Not at work(absence)
Current EHM Productivity Measurement Tools
Contributors to performance: market and workplace environment, worker health and engagement
Figure 2: Employee Productivity and Performance Continuumb

www.hero-health.org www.populationhealthalliance.org58
right of the continuum is the fully optimized employee who is at work when they are supposed to be and producing optimally given their individual skills and capabilities and job duties. Measurement of this area to the far right on the continuum represents an area for future measurement and, at this time, the opportunity for EHM to improve employee performance beyond typical levels is unknown.
What is missing from most EHM measurement tools is measurement of productivity loss attributed to reasons beyond an employee’s health, such as organizational constraints related to work overload, lack of needed tools or technology, and skills training.18,19 A separate but related issue is employee turnover, which is a significant concern for employers that require a highly skilled workforce. There is some potential for EHM programs to be positioned as a component of value-added benefit that contributes to the attraction and retention of top talent. However, there is very little research to support this link, and more research is needed before turnover and related metrics can be recommended as part of the value proposition for EHM. It is important for employers to assess both the health and non-health contributors to TAW and PLAW, but it is not an oversight in the development of the traditional self-report tools because they were specifically designed to measure the influence of worker health on TAW and PLAW. Organizations that wish to measure non-health contributors to productivity and performance may need to combine current EHM tools with other measurement strategies but discussion of those other measurement strategies is beyond the scope of this Guide. An overlapping area of measurement may be in the area of employee engagement with their work, especially because employee engagement may contribute to TAW and PLAW as well as turnover.
The Role of Employee Engagement at Work for Productivity and Performance
While it is enticing to refer to the fully optimized employee as “engaged,” the HERO-PHA work was intentional in its decision not to label this end of the continuum as “engaged.” There is a vast body of literature on employee engagement with very specific terms, measurement tools, and intervention tactics which have largely operated outside of the EHM field. Developing measurement standards and recommendations for engagement may have been addressed by organizations outside of the EHM field, and this merits further exploration but is outside the scope of the Guide. While related, HERO and PHA posit employee productivity and employee engagement are not the same things. An employee engagement workgroup convened by The Conference Board defined employee engagement as
“a heightened emotional and intellectual connection that an employee has for his/her job, organization, manager, or coworkers that, in turn, influences him/her to apply additional discretionary effort to his/her work.” 20 This is consistent with the concept of “flow” in sport, which was first proposed by Mihály Csíkszentmihályi as the mental state of operation in which a person performing an activity is fully immersed in a feeling of energized focus, full involvement, and enjoyment in the process of the activity.21 A review of the research on engagement notes a variety of different definitions of the term but the academic literature definitions most consistently conclude that it “is a construct that consists of cognitive, emotional, and behavioral components that are associated with individual role performance.”22 It is important to note in this definition that employee engagement is considered to be driver of performance and not merely a sub-component of it. While an employee may need to be engaged to perform optimally, there are other drivers of performance outside of employee engagement. The arrow beneath the performance continuum acknowledges there are many factors that influence worker performance in addition to worker health status.23,24,25,26,27
The next section begins with an overview on the current research linking employee health and well-being to productivity-related outcomes followed by a discussion about how these outcomes were measured. Suggested areas of measurement include health-related TAW and PLAW. Issues related to use of objective versus self-reported measurement tools will be addressed and some of the most highly validated self-report tools will be identified. The section closes with a brief discussion and guidance about monetization of productivity impacts, identification of future areas for development, and a conclusion of key recommendations.
Objective and Scope
The primary objective of this section of the Guide is to recommend standard productivity measures specifically related to the influence of health on productivity outcomes. The metrics can be divided into two basic categories including health-related TAW and PLAW.
Summary of Recommendations
• Demonstrating EHM impact on employee productivity and performance is an important part of the VOI equation for EHM. Recommended measurement tools and strategies are provided in this Guide to support a comprehensive EHM evaluation strategy.

www.hero-health.org www.populationhealthalliance.org59
• Administrative data to measure TAW due to poor health may be difficult to collect and analyze due to employers’ use of PTO banks. Self-report tools are recommended in the Guide as an alternative when other data sources are not available.
• Several employers have demonstrated the ability to measure health impact associated with PLAW using observable changes in work output, but appropriate measures differ by job type and industry. Self-report tools are recommended in the Guide as an alternative to observable or administrative data.
• However an organization chooses to measure TAW and PLAW, the Guide recommends data be tracked at the individual level over time. This allows organizations to compare each individual to their own baseline, with the ability to aggregate individual changes up to group reports.
• Many organizations have developed formulas to monetize the impact of EHM on TAW and PLAW, but there are no current standards for monetization. The Guide recommends caution and transparency when monetizing. The most conservative measures of TAW and PLAW are limited to units of time such as number of hours or number of FTE days. Any translation of productivity impact to financial savings should be accompanied by information about the monetization methods used and the assumptions underlying the calculations. With distinct reporting and transparency, employers can more easily determine their comfort level with the assumptions made in the underlying calculations.
• Many factors can impact productivity, and the productivity impact of health risks may not be perceived as attributable to health. The focus for the Guide is measurement of TAW and PLAW associated with employee health. When measurement and evaluation goals require a broader focus, select tools that measure potential reasons for TAW or PLAW more broadly than employee health or augment EHM productivity measurement with other measurement strategies.
Additional detail and information to support these recommendations is provided below.
Literature Review: Summary of Evidence on the Impact of Health on Productivity
The literature review on the relationship between health and productivity was conducted to provide users with a summary of the evidence supporting productivity as a
component of the value proposition for EHM. Studies on pain, medications, and chronic conditions have concluded costs associated with employee productivity loss can be twice that of healthcare costs,28,29,30 with three quarters of the cost of lost productivity attributed to presenteeism and the remainder of costs attributed to absenteeism.31 There is consistent and robust evidence that lifestyle-related health risks (such as lack of exercise, stress, hypertension or life dissatisfaction) are associated with higher levels of absenteeism and presenteeism.32,33,34,35 Emerging, but less robust evidence exists to demonstrate that reducing risk factors and adopting healthy behaviors reduces absenteeism and presenteeism.36,37,38,39,40 Even more limited is the number of studies demonstrating the ability of EHM programs to impact productivity outcomes, and the studies that do exist require stronger study designs, measurement methods, and analytic approaches to be conclusive.41
RECOMMENDED MEASURES
Time Away from Work (TAW)
Time away from work (TAW) metrics are perhaps the most concrete to conceptualize because they represent the amount of time an individual is not at work when they are expected to be there. What gets more complicated is when employers attempt to associate the amount of time away from work with the reason for the time away. Recommended metrics are categorized into four groups, including incidental absence, workers compensation, short-term disability, and long-term disability. Generally speaking, each area of TAW can be measured in terms of incidence, number of days associated with TAW occurrence, and costs associated with TAW occurrence.
Actual calculation of TAW metrics can be very challenging, but fortunately, a great deal of work has been done to develop precise metrics, definitions, and calculation guidelines for these metrics. Rather than try to replicate the work done by others, the Guide refers interested individuals to the National Business Group on Health’s guide, Employer Measures of Productivity, Absence, and Quality™ (EMPAQ®).42
For employers that are not able to measure TAW metrics based on administrative records, self-reported metrics may be used. The simplest approach to self-reported measurement is to add a series of questions to an existing employee survey such as a health assessment. Since most self-report tools on health-related absence are incorporated into broader surveys that also measure health-related productivity loss while at work, information on specific tools will be addressed in that section below.

www.hero-health.org www.populationhealthalliance.org60
Productivity Loss While At Work (PLAW)
Productivity loss while at work (PLAW) metrics can theoretically be measured directly by observing variances in worker output over time, but in practical terms this is very difficult to do for most organizations and for many jobs/positions. Most of the research on health-related PLAW has relied on employee self-report. While many business leaders question the validity of self-reported measures of PLAW, business leaders routinely use self-reported employee and customer satisfaction surveys to evaluate their business practices. Employers understand how employee and customer satisfaction measures relate to business operations and the challenge for productivity measurement is to clearly link employee health to outcomes that are relevant to business operations. There are several self-report tools that have been validated against more objective measures of work output and deemed rigorous enough to be accepted by government research organizations such as the National Institutes of Health (NIH) and the Center for Disease Control and Prevention (CDC). It is not within the scope of this Guide to review the extent to which various tools have been validated. The HERO and PHA advise employers to contact the developers of a particular tool (see below) if they are interested in more information about its validation, as most of the industry resources that describe assessment tools or compare them against one another may be out of date.43,44,45,46 While an updated list of available assessment tools and their attributes is needed, it was beyond the scope of this work to develop a comprehensive, updated comparison grid. Development of such a resource is recommended for future updates of the Guide, particularly because new instruments are being developed and introduced to this emerging area of measurement.
This section summarizes some of the most commonly used tools in published research for assessment of self-reported PLAW, also referred to as “impairment” or “presenteeism.”
While no tool has clearly established itself as the gold standard for measuring TAW or PLAW, three have emerged as most commonly used in research and employer reporting on EHM impact. The Institute for Health and Productivity Management rated these three tools as “market ready” in their 2001 review.47
• Work Limitations Questionnaire (WLQ)—Developed by Dr. Debra Lerner and colleagues at The Program on Health, Work and Productivity, Tufts Medical Center,48 this tool is often cited as the “gold standard” in its original 25-question format. The long format is commonly used in research. An 8-question
version is more commonly used in non-research settings and it is used extensively in health assessment tools. The WLQ is available on a royalty-free basis for non-commercial uses such as employer studies and academic research. A license fee is required for commercial applications. Using a 2-week recall period, the user is asked about health-related limitations in ability to perform work on four dimensions:
- Time management- Physical work tasks- Mental/interpersonal tasks- Output tasks
The WLQ has been well validated in several arenas. Because of its measurement properties, some experts consider this tool to apply to a wide variety of work types (such as manufacturing jobs, knowledge worker jobs, and managerial/executive jobs). Current versions of the WLQ include measures of TAW and PLAW. It has been translated into more than 40 languages and dialects, which are available.
• Health and Work Performance Questionnaire (HPQ)— Developed by the World Health Organization (WHO) in collaboration with Ron Kessler and the Harvard Health and Work Performance Initiative.49 The tool uses seven-day and 28-day recall periods. This tool is commonly used at large corporations, which have formed a consortium to compare results to support targeting and evaluating healthcare interventions and to help employers evaluate the ROI of decisions about health benefits or on-site health programs. See http://www.hcp.med.harvard.edu/hpq/. The tool does not require a licensing fee and measures both absenteeism and presenteeism. The first section of the HPQ is rather like a health assessment and Part B is a much shorter assessment of work performance including absenteeism, presenteeism, and critical workplace incidents. Dr. Ronald Kessler partnered with the Integrated Benefits Institute in 2007 to develop a shorter instrument, the HPQ-Select, to serve employer reporting needs.d To assess TAW and PLAW, use section B of the tool. The assessment of critical workplace incidents provides a safety component of the tool and includes measurement of accidents that break things or disrupt work flow, injuries of self or others. Like the WLQ, the tool has been well validated against objective measures of work performance or productivity.

www.hero-health.org www.populationhealthalliance.org61
• Work Productivity and Activity Impairment Questionnaire (WPAI)—Developed by Reilly and Associates as a patient-reported quantitative assessment of the amount of TAW, PLAW, and daily activity impairment attributable to general health.50 Other forms have been developed to measure TAW and PLAW due to specific health problems. The tool requires no fee and is available in the public domain and has been validated in multiple languages and outcomes trials. Unlike the WLQ and HPQ, the WPAI has not been validated against objective measures of work performance and productivity and should be considered a subjective assessment of health-related impairment. Using six questions and a seven-day recall period, the tool allows the calculation of four primary metrics:- Percent work time missed due to health (absenteeism)- Percent impairment while working due to health
(presenteeism)- Percent overall work impairment due to health- Percent activity impairment due to health
Criteria for Selection of Self-Report Tools
This section provides guidance on factors to consider when selecting a measurement tool. This is not intended to be a comprehensive list, but rather a starting point for further discussion. The IHPM guide to self-assessment tools also provides helpful guidance on tool selection.51,52,53
1. Are there any concerns about the accuracy and truthfulness of employee responses and if so, why?
2. What is the length of the tool? Is a shorter version available and has validity testing been conducted on the shorter versions?
3. What are the costs associated with use of the tool and with scoring of the data?
4. Is the scoring transparent enough that experts are not required to interpret the results?
5. Can the results be trended over time?6. Does the assessment address the dimensions of
productivity loss you are most interested in measuring?7. Was the tool designed to be applied in the way you
would like to use it?8. Is the recall period used in the tool likely to result in
accurate self-report? While there are mixed opinions about the ideal recall period in self-report tools, it the general consensus that shorter recall periods (e.g., 2 weeks or a month) are more accurate than longer recall periods (e.g., 12 months).
9. Does the tool meet the minimum education or reading level of employees?
10. Has the tool been translated into other languages? If so, has the translation work been tested to ensure the translation conveys the appropriate meaning for employees?
11. Has the tool been vetted through research to demonstrate accuracy and consistency (i.e., subjected to rigorous validity, reliability, and responsiveness testing)?e,54,55
12. Has the tool been tested and found applicable to a variety of occupations or to the specific occupation group you are interested in?56
Another consideration in tool selection is the desire to measure changes over time. If a self-report productivity tool is used, it is optimal to track data at the individual level and then aggregate individual changes up to population level change. In addition, it may be desirable to track potential contributors to productivity impact more broadly than health so any changes in health can be detected independent of other potential confounders (such as a major reorganization). As noted above, this may require an organization to augment EHM productivity measurement tools with other measurement strategies.
At the end of the day, each employer has to decide which of these criteria are most important to them and decide which tool to use based on how each one rates on the most important criteria. It may be helpful for an employer to retain a consultant with subject matter expertise in measurement to support selection of an appropriate tool given each employer’s unique application of such tools.
Monetizing Productivity Impact
Since self-report PLAW tools produce an output that can be translated into hours of lost productivity per year, it is natural for users to take the next step to translate the results into monetary terms. In fact, an Expert Panel considered the ability to monetize PLAW tool results a key characteristic for business users to consider when selecting a tool.57 There have been several reviews and commentaries published which capture the concerns and limitations associated with monetization, and some researchers have subsequently stopped monetization.58,59
Several methods have been advanced to attempt to monetize changes in self-reported PLAW. The most basic approach converts hours lost per year (from the self-report tools) to dollars lost using hourly wages (sometimes based on compensation only and sometimes based on compensation plus benefits). The primary assumption associated with this method is the use of wage as a proxy for the production value of the individual.

www.hero-health.org www.populationhealthalliance.org62
The method is attractive in its simplicity and intuitiveness. A potential limitation in some settings is that this approach to monetization does not account for individual influences on team-based output. It assumes the value of a team effort is equivalent to the summed compensation of all team members when in fact, the value may be much greater in terms of new revenue or profit to the organization. Research demonstrates the overall performance or productivity of an enterprise is more than just the sum of the individual employees’ output.60,61,62 For example, a team working on a quality assurance initiative may identify new work processes that result in millions of dollars of savings for the organization, far exceeding the combined compensation of the team. As a result, this method may reflect a lower-bound estimate of PLAW costs when applied to knowledge-based workers or team-centric work environments. Other methods attempt to get at the amount of lost productivity by estimating its cost to the organization.63 One approach in particular uses survey responses as a basis for thought experiments to give businesses a sense for the magnitude of productivity loss. This method involves administration of manager surveys about the monetary value of increasing productivity by a given percent or estimating the revenue produced by various staff members. Such a method is not intended to provide a dollar amount associated with productivity loss but rather to provide a sense of the magnitude of the issue. This method is more easily applied to TAW than to PLAW because it may be difficult for managers to tell when some employees are not operating at their typical level of productivity. The articles by Mattke et al64 and Brooks et al65 are recommended to those desiring a detailed and more comprehensive overview of monetization methods and their limitations. A more conservative approach to monetization is often preferred by CFOs.
All translation methods are associated with validity issues, and some require special expertise. Since different tools yield different measures of TAW and PLAW, it would be expected that the monetization results would differ as well. The work group does not wish to recommend a specific monetization approach because research evidence is insufficient to support any particular method. Employers should be aware of the concerns raised by experts about monetization and determine if the monetization methods used will be acceptable to decision makers within the organization.
HERO and PHA recommend that organizations add TAW and PLAW metrics to their evaluation strategies, and if there are concerns about monetization of productivity impacts, the Guide recommends translating productivity impacts into hours of time lost. If monetization of time
loss is desired, those conducting the monetization should be transparent about the assumptions made during the calculations. When monetized PLAW results are used, the cost impact should be provided separately and distinctly from reports of direct health care cost impact.
Measuring Optimal Employee Performance While At Work
As mentioned in the introduction, the current measures of productivity largely focus on the left side of the employee performance continuum. Future potential measurement strategies might also assess the extent to which health and other factors optimize the quality and quantity of employee, team, and/or business unit contributions to an organization. This is an area where little to no industry standards exist however some research exists supporting the view that team productivity is greater than the sum of individual employee contributions.66
One employee-level performance measure common to most organizations is employee performance reviews. There is likely a great deal of variation across organizations in the employee performance review process and instrumentation. Some organizations rely on simple supervisor assessments of direct reports, while others use a standardized 360-degree process that gathers data from supervisors, peers, and supervised employees. Understanding what a company or business unit performance rating actually measures may affect the extent to which we would expect employee health to be related to manager performance ratings. For example, a performance rating system focused on assessing job promotion potential differs from a system focused on operational measures of work output. It is beyond the scope of the Guide to recommend industry standard measures for employee performance review tools. The HERO/PHA recommendation is that each organization should strive to measure employee performance using the performance review process consistently across the company. If possible, the next step is to then link that data with employee health and EHM data to assess how improvements in health are associated with changes in performance ratings.67,68
Additional measures of employee performance exist, but they vary by industry, organization and position. Organizations need to ask themselves what are the known performance standards for a job/position. For example, consider the job of a cabinet maker. There is the expectation of a worker or team to produce a number of cabinets, but the highest performing employees and teams will produce a cabinet to an expected level of quality while observing appropriate time constraints and safety standards. In some organizations there are clearly defined “key performance

www.hero-health.org www.populationhealthalliance.org63
indicators” (KPIs) for every job/position but in many organizations the expectations of each worker is not clearly documented. In the case where KPI data are communicated and captured organizations need to begin to tie that data to employee health and EHM initiatives to understand what influences performance. For organizations that do not have established KPIs for each job/position, an important starting point for measurement may be to establish them. Indeed, establishing such clear expectations for each employee might alone serve as an intervention to improve employee performance.
Such objective measurement is more difficult for organizations that are largely comprised of knowledge workers where expected outputs might be approved patents, sales quotas, research produced, new product development, or percent of market share gained specific to one product line. This is an area that would benefit from the creation of relevant measurement standards, possibly based on specific job types, organization types, or industry types.
Future Areas for Development
What complicates measurement of employee performance is the reality that individual performance is aggregated across groups of employees to drive team performance, business unit performance, and organizational performance.69 These different levels of measurement likely require new definitions and metrics. The recommendations in the Guide focus on the areas of measurement best supported by the current industry research. Future versions of the Guide should seek to expand upon these recommendations to more comprehensively capture the productivity outcomes associated with movement from typical to optimal levels of employee health.
In addition, it was noted above how most EHM productivity measurement tools focus on measuring health impacts on TAW and PLAW. To truly understand the role of employee health in productivity and performance outcomes, it may be necessary to link productivity and performance data to non-health data as well as employee health assessment data. For example, it is important to understand the role of work relationships, personal stress, financial stress, job demands, employee locus of control, and other factors that are not included in typical health status measurement tools or strategies.
Recently, the Well-Being Assessment for Productivity has been developed to address a more comprehensive set of contributors to PLAW and to support research on the interaction between personal and work influences of PLAW.70 The 12-item tool was validated against the HPQ and WPAI tools summarized above, and has also been used in longitudinal studies on the association between employee
well-being and productivity outcomes.71,72 This tool is associated with a broad view of employee well-being, which goes beyond traditional measures of lifestyle health behaviors and health status. Employers may benefit from this tool if they wish to more comprehensively measure both the health and non-health factors associated with worker productivity.
In addition, another new self-report tool, the Individual Work Performance Questionnaire [IWPQ], has been introduced that measures individual work productivity. This tool assesses various dimensions of work productivity including task performance, contextual performance, and counterproductive work behavior.73
The state of measurement in the EHM field will continue to evolve with the introduction of new measurement tools and strategies, making it necessary to update recommendations for measurement. At the same time, it is important for the EHM value proposition to determine the extent to which EHM interventions are associated with changes in the metrics produced by these new tools.
Conclusion
Numerous studies demonstrate a link between health status and productivity and the state of measurement to support this relationship continues to evolve. Early research in the EHM field used administrative or observed work output to demonstrate that individuals with poorer health were absent from work, had higher injury and disability rates, and cost more in terms of reduced work output and increased workers compensation and disability costs. As employers shifted to PTO banks and the nature of employees’ work shifted to more knowledge worker types of jobs, the need for self-report tools increased. Many tools have been developed to measure time away from work and productivity levels while at work. Several have been extensively tested in a variety of occupational settings to confirm the strength of the relationship between health and productivity. New research has helped us understand that while health is a strong driver of absence and productivity, there are other non-health drivers. Emerging measurement tools expand our measurement to include broader measures of employee well-being and other drivers of productivity and performance outcomes. In addition, the limitations of self-report tools have been acknowledged and there is a need for new approaches to measurement that enable employers to measure the gap between the worker that does not report productivity loss and a worker’s optimal level of productivity when they are thriving in all areas of their lives. Better understanding and measurement of this gap represents the next frontier in productivity measurement.

www.hero-health.org www.populationhealthalliance.org64
CHAPTER 7 FOOTNOTESa Dr. John Ratey outlines in his book, “Spark: The Revolutionary New Science of Exercise and the Brain”, the connection between physical activity and cognitive function. Several school-based studies demonstrate how relatively short exercise sessions were linked to student academic performance.b The employee performance continuum applies to productivity at an individual level but performance must also be measured at the team, division, and organizational level. The total performance opportunity is greater than the sum of the individual parts. There is a need to develop new models that incorporate interactions among employees. A more comprehensive view of performance includes aggregation of individual performance as well as additional performance associated with the synergistic outcomes of teams or divisions. Because the continuum was developed with a focus on the individual as the unit of measurement, what is not represented in the “At work but not productive” category is the scenario where an employee is at work and behaving in a way that disrupts the productivity of others around them. If a continuum were developed at the group-level, the influence of individual workers on the productivity of others should be considered.c There is not a single standard definition of presenteeism. According to the Care Continuum Alliance Outcomes Guidelines Report, V5, presenteeism refers to the capacity of an employee to work at his or her optimal level of productivity. This differs from a definition offered by Towers Watson and the National Business group on Health, which defines presenteeism as occurring “when an employee is physically at work but not fully productive due to physical or mental health conditions or due to stress related to job, personal, or financial matters. The latter definition is represented in most industry measurement tools.d For more information on HPQ-Select, go to http://www.ibiweb.org/tools/hpq-selecte While an employee might perceive they are less productive, they may not attribute it to poor physical or mental health. It is possible that health can impact how well an employee is able to manage their work or relate to others and so the employee could attribute productivity loss to excessive job demands or lack of support at work. For this reason, users of self-report tools should rely on the most rigorously validated tools for measurement.
CHAPTER 7 REFERENCES1 Goetzel RZ, Guindon AM, Turshen IJ, Ozminkowski RJ. Health and productivity management: Establishing key performance measures, benchmarks, and best practices. Journal of Occupational and Environment Medicine. 2001;43(1):10-17.2 Davis K, Collins SR, Doty MM, Ho A, Homgren A. Health and productivity among U.S. workers. Issue Brief (Commonwealth Fund). 2005;856:1-10.3 Stewart WF, Ricci JA, Chee E, Morganstein D. Lost productive work time costs from health conditions in the United States: Results from the American Productivity Audit. Journal of Occupational and Environmental Medicine. 2003:45:1234-1246.4 Loepkke L. The value of health and the power of prevention. International Journal of Workplace Health Management. 2008;1(2):95-108.5 Fabius R, Thayer D, Konicki DL, Yarborough CM, Peterson KW, Isaac F, Loeppke RR, Eisenberg BS, Dreger M. The link between workforce health and safety and the health of the bottom line. JOEM. 2013; 55(9):993-1000.6 Integrated Benefits Institute. Linking CFOs to Health and Productivity. Integrated Benefits Institute, San Francisco, CA, 2005.7 Lerner D, Rodday AM, Cohen JT, Rogers WH. A systematic review of the evidence concerning the economic impact of employee-focused health promotion and wellness programs. Journal of Occupational and Environmental Medicine. 2013;55(2):209-222.8 Prassad M, Wahlqvist P, Shikiar R, Shih YT. A review of self-report tools measuring health-related work productivity. Pharmacoeconomics. 2004;22:225-244.9 Integrated Benefits Institute. Workforce Health and Productivity: How Employers Measure, Benchmark, and Use Productivity Outcomes. Riedel and Associates Consultants, Inc and Integrated Benefits Institute, 2011.10 Towers Watson and National Business Group on Health. Pathway to Health and Productivity: 2011/2012 Staying@Work Survey Report. Towers Watson: 2011.11 Integrated Benefits Institute. Linking CFOs to Health and Productivity. Integrated Benefits Institute, San Francisco, CA, 2005.12 Loeppke RR and Hymel PA. Good health is good business. JOEM. 2006;48(5):533-537.13 Ratey JJ. Spark: The Revolutionary New Science of Exercise and the Brain. 2008; Little, Brown and Company: New York, New York.
14 Fabius R, Thayer D, Konicki DL, Yarborough CM, Peterson KW, Isaac F, Loeppke RR, Eisenberg BS, Dreger M. The link between workforce health and safety and the health of the bottom line. JOEM. 2013; 55(9):993-1000.15 Loeppke R, Taitel M, Haufle V, Parry T, Kessler RC, Jinnett K. Health and productivity as a business strategy: a multiemployer study. JOEM. 2009;51(4):411.428.16 Care Continuum Alliance. Outcomes Guidelines Report v5. Care Continuum Alliance: 2010.17 Towers Watson and National Business Group on Health. Pathway to Health and Productivity: 2011/2012 Staying@Work Survey Report. Towers Watson: 2011.18 Peters LH, O’Connor EJ. Situational constraints and work outcomes: the influences of a frequently overlooked construct. Academy of Management Review. 1980;5:391-397.19 Spector PE, Jex SM. Development of four self-report measures of job stressors and strain: Interpersonal Conflict at Work Scale, Organizational Constraints Scale, Quantitative Workload Inventory, and Physical Symptoms Inventory. Journal of Occupational Health Psychology. 1998;3:356-367.20 Gibbons J. Employee Engagement—A Review of Current Research and Its Implications. The Conference Board, Report No. E-0010-06-RR, 2006.21 Csikszentmihalyi M. Flow: The Psychology of Optimal Experience. 1990. Harper Collins: New York.22 Saks A. Antecedents and consequences of employee engagement. Journal of Managerial Psychology. 2006;21(7):600-619.23 Eisenberger R, Armeli S, Rexwinkel B, Lynch PD, Rhoades L. Reciprocation of perceived organizational support. Journal of Applied Psychology. 86:42-51.24 Crawford ER, LePine JA, Rich BL. Linking job demands and resources to employee engagement and burnout: a theoretical extension and meta-analytic test. Journal of Applied Psychology. 95(5):834-848.25 Baranowski T, Perry CL, Parcel GS. How individuals, environments, and health behaviors interact. In: K Glanz, BK Rimer, F Marcus (Eds.), Health Behavior and Health Education, 3rd Edition. 2002.26 Gallup. State of the American Workplace: Employee Engagement Insights for U.S. Business Leaders. 2013. Available at http://www.gallup.com/strategicconsulting/126806/Q12-Meta-Analysis.aspx27 Rummler GA, Brache AP. Improving Performance: How to Manage the White Space on the Organization Chart, 2nd Ed. 1995; Jossey-Bass Publishers: San Francisco.28 Merrill RM, Aldana SG, Pope JE, Anderson DR, Coberley DR, Whitmer RW; HERO RSS. Presenteeism according to healthy behaviors, physical health, and work environment. Population Health Management. 2012;15(5):293-301.29 Hemp P. Presenteeism—at work but out of it. Harvard Business Review. October 2004.30 Burton WN, Morrison A, Wertheimer AI. Pharmaceuticals and worker productivity loss: A critical review of the literature. Journal of Occupational and Environmental Medicine. 2003;45:610-621.31 Stewart WF, Ricci JA, Chee E, Morganstein D, Lipton R. Lost productive time and cost due to common pain conditions in the US workforce. JAMA. 2003;290:2443-2454.32 Burton WN, Conti DJ, Chen C, Schultz AB, Edington DW. The role of health risk factors and disease on worker productivity. Journal of Occupational and Environmental Medicine. 1999;41:863-877.33 Wright DW, Beard MJ, Edington DW. Association of health risks with the cost of time away from work. Journal of Occupational and Environmental Medicine. 2002;44:1126-1134.34 Boles M, Pelletier B, Lynch W. The relationship between health risks and productivity. Journal of Occupational and Environmental Medicine. 2004;46:737-745.35 Burton WN, Chen CY, Conti DJ, Schultz AB, Pransky G, Edington D. The association of health risks with on-the-job producitivity. Journal of Occupational and Environmental Medicine. 2005;47(8):769-777.36 Serxner SA, Gold DB, Burltman KK. The impact of behavioral health risks on worker absenteeism. Journal of Occupational and Environmental Medicine. 2001;43:347-354.37 Pelletier B, Boles M, Lynch W. Change in health risks and productivity over time. Journal of Occupational and Environmental Medicine. 2004;46:737-745.38 Burton WN, Chen CY, Conti DJ, Schultz AB, Edington DW. The association between health risk change and presenteeism change. Journal of Occupational and Environmental Medicine. 2006;48(3):252-263.

www.hero-health.org www.populationhealthalliance.org65
39 Sears LE, Shi Y, Coberley CR, Pope JE. Overall well-being as a predictor of health care, productivity, and retention outcomes in a large employer. Population Health Management. 2013;16. E-Pub published ahead of print. Available at http://www.ncbi.nlm.nih.gov/pubmed/2348036840 Shi Y, Sears LE, Coberly CR, Pope JE. The association between modifiable well-being risks and productivity: A longitudinal study in a pooled employer sample. Journal of Occupational and Environmental Medicine. 2013;55(4):353-364.41 Lerner D, Rodday AM, Cohen JT, Rogers WH. A systematic review of the evidence concerning the economic impact of employee-focused health promotion and wellness programs. Journal of Occupational and Environmental Medicine. 2013;55(2):209-222.42 National Business Group on Health. Employer Measures of Productivity, Absence, and Quality (EMPAQ). Available at http://www.empaq.org/43 Lynch W, Riedel JE. Measuring Employee Productivity: A Guide to Self-Assessment Tools. 2001; William M. Mercer and Institute for Health and Productivity Management.44 Mattke S, Balakrishnan A, Bergamo G, Newberry SJ. A review of methods to measure health-related productivity loss. American Journal of Managed Care. 2007;13:211-217.45 Pronk, NP. Assessment tools for employee productivity. In: Pronk, N.P., Editor. ACSM’s Worksite Health Handbook, Second Edition. A Guide to Building Healthy and Productive Companies. Human Kinetics, Champaign, IL. 2009; Chapter 18.46 Loeppke R, Hymel PA, Lofland JH, Pizzi LT, Konicki DL, Anstadt GW, Baase C, Fortuna J, Scharf T, ACOEM Expert Panel. Health-related workplace productivity measurement: general and migraine-specific recommendations from the ACOEM Expert Panel. JOEM. 2003;45(4):349-359.47 Lynch W, Riedel JE. Measuring Employee Productivity: A Guide to Self-Assessment Tools. 2001; William M. Mercer and Institute for Health and Productivity Management.48 Lerner D, Amick BC, Rogers WH, Malspeis S, Bungay K, Cynn D. The Work Limitations Questionnaire. Medical Care. 2001;39(1):72-85. Information available at http://icrhps.tuftsmedicalcenter.org/research/thi/wlq.asp49 Kessler RC, Barber C, Beck A, Berglund P, Cleary PD, McKenas D, Pronk N, Simon G, Stang P, Ustun TB, and Wang P. The World Health Organization Health and Work Performance Questionnaire (HPQ). Journal of Occupational and Environmental Medicine. 2003:45(2), 156-174.50 Reilly MC, Zbrozek AS, Dukes EM. The validity and reproducibility of a work productivity and activity impairment instrument. PharmacoEconomics 1993;4(5):353-65. Information available at http://www.reillyassociates.net51 Lynch W, Riedel JE. Measuring Employee Productivity: A Guide to Self-Assessment Tools. 2001; William M. Mercer and Institute for Health and Productivity Management.52 Pronk, NP. Assessment tools for employee productivity. In: Pronk, N.P., Editor. ACSM’s Worksite Health Handbook, Second Edition. A Guide to Building Healthy and Productive Companies. Human Kinetics, Champaign, IL. 2009; Chapter 18.53 Loeppke R, Hymel PA, Lofland JH, Pizzi LT, Konicki DL, Anstadt GW, Baase C, Fortuna J, Scharf T, ACOEM Expert Panel. Health-related workplace productivity measurement: general and migraine-specific recommendations from the ACOEM Expert Panel. JOEM, 2003;45(4):349-359.54 Lofland JH, Pizzi L, Frick KD. A review of health-related workplace productivity loss instruments. Pharmacoeconomics. 2004;22(3):165-184.55 Loeppke R, Hymel PA, Lofland JH, Pizzi LT, Konicki DL, Anstadt GW, Baase C, Fortuna J, Scharf T, ACOEM Expert Panel. Health-related workplace productivity measurement: general and migraine-specific recommendations from the ACOEM Expert Panel. JOEM. 2003;45(4):349-359.56 Loeppke R, Hymel PA, Lofland JH, Pizzi LT, Konicki DL, Anstadt GW, Baase C, Fortuna J, Scharf T, ACOEM Expert Panel. Health-related workplace productivity measurement: general and migraine-specific recommendations from the ACOEM Expert Panel. JOEM. 2003;45(4):349-359.
57 Loeppke R, Hymel PA, Lofland JH, Pizzi LT, Konicki DL, Anstadt GW, Baase C, Fortuna J, Scharf T, ACOEM Expert Panel. Health-related workplace productivity measurement: general and migraine-specific recommendations from the ACOEM Expert Panel. JOEM. 2003;45(4):349-359.58 Brooks A, Hagen SE, Sathyanarayanan S, Schultz A, Edington DW. Presenteeism: Critical issues. Journal of Occupational and Environmental Medicine. 2010;52(11):1055-1067.59 Mattke S, Balakrishnan A, Bergamo G, Newberry SJ. A review of methods to measure health-related productivity loss. American Journal of Managed Care. 2007;13:211-217.60 Mayson S, Barrett R. The science and practice of HRM in small firms. Human Resource Management Review. 2006;4:447-455.61 Langdon D. Aligning Performance: Improving People, Systems, and Organizations. 2000; Jossey Bass-Pfeiffer: San Francisco, California.62 Backes-Geller U, Veen S. The impact of aging and age diversity on company performance. January 2, 2009. Available at http://ssrn.com/abstract=134689563 Nicholson S, Pauly MV, Polsky D, Sharda C, Szrek H, Berger ML. Measuring the effects of work loss on productivity with team production. Health Economics. 2006;15(2):111-123.64 Mattke S, Balakrishnan A, Bergamo G, Newberry SJ. A review of methods to measure health-related productivity loss. American Journal of Managed Care. 2007;13:211-217.65 Brooks A, Hagen SE, Sathyanarayanan S, Schultz A, Edington DW. Presenteeism: Critical issues. Journal of Occupational and Environmental Medicine. 2010;52(11):1055-1067.66 Nicholson S, Pauly MV, Polsky D, Sharda C, Szrek H, Berger ML. Measuring the effects of work loss on productivity with team production. Health Economics. 2006;15(2):111-123.67 Sears LE, Shi Y, Coberley CR, Pope JE. Overall well-being as a predictor of health care, productivity, and retention outcomes in a large employer. Population Health Management. 2013;16. E-Pub published ahead of print. Available at http://www.ncbi.nlm.nih.gov/pubmed/2348036868 Shi Y, Sears LE, Coberly CR, Pope JE. The association between modifiable well-being risks and productivity: A longitudinal study in a pooled employer sample. Journal of Occupational and Environmental Medicine. 2013;55(4):353-364.69 Groppel J, Wiegand B. A Staircase of Individual and Organizational Health: Bringing the Biology of Business Performance to Life. 2013: Wellness & Prevention, Inc.70 Prochaska JO, Evers KE, Johnson JL, Castle PH, Prochaska JM, Sears LE, Rula EY, Pope JE. The Well-Being Assessment for Productivity: A well-being approach to presenteeism. Journal of Occupational and Environmental Medicine. 2011;53(7):735-742.71 Sears LE, Shi Y, Coberley CR, Pope JE. Overall well-being as a predictor of health care, productivity, and retention outcomes in a large employer. Population Health Management. 2013;16. E-Pub published ahead of print. Available at http://www.ncbi.nlm.nih.gov/pubmed/2348036872 Shi Y, Sears LE, Coberly CR, Pope JE. The association between modifiable well-being risks and productivity: A longitudinal study in a pooled employer sample. Journal of Occupational and Environmental Medicine. 2013;55(4):353-364.73 Koopmans L, Bernaards CM, Hildebrandt VH, van Buuren S, van der Beek AJ, de Vet HCW. Development of an individual work performance questionnaire. International Journal of Productivity and Performance Management. 2013;62(1):6-28.

www.hero-health.org www.populationhealthalliance.org66
INTRODUCTION
All employers have finite resources and thus need to prioritize how they allocate these resources to the set of programs encompassed under the rubric of employee health management (EHM).a They must decide whether or not to implement such programs at all, which particular program areas to focus on, whether to provide programs with in-house resources or rely on outside vendors, and if using vendors, which of them best meets their needs. And having gone through this decision making process a first time, they must repeat the process annually and decide whether to maintain or change their EHM strategy.
This question is, how does an employer make informed and knowledgeable decisions across all domains? Two conditions are necessary for this: an understanding of the appropriate set of relevant metrics of EHM programs, and a sound approach to understanding and interpreting the metrics. The first condition is addressed in the previous chapters of this document. Each chapter identifies and defines a specific set of metrics and tools within particular domains: financial outcomes, health impact, participation, satisfaction, productivity and performance and organizational support. The second condition, an approach to understanding and interpreting these metrics, is addressed in this chapter. That approach is designated the Value on Investment Framework.
Before proceeding, one final remark: This is not a prescriptive undertaking. This document does not intend to instruct an individual employer on whether, how or what EHM programs to implement. The document will not offer standards or benchmark that programs are expected to meet. Subsequent iterations of this document may move in this direction, but for the present the emphasis will be on the process rather than on applying and meeting specific standards.
Return on Investment vs. Value on Investment
If there is a default approach to evaluating EHM programs, it is the measurement of return on investment (ROI). An ROI measurement calculates how much money was saved (through reduced health care spending) as a result of an EHM program as compared to how much money was
spent on the program. The ROI convention expresses the result as a ratio: $saved:$spent. Thus, ROI calculations are interpreted as, for example:
0.75:1 (75 cents were saved for every dollar spent)
3.27:1 (Three dollars and 27 cents were saved for every dollar spent)
1:1 (The program broke even—one dollar saved for one dollar spent)
There is no doubt that the ROI evaluation will continue to be relied upon in the future. But it is felt that it is, by itself, an inadequate and incomplete measure of an EHM program’s performance. These inadequacies and limitations include:
• Reliance upon a single outcome: dollar savings. Yes, it is important if health care costs are reduced, but there are many, many other possible outcomes of value that may result from an EHM program. These should be identified and measured in any comprehensive program evaluation.
• The presumption that a program has failed if it fails to produce a positive ROI. There is no rule that states that an ROI must be greater than 1:1, but the expectation is created that any program failing to pay for itself is a poor value. Almost none of the $3 trillion spent annually on healthcare satisfies the positive ROI standard.
• The creation of a false sense of precision and certainty. As shown above, an ROI calculation will generally return a result with two or three significant figures. While an ROI calculation might yield a figure of 3.27:1, the methods used for this calculation (particularly for the numerator) are far more imprecise than is suggested by these figures. ROI values are generally not accompanied by confidence intervals, but if they were they would likely be very wide and include values less than 1.
• The creation of the incentive to maximize ROI. The simplest way to insure a large, positive ROI is to simply make a very small investment. But this may leave many unmet needs that could be effectively addressed by a more costly program with a lower ROI.
CHAPTER 8: VALUE ON INVESTMENT FRAMEWORK
Craig F. Nelson, DC, MS, and David Veroff, MPP

www.hero-health.org www.populationhealthalliance.org67
This project has adopted the term, “value on investment” (VOI)1 to refer to its overall evaluation framework. What is the difference between ROI and VOI? First, the VOI framework uses the conventions of cost-effectiveness analyses (CEA). A CEA expresses its results in terms of the cost per unit of outcome. The numerator therefore represents the cost component and the denominator, the outcome. (This is the opposite of an ROI ratio.) CEA analytic techniques can be arcane and abstruse but the central idea is quite simple and straightforward: How to get the most bang for the buck. Beyond this simple exposition, the following principles are invoked to create this VOI framework.
VOI Framework Principles
• To emphasize the entire range of outcomes that might add value. In addition to reducing health care costs, EHM programs have the potential to: improve employee productivity and performance; improve employee job satisfaction; reduce modifiable risk factors; improve health outcomes; increase employee retention; and enhance employee recruiting. All of these potential outcomes are accounted for in the VOI framework.
• To emphasize the entire range of costs that might be incurred. Most costs are obvious (e.g., vendor fees, incentive costs) but many are not. This chapter describes cost inputs that may well be overlooked.
• To emphasize that purchasers are entitled to decide what they think is important. As stated above, this endeavor does not intend on being prescriptive. Different employers, in different industries, with different financial circumstances and with different organizational values and culture will inevitably have different priorities for EHM outcomes. This framework permits (indeed, encourages) employers to express these priorities and preferences.
• To emphasize that purchasers are entitled to decide what calculations they think are credible or not credible. There are several commonly practiced financial (e.g., trend analysis) and productivity (e.g., presenteeism) measurement methods that may engender among employers valid concern as to their legitimacy and accuracy. The VOI framework allows this concern to be registered and factored into the analysis.
• To express valuations in a manner that is intuitively appealing and understandable. If we observe on one corner a filling station selling gas for $3.45/gallon and
across the street another selling it for $3.35/gallon, no special instructions or training are required to correctly select the better value. The VOI framework endeavors to produce an equally transparent result.
• To express valuations in a manner that permits apples to apples comparisons among various program options. When comparable programs are being considered, say, for smoking cessation, it should be possible to compare these programs side-by-side to establish which provides the greater value. Such comparisons are permitted by the VOI framework.
• To be flexible enough to accommodate all varieties and combinations of PHM programs. The VOI framework can be applied to any type of EHM program, whether provided in-house or by a vendor.
It must be emphasized that taking a VOI approach does not preclude performing an ROI calculation if such is desired. Simply by reversing the numerator and denominator (for monetized outcomes) a conventional ROI ratio will be created.
Operationalizing the VOI Framework
The use of the term “Framework” in this context is deliberate. It describes a scaffolding, a superstructure upon which a complete analysis can be constructed. Completing the process requires specific actions and procedures. A template for this is described below.
1. Calculate input costs. This chapter describes and defines the input costs of EHM programs. These costs are categorized as follows:
A. Direct Costs1. Program Fees (from Vendor/Partner)2. Incentives
B. Indirect Costs1. Worksite infrastructure2. Employer FTE (implementation)3. Employee time (bio-med screening, etc.)4. Organizational support
Direct costs and indirect costs can be directly or readily monetized. Thus total program costs, in dollars, can be calculated. Depending upon the context, this amount might be expressed as a grand total sum (e.g., $350,000), as a PMPM amount (e.g., $12.25), as a PMPY amount (e.g., $135.00), as a case rate or any permutations of these that make sense. Once calculated, these monetized inputs will remain constant throughout the analysis.
www.hero-health.org www.populationhealthalliance.org68
2. Consider and review the full range of possible outcomes. In Chapters 2–7, the various outcome components are described and defined. These outcomes include:
• Financial outcomes (medical cost savings)• Participation
- Rates- Intensity
• Health behaviors (modifiable risk factors)• Health status• Biometric variables• Productivity/performance• Satisfaction
- Employer- Member/participant
For each of these outcome domains there are core metrics that are described in their respective chapters.
3. From this set of outcome variables consider which are most salient and measurable. Different programs are focused on different outcomes. For a smoking cessation program one will want to know, say, quit rates at 6 months; for a weight loss program, reduction in BMI; minutes per week of active exerciser for a fitness program, etc.
4. From this set of outcome variables consider which are most important given your organization’s values and culture. The question to ask oneself is: Why are we implementing this program? Possible answers might be: To control/reduce healthcare costs; To improve employee productivity; To act on our responsibility to improve employees’ health; To enhance our reputation as having a healthy workplace; To attract healthier employees to our company. In addressing #3 and #4 it should become clear what outcome measures need to be measured and emphasized.
5. For potentially monetized outcomes (primarily healthcare costs and productivity measures) consider and evaluate the rigor with which they are measured. The measuring of monetized input costs is straightforward. Not so with the monetized outcomes. When calculating, for example, healthcare cost savings one is attempting to establish the causal relationship between a discrete EHM program and changes in healthcare spending. The methodological challenges to doing so are considerable. In the end all such measurements can only be considered estimates with varying degrees of precision and certainty. The employer may wish to discount these measures depending up the rigor and reliability of the measurement.
6. Compile a final set of outcome variables of interest integrating appropriate coefficients for precision and
priority. The sponsors of the EHM program should now have a clear idea of what outcomes to measure and evaluate and how to balance these outcomes against each other. For this formulation we will use this symbol - ⌊PC⌋ - to represent the Precision and Certainty Coefficient, a value between zero and 1. If one chose to accept the full value of the cost calculation, a 1 would be entered. A number less than 1 would be entered (to be determined using the collective judgment of interested and informed parties) if this value was to be discounted. We will use this symbol - ⌈#⌉ - to represent the priority assigned to the outcome. This may be used as an actual coefficient or may simply be used as an indicator of stated priorities. These outcomes will represent the denominators in a CEA ratio.
7. Having executed the steps above, create the appropriate CEA ratios. The above steps will have resulted in: a) A numerator representing total program costs in dollars, expressed in whatever manner is most appropriate; and b) A denominator(s) representing one or more of the outcome domains, expressed using the appropriate core metrics. Using the numerator and these denominators, we can now assemble a complete CEA ratio(s). These ratios will reflect how many dollars were spent for each unit of outcome. With this information in hand, the employer is now in a position to make informed decisions concerning the various value propositions offered by disparate EHM programs and the efficiency with which those values are achieved.
Input Costs
In order to assess the value of employee health management programs, it is essential to understand the full spectrum of costs associated with these programs. These input costs represent the investment employers make in promoting and managing employee health in addition to health insurance provision and mandated health and safety measures. Because employee health programs, as noted in other sections of the Guide, have highly variable implementation and ongoing support structures, a very wide array of cost variables need to be considered in assessing input costs. Further, it is essential to consider not just the tangible and direct costs of employee health management programs, but intangible costs. While some of these cost variables can be difficult to quantify, it is helpful to consider all the variables at least in a qualitative way to help assess the overall value on investment of these programs.
On the following page we articulate the range of input costs that should be considered in assessing program value. These include direct costs, indirect costs, and tangential costs.

www.hero-health.org www.populationhealthalliance.org69
Direct Costs
Direct costs represent out-of-pocket costs paid to external parties. These costs comprise of program fees and costs for incentives. More detail on both these topics is provided in the following section.
Program Fees
Direct costs are those expenses paid directly by the employer to either an outside vendor for program products and services or to the employee in the form of incentives. In this context, these programs costs are assumed to be beyond basic employer-sponsored health insurance and beyond mandated health and safety measures. Thus, all these programs and costs are optional. The expectation by employers is that the additional costs that these programs represent will return meaningful benefits to the employer, to the employee or both.
The list below represents the range of programs that are considered as direct costs. This list is intended to be as comprehensive as possible but there may well be program types (and certainly combinations of programs) that have not here been anticipated. Programs eligible to be considered in this analysis are not therefore limited to those listed here.
• Included Program Types
1. Classic Disease Management or Chronic Condition Managementa. Chronic Obstructive Pulmonary Diseaseb. Asthmac. Congestive Heart Failured. Coronary Artery Diseasee. Diabetes
2. Case Management3. Medication Adherence4. Biometric Screening5. Employee Assistance Programs 6. Stand Alone Health Risk Assessment (HRA)7. Classic Wellness (Including telephonic coaching, online
resources) a. HRAb. Weight Managementc. Smoking Cessationd. Physical Activitye. Dietf. Stress Managementg. Other
8. Fitnessa. On-site Facilityb. Club Discountsc. Fitness Products
9. Decision Assistance10. Triage/nurse line11. Injury prevention program12. Second opinion services13. Concierge services14. On-site clinics
a. Vaccinationsb. Biometric measurementc. Basic primary care services
15. Remote monitoring program16. Ergonomic/back health program17. Other high risk/high cost condition support programs
a. Maternityb. Oncologyc. Radiologyd. Readmission preventione. Depression/mental healthf. Cost transparency programsg. Provider support programs
• Cost Calculations. By their nature, program costs are all measured directly in dollars and cents. The exact amounts should be readily accessible from invoices, contract language, human resources documents, budget line items and other company or vendor documents. Program costs may be expressed in a variety of ways. These include:
1. Per Member Per Month rate (with or without dependents)
2. Per Member Per Year rate (with or without dependents)3. Case Rate4. Capital costs (e.g., on-site fitness center costs)5. FTE costs (e.g., for on-site fitness center or onsite clinic.
See Chapter 2 for discussion.)6. Licensing fees7. Consulting costs (time and materials)8. One-time, front-loaded implementation costs
Incentives
Any reward designed to impact initial or continued participation in employer-sponsored health and wellness related activities and/or a desired health behavior or clinical outcome (such as cholesterol level below a certain level). Incentives fall into three general groups:

www.hero-health.org www.populationhealthalliance.org70
1. Cash, including gift cards,2. Benefit design incentives including a premium discount,
HSA/HRA/FSA contributions, access to a more generous health plan
3. Merchandise, token gifts (minimal monetary value).
• How Incentives Are Monetized. Monetization of incentives is defined as the cost of the incentive + any applicable employer based taxes. The cost of incentive is the per-unit cost of incentive multiplied by the number of people who receive the incentive.
The exception is with a disincentive. A disincentive is used where a person incurs charges based on non-participation or non-attained goals (in outcome based incentive strategies). When monetizing a disincentive, the cost is based on those who are compliant and do not incur the disincentive. For example, smokers are charged $100 a year in higher premium for continuing to smoke or not participating in a smoking cessation program. An employer has a total of 5,000 employees, 1,000 who incur the charge and 4,000 who do not. The monetary variable is the cost of your non-smoking population (the 4,000) who as an employer you will pay an additional $100 per employee in premium, as compared to the smokers. In this example, the cost will be 400,000. However, if the disincentive is created in such a way to be budget neutral, meaning that the charge on the smokers will cost the cost of the additional cost for the non-smoking population, the cost will be zero.
• Data Source. Incentive dollar value will be attained either from internal HR and Benefits managers, or if the program runs through a vendor, the vendor.
• Barriers to Data Collection. Data collection for incentive eligibility is likely the biggest challenge, depending on the activity or set of activities that are being incentivized.
• Measurement Characteristics. All incentives are distilled to dollar value.
Indirect Costs
Indirect costs represent out-of-pocket costs that are generally accounted for in existing operations of the employer. Table 8 provides details on the types of indirect costs, provides a definition of them, and describes how to monetize these costs, data sources, barriers to data collection and measurement characteristics.

www.hero-health.org www.populationhealthalliance.org71
IND
IREC
T C
OST
SD
EFIN
ITIO
NH
OW
TO
MO
NET
IZE
DAT
A S
OU
RC
EB
AR
RIE
RS
TO D
ATA
C
OLL
ECT
ION
MEA
SUR
EMEN
T
CH
AR
AC
TER
IST
ICS
EMPL
OY
EE T
IME
Empl
oyee
tim
e is
defi
ned
as e
mpl
oyee
s de
dica
ted
to d
evel
opm
ent/
plan
ning
, im
plem
enta
tion
and
st
affin
g of
hea
lth
impr
ovem
ent/
wel
lnes
s pr
ogra
ms.
Type
s of
em
ploy
ees
incl
uded
: be
nefit
s m
anag
ers
who
de
sign
the
pro
gram
, w
elln
ess
dire
ctor
s/
man
ager
s, on
-site
fitn
ess
cent
er s
taff,
wel
lnes
s ch
ampi
ons
and
co
mm
unic
atio
ns s
taff
tim
e de
dica
ted
to
com
mun
icat
ing
empl
oyer
pr
ogra
ms
to e
mpl
oyee
s.
The
tot
al e
mpl
oyee
tim
e in
vest
men
t in
hea
lth im
prov
emen
t is
equ
al t
o th
e su
mm
atio
n of
the
sal
ary,
bene
fits
va
luat
ion
and
stan
dard
ove
rhea
d ch
arge
for
each
em
ploy
ee w
ho w
orks
on
hea
lth im
prov
emen
t pr
ogra
ms.
For
empl
oyee
s de
dica
ted
100%
to
heal
th im
prov
emen
t pr
ogra
ms,
the
mon
etar
y va
lue
is e
qual
to
the
tota
l co
mpe
nsat
ion.
For
em
ploy
ees
de
dica
ted
to h
ealth
impr
ovem
ent
less
th
an 1
00%
of t
he t
ime,
em
ploy
ers
will
nee
d to
det
erm
ine
the
hour
s de
dica
ted
to h
ealth
impr
ovem
ent
and
divi
de t
hat
by t
otal
hou
rs. T
hen
em
ploy
ers
will
nee
d to
tak
e th
at
frac
tion
and
mul
tiple
it b
y th
e
com
pens
atio
n th
e em
ploy
ee r
ecei
ves.
Empl
oyee
Tim
e =
Empl
oyee
1’s
annu
al s
alar
y
+
bene
fits
valu
atio
n
+
stan
dard
ove
rhea
d ch
arge
for
the
empl
oyee
* po
rtio
n of
ann
ual w
ork
hour
s th
at p
erso
n sp
ends
on
heal
th
impr
ovem
ent
prog
ram
s
+
Empl
oyee
2’s
hour
ly s
alar
y+
bene
fits
valu
atio
n +
st
anda
rd o
verh
ead
char
ge fo
r th
e em
ploy
ee*
port
ion
of a
nnua
l wor
k ho
urs
that
per
son
spen
ds o
n he
alth
im
prov
emen
t pr
ogra
ms
+
etc.
Ann
ual s
alar
y =
Pay
roll
syst
em.
Ann
ual v
alue
of b
enefi
ts
= Be
nefit
s/H
R D
epar
tmen
t.
Ann
ual s
tand
ard
ov
erhe
ad c
harg
e pe
r em
ploy
ee =
Fin
ance
/ A
ccou
ntin
g D
epar
tmen
t.
Port
ion
of e
mpl
oyee
ti
me
dedi
cate
d to
hea
lth
impr
ovem
ent
prog
ram
s =
Man
ager
of e
mpl
oyee
ca
n in
dica
te t
he p
ortio
n of
the
ir t
ime
dedi
cate
d to
hea
lth im
prov
emen
t pr
ogra
ms.
Bigg
est
barr
ier
is
avai
labi
lity
of d
ata
from
m
ultip
le s
ourc
es a
nd
the
need
to
acco
unt
fo
r al
l em
ploy
ees
w
ho ‘t
ouch
’ hea
lth
impr
ovem
ent
prog
ram
ad
min
istr
atio
n.
Ann
ual s
alar
y is
der
ived
by
taki
ng t
he a
nnua
l sal
ary
of e
ach
empl
oyee
who
pla
ns/d
evel
ops/
adm
inis
ters
/ove
rsee
s he
alth
im
prov
emen
t pr
ogra
ms.
Ann
ual v
alue
of b
enefi
ts is
de
term
ined
by
mon
etiz
ing
the
valu
e of
ben
efits
tha
t em
ploy
ees
rece
ive
from
the
em
ploy
er,
incl
udin
g th
e va
lue
of h
ealth
in
sura
nce
(em
ploy
er p
rem
ium
co
ntri
butio
n as
wel
l as
heal
th
savi
ng a
ccou
nt c
ontr
ibut
ions
), re
tirem
ent
acco
unt
co
ntri
butio
ns, l
ife in
sura
nce,
sh
ort
term
and
long
ter
m
disa
bilit
y be
nefit
s, ac
cide
ntal
de
ath
and
disa
bilit
y in
sura
nce
paym
ents
, tui
tion
re
imbu
rsem
ent,
tran
spor
tatio
n be
nefit
s an
d pr
ofes
sion
al
deve
lopm
ent
cour
ses.
Ann
ual o
verh
ead
char
ge p
er
empl
oyee
is g
ener
ally
de
term
ined
by
the
finan
ce
depa
rtm
ent
annu
ally.
The
ove
r-he
ad c
harg
e re
pres
ents
gen
eral
ch
arge
s or
exp
ense
s
in a
ny b
usin
ess
whi
ch c
anno
t be
cha
rged
up
as b
elon
ging
ex
clus
ivel
y to
any
par
ticul
ar
part
of t
he w
ork
or p
rodu
ct.
The
se in
clud
e: r
ent,
repa
irs,
supp
lies,
depr
ecia
tion,
in
sura
nce,
inte
rest
, leg
al fe
es, e
tc.
Port
ion
of e
mpl
oyee
tim
e
dedi
cate
d to
hea
lth
im
prov
emen
t pr
ogra
ms
is
the
frac
tion
of a
n em
ploy
ee's
annu
al h
ours
tha
t ar
e de
dica
ted
to t
he im
plem
enta
tion,
ad
min
istr
atio
n an
d m
onito
ring
of h
ealth
im
prov
emen
t pr
ogra
ms.
Tabl
e 8:
Indi
rect
Cos
ts o
f EH
M

www.hero-health.org www.populationhealthalliance.org72
IND
IREC
T C
OST
SD
EFIN
ITIO
NH
OW
TO
MO
NET
IZE
DAT
A S
OU
RC
EB
AR
RIE
RS
TO D
ATA
C
OLL
ECT
ION
MEA
SUR
EMEN
T
CH
AR
AC
TER
IST
ICS
CO
MM
UN
ICAT
ION
S PR
INT
/MAT
ERIA
LSC
omm
unic
atio
n is
defi
ned
as t
he u
se o
f mul
tiple
ve
hicl
es/fo
rmat
s to
con
vey
a m
essa
ge o
f inf
orm
atio
n.
Com
mun
icat
ion
vehi
cles
ca
n in
clud
e fly
ers,
post
ca
rds,
digi
tal s
igna
ge,
emai
l, w
ebsi
te, p
ayro
ll st
uffe
rs, F
aceb
ook,
tw
itter
, ot
her
soci
al m
edia
out
lets
, pr
esen
tatio
n, v
ideo
s, po
d ca
sts,
new
slet
ters
, and
m
any
mor
e.
The
tot
al c
ost
of c
omm
unic
atio
n
is e
qual
to
the
cost
of t
he p
rodu
ct
or s
ervi
ce d
eliv
ered
.
Acc
ount
ing
ledg
er fo
r co
mm
unic
atio
n se
rvic
es.
Port
ion
of e
mpl
oyee
tim
e de
dica
ted
to h
ealth
im
prov
emen
t pr
ogra
ms
repo
rted
by
the
prog
ram
m
anag
er o
f em
ploy
ee w
ho
can
indi
cate
the
por
tion
of t
heir
tim
e de
dica
ted
to h
ealth
impr
ovem
ent
prog
ram
s w
hile
sec
urin
g an
nual
sal
ary
from
Pay
roll
syst
em a
nd a
nnua
l val
ue o
f be
nefit
s fr
om B
enefi
ts/H
R
Dep
artm
ent.
The
big
gest
bar
rier
is
accu
rate
ly a
ccou
ntin
g
for
all a
spec
ts o
f co
mm
unic
atio
n to
in
clud
e th
e tim
e fr
om
all e
mpl
oyee
s w
ithin
an
orga
niza
tion
that
are
in
volv
ed in
sha
ring
key
m
essa
ges/
prom
otio
nal
mat
eria
ls, a
s w
ell a
s th
e co
st t
o re
view
/edi
t
mat
eria
ls a
nd t
he c
ost
for
dist
ribu
tion/
post
age.
Com
mun
icat
ions
veh
icle
s di
ffer
in t
heir
cos
ts o
f ser
vice
. W
ebsi
te m
ay in
clud
e th
e co
st
of la
bor
to m
ake
upda
tes,
yet
al
so in
cur
a co
st fo
r m
aint
aini
ng
the
web
site
; the
refo
re
a m
onth
ly r
ecur
ring
fee.
Pri
nt
mat
eria
ls in
clud
e th
e tim
e an
d fe
es o
f the
gra
phic
art
ist,
cost
of
pri
nt m
ater
ials
, dis
trib
utio
n an
d po
stag
e. D
igita
l sig
nage
in
clud
es t
he c
osts
of d
esig
n,
empl
oyee
tim
e in
con
trib
utin
g co
nten
t an
d ed
its, a
nd c
harg
e/fe
e fo
r di
stri
butio
n. E
mai
l cos
ts
incl
ude
the
emai
l ser
vice
ven
-do
r m
onth
ly fe
es, t
he c
osts
of
staf
f to
add
cont
ent
and
mak
e ed
its a
nd t
he d
istr
ibut
ion
time.
Pa
yrol
l stu
ffers
incl
ude
the
cost
of l
abor
to
supp
ort
this
di
stri
butio
n pr
oces
s, as
wel
l as
the
time
to d
esig
n, a
dd c
onte
nt
and
edit
the
mat
eria
ls t
o be
in
clud
ed in
the
pay
roll
di
stri
butio
n, a
long
with
any
ad
ditio
nal d
istr
ibut
ion/
post
age
cost
. Fac
eboo
k, t
witt
er a
nd
othe
r so
cial
med
ia o
utle
ts
incl
ude
the
cost
s of
the
acc
ess/
wir
eles
s ne
twor
k se
rvic
es, t
he
staf
f tim
e fo
r co
nten
t, de
sign
an
d ed
its. P
rese
ntat
ion,
vid
eos
and
pod
cast
s in
clud
e th
e so
ftw
are,
sta
ff tim
e to
incl
ude
the
proc
ess
of d
evel
opm
ent/
desi
gn, a
nd e
dits
as
wel
l as
the
oppo
rtun
ity t
o lo
ad c
onte
nt
onto
a s
erve
r.
Tabl
e 8:
Indi
rect
Cos
ts o
f EH
M (c
ont)

www.hero-health.org www.populationhealthalliance.org73
IND
IREC
T C
OST
SD
EFIN
ITIO
NH
OW
TO
MO
NET
IZE
DAT
A S
OU
RC
EB
AR
RIE
RS
TO D
ATA
C
OLL
ECT
ION
MEA
SUR
EMEN
T
CH
AR
AC
TER
IST
ICS
DAT
A S
YST
EMS
A
ND
REP
ORT
ING
Dat
a sy
stem
s co
nsis
ts
of t
he n
etw
ork
of a
ll
com
mun
icat
ion
chan
nels
us
ed w
ithin
an
or
gani
zatio
n, s
peci
fical
ly
tech
nolo
gy b
ased
to
host
da
ta in
a p
riva
te a
nd
secu
re m
anne
r. D
ata
repo
rtin
g re
fer
to t
he
repo
rts
that
are
ge
nera
ted
by t
he d
ata
sy
stem
. Pro
gram
min
g of
suc
h da
ta e
ntry
and
re
port
ing
is in
clud
ed in
th
e sy
stem
cap
abili
ties
or
an
addi
tiona
l co
nsul
ting
serv
ice
that
m
ay b
e of
fere
d.
The
tot
al c
ost
of t
he d
ata
syst
em is
eq
ual t
o th
e co
st o
f the
sof
twar
e,
hard
war
e, t
rain
ing,
and
cons
ultin
g se
rvic
es t
o in
clud
e an
alyt
ic s
taffi
ng
(ana
lyst
s sp
ecia
lists
, pro
gram
mer
s, et
c.).
The
tot
al d
ata
syst
em c
ost
in
vest
men
t is
equ
al t
o th
e
sum
mat
ion
of t
he s
oftw
are,
ha
rdw
are,
tra
inin
g, se
rver
m
aint
enan
ce, s
oftw
are
upgr
ades
, an
d co
nsul
tativ
e se
rvic
es, p
lus
any
addi
tiona
l mai
nten
ance
fees
or
upg
rade
cos
ts.
Acc
ount
ing
ledg
er fo
r co
nsul
ting
serv
ices
, sof
t-w
are,
and
oth
er v
aria
bles
lis
ted
abov
e. P
ortio
n of
em
ploy
ee t
ime
dedi
cate
d to
hea
lth im
prov
emen
t pr
ogra
ms
= M
anag
er o
f em
ploy
ee c
an in
dica
te t
he
port
ion
of t
heir
tim
e
dedi
cate
d to
hea
lth
impr
ovem
ent
prog
ram
s an
d se
cure
Ann
ual s
alar
y fr
om P
ayro
ll sy
stem
and
A
nnua
l val
ue o
f ben
efits
fr
om B
enefi
ts/H
R
Dep
artm
ent.
Bigg
est
barr
ier
is
accu
rate
ly a
ccou
ntin
g fo
r al
l asp
ects
of d
ata
to in
clud
e th
e tim
e fr
om a
ll em
ploy
ees
with
in a
n or
gani
zatio
n th
at a
re in
volv
ed in
co
llect
ing
and
secu
ring
da
ta, a
s w
ell a
s th
e co
st t
o re
view
and
re
spon
d to
rep
orts
an
d id
entif
y di
rect
ion
for
cont
inue
d us
e.
Dat
a sy
stem
cos
t is
der
ived
by
tak
ing
the
annu
al c
ost
of t
he d
ata
syst
em, i
nclu
sive
of
sof
twar
e, h
ost
serv
er,
cons
ultin
g/an
alyt
ic fe
es,
empl
oyee
tim
e fo
r re
view
.
CO
NT
RA
CT
PE
RSO
NN
ELC
ontr
act
pers
onne
l tim
e is
defi
ned
as c
ontr
act
empl
oyee
s de
dica
ted
to im
plem
enta
tion
and
staf
fing
of h
ealth
im
prov
emen
t/w
elln
ess
prog
ram
s th
at a
re n
ot
bene
fit e
ligib
le
empl
oyee
s of
an
orga
niza
tion.
Con
trac
t st
atus
will
hav
e to
be
defin
ed b
y th
e IR
S re
gula
tions
and
can
be
one
of m
any
cate
gori
es o
f co
ntra
ct (
sole
pro
prie
tor
or c
ontr
acte
d th
roug
h a
heal
th m
anag
emen
t ve
ndor
). Ty
pes
of c
ontr
act
pers
onne
l inc
lude
: wel
lnes
s di
rect
ors/
man
ager
s, on
-site
fitn
ess
cent
er s
taff,
he
alth
coa
ches
, ad
min
istr
ativ
e su
ppor
t, la
bora
tory
tec
hnic
ians
, m
edic
al r
evie
w o
ffice
rs
and/
or c
omm
unic
atio
n sp
ecia
lists
.
The
tot
al c
ontr
act
pers
onne
l tim
e in
vest
men
t in
hea
lth im
prov
emen
t is
eq
ual t
o th
e su
mm
atio
n of
the
fees
fo
r co
ntra
cted
per
sonn
el. A
dditi
onal
fe
es m
ay in
clud
e tr
avel
rel
ated
cos
ts,
mile
age
reim
burs
emen
t, et
c.
Acc
ount
ing
ledg
erBi
gges
t ba
rrie
r is
ac
cura
tely
acc
ount
ing
for
all a
spec
ts o
f co
ntra
ct s
taffi
ng t
o in
clud
e th
e tim
e fr
om
all e
mpl
oyee
s w
ithin
an
orga
niza
tion
that
are
in
volv
ed in
ove
rsee
ing
the
cont
ract
sta
ff,
com
plet
ing
the
agre
emen
ts, s
ubm
ittin
g m
onth
ly in
voic
es, a
nd
secu
ring
a b
udge
t fo
r se
rvic
es.
A s
umm
ary
of c
osts
to
incl
ude
a lis
ting
of e
ach
cont
ract
pe
rson
nel,
serv
ices
ren
dere
d an
d tim
e m
ultip
lied
by t
he
cost
of s
ervi
ce b
y co
ntra
ct
pers
onne
l. C
ontr
act
pers
onne
l co
sts
are
usua
lly d
eter
min
ed
by in
clud
ing
the
actu
al c
osts
of
sal
ary
and
bene
fits
plus
an
adm
inis
trat
ive
over
head
fee.
M
ileag
e is
usu
ally
rei
mbu
rsed
by
the
IRS
allo
wab
le a
mou
nt.
Not
e: t
his
may
als
o pr
esen
t in
a m
onth
ly r
etai
ning
fee
or
a pe
r pa
rtic
ipan
t pe
r ye
ar fe
e.
Tabl
e 8:
Indi
rect
Cos
ts o
f EH
M (c
ont)

www.hero-health.org www.populationhealthalliance.org74
IND
IREC
T C
OST
SD
EFIN
ITIO
NH
OW
TO
MO
NET
IZE
DAT
A S
OU
RC
EB
AR
RIE
RS
TO D
ATA
C
OLL
ECT
ION
MEA
SUR
EMEN
T
CH
AR
AC
TER
IST
ICS
LEG
AL
REV
IEW
Lega
l rev
iew
is t
he t
ime
dedi
cate
d to
the
lega
l re
view
of t
he p
rogr
am.
Thi
s in
clud
es t
he n
eed
for
heal
th im
prov
emen
t pr
ogra
ms
to b
e in
co
mpl
ianc
e w
ith H
IPA
A
guid
elin
es, E
EOC
gui
de-
lines
, AD
A g
uide
lines
and
m
ore.
Con
trac
t st
atus
will
ha
ve t
o be
defi
ned
by t
he
IRS
regu
latio
ns a
nd c
an b
e on
e of
man
y ca
tego
ries
of
cont
ract
(so
le p
ropr
ieto
r or
con
trac
ted
thro
ugh
a he
alth
man
agem
ent
vend
or).
Type
s of
lega
l pe
rson
nel i
nclu
de:
atto
rney
s, pa
rale
gals
, an
d ad
min
istr
ativ
e st
aff
mem
bers
.
The
tot
al le
gal p
erso
nnel
tim
e in
vest
men
t in
hea
lth im
prov
emen
t is
equ
al t
o th
e su
mm
atio
n of
the
fe
es fo
r co
ntra
cted
per
sonn
el.
Add
ition
al fe
es m
ay in
clud
e tr
avel
-rel
ated
cos
ts, m
ileag
e re
imbu
rsem
ent,
etc.
A m
onth
ly
reta
iner
fee
may
als
o be
ass
umed
.
Acc
ount
ing
ledg
erBi
gges
t ba
rrie
r is
ac
cura
tely
acc
ount
ing
for
all a
spec
ts o
f leg
al
revi
ew t
o in
clud
e th
e tim
e fr
om a
ll em
ploy
ees
with
in a
n or
gani
zatio
n th
at a
re in
volv
ed in
ov
erse
eing
the
lega
l re
view
pro
cess
.
A s
umm
ary
of c
osts
to
incl
ude
a lis
ting
of e
ach
cont
ract
pe
rson
nel,
serv
ices
ren
dere
d an
d tim
e m
ultip
lied
by t
he c
ost
of s
ervi
ce b
y co
ntra
ct
pers
onne
l. C
ontr
act
lega
l pe
rson
nel c
osts
are
usu
ally
de
term
ined
by
incl
udin
g th
e ac
tual
cos
ts o
f sal
ary
and
bene
fits
plus
an
adm
inis
trat
ive
over
head
fee.
Mile
age
is u
sual
ly
reim
burs
ed b
y th
e IR
S al
low
able
am
ount
. Not
e: t
his
may
als
o pr
esen
t in
a m
onth
ly r
etai
ning
fe
e or
a p
er p
artic
ipan
t pe
r ye
ar fe
e.
FAC
ILIT
Y S
PAC
EFa
cilit
y sp
ace
cons
ists
of
the
spac
e, o
verh
ead
(ren
t, he
atin
g/ai
r, in
sura
nce)
eq
uipm
ent,
supp
lies,
clea
ning
ser
vice
s, an
d po
ssib
ly s
taffi
ng r
elat
ed
to t
he s
pace
for
heal
th
impr
ovem
ent
prog
ram
s.
Spac
e m
ay in
clud
e ex
erci
se r
elat
ed a
reas
, lo
cker
roo
ms,
heal
th
scre
enin
g an
d/or
hea
lth
serv
ice
area
s.
The
tot
al c
ost
of t
he fa
cilit
y is
equ
al
to t
he c
ost
of t
he s
tand
ard
spac
e to
incl
ude
the
rent
or
depr
ecia
tion
cost
s—us
ually
com
pute
d in
sta
ndar
d co
st p
er s
quar
e fo
ot. A
dditi
onal
fa
ctor
s of
cos
ts in
clud
e ut
ility
cos
ts
in d
olla
rs, p
rope
rty
and
liabi
lity
insu
ranc
e ba
sed
on s
quar
e fo
otag
e an
d se
rvic
es p
rovi
ded
with
in t
he
spac
e; c
lean
ing
serv
ices
bas
ed o
n sq
uare
foot
age
and
serv
ices
de
liver
ed; e
quip
men
t co
sts
as w
ell
as o
ngoi
ng m
aint
enan
ce fe
es a
re a
lso
incl
uded
. The
tot
al c
ost
inve
stm
ent
is
equa
l to
the
sum
mat
ion
of t
he s
pace
co
sts,
over
head
, equ
ipm
ent,
supp
lies,
mai
nten
ance
fees
and
add
ition
al
serv
ice
fees
(cl
eani
ng, o
vers
ight
).
Acc
ount
ing
ledg
erBi
gges
t ba
rrie
r is
ac
cura
tely
acc
ount
ing
for
all a
spec
ts o
f spa
ce
to in
clud
e th
e tim
e fr
om a
ll em
ploy
ees
with
in a
n or
gani
zatio
n th
at a
re in
volv
ed
in o
vers
ight
and
ad
min
istr
atio
n of
th
e fa
cilit
y.
Ann
ual c
osts
of s
pace
is d
eriv
ed
by t
akin
g th
e co
sts
base
d on
de
prec
iatio
n in
cos
t pe
r sq
uare
fo
ot. A
nnua
l cos
ts o
f ins
uran
ce
is d
eriv
ed b
y a
cost
per
squ
are
foot
and
incl
udes
gen
eral
and
pr
oper
ty in
sura
nce.
Ann
ual
cost
s of
util
ities
incl
udes
cos
t pe
r un
it of
use
and
is p
rovi
ded
on a
mon
thly
bas
is. A
nnua
l cos
t of
equ
ipm
ent
is t
he c
ost
of t
he
equi
pmen
t an
d in
clud
e th
e an
nual
mai
nten
ance
fees
. A
nnua
l cos
t of
cle
anin
g se
rvic
es
is t
he c
ost
per
squa
re fe
et
with
det
erm
inat
ion
of s
ervi
ces
deliv
ered
. Ann
ual c
ost
of
supp
lies
is t
he c
ost
of a
ny
supp
lies
need
ed in
sup
port
of
the
spa
ce.
Tabl
e 8:
Indi
rect
Cos
ts o
f EH
M (c
ont)

www.hero-health.org www.populationhealthalliance.org75
Tangential Costs
HERO and PHA have identified a set of inputs described as “tangential costs.” This term suggests that these costs are peripheral to an employee health management program, that they are difficult to quantify or even to measure and that their very existence may not be apparent to the employer. Nevertheless, we feel that it is important to highlight these tangential costs and ensure that employers understand their implications. These tangential costs include:
Types of Tangential Costs
• Employee morale. Employees are not uniform in their receptiveness to EHM programs. While some are grateful for the opportunity to improve their health and for access to programs that will help them do so, others find the programs intrusive, coercive and are otherwise simply not interested in participating in the program.
• Company Reputation. Whatever the motivations behind a company’s EHM program, it can be perceived as self-serving, intrusive, overly paternalistic and result in a negative impact on that company’s corporate reputation.
• Legal challenges. While there are a set of laws and regulations that define what is or is not permissible in an EHM program, there remains a considerable amount of uncertainty and legal challenges to EHM are inevitable.
• Selection effects (on employee population). There are two possible effects of EHM programs on the overall makeup of the employee population, one positive, on negative. The positive effect is straightforward: by having a strong EHM program in place a company may attract and retain a healthier cohort of employees whose healthcare costs are lower than would otherwise be the case. There may be a negative impact on the employee population by the limiting effect that EHM programs may have on the pool of potential employees. That is, there may be talented and valuable potential employees who, because of certain elements of an EHM program (e.g., penalties for tobacco use) would not consider working for a company with such programs.
Literature Review
The type of data that would most directly inform this discussion would be something like:
• Measurements of the adverse effects of EHM programs on employee morale and company reputation;
• Monetization of those outcomes;• Rates of complaints/legal challenges to EHM programs;• Measurements of the selection effects (both positive
and negative) of EHM programs.
To date. the review of the literature on this topic has produced very little hard data of this type. What has been identified is mostly in the form of newspaper and other popular media reports of concerns and opposition to EHM programs as well as opinion pieces on the subject.
Preliminary Findings
It is difficult to summarize this body of literature as it comes from disparate sources reflecting different levels of rigor and journalistic standards, but several themes do emerge. The first thing that became clear while investigating these various tangential costs is that the first three (employee morale, company reputation, legal challenges) are significantly impacted by the presence of financial incentives tied to participation or engagement in these programs. Without incentives in place, an EHM program is simply a benefit which an individual can take or leave, as they please. As soon as an organization begins treating individual employees differently depending upon their utilization of these benefits (i.e., offering incentives) the potential for these unwanted consequences is created. It is proposed that we collapse these three different elements into one: Tangential costs of incentives. The fourth component (selection effects) will be treated separately.
Several other findings have emerged from this preliminary investigation. There is a hierarchy of incentives in terms of their potential for creating these tangential costs. Several variables define this hierarchy:
Size of the incentive. The monetary value of incentives may range from nominal (t-shirts, water bottles, gift cards) to substantial (cash rewards of hundreds of dollars). The larger the incentive, the greater the possibility of tangential costs. While a larger incentive value has the potential for these tangential costs, a larger incentive can also have a positive effect on employees and other participants as they acknowledge the real investment being made by their organization in health.

www.hero-health.org www.populationhealthalliance.org76
Nature of incentive. Incentives that are tied to health insurance benefits (varying deductibles, co-pays and employee contributions) are the most likely to be contentious. While these are preferred approximately 70% of the time (mostly due to their positive tax treatment), non-benefit incentives like those found in consumer loyalty programs (e.g., gift cards, debit cards) seem not to carry the same stigma and are viewed more positively.
Degree of participation required. Incentive-based EHM programs typically require that a minimum threshold of participation be met to qualify for the incentive. This threshold may be as low as completion of an HRA or much higher, for example, requiring actual participation in a coaching program. The higher the threshold, the more likely it is to create tangential costs.
Participation vs. outcomes based incentives. Some incentive programs require not only participation, but that actual performance standards be met (such as weight loss or successful smoking cessation). Outcomes based incentives are more problematic in terms of tangential costs.
Positive vs. negative incentives. Technically every incentive program has the same dynamic: The program differentiates among individuals based on their compliance with the incentive program requirements. However, these programs can be structured as “positive incentives” (i.e., you earn more as you comply) or as “negative incentives” (i.e., you pay more or lose value if you fail to comply). Programs perceived or structured as negative incentives create the most conflict.
The most substantive finding in the peer reviewed literature is a systematic review and analysis of the literature, laws and regulations relating to the legality and ethics of EHM incentive programs. The authors identify multiple potential ethical concerns:• Employer paternalism overriding employee autonomy;• Violations of privacy;• Increased economic vulnerability (and therefore
increased coercion relative to incentives) of low income and minority employees;
• Racial and socioeconomic health disparities that will result in disparate exposure to incentives;
• The fairness of requiring individuals to achieve outcomes.
The authors acknowledged, but did not investigate further, EHM programs effects on employee recruitment, morale, good will, productivity, and turnover. Notably, they describe these various concerns as representing “unquantifiable costs.” The authors conclude:
“Although there is some evidence of positive effects from employer-sponsored HRRPs, it is less compelling than some published reports and promotional materials suggest. Furthermore, in evaluating the overall desirability of employer-sponsored HR-RPs, health plan sponsors and health policy makers need to consider the legal, ethical, and other implications of the programs.”
The authors further suggest that when possible, less intrusive and more equitable means of promoting health be implemented (such as health plan benefit designs that pay primary care providers for wellness visits) to promote employee health.
Another document that reflects many of the above concerns is a policy statement issued by the American Heart Association, American Cancer Society, and American Diabetes Association. The relevant part of this policy reads:
“The American Heart Association, American Cancer Society, and American Diabetes Association support comprehensive wellness programs in the workplace. However, all three groups believe that financial incentives used to motivate behavior should not be tied to premiums, deductibles or other coinsurance paid by employers. The evidence that insurance based incentives change behavior is lacking, and the risk that these plans could be used to discriminate against persons who are less healthy than their counterparts is not insignificant.”
Some other findings from various sources include the following:
✔ Organized labor generally opposes incentive programs. They view incentive programs as unwarranted and un-bargained-for intrusions by management into the affairs of workers.
✔ The smaller the employer, the more difficult it is to avoid many of the concerns (e.g., privacy issues) associated with incentives.
✔ There is considerable commentary that places these concerns in the context of what is characterized as the questionable effectives of incentives. This uncertainty regarding effectiveness further undermines the legitimacy of incentive programs. Many incentive programs have demonstrated positive results, but this uncertainty will persist for some time.
CHAPTER 8 FOOTNOTESa The use of the term “EHM” program does not imply a vendor-provided program. Employers may choose to use vendors or may provide such programs using only in-house resources. This framework makes no distinction between these two approaches except concerning how to calculate the costs of each approach. The term EHM does imply a discrete, definable program with circumscribed attributes that can be measured and evaluated
CHAPTER 8 REFERENCES1 Loeppke R. The value of health and the power of prevention. International Journal of Workplace Health Management. 2008;1(2);95-108.
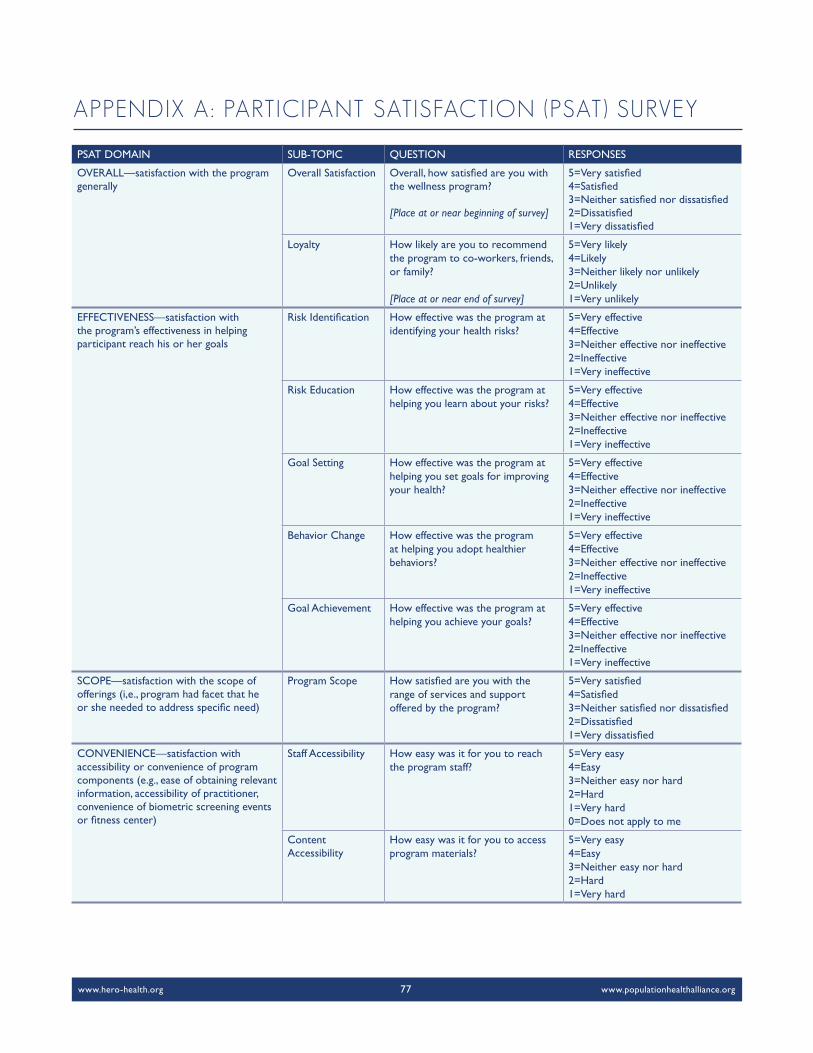
www.hero-health.org www.populationhealthalliance.org77
PSAT DOMAIN SUB-TOPIC QUESTION RESPONSES
OVERALL—satisfaction with the program generally
Overall Satisfaction Overall, how satisfied are you with the wellness program?
[Place at or near beginning of survey]
5=Very satisfied4=Satisfied3=Neither satisfied nor dissatisfied2=Dissatisfied1=Very dissatisfied
Loyalty How likely are you to recommend the program to co-workers, friends, or family?
[Place at or near end of survey]
5=Very likely4=Likely3=Neither likely nor unlikely2=Unlikely1=Very unlikely
EFFECTIVENESS—satisfaction with the program’s effectiveness in helping participant reach his or her goals
Risk Identification How effective was the program at identifying your health risks?
5=Very effective4=Effective3=Neither effective nor ineffective2=Ineffective1=Very ineffective
Risk Education How effective was the program at helping you learn about your risks?
5=Very effective4=Effective3=Neither effective nor ineffective2=Ineffective1=Very ineffective
Goal Setting How effective was the program at helping you set goals for improving your health?
5=Very effective4=Effective3=Neither effective nor ineffective2=Ineffective1=Very ineffective
Behavior Change How effective was the program at helping you adopt healthier behaviors?
5=Very effective4=Effective3=Neither effective nor ineffective2=Ineffective1=Very ineffective
Goal Achievement How effective was the program at helping you achieve your goals?
5=Very effective4=Effective3=Neither effective nor ineffective2=Ineffective1=Very ineffective
SCOPE—satisfaction with the scope of offerings (i,e., program had facet that he or she needed to address specific need)
Program Scope How satisfied are you with the range of services and support offered by the program?
5=Very satisfied4=Satisfied3=Neither satisfied nor dissatisfied2=Dissatisfied1=Very dissatisfied
CONVENIENCE—satisfaction with accessibility or convenience of program components (e.g., ease of obtaining relevant information, accessibility of practitioner, convenience of biometric screening events or fitness center)
Staff Accessibility How easy was it for you to reach the program staff?
5=Very easy4=Easy3=Neither easy nor hard2=Hard1=Very hard0=Does not apply to me
Content Accessibility
How easy was it for you to access program materials?
5=Very easy4=Easy3=Neither easy nor hard2=Hard1=Very hard
APPENDIX A: PARTICIPANT SATISFACTION (PSAT) SURVEY

www.hero-health.org www.populationhealthalliance.org78
PSAT DOMAIN SUB-TOPIC QUESTION RESPONSES
CONVENIENCE (CONT.) Event Participation
If your program included events (such as meetings or screenings), how easy was it for you to participate?
5=Very easy4=Easy3=Neither easy nor hard2=Hard1=Very hard0=No events in my program
Tools ofConvenience
If your program included using tools (such as a food diary) or devices (such as a pedometer), how easy was it for you to get the tools or devices?
5=Very easy4=Easy3=Neither easy nor hard2=Hard1=Very hard0=No tools or devices in my program
COMMUNICATIONS—satisfaction with program communications such as those introducing them to the program and those describing costs and benefits of participation
Enrollment Communications
How satisfied are you with the information that was provided to you to get started in the program?
5=Very satisfied4=Satisfied3=Neither satisfied nor dissatisfied2=Dissatisfied1=Very dissatisfied
ProgramCommunications
During the program, how satisfied were you with the communication about your participation, such as program requirements and scheduling?
5=Very satisfied4=Satisfied3=Neither satisfied nor dissatisfied2=Dissatisfied1=Very dissatisfied0=Does not apply to me
Content Relevance
How satisfied are you that the educational materials that you received were appropriate to your needs?
5=Very satisfied4=Satisfied3=Neither satisfied nor dissatisfied2=Dissatisfied1=Very dissatisfied0=Does not apply to me
Content Clarity
How satisfied are you that the educational materials that you received were easy to read and understand?
5=Very satisfied4=Satisfied3=Neither satisfied nor dissatisfied2=Dissatisfied1=Very dissatisfied0=Does not apply to me
EXPERIENCE—satisfaction with the member experience (e.g., web interface, print materials, customer service help)
Customer Service
How satisfied are you with the assistance and support you received from the program's customer service staff?
5=Very satisfied4=Satisfied3=Neither satisfied nor dissatisfied2=Dissatisfied1=Very dissatisfied0=Does not apply to me
Clinical Staff How satisfied are you with the program's clinical staff, such as health coaches or medical providers?
5=Very satisfied4=Satisfied3=Neither satisfied nor dissatisfied2=Dissatisfied1=Very dissatisfied0=Does not apply to me
Website If your program uses a website for information or activities, how satisfied are you with the website?
5=Very satisfied4=Satisfied3=Neither satisfied nor dissatisfied2=Dissatisfied1=Very dissatisfied0=No website

www.hero-health.org www.populationhealthalliance.org79
PSAT DOMAIN SUB-TOPIC QUESTION RESPONSES
COST—satisfaction with the level of personal investment required (financial, time)
TimeInvestment
How satisfied are you with the amount of time you spent participating in the program?
5=Very Satisfied4=Satisfied3=Neither satisfied nor dissatisfied2a=Dissatisfied, too much time2b=Dissatisfied, too little time1a=Very dissatisfied, too much time1b=Very dissatisfied, too little time
Program Cost How satisfied are you with the cost of participating in the program
5=Very satisfied4=Satisfied3=Neither satisfied nor dissatisfied2=Dissatisfied1=Very dissatisfied0 = There were no costs
BENEFITS—satisfaction with the program’s benefit to him or her (incentives, health)
Provider Communication
How effective was the program at improving your ability to communicate with your healthcare providers?
5=Very effective4=Effective3=Neither effective nor ineffective2=Ineffective1=Very ineffective0=Does not apply because I already had excellent communication with my providers
Incentives If your program offered incentives, how satisfied were you with the incentives? Examples of incentives include: - adjustments to your health
benefits, such as reducing your premium or your co-pay, OR
- personal benefits, such as cash, gift cards, gym membership, etc.
5=Very satisfied4=Satisfied3=Neither satisfied nor dissatisfied2=Dissatisfied1=Very dissatisfied0=There were no incentives offered
Behavior Change
How satisfied are you with the behavior changes you made as a result of the program?
5=Very satisfied4=Satisfied3=Neither satisfied nor dissatisfied2=Dissatisfied1=Very dissatisfied0=Does not apply to me
HealthImprovement
How satisfied are you with the program's contribution to improving your overall health?
5=Very satisfied4=Satisfied3=Neither satisfied nor dissatisfied2=Dissatisfied1=Very dissatisfied

www.hero-health.org www.populationhealthalliance.org80
CSAT DOMAIN SUB-TOPIC QUESTION RESPONSES
OVERALL—satisfaction with the program generally
Overall Satisfaction
Overall, how satisfied are you with the wellness program?
[Place at or near beginning of survey]
5=Very satisfied4=Satisfied3=Neither satisfied nor dissatisfied2=Dissatisfied1=Very dissatisfied
Loyalty How likely are you to recommend the wellness program to a colleague or to another company?
[Place at or near end of survey]
5=Very likely4=Likely3=Neither likely nor unlikely2=Unlikely1=Very unlikely
EFFECTIVENESS—satisfaction with program’s effecrtiveness in helping participant reach his or her goals
Risk Identification
How effective was the program at identifying health risks for your population?
5=Very effective4=Effective3=Neither effective nor ineffective2=Ineffective1=Very ineffective
Risk Education How effective was the program at helping your participants learn about their health risks?
5=Very effective4=Effective3=Neither effective nor ineffective2=Ineffective1=Very ineffective
Goal Setting How effective was the program at helping your participants set goals for improving their health?
5=Very effective4=Effective3=Neither effective nor ineffective2=Ineffective1=Very ineffective
BehaviorChange
How effective was the program at helping your participants adopt healthier behaviors?
5=Very effective4=Effective3=Neither effective nor ineffective2=Ineffective1=Very ineffective
Goal Achievement
How effective was the program at helping your organization achieve its health goals?
5=Very effective4=Effective3=Neither effective nor ineffective2=Ineffective1=Very ineffective
VALUE—satisfaction with the net benefit or economic value (i.e., weighing both cost and benefit)
Value Considering your expectations for cost and benefit, how satisfied are you that the program met your expectations?
[Place at or near end of survey]
5=Very satisfied4=Satisfied3=Neither satisfied nor dissatisfied2=Dissatisfied1=Very dissatisfied
SCOPE—satisfaction with the program offerings/ability to tailor to client needs
Scope How satisfied are you with the range of services and support of-fered by the program provider?
5=Very satisfied4=Satisfied3=Neither satisfied nor dissatisfied2=Dissatisfied1=Very dissatisfied
Customization How satisfied are you with the program provider's ability to tailor the program to your needs?
5=Very satisfied4=Satisfied3=Neither satisfied nor dissatisfied2=Dissatisfied1=Very dissatisfied
APPENDIX B: CLIENT SATISFACTION (CSAT) SURVEY

www.hero-health.org www.populationhealthalliance.org81
CSAT DOMAIN SUB-TOPIC QUESTION RESPONSES
MEMBER EXPERIENCE—satisfaction with the member experience of program (e.g., web interface, print/promotional materials)
Overall Experience
How satisfied are you that your participants felt that their needs were met by the program?
5=Very satisfied4=Satisfied3=Neither satisfied nor dissatisfied2=Dissatisfied1=Very dissatisfied
Program Communications
During the program, how satisfied were your participants with program communications, including program requirements and scheduling?
5=Very satisfied4=Satisfied3=Neither satisfied nor dissatisfied2=Dissatisfied1=Very dissatisfied0=Does not apply to me
Education Materials
How satisfied were your participants with the educational materials they received?
5=Very satisfied4=Satisfied3=Neither satisfied nor dissatisfied2=Dissatisfied1=Very dissatisfied0=Does not apply to me
Participant Website
If your program uses a website for information or activities for your participants, how satisfied are you with the website?
5=Very satisfied4=Satisfied3=Neither satisfied nor dissatisfied2=Dissatisfied1=Very dissatisfied0=No website
CONVENIENCE Administrative Ease
How easy was it for you to provide administrative support for the program?
5=Very easy4=Easy3=Neither easy nor hard2=Hard1=Very hard
ACCOUNT MANAGEMENT—satisfaction with account management (e.g., accessible, responsive, consultative, proactive, polite/respectful)
Understands Needs
How effective was your program provider's account management team at acknowledging the needs of your organization?
5=Very effective4=Effective3=Neither effective nor ineffective2=Ineffective1=Very ineffective
Consultative How effective was your program provider's account management team at consulting and collaborating with your organization?
5=Very effective4=Effective3=Neither effective nor ineffective2=Ineffective1=Very ineffective
Proactive How proactive was your program provider's account management team at communicating with your team?
5=Very proactive4=Proactive3=Neither proactive nor passive2=Passive1=Very passive
Issues Resolution
How effective was your program provider's account management team at providing timely and creative solutions to problems?
5=Very effective4=Effective3=Neither effective nor ineffective2=Ineffective1=Very ineffective

www.hero-health.org www.populationhealthalliance.org82
CSAT DOMAIN SUB-TOPIC QUESTION RESPONSES
REPORTING—satisfaction with service and outcomes reporting (e.g., timely, comprehensive, clear, effective)
Participation Reporting
How effective were your program provider's reports at clearly summarizing program participation?
5=Very effective4=Effective3=Neither effective nor ineffective2=Ineffective1=Very ineffective
Outcomes Reporting
How effective were your program provider's reports at clearly summarizing program outcomes?
5=Very effective4=Effective3=Neither effective nor ineffective2=Ineffective1=Very ineffective
Reporting Comprehensiveness
How satisfied are you with the comprehensiveness of your program provider's reports?
5=Very satisfied4=Satisfied3=Neither satisfied nor dissatisfied2=Dissatisfied1=Very dissatisfied
Timely Reporting
How satisfied are you with the timeliness of your program provider's reports?
5=Very satisfied4=Satisfied3=Neither satisfied nor dissatisfied2=Dissatisfied1=Very dissatisfied
Summary Reporting
How effective were your program provider's reports at providing an executive summary for senior management of your organization?
5=Very effective4=Effective3=Neither effective nor ineffective2=Ineffective1=Very ineffective
www.hero-health.org www.populationhealthalliance.org83
EXPERTS INTERVIEWED
In an effort to ensure our workgroup considered the most current research and practices being used in the area of organizational support, we interviewed many experts on the topic:
Steve Aldana, PhD CEO & Founder of WellSteps.
Judd Allen, PhD, CWP President, Human Resources Institute, LLC.
Robert Eisenberger, PhD Professor and Director of Perceived Organizational Support, Industrial Organizational Psychology, University of Houston; author of Perceived Organizational Support (POS) survey.
Ron Goetzel, PhD Research Professor and Director, Emory University Institute for Health and Productivity Studies (IHSP); VP, Consulting and Applied Research, Truven Health Analytics.
Cheryl Larson Vice President, Midwest Business Group on Health.
APPENDIX C: ORGANIZATIONAL SUPPORT

www.hero-health.org www.populationhealthalliance.org84
BARRY-WEHMILLER
Overview
Barry-Wehmiller Companies, Inc. is a diversified global supplier of engineering consulting and manufacturing technology solutions across a broad spectrum of industries. With more than 7,400 team members in over 65 locations worldwide and annual revenues surpassing $1.7 billion, Barry-Wehmiller is unified by a shared vision articulated in its Guiding Principles of Leadership. The slogan, “We build great people who do extraordinary things,” is conveyed in every aspect of the organizational culture.
The Barry-Wehmiller culture has evolved since the mid80’s under the leadership of Bob Chapman, the company’s CEO. During this time, the business experienced significant growth and diversification and Mr. Chapman underwent his own transformation, realizing a higher purpose for himself and the role of the organization. This purpose was to help the associates of Barry-Wehmiller become all they can be as individuals, and allow them to “touch the lives of others.” Through tangible and intangible efforts, the organization’s culture began to evolve. Value documents and vision statements were created, Bob’s strong leadership and vision inspired others, associates were empowered to improve their lives at work, at home, and within their communities, and organizational changes were made to support the mission. With consistent alignment of a mission, core values and full support from the top leader, Barry-Wehmiller created a culture that encourages responsible freedom that resonates and inspires a collaborative spirit between departments—“people-centric leadership” defines the organization.
Wellbeing at Barry-Wehmiller
Returning associates home each day safe, well and fulfilled is one of Barry-Wehmiller’s organizational goals. This translates to providing resources, programs and support that enhance their wellbeing. From an organizational standpoint, associate wellbeing includes five areas: career, community, financial wellbeing, social wellbeing and physical health. Career opportunities are viewed as not just a job, but an opportunity to hold a valued and meaningful position in the Barry-Wehmiller family. To support associates personal and professional growth, Barry-Wehmiller University offers classes via online, webinar and in-person. Associates are involved in the community and support local charities, not only financially
but also with company time and talents. Social opportunities play a pivotal role as associates grow together as a family through regular celebrations and social gatherings. Health and wellness programs promote healthy physical living so that associates and families can enhance their quality of life.
Regardless of the focus area, collaboration among formal and informal teams within the organization help drive success of Barry-Wehmiller’s wellbeing initiatives. Several of these teams are Culture and People Development (formerly HR), Organizational Empowerment, and Community Enrichment, to name a few. Total wellbeing is institutionalized in activities, including community events, recognition programs, foods served, etc. To further emphasize this belief, a partner summit with external vendors focused in the area of physical wellbeing was held in 2012 to allow vendors to understand each other and to provide a seamless experience for Barry-Wehmiller associates. Individual associates, departments, leaders and external partners are held accountable for ensuring that the organization’s focus is on its people. As a result the business will continue to flourish. With fulfilled people, Barry-Wehmiller will achieve its purpose.
In the fall of 2013, the vision statement Living Well, Thriving Together was created with input from associates worldwide. This elevated focus on wellbeing throughout Barry-Wehmiller is intended to inspire the intrinsic motivation towards a life with good health rather than just providing information. The vision document represents a shift from physical only to a holistic approach of total wellbeing and helping associates find their “why” for optimal health.
Measuring Success
At Barry-Wehmiller, if you ask any associate how success is measured, you’re likely to receive the response: “We measure success by the way we touch the lives of people.” This organizational tenet can be seen through the multi-pronged approach the organization it embraces for measurement and evaluation. This includes feedback from award applications, financial analysis, HERO scorecard, WELCOA scorecard, environmental assessment tool, and internal accountability measures. An annual review of health status outcomes drives the adjustment of incentive values. For example, greater financial gain is tied to biometrics (BMI) that most contribute to poor health and behaviors
CASE STUDIES

www.hero-health.org www.populationhealthalliance.org85
(physical activity) that bring the greatest impact to those measures. In addition, Barry-Wehmiller’s local wellbeing teams play a critical role in tracking the participation, receptivity and value of the programs offered.
Key to the future measures is a data warehouse holding all benefits data—including biometrics and health risk assessment data. This repository provides a valuable opportunity to measure outcomes for various initiatives, measure the population’s health status and identify gaps in care. Barry-Wehmiller hopes that the warehouse reporting will help to further refine the populations in need of specialized care offerings. Ultimately, the data warehouse will enable a measure of wellbeing for Barry-Wehmiller associates.
Impact of Organizational Support
Five years ago, Barry-Wehmiller partnered with Georgetown University and Washington University to 1) validate the meaningfulness of the Barry-Wehmiller leadership model and 2) identify the components of the model. After surveying every team member and team leader at two sites—selected for their diversity in union representation and amount of time within the Barry-Wehmiller organization—the research team found a strong correlation between leaders and the TPL (Touching Peoples’ Lives) culture.
The survey analysis identified the top five drivers of TPL culture: strong organizational values, trust in leader, transformational leadership, leader compassion, and leader integrity. Team member outcomes included:
• feeling a part of the family,• considering oneself a leader,• taking initiative, and• taking the perspective of others.
Outcomes related directly to team leaders included:
• performance,• creativity,• voice, and• altruism.
Clearly, Barry-Wehmiller believes in the importance of organizational support and has dedicated significant time and resources into measuring it. Not only have they infused the culture with the value of wellbeing, but they have also implemented policies, structure, leadership support, associate involvement, resources and strategies, rewards and recognitions, and a supportive environment to support the organization’s commitment to the whole person. Based on this review and better understanding of the impact of leadership support to achieve their mission, it is not a wonder that Barry-Wehmiller has seen high engagement in their programs and maintained or improved their health status in key health indicator areas such as BMI over the last five years.
GLAXOSMITHKLINE
Building Corporate Athletes
As a health care organization, GlaxoSmithKline’s (GSK) mission is to “improve the quality of human life by enabling people to do more, feel better and live longer.” This mission also translates into taking care of employees by aspiring to a healthy, resilient, high performing workforce with zero harm to people and the environment. The quest to improve performance and build resiliency in the face of business pressures is an imperative in today’s environment. With approximately 100,000 employees globally, GSK saw an opportunity to further build the overall health, safety, and wellbeing of the organization, while developing leaders to more effectively deliver on business strategy.
Energy and Resilience Center of Excellence
Sue Cruse, MSc, previous director of the Energy and Resilience Center of Excellence explains that “the Energy and Resilience Center of Excellence was established to enhance the energy and resilience of all GSK employees through participation in programs and through cultural influences.” The Energy and Resilience Center of Excellence is best known for offering a holistic set of self, team, and leadership development programs. These programs build skills that enable employees to optimize professional and personal performance. The new director, Jeannie Jones, highlights the win-win from investing in this type of training, “It’s good for our people and good for our business.”

www.hero-health.org www.populationhealthalliance.org86
In 2006, after a pilot phase, the Energy and Resilience Center of Excellence offered the Corporate Athlete Program, developed by The Human Performance Institute (HPI), under the name Energy for Performance (E4P). The E4P program addresses physical, emotional, mental and spiritual dimensions of energy and teaches individuals how to manage and increase their energy capacity to optimize professional and personal performance. E4P helps employees focus their energy on things that matter most to them so they can reach their full potential. Over the course of a two-and-a-half day training, participants identify their life mission; examine the alignment between their personal mission and values, and the organization’s mission; understand their energy investments; create action plans to redirect misaligned energy efforts; and become aware of the importance of organizational and personal support for achieving their change goals.
GSK’s original purpose in offering the E4P program to GSK senior leaders was to build resiliency through enhancing the quality and quantity of employees’ energy. Today, the program is available to all GSK employees, rather than just senior leaders because of the value to the individual participant and the organization as a whole. To maintain a high standard of delivery and keep costs down, the Energy and Resilience Center of Excellence trains talented internal staff to facilitate E4P. In addition, the program has been integrated into the leadership development framework and is strongly encouraged for executives and mid-level managers. The program has become a key ingredient for sustainability within business units.
Impact of Program
GSK has conducted studies that demonstrate E4P participants can have better:
• Personal Energy—through increased choices and action based on values, more recovery breaks and hydration, and more energy at the end of the workday.
• Health—through improved self reported health status; healthier lifestyle choices (e.g., nutrition); increased use of outpatient, lab, and preventive care; and higher medication adherence, particularly for chronic disease.
• Performance—through sustained behavioral improvements, increased engagement, and through increased job performance.
The energy and resilience training has been delivered to 10,000 GSK employees (about 10% of the workforce). As noted in the peer-reviewed article, “Developing fully engaged leaders that bring out the best in their teams
at GlaxoSmithKline,” (Brandon, Joines, Powell, Cruse, Kononenko, 2012) there is a strong business case for investing in energy management programs and practices. Evaluation results found
• E4P graduates are rated more favorably on 360 assessment ratings from managers, peers, direct reports, and key stakeholders on several behavioral aspects that positively relate to individual engagement.
• A notable positive shift in “developing people” behavior, a behavior identified in an earlier research project as a key driver of employee empowerment.
• Early evidence that teams that are “more empowered,” a goal of the E4P program, perform better.
Overall, results show that once participants clarify their personal mission and align with the organizational mission, they are in a better position to be fully engaged and build more capable, high performing teams. Lead author Julia Brandon, PhD, director of Environment, Health, and Safety excellence explains, “This finding highlights an interesting paradox of human development. That is, as individuals more fully understand themselves, the better they are able to identify with others. There are two key insights. First, the safety advice we receive when flying on an airplane also applies to work performance—it is important for us to put on our own oxygen mask on first before assisting other people. Second, to create a culture of healthy, high performance, it is important for leaders to empower their teams so they can bring their full and best energy to the time they have each day. This includes listening to team needs, providing support, and encouraging people to take breaks during the day.
Healthy, High Performance and Zero Harm
GSK’s employee engagement survey addresses two areas of healthy, high performance: personal energy and resilience and support for healthy, high performance. As Dr. Brandon explains, “These strategic measures of healthy high performance are clearly linked to success. More effective leaders have significantly higher scores on Healthy, High Performance than less effective leaders.”
There is also a companion sustainability measure, Zero Harm, designed to assess safety, trust, and ethics. This feedback, along with other measures of leader and team capability, is the foundation for heat maps that help inform where resources and actions are needed in the organization. More specifically, GSK utilizes the following perception ratings when evaluating healthy, high performance and zero harm:

www.hero-health.org www.populationhealthalliance.org87
Healthy, High Performance
• Personal energy and resilience- I can take brief breaks throughout the day to sustain
my performance.- I find it easy to bounce back when I experience
a setback.- I have sufficient energy to invest in the things that
matter most at work and in life.- I feel energized by my work.
• Perceived support for healthy, high performance- My immediate manager supports my efforts to
balance my work and personal life.- GSK's actions to support employee health and
well-being consistently match our external mission to Do More, Feel Better and Live Longer.
- Senior Leaders at GSK demonstrate that employees are important to the success of the company.
Zero Harm
• Within my work group, I am empowered to challenge any unsafe behaviors or conditions.
• People in my work area are protected from health and safety hazards.
• My work environment encourages ethical behavior even in the face of pressures to meet business objectives.
• GSK is taking appropriate actions to be socially responsible.
• Leaders in my department create an atmosphere of trust in which concerns can be raised.
The use of such perception ratings provides us with an excellent example of how GSK has integrated these health, safety and well-being measures within the enterprise wide engagement survey to inform and evaluate overall program impact and effectiveness. As outlined, organizational support refers to the degree to which an organization commits to the health and well being of its employees. Success in establishing organizational support of employee health management can be measured not only by the deliberate steps to create the conditions for healthy behaviors, such as the E4P program, but also by the employees’ and managers’ perceived organizational support of employee health and well-being. GlaxoSmithKline’s program and evaluation provides a great example of organizational support efforts.
REFERENCEBrandon, J., Joines, R., Powell, T., Cruse, S., Kononenko, C. (2012). Developing fully engaged leaders that bring out the best in their teams at GlaxoSmithKline. Online Journal of International Case Analysis 3(2), 1-15. ttp://ojica.fiu.edu/index.php/ojica_journal/issue/view/10/showToc%20%20
LINCOLN INDUSTRIES
Overview
Lincoln Industries, a large-scale manufacturer in Nebraska, employs a predominantly male workforce totaling around 550 employees. In a 2000 assessment of work health, Lincoln Industries discovered a negative trend in its medical spending and began the implementation of health management programs with measurable objectives and senior executive support. Today, Lincoln Industries is nationally recognized for its comprehensive well-being programs and portrays a model of how to successfully build a culture of health.
Well-Being Initiatives
Lincoln Industries’ overall health management strategy has evolved since 2000, and includes comprehensive programs that address all aspects of well-being. For example, the Go! Platinum well-being initiative uses a tiered, point-system approach and includes life planning classes, an annual Poker Walk competition, stretching before each shift, an onsite clinic, and an onsite workout facility. Employees and adult
dependents can earn points through program participation (e.g., completing annual biometric screening and wellness coaching) and maintaining overall health (e.g., meeting goals for weight management or smoking cessation) to move from one level to the next. Higher points can earn employees lower medical premiums and health reimbursement account contributions. Those who achieve the highest level (platinum) are eligible for participation in a team experience: a company-paid trip to Colorado for a 14,000-foot mountain climbing adventure.
In 2011, Lincoln Industries opened HealthyU, a health clinic and wellness center on its main campus, in conjunction with Marathon Health. With this addition, all biometric screenings and health coaching are now completed at the clinic, year round. The clinic tracks average risk factors for metabolic syndrome and prevalence has decreased from 19% in 2010 to 11.4% in 2013. In December 2012, Lincoln Industries opened its state-of-the-art fitness center, HealthU Fit, next to HealthyU. It is available 24 hours/day, 7 days/week to accommodate its shift-based workforce.

www.hero-health.org www.populationhealthalliance.org88
Measuring Perception of Organizational Support
The health and well-being philosophy at Lincoln Industries supports the notion that lifestyles of higher well-being will lead to a workforce that is happier, more satisfied and more productive. Lincoln Industries’ recognized success in effectively managing the health, safety and healthcare costs of their company has been built on six key elements: talent development, focus on wellness, safety programs, open communication, individual recognition, and community involvement.
A central component of success, colleague engagement, is achieved in an environment where people are empowered to make the necessary decisions needed and where leadership reinforces personal responsibility. Engagement is strengthened by appropriate rewards and recognition. Monthly champion lunches provide a forum for business updates and celebration of wins and successes. These key cultural attributes highlight how Lincoln Industries supports the health and well-being of their employees within each level of the organization.
Success of Lincoln Industries wellness efforts is measured through an Internal Opinion Survey (IOS) which measures satisfaction, engagement, beliefs and drivers. In addition, the employee has the opportunity to rate his supervisor on beliefs and drivers, and how well the supervisor acts on them on a daily basis. Furthermore, the survey asks about company support of physical activity, emotional wellness,
and providing necessary tools. Benchmarking is used to indicate a supervisor’s strength or weakness in areas of safety, learning/development beliefs, and wellness beliefs. Finally, supervisors receive a development plan to act on their survey responses. The annual performance review process also includes wellness as a performance category for all employees. Since 2004, 10% of manager bonuses have been based on meeting wellness objectives. This approach exemplifies how Lincoln Industries “walks the talk” in their efforts to evaluate their program with employees’ perceived level of support and hold organizational leaders accountable in upholding health and well-being program objectives within their work.
Impact
Cost: For the last 10 years, Lincoln Industries’ revenue growth has averaged 15%/year. Average annual health care cost is 40% lower than the regional average, or approximately $5,830 per person in 2013.
Health: Tobacco use has declined from 42% in 2004 to 16% in 2013.
Safety: OSHA Total Injury and Illness rate (IRR) is at an all-time low of 2.54, compared with the industry average of 4.9.
Productivity: Improvements in absence and presenteeism/workforce performance have resulted in 2% savings.

© 2015 Copyright by Health Enhancement Research Organization and Population Health Alliance. All Rights Reserved.
www.hero-health.org www.populationhealthalliance.org 952.835.4257 202.737.5980
Design support for the Program Measurement Evaluation Guide provided by HealthFitness.