core directory of common data sources - western cape
TRANSCRIPT

CHIEF DIRECTORATE: Monitoring, Evaluation, Review and Reporting
Tel: +27 21 483 6275 fax: +27 21 483 6275
7 Wale Street, Cape Town, 8001
www.capegateway.gov.za
Page 1 of 55
Core Directory of Common Data
Sources
PART 2: PROVINCIAL ADMINISTRATIVE DATA
Department of the Premier in collaboration with University of Cape Town,
Southern Africa Labour and Development Research [SALDRU]

Page 2 of 55 Department of the Premier in collaboration with SALDRU
IIIIIIIINNNNNNNNTTTTTTTTRRRRRRRROOOOOOOODDDDDDDDUUUUUUUUCCCCCCCCTTTTTTTTIIIIIIIIOOOOOOOONNNNNNNN The Core Directory of Common Data Sources (CDCDS) Part 1: Mainstream data and the Core Directory of
Common Data Sources (CDCDS) Part 2: Profiling of Administrative Data are key deliverables that resulted
from the data management and data assessment phase of the Provincial-wide Monitoring and Evaluation
System (PWMES). The official data sources identified and located for the outcome indicators of the
PWMES are profiled in Part 1.whilst the provincial administrative data sources identified and located for the
output and outcome indicators for the Provincial Strategies and Provincial Strategic Plan (PSP) of the
Provincial Government of the Western Cape (PGWC) are profiled in Part 2.
PGWC envisage that the PSP would be monitored and evaluated on a six monthly basis using a set of
output and outcome indicators. Data for the output and outcome indicators would primarily be sourced
from Provincial Government departments. Due to the demand for provincial administrative data, it is
important to understand and to articulate the context in which the PGWC departments compile and
construct data sources. Against this background, this Core Directory of Common Data Sources Part 2:
Profiling of Administrative Data, assessed the administrative data sources located in the Provincial
Government departments which are most commonly used for M&E purposes.
The following departure points were imperative in the data assessment process:
• To identify and locate existing data sources constructed and most commonly used by PGWC
departments.
• To profile the data sources most commonly used for Monitoring and Evaluation (M&E) purposes.
• To assess the existing departmental data in terms of the requirements for quality data based on the
principles and guidelines of the South African Statistical Quality Assessment Framework (SASQAF)
Baseline provincial administrative data and information for coherent and integrative planning will therefore
be obtained from a common database.
.

Page 3 of 55 Department of the Premier in collaboration with SALDRU
BACKGROUND TO THE DEVELOPMENT OF THE CORE DIRECTORY OF COMMON DATA SOURCES PART 2: PROFILING OF ADMINSTRATIVE DATA
The development of the Core Directory of Common Data Sources Part 2: Profiling of Administrative Data
for the PWMES is a response to the call for organisations to prioritise data quality for the successful
management of service delivery. This requires of each organisation, including the government, to be more
engaged with the data that is used.
The data management effort of the PWMES is directed to the availability of good administrative data. This
is to encourage a shared responsibility amongst programme planners, data users and data producers in
provincial government departments so that they should commit to improve the quality of data that will serve
as evidence to report progress on projects and programmes.
Initiation and design phase of the CDCDS
The initiation and design phase of the data assessment process provides the rationale for developing a
CDCDS for the PWMES. For the PGWC quality administrative data is needed to track progress and to
measure the outcomes of the overarching objectives of the PSP. Quality administrative data for the M&E of
the programmes performance of the PSP is critical as it is used to track the alignment of progress with
programmes, projects, targets and milestones in implementation. The benefits of quality administrative data
for the PGWC can only be achieved if the data requirements and the construction of data sources are
coordinated in a coherent manner amongst PGWC departments.
For the PGWC to benefit meaningfully in terms of measuring and managing development from
administrative data systems, the issues and implications of data quality need to be adequately addressed.
Profiling of official and administrative data sources and examining datasets for the CDCDS
The process commenced with the profiling of official data sources in the mainstream; products of Statistics
South Africa (Stats SA) were of particular interest. The primary focus of the exercise was to determine the
scope of the data sources; the frequency of data dissemination; the size of the datasets concerned and its
applicability to the PSP development indicators. This could help capacitate staff members of the DotP
regarding the dynamics of data and data sources. While official data sources were being profiled, a parallel
process occurred, namely the compilation of a CDCDS applicable to provincial administrative data.

Page 4 of 55 Department of the Premier in collaboration with SALDRU
For the purpose of the CDCDS: Part 2: Profiling of Administrative Data each data source is profiled in terms
of its purpose, the type of data, the year in which the data source was conducted, the tenure or the
frequency of the dataset and the sample size.
The data sources are aligned according to the following Provincial Government departments:
1. Dept of Agriculture
2. Dept of Cultural Affairs and Sport
3. Dept of Economic Development and Tourism
4 Dept of Environmental Affairs and Development Planning
5. Dept of Health
6. Dept of Local Government and Housing
7. Dept of Social Development
8. Dept of Education
9. Dept of Transport and Public Works
10. Dept of Provincial Treasury
11. Dept of the Premier
12. Dept of Community Safety
1.3.4. Consultation with provincial line departments
The Department of the Premier in collaboration with the Southern Africa Labour and Development
Research Unit [Saldru] initiated a consultative process with all line departments of the PGWC. The aim was
to inform and raise awareness of data management and data quality management. The other motivation
was to gain access to provincial line departments’ data sources that could possibly inform the PSP
indicators and be incorporated in the CDCDS. These engagements were preceded by further advocacy
through the Provincial-wide Monitoring and Evaluation Forum of the PWMES.

Page 5 of 55 Department of the Premier in collaboration with SALDRU
PROFILING OF PROVINCIAL DATA SOURCESPROFILING OF PROVINCIAL DATA SOURCESPROFILING OF PROVINCIAL DATA SOURCESPROFILING OF PROVINCIAL DATA SOURCES
1.1.1.1. DEPDEPDEPDEPARTMENT OF AGRICULTUREARTMENT OF AGRICULTUREARTMENT OF AGRICULTUREARTMENT OF AGRICULTURE
Table 1: Data sources in the Department of Agriculture
Data source
Purpose
Type/Description of data
Year
Tenure
Sample size
Game species
auction prices
To monitor auction
prices of game
species
Annual average and
highest individual prices for
game species realized at
game auctions
1990 to the
present
Monthly 100%
Agritourism
ventures
Determination of
spatial growth of
agritourism
ventures; sourcing
of statistics for
managerial
purposes
Contact details; GPS
waypoints; ecotourism
ventures; wine cellars; farm
accommodation; 4x4
routes; restaurants
2007 Continuously 100%
Agricultural land
market prices
To track regional
prices paid on
actual markets for
agricultural land
Agricultural land prices in
rand/hectare; farms
grouped per region with
three farm size categories
per region
2003 to the
present
Weekly 100%
Database on
emerging farmers
To understand,
monitor and assist
the emerging
farming sector
through spatial
data
Farm and farmer details;
types of farming; spatial
location; land utilisation
patterns
2006 One-off 100%
Agricultural
indicators
To monitor
selected
agricultural
indicators
Selected economic,
ecological and social
indicators recruited from
various approved sources
Historical to
present
Continuously
Enquiries
To record the
number and type
of enquiries
received in order
to assimilate
managerial
information for
data recruitment
Date; person/institution;
contact details; type of
information/data requested;
category of enquiry
2005 to the
present
Continuously 100%

Page 6 of 55 Department of the Premier in collaboration with SALDRU
2.2.2.2. DEPARTMENT OF DEPARTMENT OF DEPARTMENT OF DEPARTMENT OF COMMUNITY SAFETYCOMMUNITY SAFETYCOMMUNITY SAFETYCOMMUNITY SAFETY
Table 2: Data sources in the Department of Community Safety
Data source
Purpose
Type/Description of
data
Year
Tenure
Sample size
Volunteer database Record-keeping
of all the details
of all
Bambanani
volunteers
Name; surname; address;
project involvement;
Neighbourhood Watch
involvement; community
involvement; education;
race; sex; stipends paid
to volunteer; Community
Police Forum details; etc.
2005, 2006,
2007
Daily
Child Rapid
Response Unit
(CRRU)
Recording-
keeping of all
missing children
reported to the
CRRU
Name; surname; address;
age; race; sex;
photograph and
situational circumstances
of child; SAPS case
number; parents' details;
suspect's details in
certain cases
2005, 2006,
2007
Daily
Network drive
shared on the 'Cus-
35w it\Data’
(S)\CCP\Project
Registration
databases\2002-
2008 registration
database
Registration of
projects
Project details and
description; funding
request and allocation;
comments and project
status
2001 to 2008 [On regular
basis with
regards to
outstanding
information or
project closure]
• 184 registered projects
• 375 registered projects
• 377 registered projects
• 378 registered projects
• 204 registered projects
• 67 registered projects
• 21 provincial Social Transformation Programme areas
Database of
school-based
Bambanani
volunteers
Name of volunteer; ID
number; address; training
status; educational
qualification
2006/2007 Daily 499 Bambanani
volunteers
Database of
provincial VSVs
Where a VSV is based,
ID number; personal
details; training status
2007/2008 Weekly 1 579 VSVs

Page 7 of 55 Department of the Premier in collaboration with SALDRU
3.3.3.3. DEPARTMENT OF DEPARTMENT OF DEPARTMENT OF DEPARTMENT OF CULTURAL AFFAIRS AND SPORTCULTURAL AFFAIRS AND SPORTCULTURAL AFFAIRS AND SPORTCULTURAL AFFAIRS AND SPORT
Table 3: Data sources in the Department of Cultural Affairs and Sport
Data source
Purpose
Type/Description of data
Year
Tenure
Sample size
Public Automated
Library System
(PALS)
Library
information
Electronic/hard copies 2004 - 2009 Daily
National
Automated
Archival
Information
Retrieval System
(NAAIRS)
Archive services,
resources and
artefacts
Electronic/hard copies 2004 - 2009 Monthly
Database in each
provincial
museum
Provincial
museum
resources and
museum technical
services and
museum scientific
services
(information about
museum
resources and
artifacts)
Electronic/hard copies 2004 - 2009 Monthly
Database about
various cultural
resources
Cultural projects Electronic/hard copies 2004 - 2009 Quarterly
Database about
various heritage
resources
Heritage projects Electronic/hard copies 2004 - 2009 Monthly
Database about
sport resources
Sport projects
(including adult
sport and school
sport)
Electronic/hard copies 2004 - 2009 Daily

Page 8 of 55 Department of the Premier in collaboration with SALDRU
4.4.4.4. DEPARTMENT OF DEPARTMENT OF DEPARTMENT OF DEPARTMENT OF ECONOMIC DEVELOPMENT AND TOURISMECONOMIC DEVELOPMENT AND TOURISMECONOMIC DEVELOPMENT AND TOURISMECONOMIC DEVELOPMENT AND TOURISM
Table 4: Data sources in the Department of Economic Development and Tourism
Data source
Purpose
Type/Description of data
Year
Tenure
Sample size
Departmental
Operations Performance
Management System
Monitor
performance of all
projects, services
and initiatives of
the Department
Qualitative and
quantitative 2004 to the present
Daily
Correspondence
Management and
Tracking System
(CMaTS) and
GroupWise
Track progress of
all correspondence
in the Department
Track process of
liquor license
issuing
Consumer
complaint
registration system
Qualitative and
quantitative
2003 to the
present
Daily
Tourist Guide Database Capture, update
and maintain
information on
tourist guides
Qualitative and
quantitative
2004 to the
present
Daily
In Touch System Track and monitor
clients assisted by
the RED Door
Qualitative and
quantitative
2006 to the
present
Daily

Page 9 of 55 Department of the Premier in collaboration with SALDRU
5.5.5.5. DEPARTMENT OF DEPARTMENT OF DEPARTMENT OF DEPARTMENT OF ENVIRONMENTAL AFFAIRS AND DEVELOPMENT ENVIRONMENTAL AFFAIRS AND DEVELOPMENT ENVIRONMENTAL AFFAIRS AND DEVELOPMENT ENVIRONMENTAL AFFAIRS AND DEVELOPMENT
PLANNINGPLANNINGPLANNINGPLANNING
Table 5: Data sources in the Department of Environmental Affairs and Development Planning
Data source Purpose Type/Description of
data
Year
Tenure
Sample size
National
Environmental
Authorisation
System (NEAS)
Integrated
environmental
management tool
aimed at
providing an
environmental
reporting
mechanism on a
national
(Department of
Economic
Development and
Tourism [DEDT])
and provincial
(Department of
Environmental
Affairs and
Development
Planning
[DEADP]) level.
• Applicant details
• Location of environmental assessment
• Dates of decisions
• Date of application
• Records of decision
• Capturing EIA applications
• Updating EIA applications
• Enquiring on EIA application status
• Maintenance of information
• Reports, e-capturing, appending application file, authorisation
• Require additional functionality for Development Planning to be added
2004 the
present
Daily
Jtrack (File
tracking system)
Registry system
that tracks the
movement and
accountability for
physical files in
the Department
based on last
position/person
recorded
• Registration of physical files
• Allows users to accept files sent to them or to forward existing files to other users
• File numbers can be scanned in
• Reports on file movements
2006 to the
present
Daily
Web-enabled
information
system with
geographical
information
system
integration
functionality
Provide spatial
geographic data
to support
decision making
in the
Department's line
processes
• Provide selected access to spatial data and imagery to a few main users
• Provide internal editing capabilities
• Currently provides a mapping and spatial data provisioning function
In the process of
development
Daily
Integrated
Pollution and
This system helps
the regulation of
• Pollution and waste management
• Compliance
Development
complete but not
Daily

Page 10 of 55 Department of the Premier in collaboration with SALDRU
Waste Information
System (IPWIS)
the chemical,
pollutant and
waste cycle and
provides
accessible
information to
interested and
affected parties.
The system allows
for the collection,
analysis, storage
and dissemination
of data related to
the chemical,
pollutant and
waste cycle. It
integrates the
functions of a
Pollutant Release
and Transfer
Register and a
Register for Waste
Handlers.
management
• Complaints management
• Reporting
yet operational
Law Enforcement
and Compliance
System
(LAWSYS)
Departmental
record of all illegal
matters, non-
compliance
directives, court
review
applications,
prosecutions,
interdicts, court
judgments and any
other legal issues
related to the
Department
• Bill management and tracking module
• DEADP scheduling module (programme, bill, publishing, printing, distribution)
• DEADP resource booking module
• Committee and meeting module
In process of
development
Daily Not applicable
Land Use
Planning (LUP)
Administration and
monitoring of land
use planning
applications and
appeals in terms of
the Land Use
Planning
Ordinance (Ord.
15 of 1985)
• Zoning schemes
• Sub-divisions
• Departures from zoning scheme regulations
• Re-zonings
• Removal of restrictive title deed conditions
• Structure plans
In process of
development
Will be on
daily basis
Not applicable

Page 11 of 55 Department of the Premier in collaboration with SALDRU
6.6.6.6. DEPARTMENT OF DEPARTMENT OF DEPARTMENT OF DEPARTMENT OF HEHEHEHEALTHALTHALTHALTH
Table 6: Data sources in the Department of Health
Data source
Purpose
Type/Description of data
Year
Tenure
Sample size
Hospital
Information
System (HIS)
which is
Clinicom, Billing,
Materials
Management and
Pharmacy
Systems
Clinicom and
Billing: Records
patient master
index. Serves
outpatient and
inpatient
functions. Serves
a service group
function. Serves
patient fees
function. Serves a
patient fees
administration
function.
Materials
Management:
Handles stock
control,
procurement and
related cost centre
information for
central hospitals.
Pharmacy:
Pharmacy stock
control,
procurement and
dispensing at
central hospital
pharmacies.
Clinicom and Billing: Patient
demographics, patient OPD
referrals. Patient
clinical/diagnosis/ procedure.
Patient OPD booking/visits.
Patient admissions, discharges
and transfers. Patient medical
history. Case note tracking.
Patient theatre procedure.
Patient service group. Patient
fees administration. Management
and operational procurement
(ledger and journal entries). Cost
centre reporting.
Pharmacy: Stock control,
procurement, dispensing,
management and operational
reporting.
2001 Daily
Delta9 Record patient
master index.
Serve outpatient
and inpatient
function. Serve a
billing system
function.
Patient demographics. Patient
OPD referrals. Patient
clinical/diagnosis/procedure.
OPD booking/visits. Patient
admissions, discharges and
transfers. Patient case note
tracking. Patient fees
administration. Management and
operational reporting.
1991 Daily
SINJANI Capture a variety Performance data e.g. head 2006 Daily

Page 12 of 55 Department of the Premier in collaboration with SALDRU
of performance-
aggregated data
counts, PDEs, etc. from the
various hospitals
District Health
Information
Systems (DHIS)
Capture a variety
of performance-
aggregated data
Performance data e.g. head
counts, PDEs, etc. from the
various hospitals
±1998 Daily
Primary Health
Care Information
System (PHCIS)
Record patient
master index.
Records patient
CHC visits. To
interface with
Clinicom.
Patient demographics. Patient
CHC visits. Patient case note
tracking data. Management and
operational reporting.
2005 Daily
Meals Ordering
Dietician System
(MODS)
Allocate patient
meals to
inpatients
Patient meals allocated. Patient
meal changes. Operational and
management reporting data.
± 2005 Daily
CRADLE Capture obstetrics
and neonatal
patient activity
Obstetric and neonatal data of
patients
±2004 Daily
Nursing
Information
Management
System (NIMS)
Nursing personnel
administration
system
Nursing demographics. Leave
monitoring. Relieve and change
list. Night duty allowances.
Agency staff monitoring.
±2005 Daily
Emergency
Medical Service
(EMS)
Monitor and track
ambulances
Ambulance response times.
Major accidents/incidents.
±2006 Daily
Forensic
Pathology
System (FPS)
Record and
manage the
disposing of the
deceased
Death registration. Autopsy data.
Certification data. Alerting next of
kin data. Legal and forensic data.
2007 Daily
Electronic TB
register
Capture TB
register for the
province
All TB-related diseases and
activity data
Unknown Daily
Notifiable
diseases
Capture notifiable
diseases on an
electronic
schedule
Notifiable disease-related data Unknown Daily
National Tertiary
Services Grants
(NTSG)
Capture all the
aggregated data
related to the
various medical
specialisations
Performance-aggregated data
related to specialisations at
central hospitals.
Unknown Daily

Page 13 of 55 Department of the Premier in collaboration with SALDRU
Cost Centre
Manager
Create cost centre
codes for central
hospitals
Cost centre code creation data ±2005 Daily

Page 14 of 55 Department of the Premier in collaboration with SALDRU
7.7.7.7. DEPARTMENT OF DEPARTMENT OF DEPARTMENT OF DEPARTMENT OF LOCAL GOVERNMENT AND HOUSINGLOCAL GOVERNMENT AND HOUSINGLOCAL GOVERNMENT AND HOUSINGLOCAL GOVERNMENT AND HOUSING
Table 7: Data sources in the Department of Local Government and Housing
Data source
Purpose
Type/Description of
data
Year
Tenure
Sample size
CMIP
The information and
data is designated
per municipal area
and is provided by:
GPS surveys;
municipalities
(engineering
services and
finance); and
consultancies and
other government
departments
Expenditures, project
information, capacity
information of
municipalities
Continuously
Municipal
Infrastructure
Grant (MIG)
To support
municipalities in their
bulk infrastructural
development
MIG MIS National
Database
April 2006 to the
present
Continuously (Data spans the
province for all
municipalities
where
infrastructural
development is
taking place)
AFRICON Play project
management role
within LGH
Water services (bulk and
reticulation) by
municipalities
1997 to the
present
Continuously
Directorate:
Monitoring and
Evaluation
(Municipal
Performance
Snapshot)
This newly
established
Directorate monitors
and evaluates non-
financial information
i.e. performance of
the department with
a specific focus on
measuring the
impact of the
department's
strategic plan.
The directorate is
divided into two sub-
The snapshot consists of
non-financial quantitative
information
2006 and 2007 Quarterly Covered 18
municipalities

Page 15 of 55 Department of the Premier in collaboration with SALDRU
directorates.
Municipal
Performance is
responsible for the
Municipal Snapshot.
The Snapshot serves
as an early warning
tool and gives an
overall view of
municipalities and
focuses on the five
KPAs.
(Please note that we
do not have any
current datasets but
we are in the
process of
establishing an MIS
for the entire
department that will
serve as a data-
warehouse.)
ADABAS:
Planning and
development
The Directorate:
Asset Management
utilises this national,
financial and
information
management system
to verify the
ownership status of
properties and to
monitor debtors. It is
a national system
which is managed
and maintained by
the national
department.
Debtors (rent, rates and
taxes). The following are
also monitored:
• Appropriate asset
property planning
• Debtors and renting
of properties owned
by the Housing
Board
• Management and
maintenance of
housing properties
owned by the
Housing Board.
Daily
The performance of
specific programmes
is monitored to
provide information
for the national
database and to
The Directorate: Human
Settlement Development
monitors the following
and thus has data on:
• Sustainable and
integrated social

Page 16 of 55 Department of the Premier in collaboration with SALDRU
provide an input for
the departmental
annual report.
Information is not
necessarily
designated
according to
municipal areas but
is available per
programme.
housing
environments
• Settlement
upgrading and
development
• Sustainable
settlement post
land restitution
• Emergency housing
provision
• Spending on
programmes
• Management of
informal
settlements
The department has
a legislative mandate
to oversee housing
delivery within the
province and that
housing delivery
mechanisms are
implemented and
aligned with existing
policy. Information is
analysed and
evaluated frequently
and is available per
municipal area.
The Directorate:
Planning and Research
monitors the following:
• The implementation
of the departmental
housing plan
• The viability and
implementation of
sectoral housing
plans of
municipalities
The Directorate: Housing
Project Administration
monitors the following:
• Housing project
administration,
applications and
approvals
• Provincial housing
subsidy
administration,
applications and
Page 17 of 55 Department of the Premier in collaboration with SALDRU
approvals
• Delivery of housing
and subsidy
opportunities in
terms of budget
allocation.
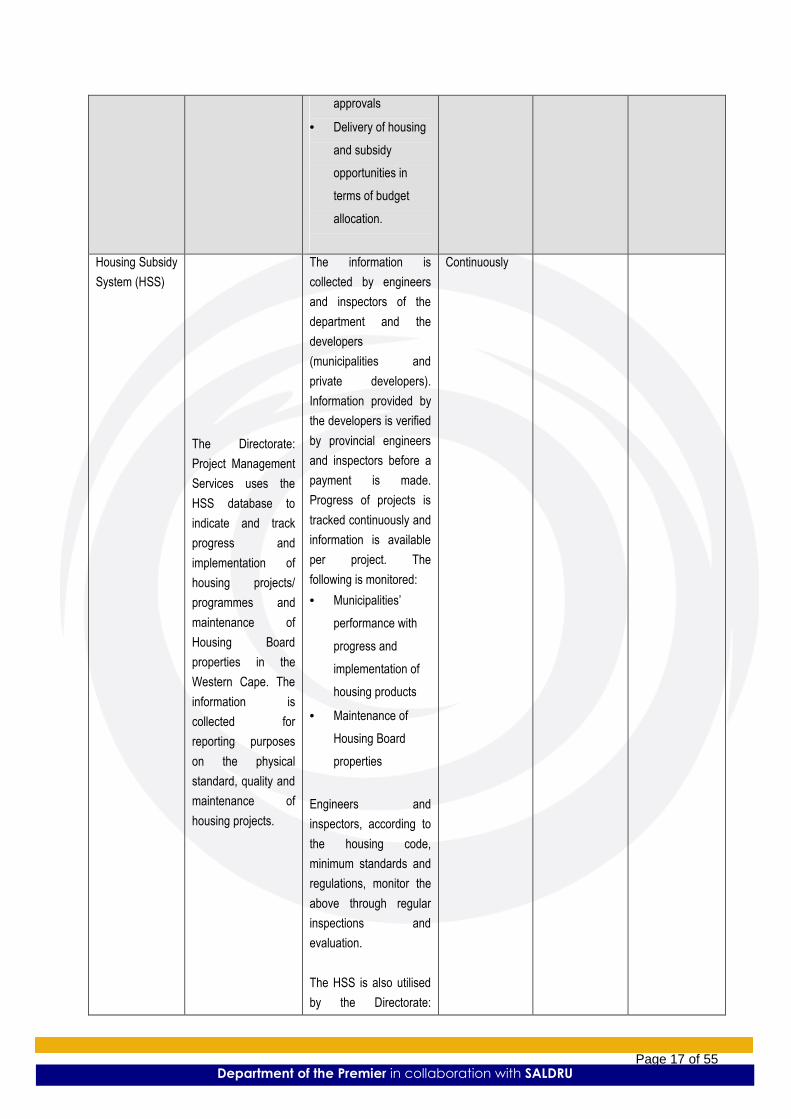
Housing Subsidy
System (HSS)
The Directorate:
Project Management
Services uses the
HSS database to
indicate and track
progress and
implementation of
housing projects/
programmes and
maintenance of
Housing Board
properties in the
Western Cape. The
information is
collected for
reporting purposes
on the physical
standard, quality and
maintenance of
housing projects.
The information is
collected by engineers
and inspectors of the
department and the
developers
(municipalities and
private developers).
Information provided by
the developers is verified
by provincial engineers
and inspectors before a
payment is made.
Progress of projects is
tracked continuously and
information is available
per project. The
following is monitored:
• Municipalities’
performance with
progress and
implementation of
housing products
• Maintenance of
Housing Board
properties
Engineers and
inspectors, according to
the housing code,
minimum standards and
regulations, monitor the
above through regular
inspections and
evaluation.
The HSS is also utilised
by the Directorate:
Continuously

Page 18 of 55 Department of the Premier in collaboration with SALDRU
Service Delivery and
Community
Empowerment and
monitors the following:
• Management and
implementation of
the PHP projects
• Economic
empowerment of
communities and
emerging
contractors
• Capacity building
programmes for
municipalities,
NGOs and
communities
People's
Housing Project
(PHP)
Information on the
PHP is collected for
the following
reasons:
• Annual report
• Ministerial
inquiries
• Parliamentary
questions
• Human Rights
Report
Information on the
EPWP must be
submitted on a
monthly basis to the
Department of Public
Works and Transport
and capacity building
information is
provided on a
bimonthly basis to
the national
Department of
Housing and for
The Directorate: Service
Delivery and Community
Empowerment collects
the following information:
• Progress on the
PHP projects
• Reporting on the
EPWP
• Information on
training courses
provided
Continuously

Page 19 of 55 Department of the Premier in collaboration with SALDRU
input into the annual
report of the
department.

Page 20 of 55 Department of the Premier in collaboration with SALDRU
8.8.8.8. DEPARTMENT OF DEPARTMENT OF DEPARTMENT OF DEPARTMENT OF SOCIAL DEVELOPMENTSOCIAL DEVELOPMENTSOCIAL DEVELOPMENTSOCIAL DEVELOPMENT
Table 8: Data sources in the Department of Social Development
Data source
Purpose
Type/Description of
data
Year
Tenure
Sample Size
Network Drive
based/Database
Harbouring data
in the form of
monitoring,
assessment,
analysis and
global reports on
district offices
and facilities
respectively
Type of data stored:
• Assessment and
analysis reports
of district offices
based on the
Organisational
Capacity
Assessment Tool
(OCAT)
• Monitoring of
district offices
based on the
monitoring tool to
be amended to fit
the 8
programmatic
approach of
Social
Development
• Global Reports:
Towards
understanding
the global
regional picture
as it emanated
from the
assessment
reports
The OCAT focuses on
the following elements:
• Governance
• Management
practices
2003 to 2007 Quarterly Assessment,
analysis and
global reports:
800 funded
organisations
and 16 district
offices
assessed.

Page 21 of 55 Department of the Premier in collaboration with SALDRU
• Human resource
management
• Financial
management
• Service delivery
• Integration and
sustainable
service delivery
Assessment of
remaining
services to
children
An assessment of
services rendered to
children via children's
homes and other safe
havens
Periodic
assessments
Quarterly All 16 district
offices (two
offices still
remaining)
Development
and subsequent
implementation
of a monitoring
and evaluation
strategy.
To be reviewed
in 2008.
Review
process 2008
The development
and subsequent
implementation
of the monitoring
tool focusing on
assessing
governance,
management
and service
delivery practices
in district offices.
2007 Three-yearly
monitoring
process
Offices
monitored:
Vredendal and
Caledon district
offices

Page 22 of 55 Department of the Premier in collaboration with SALDRU
9.9.9.9. DEPARTMENT OF DEPARTMENT OF DEPARTMENT OF DEPARTMENT OF PROVINCIAL TREASURYPROVINCIAL TREASURYPROVINCIAL TREASURYPROVINCIAL TREASURY
Table 9: Data sources in Provincial Treasury
Data source
Purpose
Type/Description
of data
Year
Tenure
Sample Size
Budget
overview [up
to 2002
compiled with
Estimates of
Provincial
Expenditure
(EPE) and
Local
Government
allocations
(LGA)]
Overview of the
budget
Financial and
non-financial data
2002 Annually PGWC Paul
Pienaar
Estimates of
Provincial
Expenditure
(EPE)
Statement of
budgets per vote
Financial and
non-financial data
2005 Annually PGWC Paul
Pienaar
Local
Government
allocations
(LGA)
Convey allocation
from departments to
municipalities
Allocations to
municipalities and
the conditions
linked thereto
2006 Annually PGWC and
municipalities
Graham
Paulse
Provincial
Economic
Review and
Outlook
(PERO)
Review of the
current socio-
economic situation
of the Western Cape
and three-year
outlook
Macro-economic
review and
forecast for the
Western Cape
economy
including labour
market,
demographic
trends and
poverty analysis
2006 to
2011
Annually PGWC
(Western
Cape
boundaries)
Wendy
Mapira
Socio-
economic
profiles
To provide a socio-
economic profile per
municipality, district
and the CoCT
Various economic
and related
information per
district and the
CoCT
2006/2007 Annually PGWC and all
30
municipalities
Wendy
Mapira

Page 23 of 55 Department of the Premier in collaboration with SALDRU
Western Cape
Medium-Term
Budget Policy
Statement
(precursor to
the Western
Cape Fiscal
Policy 2001-
2003)
Set out medium-
term policies and
provincial revenue
sources for the
following medium-
term expenditure
framework (MTEF)
Policy and
financial data
2004 Annually PGWC and
the public
Paul
Pienaar
Revised
estimates of
provincial
expenditure
Revision to
statements of
budgets per vote
Financial Old Annually PGWC
departments
and public and
trading entities
Analiese
Pick
Consolidated
financial
statement
Consolidated
financial
performance and
position of the
PGWC
departments/entities
Financial
statements
2006/07 Annually PGWC
departments
and public and
trading entities
Henri du
Toit
Nic van
Niekerk
Financial
Governance
Review and
Outlook
Review of financial
governance
Financial
management
capability
assessments
2006/07 Annually PGWC
departments
and public and
trading entities
Henri du
Toit

Page 24 of 55 Department of the Premier in collaboration with SALDRU
10.10.10.10. DEPARTMENT OF THE PREMIERDEPARTMENT OF THE PREMIERDEPARTMENT OF THE PREMIERDEPARTMENT OF THE PREMIER
Table 10: Data sources in the Department of the Premier
Data source
Purpose
Type/Description of
data
Year
Tenure
Sample Size
Situational
analysis report
(skills
development)
• Perform a
situational
analysis of
skills
development in
the Western
Cape.
• Provide data to
be used in the
development of
skills strategy
for the Western
Cape.
Consider the supply
side of the economy
and skills initiatives
embarked on by the
public sector. It also
offers
recommendations on
the way forward:
• Labour force
• Employment
• Skills
• Quantitative data
2007 Once-off Mainstream
household data
(including
census)
National Skills
Fund Report
(skills
development)
Report on the
progress of NSF
projects for the
Department of
Labour
Report that outlines
expenditure on NSF
projects
• Cost and
beneficiary
comparison
2007/2008 Quarterly Five skills
training
programmes
Area managers
report
(Social
Transformation
Programme)
• Determine
status quo of
intermediary
structures
• Address
problems and
challenges
within
communities
• Successes
• Upcoming
dates/events
• Commitments
of policy/
administrative
champions
Reports
Qualitative data
2007 Should be
quarterly but not
yet
institutionalised
21 areas

Page 25 of 55 Department of the Premier in collaboration with SALDRU
Jamboree
reports
(Social
Transformation
Programme)
Quantitative data
Headcounts at
jamborees per
delivered services in
21 areas
Annually/21
areas
2007/2008 21 areas
Intermediary
structure contact
details
(Social
Transformation
Programme)
To ensure proper
communication
between the
government and
communities and to
foster participation
Currently 15 of
the 21 areas
Pre-Imbizo reports
for the 21 priority
areas
Briefing notes to
political principals
Document outlines
demographics, population,
achievements and
challenges, as well as
future plans for each line
department for each of the
21 priority areas.
April and October
2006
April, June
(Deputy President
Visit)
July (Presidential
Imbizo)
November Imbizo
Two per year
depending on the
Presidential
Imbizo
21 priority areas
High Level Imbizo
Report
Final findings
report to PTM and
Cabinet
Document outlines all key
issues raised at every
Imbizo in the 21 priority
areas. Document also
highlights impact
assessment based on the
Imbizo held in April 2006.
April and October
2006
July 2007
(Presidential
Imbizo)
Two per year,
after each Imbizo.
One Presidential
High Level
Report.
Cluster Report
Cards
Progress Reports
on Provincial
Programme of
Action (PPOA) to
the National
Programme of
Action (NPOA)
Progress Report on PPOA
aligned to the NPOA to
FOSAD and PCC
2004, 2005, 2006
and 2007
Biannually
Pre-Imbizo Reports
for the 21 priority
areas
Briefing notes to
political principals
Document outlines
demographics, population,
achievements and
challenges, as well as
future plans for each line
department for each of the
21 priority areas
April, and October
2006 April, June
(Deputy President
Visit)
July (Presidential
Imbizo)
November Imbizo
Two per year
depending on the
Presidential
Imbizo
21 priority areas
End of Year Report Report is written in
preparation of the
State of the Nation
Address and
January Cabinet
Document highlights
progress on behalf of the
PGWC based on the
priorities set out in the
State of the Nation
2004 to 2007 Annually

Page 26 of 55 Department of the Premier in collaboration with SALDRU
Lekgotla for the
next year as per
input on behalf of
the PGWC.
Address, as well as
agreed upon at the
January Cabinet Lekgotla
UPDATE: PROFILING OF PROVINCIAL ADMINISTRATIVE DATA SOURCES
This part of the Core Directory of common data sources (CDCDS) Part 2 is a composite system that draws its data
from contributory systems that provides administrative data sources for the compendium of indicators for the PSP.
One of the important aspects is for the reader to understand the context in which provincial departments compile and
construct data sources. Therefore it directs the reader regarding the identification and location of existing data
sources constructed and most commonly used by the PGWC and to assess the data set according to the
requirements of data quality, its usability, the frequency of use and the limitations and strengths of the design of the
data set.
The provincial administrative data obtained from the departments through the development of the PWMES via the
two M and E Audits and the Data Assessment process, conducted in the Provincial Government of the Western
Cape, constitutes the main body of this CDCDS: Part 2. The data sources are profiled in terms of:
• The data source
• The purpose of the data source
• The type of data contained in the data source
• The year that the data source addresses
• The tenure (frequency of update) of the data source
As can be gleaned, the same methodology has been adopted for this process as has been the case with the
CDCDS: Part 1 which focuses on the profiling of mainstream/developmental data sources. The first phase of this
process formed part of the CDCDS: Part 1. Through the Data Assessment Study the process was taken further and
the CDCDS: Part 2 was constructed.
Another important aspect relates to the assessment and quality assurance of the existing departmental data in terms
of the requirements of quality data as in the context of the principles and guidelines of the South African Statistical
Quality Assessment Framework (SASQAF). This process has contributed to the delivery of this CDCDS: Part 2 for
the compendium of indicators for the PSP. These common data sources consists of provincial administrative data
sources owned amongst the data users and data producers within the PGWC.

Page 27 of 55 Department of the Premier in collaboration with SALDRU
1. Provincial Administrative Data Sources currently in PGWC
1. Department of Agriculture
Table 1: Data Sources in the Department of Agriculture
Data Source Purpose Type/Description of
Data
Year
Tenure
Sample
Size
Game Species
auction prices
To monitor
auction prices of
game species
Annual average and highest
individual game specie
prices realised at game
auctions
1990 - present
Monthly
100%
Agritourism
ventures
Determination of
spatial growth of
agritourism
ventures;
sourcing of
statistics for
managerial
purposes
Contact details, GPS
waypoints; ecotourism
ventures, wine cellars, farm
accommodation, 4x4 routes;
restaurants
2007
Continuously
100%
Agricultural land
market prices
To track regional
prices paid on
actual markets for
agricultural land
Agricultural land prices in
Rand/hectare; farms
grouped per region with
three farm size categories
per region
2003 - present
Weekly 100%
Database on
Emerging
Farmers
To understand,
monitor and
assist emerging
farming sector
through spatial
data
Farm and farmer details,
types of farming, spatial
location; land utilization
patterns
2006
Once off
100%
Agricultural
Potential
An index
indicating the
production
potential of
rangeland.
Can be used as an indicator
of agricultural biomass
production potential in
general.
1999 - present As required 100%
Climate 100%
Farming Areas To define areas
with common
agricultural
practices and
conditions
Homogenous Farming Areas As required 100%
Field
Boundaries
Demarcation of
agricultural land.
The dataset contains all the
field crop boundaries in the
Western Cape province of
South Africa. Field crop
boundaries are defined as
2006 Every 4 years 100%

Page 28 of 55 Department of the Premier in collaboration with SALDRU
the result of different
cropping patterns within one
field boundary, planting
different crops or the same
crop at different planting
dates. This separation is not
always fixed, and could vary
from year to year.
Grazing
Capacity
Agricultural grazing capacity
in the Western Cape. Ha per
large stock unit.
2008 100%
Infrastructure
Research
Farms
Define the
infrastructure of
each research
farm of the DOA
Spatial data of all the
research farms of the DOA.
2008 – present As required 100%
Infrastructure
Regional Offices
Indicate the
location of the
regional offices of
the DOA.
DOA regional offices in the
Western Cape
2008 – present As required 100%
Infrastructure
Silos
Indicate the
location of silos in
the Western Cape
Silos in the Western Cape As required 100%
Infrastructure
Wine Cellars
Indicate the
location of wine
cellars in the
Western Cape
Wine Cellars in the Western
Cape
2002 – present As required 100%
Land cover Describe the type
of land cover
Land cover classification of
the Western Cape
2000 – present 100%
Land type Describe the soils
that occur in the
Western Cape
Detailed description of soils
in the Western Cape
2007 - present Yearly 100%
Land use To indicate the
distribution of the
main agricultural
activities in the
province on a
broad scale
Land use categories of the
Western Cape
1992 100%
Soil surveys Detailed soil
descriptions per
farm
Soil surveys conducted at
farm level
As required 100%
Database on
livestock breed
auction prices
To track and
monitor auction
price trends of
livestock species
Annual average and highest
individual livestock breed
prices realised at game
auctions
2008 Monthly 100% as
provided by
media

Page 29 of 55 Department of the Premier in collaboration with SALDRU
2. Department of Community Safety
Table 2: Data Sources in the Department of Community Safety
Data Source Purpose Type/Description of
Data
Year
Tenure
Sample Size
Volunteer Database
Record-
keeping of all
details of all
Bambanani
Volunteers
Name, Surname,
Address, Project
involvement, NHWatch
involvement,
community
involvement, Education,
race, sex, stipends paid
to volunteer, CPF
Details, etc.
2005, 2006,
2007
Daily
Child Rapid
Response Unit
(CRRU)
(Community
Liaison)
Record-
keeping of all
missing
children
reported to
CRRU
Name, Surname,
Address, age, race,
sex, photograph and
situational
circumstances of child,
SAPS Mas or Case
No., parents details,
suspect details in
certain cases
2005, 2006,
2007
Daily
Network Drive –
Shared on ‘Cus-
35w it/Data’
(S)/CCP/Project
Registration
databases/2002-
2008 Registration
base
Registration
of projects
Project details and
description, funding
requests and
allocations, comments
and project status
2001 - 2008 [Regular basis with regards to outstanding information on project closure]
• 184
registered
projects
• 375
registered
projects
• 377
registered
projects
• 378
registered
projects
• 204
registered
projects
• 67 registered
projects
• 21 provincial
STP areas

Page 30 of 55 Department of the Premier in collaboration with SALDRU
Database of
school-based
Bambanani
volunteers
Names of volunteers,
ID number, address,
training status,
educational
qualification
2006/2007 Daily 499 Bambanani
volunteers
Database of
provincial
victim support
volunteers
(VSV)
Where VSV are based,
ID number, personal
details, training status
2007/2008 Weekly 1579 victims
support volunteers
Volunteer Database
Record-
keeping of all
details of all
Bambanani
Volunteers
Name, Surname,
Address, Project
involvement, NHWatch
involvement,
community
involvement, Education,
race, sex, stipends paid
to volunteer, CPF
Details, etc.
2005, 2006,
2007
Daily
Child Rapid
Response Unit
(CRRU)
(Community
Liaison)
Record-
keeping of all
missing
children
reported to
CRRU
Name, Surname,
Address, age, race,
sex, photograph and
situational
circumstances of child,
SAPS Mas or Case
No., parents details,
suspect details in
certain cases
2005, 2006,
2007
Daily

Page 31 of 55 Department of the Premier in collaboration with SALDRU
3. Department of Cultural Affairs and Sport
Table 3: Data Sources in the Department of Cultural Affairs and Sport
Data
Source
Purpose Type/Description
of Data
Year
Tenure
Sample
Size
PALS Library Information Electronic / Hard
copies
NAAIRS Archive Services
resources and
artifacts
Electronic / Hard
copies
Database in
each Provincial
Museum
Provincial Museum
Resources and
Museum Technical
Services and
Museum Scientific
Services.
(Information about
museum resources
and artifacts)
Electronic / Hard
copies
Database
about various
Cultural
Resources
Cultural projects Electronic / Hard
copies
Database
about various
Heritage
Resources
Heritage projects Electronic / Hard
copies
Database
about Sport
Resources
Sport Projects
(including adult
sport and school
sport)
Electronic / Hard
copies
Reports Programme/projects
update/ progress
Soft and hard copy

Page 32 of 55 Department of the Premier in collaboration with SALDRU
4. Department of Economic Development and Tourism
Table 4: Data Sources in the Department of Economic Development and Tourism
Data Source Purpose Type/Description
of Data
Year
Tenure
Sample Size
Departmental
Operations
Performance
Management
System
Monitor
performance of all
projects, services
and initiatives in the
Department
Qualitative and
quantitative
2004 - current Daily basis
CMATS and
GroupWise
Track progress of
all correspondence
in the Department.
Track process of
liquor license
issuing.
Consumer
complaint
registration system.
Qualitative and
quantitative
2003 - current Daily basis
Tourist Guide
Database
Capture, update
and maintain
information on
tourist guides
Qualitative and
quantitative
2004 - current Daily basis
In Touch System Track and monitor
clients assisted by
the RED Door
Qualitative and
quantitative
2006 - current Daily basis

Page 33 of 55 Department of the Premier in collaboration with SALDRU
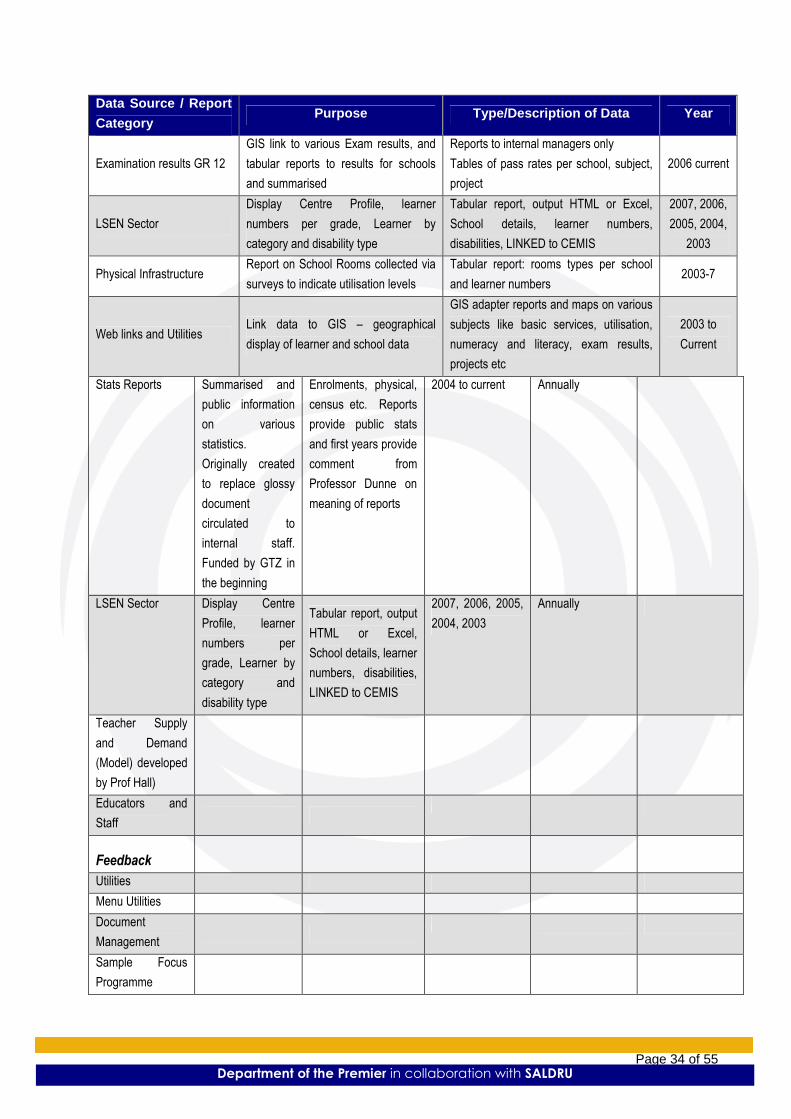
5. Department of Education
Table 5: Data Sources in the Department of Education
Data Source / Report
Category Purpose Type/Description of Data Year
Stats Reports
Summarised and public information on
various statistics. Originally created to
replace glossy document circulated to
internal staff. Funded by GTZ in the
beginning
Enrolments, physical, census etc.
Reports provide public stats and first
years provide comment from Professor
Dunne on meaning of reports
2004 to
current
Institutions Mailing list of institutions categorised
by sector etc
Emis number and address details of open
institutions. Reports can be custom
selected by different parameters
Current
open
Institutions School profile etc
Details per institution. Includes
promotions, exams results, infrastructure,
school fees, address, enrolment, staff
establishment etc
1996 to
current
Enrolments: Public Ordinary
Schools
Provide learner numbers per year as
per Snap, Annual surveys or CEMIS
current
Tables of learners numbers from the
Surveys per grade for the province,
district, circuit, school per gender
1996 to
current
Promotion Survey Promotion report from Gr1 to grade 11
Tables in graphic or tabular form drills
down to school level. Pass and NP
numbers and rates per grade. Drills down
from province to school level
2007, 2006,
2003
ABET Centre ABET list of schools, display survey
information and centre profiles
Tables and graphs of learner numbers
per level and age per centre.
Centre profiles per survey year
2007, 2006,
2005, 2004,
2003
Staff Establishments Report on the basket, the allocation,
process determination and calculation SE records, letters to schools 2005 – 2008
Numeracy/Literacy
Competency Assessment
Study
Provide reports on literacy and
numeracy studies Reports: Tables and graphs
2003
Current
Finance and Budgets Report on no fee schools, section 21,
norms and standards and poverty Tabular reports
2007
Current
Treasury and other Reports Annual and quarterly treasury reports Tabular reports 2007
Current
Survey Forms Make SNAP and Annual survey
instruments available to management
Copies of the SNAP and Annual forms
that schools must complete 2005
Maps and Charts Maps and charts with summarised
data per district, sector and province Maps and Chart 2003 – 5
Schools Projects Provide to managers a view of schools
and projects. Tabular reports Current
Verification Queries
Current reports on learners and data
verification checks for CEMIS, SNAP,
ASS and for various sectors
Reports that drill down Current
Page 34 of 55 Department of the Premier in collaboration with SALDRU
Data Source / Report
Category Purpose Type/Description of Data Year
Examination results GR 12
GIS link to various Exam results, and
tabular reports to results for schools
and summarised
Reports to internal managers only
Tables of pass rates per school, subject,
project
2006 current
LSEN Sector
Display Centre Profile, learner
numbers per grade, Learner by
category and disability type
Tabular report, output HTML or Excel,
School details, learner numbers,
disabilities, LINKED to CEMIS
2007, 2006,
2005, 2004,
2003
Physical Infrastructure Report on School Rooms collected via
surveys to indicate utilisation levels
Tabular report: rooms types per school
and learner numbers 2003-7
Web links and Utilities Link data to GIS – geographical
display of learner and school data
GIS adapter reports and maps on various
subjects like basic services, utilisation,
numeracy and literacy, exam results,
projects etc
2003 to
Current
Stats Reports Summarised and
public information
on various
statistics.
Originally created
to replace glossy
document
circulated to
internal staff.
Funded by GTZ in
the beginning
Enrolments, physical,
census etc. Reports
provide public stats
and first years provide
comment from
Professor Dunne on
meaning of reports
2004 to current Annually
LSEN Sector Display Centre
Profile, learner
numbers per
grade, Learner by
category and
disability type
Tabular report, output
HTML or Excel,
School details, learner
numbers, disabilities,
LINKED to CEMIS
2007, 2006, 2005,
2004, 2003
Annually
Teacher Supply
and Demand
(Model) developed
by Prof Hall)
Educators and
Staff
Feedback
Utilities
Menu Utilities
Document
Management
Sample Focus
Programme

Page 35 of 55 Department of the Premier in collaboration with SALDRU
6. Department of Environmental Affairs and Development Planning
Table 6: Data Sources in the Department of Environmental Affairs and Development Planning
Data Source Purpose Type/Description of
Data
Year
Tenure
Sample
Size
NEAS (National
Environmental
Authorisation
System)
Integrated
Environmental
Management tool
aimed at providing
an Environmental
reporting
mechanism on a
national (DEAT)
and provincial
(DEADP) level
• Application details
• Location of Environmental
Assessment
• Dates of decisions
• Date of Application
• Records of Decision
• Capturing EIA applications
• Updating EIA applications
• Enquiring on EIA
application statuses
• Maintenance of
information
• Reports, e-Capturing,
appending application file,
authorization
• Require additional
functionality for
Development Planning to
be added
2004 - current Daily
Jtrack (File
tracking system)
Registry system
that tracks the
movement and
accountability for
physical files in the
Department based
on last
position/person
recorded
• Registration of physical
files
• Allows users to accept
files sent to them for
forward existing files to
other users
• File numbers can be
scanned in
• Reports on file
movements
2006 - current Daily
Web-enabled
Information
System with
Geographical
Information
System
Provide spatialised
geographic data to
support decision
making in the
Departments line
processes
• Provide selected access
to spatial data, imagery to
a few main users.
• Provide internal editing
capabilities.
In process of
development
Daily

Page 36 of 55 Department of the Premier in collaboration with SALDRU
integration
functionality
• Currently provides a
mapping and spatial data
provisioning function.
Integrated Pollution and Waste Information System (IPWIS)
This system helps
regulation of the
chemical, pollutant
and waste cycle
and provides
accessible
information to
interested and
affected parties.
The system allows
for collection,
analysis, storage
and dissemination
of data related to
the chemical,
pollutant and waste
cycle. Integrates
the functions of a
Pollutant Release
and Transfer
Register and a
Register for Waste
Handlers.
• Pollution and Waste Management
Development
complete but
not yet
operational
Daily
LAWSYS (Law Enforcement and Compliance System)
Departmental
record of all illegal
matters, non-
compliance
directives, court
review applications,
prosecutions,
interdicts, court
judgments and any
other legal issues
related to the
Department.
• Bill management and
tracking module
• DEADP scheduling model
(programme, bill,
publishing, printing,
distribution)
• DEADP resource booking
module
• Committee and meeting
module
In process of
development
Daily
LAND USE PLANNING (LUP)
Administration and
Monitoring of Land
Use Planning
Applications and
Appeals in terms of
LUPO (Ord. 15 of
1985) and the
Removal of
• Zoning schemes
• Sub-divisions
• Departures from Zoning
Scheme regulations
• Re-zonings
• Removal of restrictive title
In process of
development
Will be on a
daily basis

Page 37 of 55 Department of the Premier in collaboration with SALDRU
Restrictions Act,
1967 (Act 84 of
1967).
deed conditions
• Structure plans
7. Department of Health
Table 7: Data Sources in the Department of Health
Data Source Purpose Type/Description of
Data
Year
Which year does the data source address
Tenure
How often is
data source
updated
Sample
Size
Hospital Information
System (HIS) which
is Clinicom, Billing,
Materials
Management &
Pharmacy Systems
Clinicom and
Billing: Records
Patient Master
Index. Serves
outpatient
functions, serves
inpatient functions.
Serves a Service
Group Function.
Serves a Patient
Fees Function.
Serves a Patient
Fees
Administration.
Materials
Management:
Handles stock
control,
procurement and
related cost centre
information for
Central Hospitals.
Pharmacy:
Pharmacy Stock
Control,
Procurement and
Dispensing in
Central Hospital
Pharmacies.
Clinicom and Billing:
Patient Demographics,
Patient OPD Referral
Data. Patient
Clinical/diagnosis/procedu
re data. Patient OPD
booking/visits data.
Patients’ admissions,
discharges & transfers
data. Patient medical
history. Case note
tracking data. Patient
theatre procedure data.
Patient service group
data. Patient fees
administration data.
Management and
operational procurement
data (ledger & journal
entries). Cost centre
reporting data. Pharmacy
Stock Control data,
procurement data,
dispensing data,
management and
operational reporting data.
2001 Daily
Delta9 Records Patient
Master Index.
Patient demographics.
Patient OPD referral data.
1991 Daily

Page 38 of 55 Department of the Premier in collaboration with SALDRU
Serves Outpatient
function. Serves
Inpatient function.
Serves a billing
system function
Patient
Clinical/Diagnosis/Proced
ure data. OPD
booking/visits data.
Patients’ Admissions,
discharges & transfers
data. Patients case note-
tracking data. Patient fees
administration data.
Management and
operational reporting.
SINJANI System used for
the capture of a
variety of
performance-
aggregated data.
Performance Data e.g.
Head counts, PDE’s etc.
from the various hospitals.
2006 Daily
District Health
Information
Systems (DHIS)
System used for
the capture of a
variety of
performance-
aggregated data.
Performance data e.g.
Head counts, PDE’s etc.
from the various hospitals.
±1998 Daily
Primary Health
Care Information
System (PHCIS)
Records Patient
Master Index.
Records Patients
CHC visits. To
interface with
Clinicom
Patient demographics.
Patient CHC visits.
Patient case note tracking
data. Management and
Operational reporting.
2005
Daily
Meals Ordering
Dietician System
(MODS)
Allocates patient
meals to inpatients.
Patient meals allocated.
Patient meal changes.
Operational and
Management reporting
data.
± 2005 Daily
CRADLE Capture Obstetrics
and Neonatal
patient activity
Obstetrics and neonatal
data of patient.
±2004 Daily
Nursing Information
Management
System (NIMS)
Nursing personnel
admin system
Nursing demographics.
Leave monitoring. Relieve
and change list. Night
duty allowances. Agency
staff monitoring.
±2005 Daily
Emergency Medical
Service (EMS)
Monitoring and
tracking
ambulances
Ambulance response
times. Major
accidents/incidents.
±2006 Daily
Forensic Pathology
System (FPS)
System for
recording and
Death registration.
Autopsy data.
2007 Daily

Page 39 of 55 Department of the Premier in collaboration with SALDRU
managing the
disposing of the
deceased.
Certification data. Alerting
next of kin data. Legal
and forensic data
Electronic TB
Register
Capture TB
Register for the
Province.
All TB related diseases
and activity data.
Unknown Daily
Notifiable Diseases Capturing notifiable
diseases on an
electronic
schedule.
Notifiable disease related
data.
Unknown Daily
National Tertiary
Services Grants
(NTSG)
Capturing all the
aggregated data
related to the
various Medical
Specialities.
Performance aggregated
data related to specialities
within the Central
Hospitals.
Unknown Daily
Costs Centre
Manager
To create Cost
Centre Codes for
the Central
Hospitals
Cost centre code creation
data
±2005 Daily
DHIS 1.4 (update of
previous version of
DHIS)
System used for
the capture of a
variety of
performance-
aggregated data
and now includes
Notifiable Diseases
Performance data e.g.
Head counts, PDE’s etc.
from the various hospitals.
2007 Daily
ART System (Anti
Retroviral
Treatment)
Managing patients
on Anti Retroviral
Treatment
Clinical summary of
individual patients
treatment
2007 Daily

Page 40 of 55 Department of the Premier in collaboration with SALDRU
8. Department of Local Government and Housing
Table 8: Data Sources in the Department of Local Government and Housing
Data Source Purpose Type/Description of
Data
Year
Tenure
Sample
Size
CMIP
CMIP programme no longer
exists and had been
replaced by the MIG
The information and data is
designated per municipal
area and is provided by:
GPS Surveys Municipalities
(engineering services and
finance)
Consultancies and other
government departments
Expenditures, Project
Information, Capacity
Information municipalities
Continuous
MIG (Municipal
Infrastructure
Grant)
To support municipalities in
their bulk infrastructural
development
MIG MIS National Data
Base
April 2006 -
current
Continuous [Data spans
across the
province for all
municipalities
where
infrastructural
development is
taking place]
AFRICON
Africon is an engineering
company, which can be seen
as a valuable source of data
or as a programme. They are
very involved in the MIG and
would be the first to turn to if
we are called upon for
information on the MIG/CMIP
Playing project management
role within LGH
Water services, bulk and
reticulation with
municipalities
1997- current Continuous
M and E
Directorate:
Municipal
Performance
Snapshot
The Municipal Snapshot –
serves as an early warning
tool and gives an overall
view of municipalities
focusing on the five KPA’s.
Data sets are under
development and we are
coordinating the collection of
information with sister
departments like DEDAT,
DEADP, PT and where
The snapshot consist of
quantative and Non-
financial quantitative
information
2006 and
2007
and
2008
Quarterly Covered 20
municipalities
in the 3d
quarter of the
2007/8
municipal
financial year

Page 41 of 55 Department of the Premier in collaboration with SALDRU
necessary municipalities.
The newly established
Information management unit
will in future be the hub of
information from where M&E
will draw its information.
ADABAS –
Planning and
Development
The Directorate: Asset
Management utilises this
national, financial and
information management
system to verify ownership
status of properties and
monitor debtors. It is a
national system, which is
managed and maintained by
the national department.
Debtors (rent, rates and
taxes). The following are
also monitored:
• Appropriate asset
property planning
• Debtors and renting
of properties owned
by the Housing Board
Management and
maintenance of housing
properties owned by the
Housing Board.
Daily
Human
Settlement Data
sources
The performance of specific
programmes is monitored to
provide information for the
national database and to
provide an input for the
departmental annual report.
Information is not necessarily
designated according to
municipal areas but is
available per programme.
The department has a
legislative mandate to
oversee housing delivery
within the province and that
housing delivery
mechanisms are
implemented and aligned
with existing policy.
Information is analysed and
evaluated frequently and is
available per municipal area.
The Directorate: Human
Settlement Development
monitors the following and
thus has data on:
• Sustainable and
integrated social
housing
environments;
• Settlement upgrading
and development;
• Sustainable
settlement post land
restitution;
• Emergency housing
provision;
• Spending on
programmes; and
• Management of
informal settlements.
The Directorate: Planning
and Research monitors
the following:
• The implementation
of the departmental
housing plan.

Page 42 of 55 Department of the Premier in collaboration with SALDRU
The viability and
implementation of sectoral
housing plans of
municipalities.
Housing Project
Administration
The Directorate: Housing
Project Admin monitors
the following:
• Housing project
administration,
applications and
approvals.
• Provincial housing
subsidy
administration,
applications and
approvals.
Delivery of housing and
subsidy opportunities in
terms of budget allocation.
HSS (Housing
Subsidy System)
The Directorate: Project
Management Services uses
the HSS database to indicate
and track progress and
implementation of housing
projects/programmes and
maintenance of Housing
Board properties in the
Western Cape. The
information is collected for
reporting purposes on the
physical standard, quality
and maintenance of housing
projects.
The information is
collected by engineers
and inspectors of the
department and the
developers (municipalities
and private developers).
Provincial engineers and
inspectors verify
information provided by
the developers before a
payment is made.
Progress of projects is
tracked continuously and
information is available
per project. The following
is monitored:
• Municipalities’
performance with
progress and
implementation of
housing products.
• Maintenance of
Housing Board
Continuous

Page 43 of 55 Department of the Premier in collaboration with SALDRU
properties.
Engineers and inspectors,
according to the housing
code, minimum standards
and regulations, monitor
the above through regular
inspections and
evaluation.
The HSS is also utilised
by the Directorate: Service
Delivery and Community
Empowerment and
monitors the following:
• Management and
implementation of the
PHP projects.
• Economic
empowerment of
communities and
emerging
contractors.
• Capacity building
programmes for
municipalities, NGO’s
and communities.
PHP (Peoples
Housing Project)
Information on the PHP is
collected for the following
reasons:
• Annual report
• Ministerial inquiries
• Parliamentary questions
• Human Rights Report
Information on EPWP must
be submitted on a monthly
basis to the Department of
Public Works and Transport
and capacity building
information is provided on a
bi-monthly basis to the
National Department of
Housing and for input into
the Annual Report of the
Department.
The Directorate: Service
Delivery and Community
Empowerment collects the
following information:
• Progress on the PHP
projects.
• Reporting on the
EPWP.
• Information on
training courses
provided.
Continuous

Page 44 of 55 Department of the Premier in collaboration with SALDRU
9. Department of the Premier
Table 9: Data Sources in the Department of the Premier
Data
Source
Purpose Type/Description of
Data
Year
Tenure
Sample
Size
Situational
Analysis
Report (Skills
Development)
A situational
analysis of skills
development in the
Western Cape.
Provide data to be
used in
development of
skills strategy for
the Western Cape
Considers the supply side of
the economy and skills
initiatives embarked on by
the public sector, Also offers
recommendations on way
forward
- Labour force
- Employment
- Skills
- Quantitative
data
2007 Once off Main stream
household
data
(including
census)
National Skills
Fund Report
(Skills
Development)
Report on progress
of NSF projects for
the Department of
Labour
Report that outlines
expenditure on NSF
projects
- Cost and
beneficiary
comparison
2007/2008 Quarterly 5 training
skills
programmes
Area managers
report
(Social
Transformation
Programme)
Determine status
quo of intermediary
structure
Address problems
and challenges
within communities
Successes
Upcoming
dates/events
Commitments of
policy/administrative
champions
Reports
Qualitative data
2007 Should be
quarterly but
not
institutionalised
as yet
21 areas
Jamboree
reports
(Social
Transformation
Programme)
Quantitative data
Headcounts Jamborees per
delivered services in 21
areas
Annually / per 21
areas
2007/08 21 areas

Page 45 of 55 Department of the Premier in collaboration with SALDRU
Intermediary
structure
contact details
(Social
Transformation
Programme)
To ensure proper
communication
between
Government and
communities, foster
participation
Currently 15
areas / to be
21 areas
Pre-Imbizo
Reports for the
21 priority
areas
Briefing notes to
political principals
Document outlines
demographics, population,
achievements and
challenges, as well as future
plans for each line
department for each of the
21 priority areas
April, and
October
2006April, June
(Deputy
President Visit),
July 2007
(Presidential
Imbizo);
November 2007;
April and 2008
Imbizo
2 per year –
depending on
Presidential
Imbizo 2 per
year
21 priority
areas
High Level
Imbizo Report
Final findings report
to PTM and Cabinet
Document outlines all key
issues raised at every
Imbizo within the 21 priority
areas. Document also
highlights impact
assessment based on the
Imbizo held in April 2006
April and October
2006
Presidential
Imbizo (July
2007) and April
2008
2 per year after
each Imbizo
1 Presidential
High Level
Report
Cluster Report
Cards
Progress Reports
on Provincial
Programme of
Action (PPOA) to
the National
Programme of
Action (NPOA)
Progress Report on PPOA
aligned to the NPOA to
FOSAD and PCC
2004, 2005, 2006
and 2007
Bi-annually
Pre-Imbizo
Reports for the
21 priority
areas
Briefing notes to
political principals
Document outlines
demographics, population,
achievements and
challenges, as well as future
plans for each line
department for each of the
21 priority areas
April, and
October 2006,
April, June 2007
(Deputy
President Visit),
July
2007(Presidential
Imbizo); and April
November 2007;
April 2008 and
Imbizo
2 per year –
depending on
Presidential
Imbizo 2 per
year
21 priority
areas
Provincial
Imbizo
Progress Reports
on Issues raised
Document highlights
progress made and issues
2006 – 2008 Quarterly
Progress report
27 priority
areas and

Page 46 of 55 Department of the Premier in collaboration with SALDRU
Information
Management
System
during Provincial
Izimbizo
resolved based on key
issues raised
other areas as
decided upon
by Provincial
Cabinet within
the Western
Cape
Province
End of Year
Report
Report is written in
preparation of the
State of the Nation
Address and
January Cabinet
Lekgotla for the
next year as per
input on behalf of
the Western Cape
Provincial
Government
Document highlights
progress on behalf of the
Western Cape Provincial
Government, based on the
priorities as out in the State
of the Nation Address, as
well as agreed upon at the
January Cabinet Lekgotla
2004 – 2007 and
November 2008
Annually, plus
final Hand over
report for 2008
State of the
Province
Address
Deliverables
Progress and
evaluative
assessment on the
State of the
Province Address
made by the
Premier
Document highlights
progress on behalf of the
Western Cape Provincial
Government, based on the
priorities as set out in the
State of the Province
Address
2008 Quarterly
progress
reports and Bi-
annual
assessments
PGWC
Cabinet
Deliverables
Progress and
evaluative
assessment on
Cabinet
Deliverables
Document highlights
progress on behalf of the
Western Cape Provincial
Government, based on the
priorities as identified by the
Provincial Cabinet for
service delivery
implementation
2008 Quarterly
progress
reports and Bi-
annual
assessment
PGWC

Page 47 of 55 Department of the Premier in collaboration with SALDRU
10. Department of Social Development
Table 10: Data Sources in the Department of Social Development
Data Source Purpose Type/Description of Data Year
Tenure
Sample Size
[Network Drive
based/Database]
Harbouring data in
the form of
Monitoring,
assessment,
analysis and global
reports on district
offices and facilities
respectively
Type of data stored:
• Assessment and analysis
reports on District Office based
on the Organisational Capacity
Assessment Tool.
• Monitoring of district offices
based on the monitoring tool to
be emended to fit the 8
programmatic approach of
Social Development.
• Global Reports: Towards
understanding the global
regional picture as emanated
from the assessment reports.
*OCAT Tool focuses on the
following elements:
• Governance
• Management Practices
• Human Resource Management
• Financial Management
• Service Delivery – Integration
and Sustainable Service
Delivery
2003 - 2007 Quarterly Assessment,
Analysis Report,
Global Reports:
800 funded
organisations
and 16 District
Offices
assessed.
Assessment of
remaining services
to children
An assessment of services rendered
to children via children homes and
other safe havens
Periodic
assessments
Quarterly All 16 district
offices.
Process
concluded
Development and
subsequent
implementation of M
and E strategy.
To be reviewed in
2008.
Review
process
2008
The development
and subsequent
implementation of
the monitoring tool
focusing on
2007 3 yearly
monitoring
process
Offices
Monitored:
Vredendal
Caledon,
Paarl and

Page 48 of 55 Department of the Premier in collaboration with SALDRU
assessing
governance,
management and
service delivery
practices in district
offices.
Atlantis District
Offices
2 Bosasa
Facilities.
Harboring data in
the form of
Monitoring,
assessment,
analysis and global
reports on district
offices and facilities
respectively
Assessment and analysis reports on
District Office based on the
Organisational Capacity
Assessment Tool. OCAT Tool
focuses on the following elements:
• Governance
• Management Practices
• Human Resource Management
• Financial Management
• Service Delivery – Integration
and Sustainable Service
Delivery
Assessment of
remaining services
to children
Rapid Responses
Interventions- crisis
nature interventions.
Participation in a multi- disciplinary
team with line managers
Repositioning of
M&E.
Provide support and
Capacity Building to
District Offices
Decentralisation of Assessment and
monitoring function for funded
organizations to district Offices
Compliance
monitoring of non-
compliant
organisations as
indicated by the
Directorate
Partnership Support
and Fund
47 Organisations
The development
and subsequent
implementation of
the monitoring tool
focusing on
monitoring the
Provision of support to 16 District
Offices to monitor the TPAs
depending on the readiness
(Activation of payments) of the
TPAs from the Directorate
Partnership Support and Funding-
1
November
2008

Page 49 of 55 Department of the Premier in collaboration with SALDRU
Transfer Payment
Agreement (TPA).
Finalisation of the process in
October.
11. Department of Provincial Treasury
Table 11: Data Sources in the Department of Provincial Treasury
Data Source
Purpose
Type/Description of data
Year
Tenure
Sample size
Budget overview [up
to 2002 compiled
with Estimates of
Provincial
Expenditure (EPE)
and Local
Government
allocations (LGA)]
Overview of the
Budget
Financial and non-financial data
2002
Annually
PGWC
Estimates of
Provincial
Expenditure (EPE)
Statement of
budgets per vote
Financial and non-financial data
2005
Annually
PGWC
Local Government
allocations (LGA)
Convey allocation
from departments to
municipalities
Allocations to municipalities and
the conditions linked thereto
2006
Annually
PGWC and
municipalities
Provincial Economic
Review and Outlook
(PERO)
Review of the
current socio-
economic situation
of the Western
Cape and three-
year outlook
Macro-economic review and
forecast for the Western Cape
economy including labour
market, demographic trends and
poverty analysis
2006 - 2011
Annually
PGWC
(Western
Cape
boundaries)
Socio-economic
profiles
To provide a socio-
economic profile per
municipality, district
and the CoCT
Various economic and related
information per district and the
CoCT
2006/2007
Annually
PGWC and all
30
municipalities
Western Cape
Medium-Term
Budget Policy
Statement
(precursor to the
Western Cape
Fiscal Policy 2001 –
2003)
Set out medium-
term policies and
provincial revenue
sources for the
following medium-
term expenditure
framework (MTEF)
Policy and financial data
2004
Annually
PGWC and
the public

Page 50 of 55 Department of the Premier in collaboration with SALDRU
Revised estimates
of provincial
expenditure
Revision to
statements of
budgets per vote
Financial
Old
Annually
PGWC
departments
and public
and trading
entities
Consolidated
financial statement
Consolidated
financial
performance and
position of the
PGWC
departments/entities
Financial statements
2006/07
annually
PGWC
departments
and public
and trading
entitities
Financial
Governance and
Review and Outlook
Review of financial
governance
Financial management capability
assessments
2006/07
annually
PGWC
departments
and public
and trading
entitities

Page 51 of 55 Department of the Premier in collaboration with SALDRU
12. Department of Public Works and Transport Table 12: Data Sources in the Department of Public Works and Transport
Data Source
Purpose
Type/Description of
Data
Year
Tenure
Sample Size
RPM – Rational
Portfolio
Management
System
This system aligns all
departmental programmes
and projects with the
strategic outcomes of the
PGDS
Qualitative &
quantitative
2006 to
current
Ongoing
500 projects
Livelink
Enterprise Content
Management of all
correspondence and
archival data
Qualitative &
quantitative
2006 to
current
Daily
The ME Feedback
info collated by
Treasury for the
Quarterly
Performance
Measures per
Directorate’
This system seeks to
provide review info wrt
Quarterly reporting and
benchmarking
Qualitative
Current
Quarterly
Each
directorate
DTims
To improve decision
making on network
planning and budgeting
priorisation
Qualitative &
quantitative
2003 to
current
Ongoing
Entire
Provincial
roads network
RNIS
To provide project-specific information such as cash flows, project status, road attributes and performance deliverables
Qualitative & quantitative
Ongoing
Ongoing
N/a
Data base on
Engineers in
Training
To collate info on
demographic, training,
personal development and
Qualitative &
quantitative
Ongoing
Annual
Around 10
persons per
annum

Page 52 of 55 Department of the Premier in collaboration with SALDRU
Data Source
Purpose
Type/Description of
Data
Year
Tenure
Sample Size
projects pertaining to new
engineers in the Dept
Livelink for Roads
Planning
To provide workflow
information that can be
monitored and queried for
project monitoring and
future planning purposes
Qualitative &
quantitative
2007 to
current
Ongoing/daily
Around 100
applications
per annum
EPWP Quarterly
Report
To collate data regarding
EPWP projects all over
the Western Cape
Qualitative &
quantitative
2004 to
current
Quarterly
Site Visits
To do M&E on sites
checking whether sites are
EPWP Compliant or
whether proper training is
being done on the sites
Qualitative &
quantitative
Bi-weekly
Umsebenzi
Opportunities Portal
To register unemployed
and attempt to match skills
to work opportunities
Qualitative &
quantitative
2007 to
current
Daily
EPWP Sector/
Provincial Reports
Serves as input to work
opportunities of the Portal
Qualitative &
quantitative
2004 to
current
Daily

Page 53 of 55 Department of the Premier in collaboration with SALDRU
3. ConclusionConclusionConclusionConclusion
Tables one (1) to twelve (12) reflect the current provincial administrative data sources (manual and
automated) residing in the twelve (12) provincial government departments as at 31 March 2009. The
automated Management Information Systems such as the Central Education Management Information
System (CEMIS), Public Access Library System (PALS), the Integrated Pollution and Waste Information
System (IPWIS), the Housing Subsidy System (HSS) and others are key components for the proposed
PWMES automated system as these systems would constitute a fair portion of the data needed to
measure progress pertaining to the PSP. It is essential to note that the provincial administrative data
reflected in the tables are still relatively raw and has not yet been subjected to quality assessments and
that this will be a focal point in the 2009/2010 financial year.

Page 54 of 55 Department of the Premier in collaboration with SALDRU
4. RecommendationsRecommendationsRecommendationsRecommendations
1. Within the context of the PWMES, the Chief Directorate: Monitoring, Evaluation and Review will
embark on a process whereby provincial government departments will be worked with and
showcased in an attempt to enhance quality standards of the provincial administrative data. The
process will follow a staggered approach over the medium term period; the Departments of
Agriculture, Education and Community Safety will be focused on during the next financial year i.e.
2010/2011 whilst the remaining departments will be worked with and showcased over the following
two years i.e. 2011/2012 and 2013/2014.
2. A Data Assessment Report Card will be compiled for each of the provincial departments that will
indicate progress in the data quality of the provincial administrative data over the medium term
period.
3. The Data Assessment and improvement process should progressively be formalized in order to
promote buy-in amongst the individual provincial government departments.

Page 55 of 55 Department of the Premier in collaboration with SALDRU
ISBN: 978-0-621-39161-9