corals of opportunity as a restoration tool
TRANSCRIPT

0
P
CORALS OF OPPORTUNITY AS A
RESTORATION TOOL
Prepared by: Anne Chung, Jessica Hintzsche University of Hawaii, Hawaii Coral Reef Initiative
Monitoring Manual

1
Contents Introduction ..................................................................................................................................... 2
Monitoring Plan .............................................................................................................................. 2
Monitoring in Kaneohe Bay ........................................................................................................ 2
Monitoring in the HIMB Coral Nursery ..................................................................................... 2
Monitoring Schedule ....................................................................................................................... 4
Monitoring Supply List ................................................................................................................... 4
Monitoring Protocol for Kaneohe Bay ........................................................................................... 6
Benthic Monitoring ..................................................................................................................... 7
Growth and Survivorship Monitoring ......................................................................................... 8
Monitoring Protocol the HIMB Nursery ......................................................................................... 8
Growth and Survivorship Monitoring ......................................................................................... 9
Environmental Monitoring ........................................................................................................ 12
Water Motion ......................................................................................................................... 12
Temperature ........................................................................................................................... 13
Sedimentation ........................................................................................................................ 13
Appendix ....................................................................................................................................... 15

2
Introduction Coral reefs in Hawaii are suffering the consequences of damaging local-level stressors including invasive species, land-based pollution, irresponsible fishing practices, storm events, and ship groundings. In Kaneohe Bay, the Division of Aquatic Resources (DAR) has been restoring coral reefs affected by invasive species by ‘cleaning’ the reef and removing algae, however there is no ability to directly enhance the reef’s recovery. DAR expressed the urgent need to expand the restoration toolkit by investigating a novel method of using corals of opportunity. Corals of opportunity are fragments of coral that have been dislodged or unattached from the substrate, in this case, because of boat strikes. The ‘Corals of Opportunity’ project has two main goals: rescue coral fragments that have been mechanically fractured by boats strikes in Kaneohe Bay, and provide a seed stock to restore reefs that may need coral transplants to maintain biodiversity and provide habitat for reef organisms. The project accomplishes these goals by re-attaching two species (Montipora capitata and Porites compressa) coral fragments within boat strike scars and establishing an in-situ (in-water) coral nursery with dislodged boat strike corals at the Hawaii Institute of Marine Biology (HIMB). The central questions of this pilot project are 1) do dislodged fragments within boat strike scars have higher mortality than reattached fragments? 2) how does the benthic composition of the boat scar change over time? 3) how do growth and survivorship vary at the HIMB nursery sites? and 4) how are these metrics affected by environmental differences? This monitoring manual provides instructions that assist in answering these questions.
Monitoring Plan At the beginning of the project, standardized monitoring protocols were established. These protocols measure specific metrics that will ultimately answer the central questions of the project. The protocols are split between the physical location of these activities – either on the Kaneohe Bay patch reefs or in the HIMB nursery
Monitoring in Kaneohe Bay Question 1: Do dislodged fragments within boat strike scars have higher mortality than reattached fragments?
Monitoring Protocols:
• Measure the growth and survivorship of coral fragments in two experimental treatments: 1) tagged coral fragments reattached to the substrate of the boat strike scar, 2) tagged coral fragments left unattached in the scar.
Analysis:
• Compare the growth and survivorship between the study species and treatments over time.
Monitoring in the HIMB Coral Nursery
Question 2: How does the benthic composition of the boat scar change over time?

3
Monitoring Protocols:
• Take benthic quadrat photos of three experimental treatment plots: 1) quadrat with reattached corals, 2) quadrat with loose fragments, and 3) quadrat cleared of all fragments.
Analysis:
• Compare benthic composition of the quadrat images over time.
Question 3: How do growth and survivorship vary at the HIMB nursery sites?
Monitoring Protocols:
• Track growth (ecological volume and radial growth) and survivorship over time at three HIMB nursery sites.
Analysis:
• Compare growth and survivorship between the study species and nursery sites over time.
Question 4: How are these metrics affected by environmental differences?
Monitoring Protocols:
• Measure environmental variables (water motion, temperature, sedimentation) at the nursery sites.
Analysis:
• Compare environmental variables between nursery sites.
• Compare relationship between environmental variables, study species, and nursery sites.

4
Monitoring Schedule A monitoring schedule was created to guide the measuring of the project metrics. Protocols for questions 1 and 2 have been implemented on a quarterly basis beginning at the end of January 2017. Question 3 protocols were implemented bi-weekly from January – May 2017 and will be implemented monthly between June – August 2017. The three components of Question 4 had varying timelines. Temperature loggers were deployed from January – May 2017, data was downloaded, then loggers were redeployed from May – August 2017. Water motion was collected through a 24-hour trial in April 2017 and again in July 2017. Sedimentation traps were deployed in January – April 2017, samples were analyzed, and traps were redeployed May – August 2017. Data management and analysis occurs periodically throughout the project period. August – October 2017 is when the final data analysis, graph preparation, and report writing will occur. The project is scheduled to end September, 30 2017. See full monitoring schedule on Page 5.
Monitoring Supply List These supplies listed below are needed for each round of monitoring. The datasheets can be found in Appendix A. Kaneohe Bay Monitoring:
1. Snorkelers (3) 2. GPS with boat scar locations 3. Digital camera 4. Benthic photo quadrat camera mount (1) 5. Clipboards (2) 6. Pencils (2) + extra 7. Datasheets 8. Dive flags 9. Rulers (2)
HIMB Nursery Monitoring: Ecological Volume
1. Snorkelers (2) 2. Clipboards (2) 3. Pencils (2) 4. Datasheets
Radial Growth
1. Rulers 2. Digital camera
3. ImageJ software 4. Laptop

5
Environmental Monitoring: Water motion
• Muus Balls (see section for replicate recommendations)
• Buckets (see section for replicate recommendations)
• Permanent marker
• Electronic balance
• Spool of fishing line
• Scissors
• Colored cable ties (if desired)
Water temperature
• HOBO Pendant® Temperature/Light 64K Data Loggers and their PVC housings
• Small cable ties/ wire
• Large cable ties
• 1Scissors
• Hobo Data reader
• laptop
• Paper towels
• Pencils

5
Monitoring Schedule:
Jan 2-
Jan Feb 2-
Feb Mar 2-
Mar Apr 2-
Apr May 2-
May Jun 2-
Jun Jul 2-
Jul Aug 2-
Aug Sep 2-
Sep 2-Oct
Question 1
End of Project
Measure growth and survivorship of boat scar fragments
Question 2
Take benthic quadrat photos
Question 3
Measure growth and survivorship at nursery sites
Question 4
Measure environmental variables at nursery sites
Temperature
Water motion
Sedimentation Data analysis and report writing

6
Monitoring Protocol for Kaneohe Bay To investigate whether corals of opportunity can be reattached to boat strike scars, the project team identified and mapped eight boat strike scars on five patch reefs in Kaneohe Bay (Figure 1).
Figure 1 Map of Kaneohe Bay patch reefs with recent boat strike scars, where
fragments were reattached, tagged, and collected for the HIMB nursery.
Each boat scar was mapped, meaning the GPS location was documented and its dimensions were measured (Table 1). Three experimental treatments were set up on each scar: fragments reattached to the substrate, tagged fragments left unattached, fragments completely cleared from scar.

7
Table 1GPS start and end points of experimental boat strike scars in Kaneohe Bay.
The first step in the Kaneohe Bay monitoring protocol is to locate and travel to the patch reefs which have boat strike scars. The monitoring team then swims to the GPS location of the beginning of the scar, making sure to mark the starting point with a dive flag. For extra precaution, a second dive flag is placed on the reef edge and a third flown from the boat.
Benthic Monitoring The first snorkeler swims the length of the scar, taking benthic quadrat images of 1) the start point (marked with a red, plastic sheep tag), 2) the re-attached area, 3) the unattached area, 4) the cleared area, and 5) the end point (marked with a tag). The four corners of each experimental treatment area are also marked with tags (Figure 2). It is important to do this step first to capture the benthic images before fragments are potentially moved around.
GPS name Latitude Longitude
R15 T1 START 21.453995 -157.803373
R15 T1 END 21.453808 -157.803260
R16 T2 START 21.454692 -157.804044
R16 T2 END 21.454675 -157.803998
R19 T3 START 21.457810 -157.806941
R19 T3 END 21.457704 -157.806785
R12 T4 START 21.450861 -157.797759
R12 T4 END 21.450780 -157.797747
R20 T5 START 21.460766 -157.809763
R20 T5 END 21.460576 -157.809844
R19 T6 START 21.457612 -157.806875
R19 T6 END 21.457756 -157.806979
R20 T7 START 21.460893 -157.809849
R20 T7 END 21.460855 -157.809817
R20 T8 START 21.460621 -157.809764
R20 T8 END 21.460699 -157.809827
Figure 2 The project team at a boat strike scar displaying the red plastic tags used
to mark the corners of the experimental treatment area
8
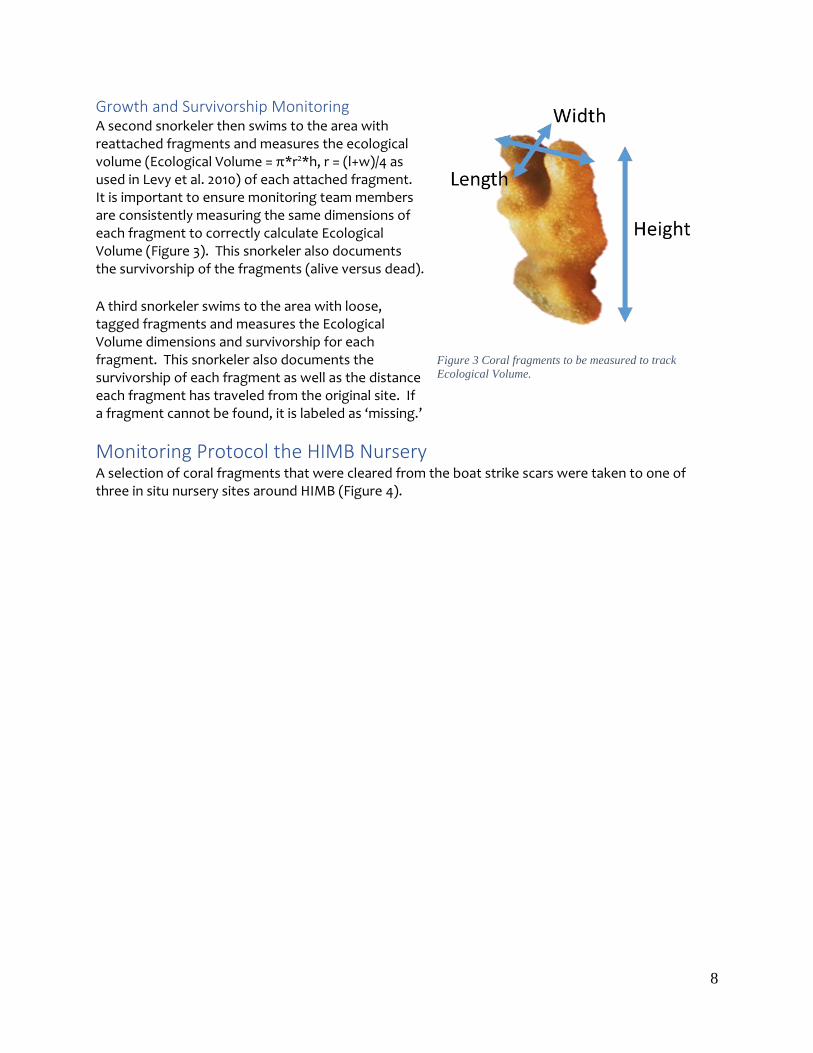
Growth and Survivorship Monitoring A second snorkeler then swims to the area with reattached fragments and measures the ecological volume (Ecological Volume = π*r2*h, r = (l+w)/4 as used in Levy et al. 2010) of each attached fragment. It is important to ensure monitoring team members are consistently measuring the same dimensions of each fragment to correctly calculate Ecological Volume (Figure 3). This snorkeler also documents the survivorship of the fragments (alive versus dead).
A third snorkeler swims to the area with loose, tagged fragments and measures the Ecological Volume dimensions and survivorship for each fragment. This snorkeler also documents the survivorship of each fragment as well as the distance each fragment has traveled from the original site. If a fragment cannot be found, it is labeled as ‘missing.’
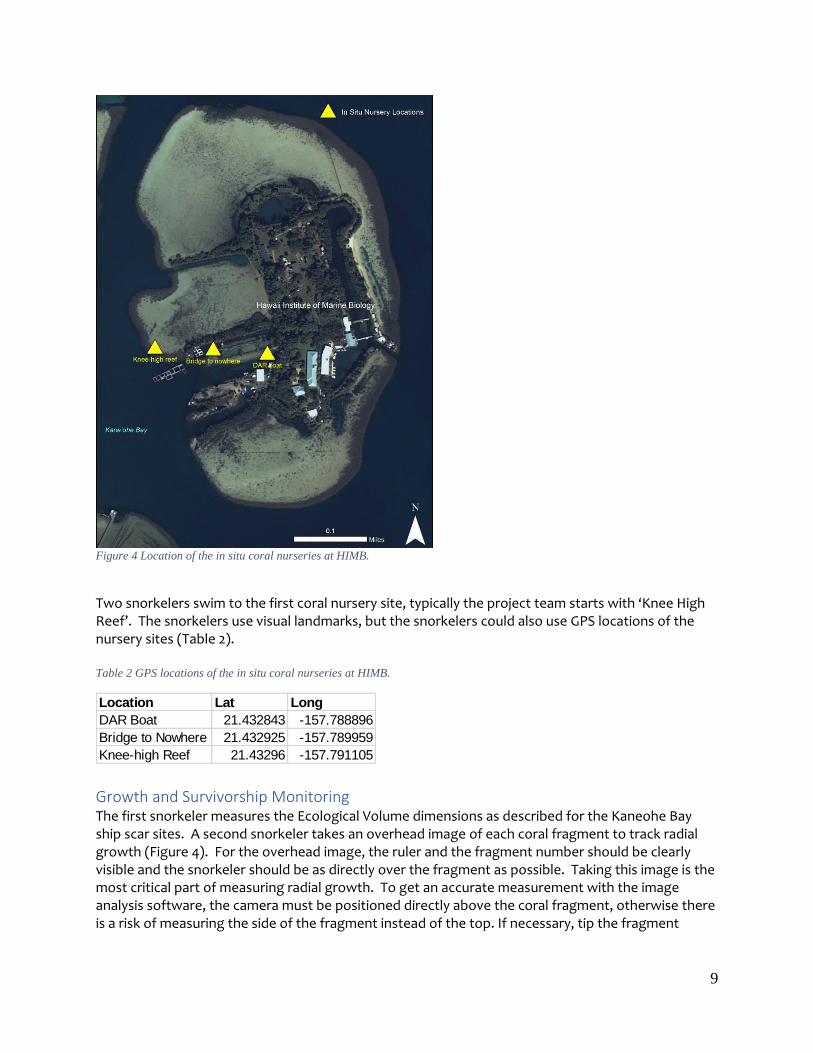
Monitoring Protocol the HIMB Nursery A selection of coral fragments that were cleared from the boat strike scars were taken to one of three in situ nursery sites around HIMB (Figure 4).
Figure 3 Coral fragments to be measured to track
Ecological Volume.
9
Figure 4 Location of the in situ coral nurseries at HIMB.
Two snorkelers swim to the first coral nursery site, typically the project team starts with ‘Knee High Reef’. The snorkelers use visual landmarks, but the snorkelers could also use GPS locations of the nursery sites (Table 2).
Table 2 GPS locations of the in situ coral nurseries at HIMB.
Growth and Survivorship Monitoring The first snorkeler measures the Ecological Volume dimensions as described for the Kaneohe Bay ship scar sites. A second snorkeler takes an overhead image of each coral fragment to track radial growth (Figure 4). For the overhead image, the ruler and the fragment number should be clearly visible and the snorkeler should be as directly over the fragment as possible. Taking this image is the most critical part of measuring radial growth. To get an accurate measurement with the image analysis software, the camera must be positioned directly above the coral fragment, otherwise there is a risk of measuring the side of the fragment instead of the top. If necessary, tip the fragment
Location Lat Long
DAR Boat 21.432843 -157.788896
Bridge to Nowhere 21.432925 -157.789959
Knee-high Reef 21.43296 -157.791105

10
upright if it is leaning to the side. Place the ruler next to the fragment, with the cm side of the ruler and ensure the coral fragment identification tag in the camera frame.
Figure 5 An example of a correct overhead image of a nursery coral fragment being analyzed in ImageJ.
Calculating Radial Growth with ImageJ
To measure the radial or outward growth of the coral fragments in the nursery, the project team uses the image analysis software, ImageJ, to analyze overhead images taken of the coral fragments. The overhead images from the coral nurseries should be uploaded to the team’s GoogleDrive folder. The first step to analyze the images is to open ImageJ. Navigate to File > Open to open the first image (if the rest of the images are in the same folder then the “open next” button will open the subsequent images). Use the line tool (Figure 6a, blue box) to measure out 1 cm on the ruler (Figure 6b). Then select Analyze > Set Scale and change “know distance” to 1 and “unit of length” to cm and click OK. The software now knows the scale of the image. Next, select the Area tool, or what we like to call the “bean tool” (Figure 6a, red box). Trace the outline of the fragment and hit Ctrl + m to get an area measurement (Figure 6c). Then copy and paste this into a spreadsheet. Note: the other results in the measurement box (mean, min, and max) are not used in this analysis.

11
a)
b)
c) Figure 6 Instructions to measure the radial growth of coral nursery images. a) the command box of ImageJ with key features
highlighted, b) an example of setting a scaled centimeter (red arrow), and c) an example of a completed measurement. This
fragment was outlined using the area tool and the area measurement is displayed in the yellow box.

12
Environmental Monitoring This section outlines the methods for monitoring environmental conditions at the HIMB nursery locations. The environmental variables that the project team tracks are water motion, water temperature, and sedimentation.
Water Motion At each nursery site, the project team is tracking the variation in water motion. A Muus ball (pronounced “moose”) is a ball made from plaster of Paris that dissolves at a formulated rate. The dissolving rate of the ball indicates the average water motion of the area while the Muus ball was submerged. Tracking changes in water motion require multiple trials to account for variation over time. The nursery set up requires a total 15 Muus ball to measure water motion. Three balls are deployed at each site in addition to two control balls.
(3 balls x 3 sites) + (2 controls x 3 sites) = 15 Muus balls required
The second step is to take a “before weight”. The balls are measured in grams to a hundredth of a gram. Each ball is assigned an identification number and then the number and the weight are written on the ball with a permanent marker (Figure 6). This will come off once they are submerged for a time so a spreadsheet is also created with each ball’s number and weight. Care should be taken not to chip or scratch the balls after weighing so as to not change the weight.
To deploy the Muus balls, fishing line is attached to suspend them from each nursery table platform. The project team has found that the optimal depth is just low enough where the Muus ball won’t hit against the table but high enough where it won’t touch the sand, cinderblocks and other objects around the table. It is important to make sure the ball won’t swing and hit one of the table’s legs. Additionally, it is essential to document the identification number of the balls after you deploy them. This can be done be either
recording the location of each ball (ex: Muus ball #3 is in the NW corner at site C), or mark the area with a colored cable tie (ex: Muus ball #11 is by pink cable tie at site A).
To set up the controls, each ball is placed in an individual bucket (six buckets total). The buckets are filled with water from the nursery site and then placed in a spot that will remain shaded for the duration of the deployment so the sun doesn’t affect the disintegration rate. Allow a minute or so to allow the water to settle in the bucket before adding the control ball. The identification numbers
Figure 7 Muus balls with identification number and
weights.

13
must also be documented for these control balls as they will no longer be visible at the end of the deployment. The Muus balls should be retrieved after 24 hours of deployment or when the Muus ball loses 30% of its original weight, which ever happens first. The time that each ball (both experimental and control) was submerged and when each ball was retrieved should be noted. In the first trial of this protocol the water remained relatively calm for the deployment period and 24 hours was sufficient. If there is large tidal difference or there is high wave action, they should be removed sooner*.
Once the Muus balls have been retrieved, they should be reweighed to calculate the mass difference. Average the mass loss from the balls from a site and subtract the average mass loss from the controls of that site. This will caculate ithe mass lost from the motion of the water. *It’s always better to remove them sooner rather than later. If the balls lose more than 30% of their mass, the measurement becomes less accurate and they can break apart and completely wash away.
Temperature In the nurseries, the project team uses HOBO Pendant® Temperature/Light 64K Data Loggers. Each logger is placed in a small, PVC pipe to prevent sunlight from interfering with the temperature readings. Three loggers are deployed at each of the three nursery tables. Each logger with the PVC housing is attached to the platform of the tables, at the same level of the coral fragments. This guarantees that the loggers will be measuring the water temperature that the corals are experiencing. To retrieve the data loggers, the cable ties are cut which secure the PVC housings to the table. It is recommended that the temperature logger is left in its PVC housing so that it can be marked with the nursery location with a pencil. Once retrieved, the data needs to be downloaded from the loggers using HOBOware, which can be downloaded for free from Onset. One at a time, take the loggers out of the casing and clean it off the best you can using a paper towel. Plug it in to the data port and stop the logger (ctrl + k). Once the data logger is stopped, select the “readout” tool (or ctrl + r) and download the information. Download the data onto a flash drive or laptop. Once the data is saved it will open a plot setup window. The only thing that should be selected is Temperature (in ˚C) and make sure the time zone is set to HST. Once this is all set, select “plot” and then save this data to your flash drive. To redeploy the data loggers, make sure the data logger is turned back on (launch device). To redeploy the data loggers, a new start time needs to be set. The project team typically sets the same start time for each logger and chooses a time the day after deployment. In the past, the start time has been set for the midnight following redeployment. Each logger is activated with the correct settings and returned to the its original housing unit. The logger is reattached to the PVC housing, with wire or small cable ties, and then placed in its original location. Once the loggers are secured, the monitoring team should continuously check them each time
Sedimentation To monitor sediment, sediment traps have been installed on each of the tables. The sediment traps this project are using are PVC pipes cable tied to each nursery table.

14
To retrieve the sediment traps, the cable ties are cut and the trap full of sediment is carefully lifted out of the water and capped off with a PVC cap. Once the traps are sealed, they are labeled with the nursery location in pencil so the samples can be tracked. Also check to see if a crab or a small goby is in the trap. Don’t attempt to free the animal in the water as you could lose sediment, wait to release the animals after the sediment has been collected. The project team partnered with the Jokiel Lab and Kuulei Rodgers to process our sediment samples. Be sure to consult with this lab before beginning to process sediment samples. To measure the sediment samples, first weigh dry, empty filter papers to get a “before” measurement. Write the before weight and the sediment trap ID on a datasheet. Empty the contents of the sediment trap onto a piece of filter paper (one trap per paper). Use a squeeze bottle filled with filtered sea water to flush out any remaining sediment. If there is an animal inside the trap, rinse the sediment off it and return it the ocean. Once the sediment is completely washed out of all the traps, place the filter papers on a tray and put it in the drying oven for approximately six hours. If the samples are left overnight, make sure to consult with someone at the Jokiel Lab so they can shut off the oven before they leave for the day. After the sediment is completely dry, weigh the paper with the sediment. Subtract the weight of the paper from the total weight to get the sediment weight. This is the total sediment precipitation. To get the monthly/ weekly average, divide the total weight by the duration of deployment (for example 2 g sediment/ 4 months = 0.5 g of sediment precipitation a month). The sediment traps are redeployed simply by reattaching the open traps to the nursery tables using cable ties.

15
Appendix Appendix A. Monitoring datasheets 1. Kaneohe Bay Fragment Datasheet
Name: Date:
Frag ID Transect # Reef # Treatment Tag # Species (MC, PC) Length (cm) Width (cm) Height (cm) Survivorship (A/D) Attachment (L, A, F, A/F) Location (cm from scar)
19 1 15 epoxy 18 PC
20 1 15 epoxy 23 PC
21 1 15 epoxy 22 PC
22 1 15 epoxy 20 PC
23 1 15 epoxy 21 PC
24 1 15 epoxy 19 PC
25 1 15 loose 24 PC
26 1 15 loose 25 PC
27 1 15 loose 26 PC
28 1 15 loose 27 PC
29 1 15 loose 28 PC
30 1 15 loose 29 MC
37 2 16 epoxy 30 PC
38 2 16 epoxy 31 PC
39 2 16 epoxy 32 PC
40 2 16 epoxy 33 PC
41 2 16 epoxy 34 PC
42 2 16 epoxy 35 PC
43 2 16 loose 41 MC
44 2 16 loose 40 MC
45 2 16 loose 37 PC
46 2 16 loose 36 PC
47 2 16 loose 38 PC
48 2 16 loose 39 MC
55 3 19 epoxy 44 PC
56 3 19 epoxy 45 PC
57 3 19 epoxy 42 PC
58 3 19 epoxy 43 PC
59 3 19 epoxy 46 PC
60 3 19 epoxy 47 PC
61 3 19 loose 49 PC
62 3 19 loose 128 PC
63 3 19 loose 50 PC
64 3 19 loose 127 PC
65 3 19 loose 48 PC
66 3 19 loose 126 PC
73 4 12 epoxy 72 MC
74 4 12 epoxy 74 MC
75 4 12 epoxy 69 MC
76 4 12 epoxy 70 MC
77 4 12 epoxy 71 MC
78 4 12 epoxy 73 MC
79 4 12 loose 133 PC
80 4 12 loose 135 PC
81 4 12 loose 134 MC
82 4 12 loose 130 MC
83 4 12 loose 129 MC
84 4 12 loose 131 PC
91 5 20 epoxy 138 PC
92 5 20 epoxy 136 PC
Name: Date:
Frag ID Transect # Reef # Treatment Tag # Species (MC, PC) Length (cm) Width (cm) Height (cm) Survivorship (A/D) Attachment (L, A, F, A/F) Location (cm from scar)
93 5 20 epoxy 75 PC
94 5 20 epoxy 139 PC
95 5 20 epoxy 132 PC
96 5 20 epoxy 137 MC
97 5 20 loose 96 PC
98 5 20 loose 98 PC
99 5 20 loose 97 PC
100 5 20 loose 99 PC
101 5 20 loose 100 PC
102 5 20 loose 95 PC
109 6 19 epoxy 90 PC
110 6 19 epoxy 89 PC
111 6 19 epoxy 83 PC
112 6 19 epoxy 82 PC
113 6 19 epoxy 85 PC
114 6 19 epoxy 84 PC
115 6 19 loose 80 PC
116 6 19 loose 79 PC
117 6 19 loose 77 PC
118 6 19 loose 78 PC
119 6 19 loose 76 PC
120 6 19 loose 81 PC
127 7 20 epoxy 102 PC
128 7 20 epoxy 104 PC
129 7 20 epoxy 110 PC
130 7 20 epoxy 105 PC
131 7 20 epoxy 101 PC
132 7 20 epoxy 103 PC
133 7 20 loose 108 PC
134 7 20 loose 111 PC
135 7 20 loose 106 PC
136 7 20 loose 112 PC
137 7 20 loose 107 PC
138 7 20 loose 109 PC
145 8 20 epoxy 122 PC
146 8 20 epoxy 123 PC
147 8 20 epoxy 124 PC
148 8 20 epoxy 120 PC
145 8 20 epoxy 119 PC
146 8 20 epoxy 121 PC
147 8 20 loose 114 PC
148 8 20 loose 117 PC
145 8 20 loose 116 PC
146 8 20 loose 113 MC
147 8 20 loose 115 MC
148 8 20 loose 118 MC
LOOSE FRAGMENTS ONLY
Notes
LOOSE FRAGMENTS ONLY
Notes

16
2. HIMB Nursery Fragment Datasheet
Name: Date:
Frag ID Tag # Species (MC, PC) Length (cm) Width (cm) Height (cm) Survivorship (A/D) Nursery Location (DB, B, KH)
1
2
3
4
5
6
7
8
9
10
11
12
13
14
15
16
17
18
19
20
21
22
23
24
25
26
27
28
29
30
31
32
33
34
35
36
37
38
39
40
41
42
43
44
45
46
47
48
49
50
Notes